
A Phenology-Based Evaluation of the Optimal Proxy for Cropland Suitability Based on Crop Yield Correlations from Sentinel-2 Image Time-Series


Abstract
1. Introduction
2. Materials and Methods
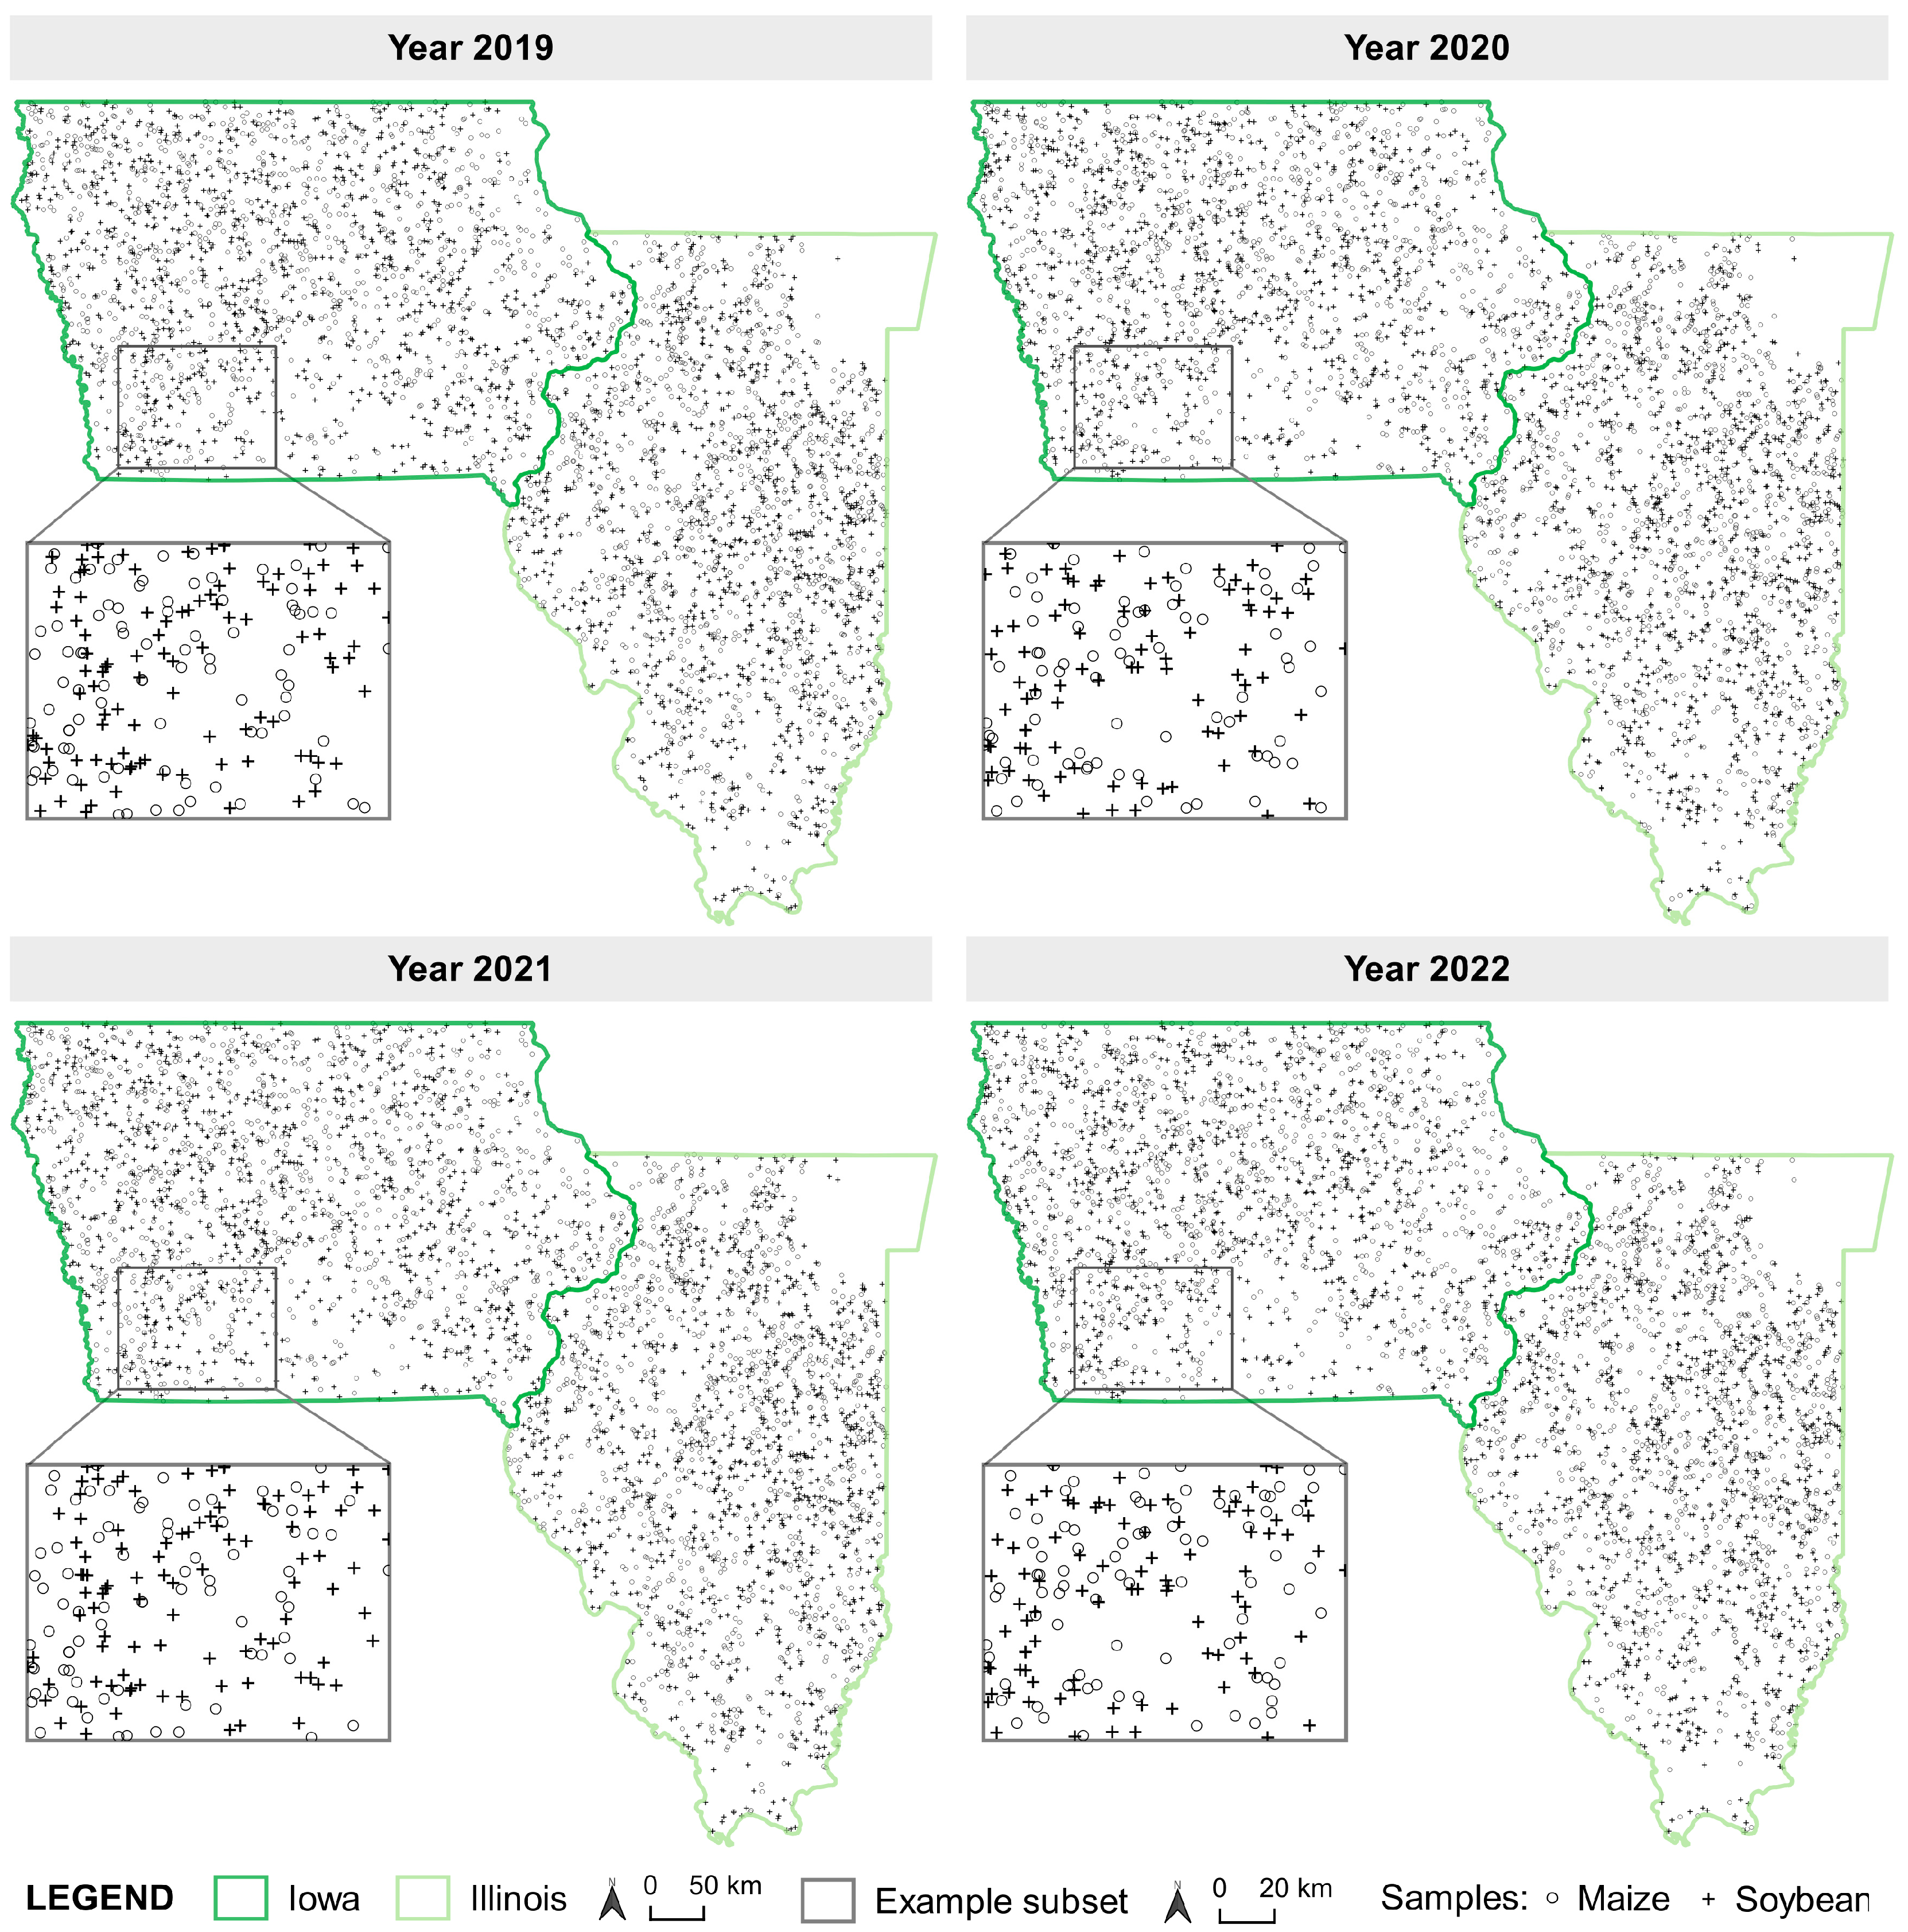
2.1. Study Area and Ground-Truth Crop Yield Data
2.2. Calculation of Vegetation Iindices
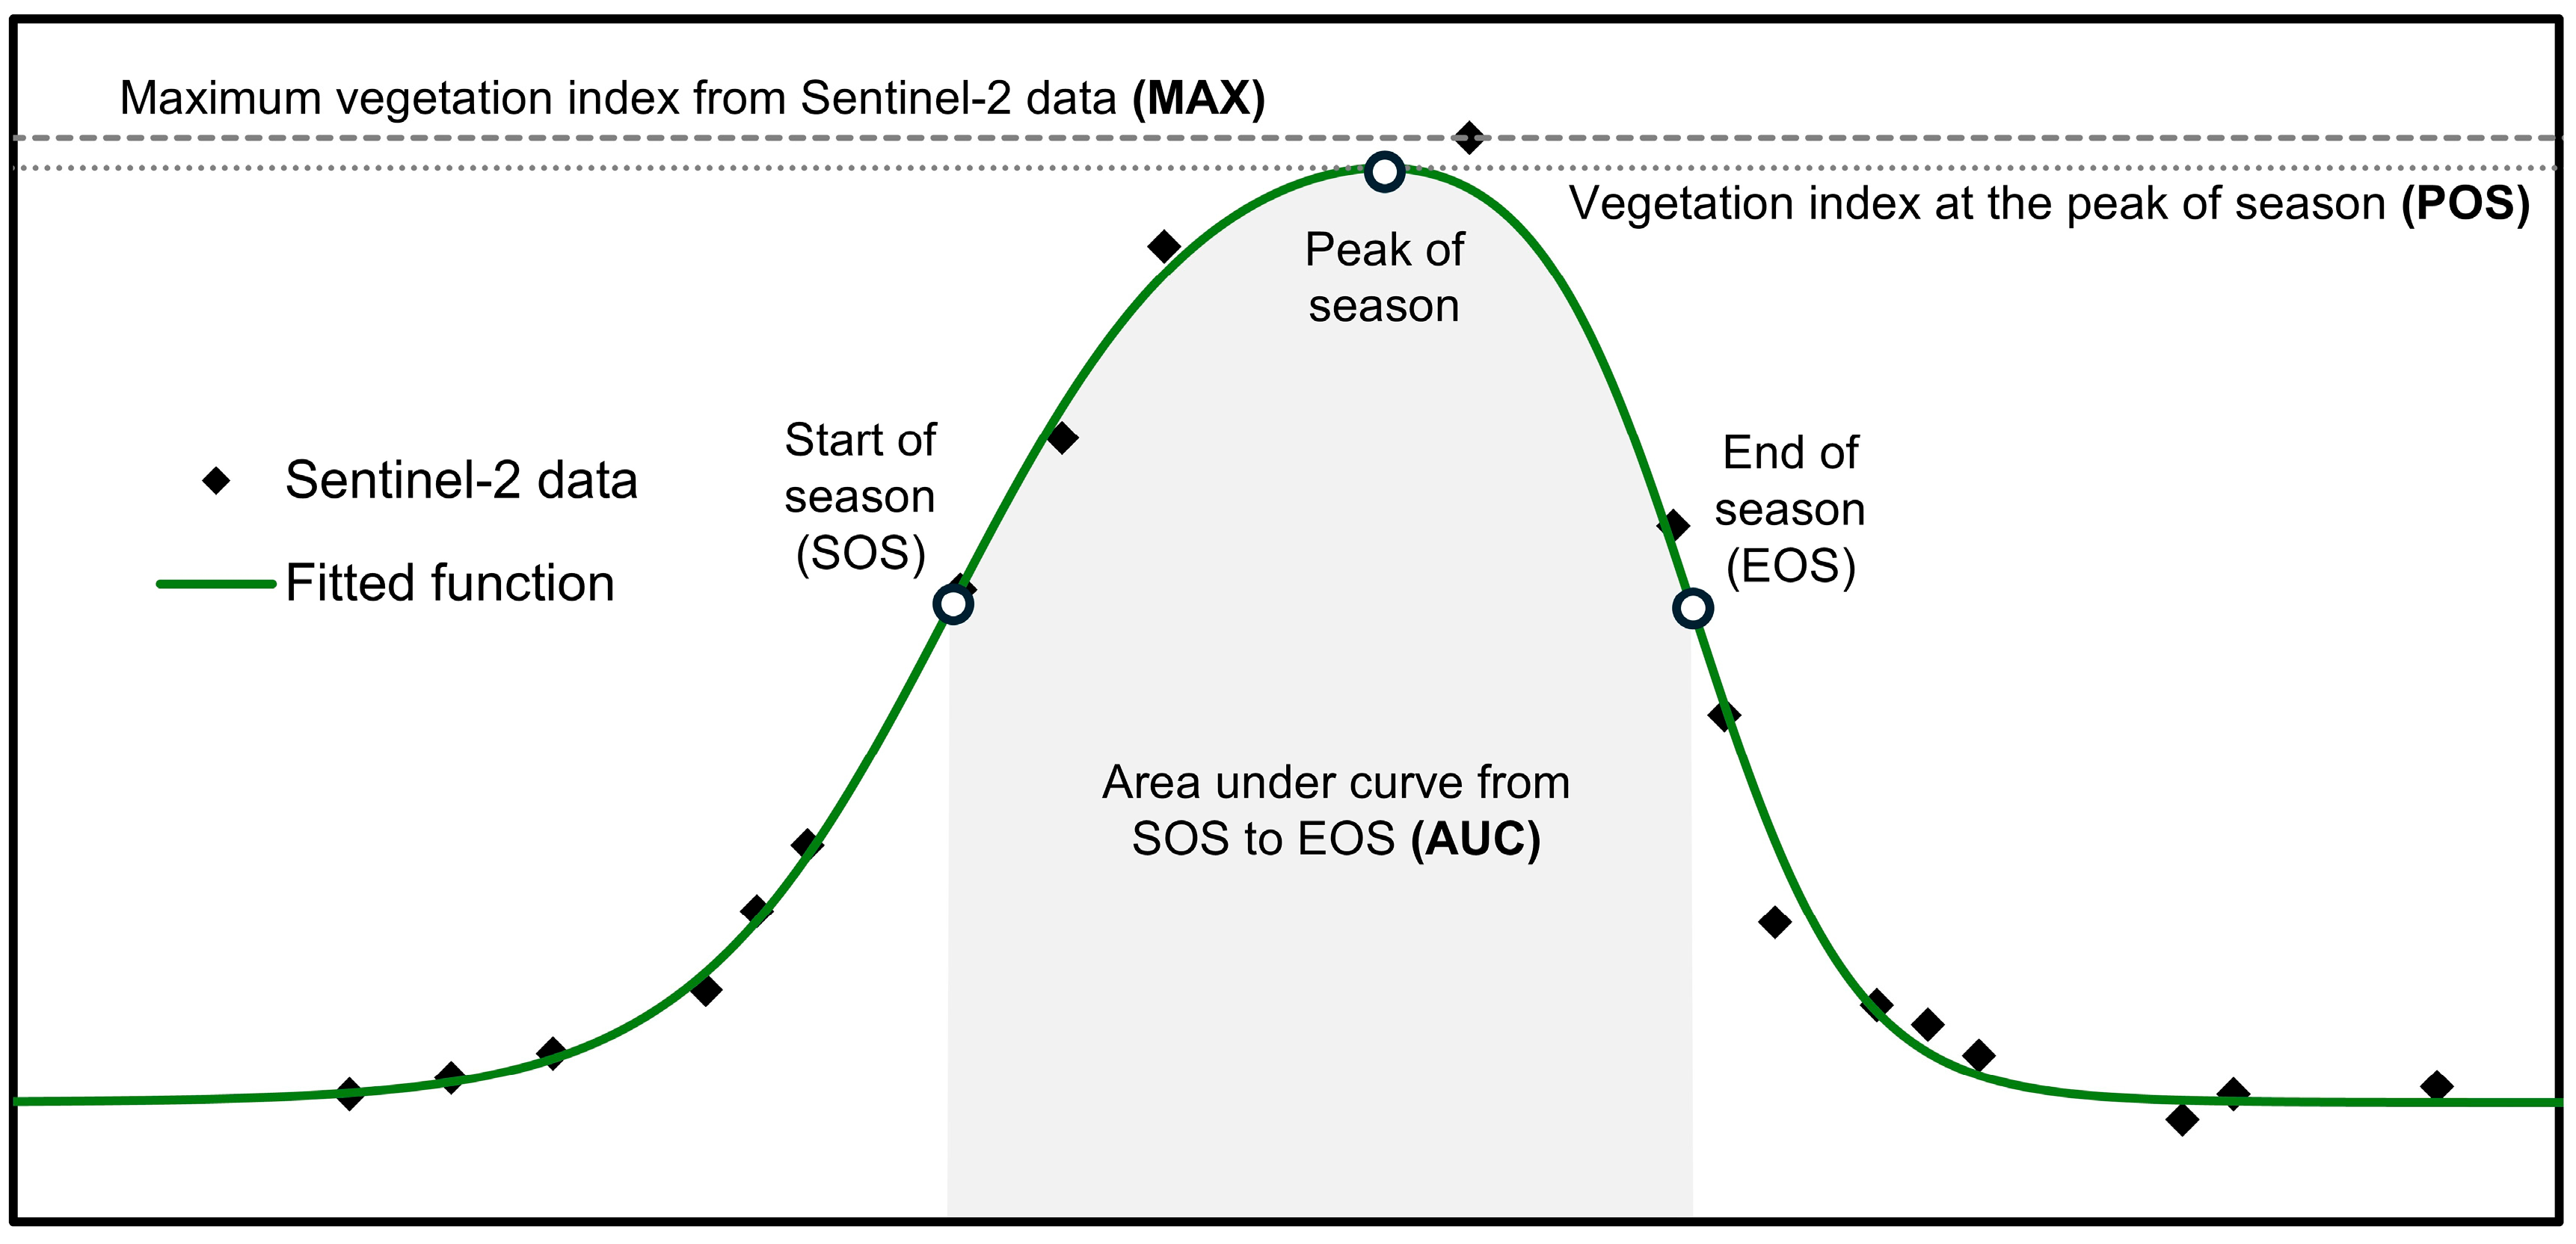
2.3. Phenology Analysis and Calculation of Vegetation Indices at Key Phenology Stages
2.4. Correlation Analysis of Calculated Proxy Metrics According to Ground-Truth Crop Yield Data
3. Results and Discussion
3.1. Correlation Analysis Between Evaluated Phenology Metrics
3.2. Correlation Analysis Between Evaluated Proxy Metrics and Ground-Truth Crop Yield Data
3.3. Study Limitations and Future Considerations
4. Conclusions
- WDRVI was an optimal vegetation index for maize yield prediction, while EVI2 produced the highest correlation for soybean, producing Pearson’s correlation coefficient means of 0.506 and 0.519 in combination with MAX, respectively.
- The majority of proxy metrics for cropland suitability with the highest correlation per dataset were achieved based on the MAX phenology metric. AUC outperformed it in two out of eight datasets for maize, while POS outperformed it in three cases for soybean yield. The correlations between MAX and POS were very high overall, which reflected only minor differences between their correlations with crop yield and indicated potential multicollinearity. MAX represented a global maximum of vegetation index values per sample, which required a fast and straightforward calculation process, unlike POS.
- This study combined multiple large ground-truth crop yield datasets with 30 m spatial resolution satellite imagery, but there is a potential bias in the used crop yield samples. The used ground-truth crop yield data were based on predictive modeling, providing larger coverage than individual yield mapping systems in combine harvesters, but they had limited accuracy.
- The saturation effect at higher crop yield values was observed during correlation analysis between the evaluated proxy metrics for cropland suitability and ground-truth crop yield data. Since several novel vegetation indices were developed to overcome this issue but were not simultaneously evaluated in combination with phenology metrics, future studies should explore their correlation with ground-truth crop yield data.
Author Contributions
Funding
Institutional Review Board Statement
Data Availability Statement
Acknowledgments
Conflicts of Interest
References
- Gu, D.; Andreev, K.; Dupre, M.E. Major Trends in Population Growth Around the World. China CDC Wkly. 2021, 3, 604–613. [Google Scholar] [CrossRef] [PubMed]
- Aboye, B.H.; Gebre-Egziabher, T.; Kebede, B.; Minale, A.S. Changing Farming Practices as Integral to Sustenance and Cropland-Use Loss in the Context of Urban Expansion: The Case of Jimma City, Southwest Ethiopia. Clean. Environ. Syst. 2023, 9, 100117. [Google Scholar] [CrossRef]
- Akpoti, K.; Kabo-bah, A.T.; Zwart, S.J. Agricultural Land Suitability Analysis: State-of-the-Art and Outlooks for Integration of Climate Change Analysis. Agric. Syst. 2019, 173, 172–208. [Google Scholar] [CrossRef]
- Radočaj, D.; Jurišić, M. GIS-Based Cropland Suitability Prediction Using Machine Learning: A Novel Approach to Sustainable Agricultural Production. Agronomy 2022, 12, 2210. [Google Scholar] [CrossRef]
- Ozsahin, E.; Ozdes, M. Agricultural Land Suitability Assessment for Agricultural Productivity Based on GIS Modeling and Multi-Criteria Decision Analysis: The Case of Tekirdağ Province. Environ. Monit. Assess. 2021, 194, 41. [Google Scholar] [CrossRef]
- Cravero, A.; Pardo, S.; Sepúlveda, S.; Muñoz, L. Challenges to Use Machine Learning in Agricultural Big Data: A Systematic Literature Review. Agronomy 2022, 12, 748. [Google Scholar] [CrossRef]
- Zeng, T.; Wu, L.; Peduto, D.; Glade, T.; Hayakawa, Y.S.; Yin, K. Ensemble Learning Framework for Landslide Susceptibility Mapping: Different Basic Classifier and Ensemble Strategy. Geosci. Front. 2023, 14, 101645. [Google Scholar] [CrossRef]
- Omia, E.; Bae, H.; Park, E.; Kim, M.S.; Baek, I.; Kabenge, I.; Cho, B.-K. Remote Sensing in Field Crop Monitoring: A Comprehensive Review of Sensor Systems, Data Analyses and Recent Advances. Remote Sens. 2023, 15, 354. [Google Scholar] [CrossRef]
- Zeng, Y.; Hao, D.; Huete, A.; Dechant, B.; Berry, J.; Chen, J.M.; Joiner, J.; Frankenberg, C.; Bond-Lamberty, B.; Ryu, Y.; et al. Optical Vegetation Indices for Monitoring Terrestrial Ecosystems Globally. Nat. Rev. Earth Environ. 2022, 3, 477–493. [Google Scholar] [CrossRef]
- Vidican, R.; Mălinaș, A.; Ranta, O.; Moldovan, C.; Marian, O.; Ghețe, A.; Ghișe, C.R.; Popovici, F.; Cătunescu, G.M. Using Remote Sensing Vegetation Indices for the Discrimination and Monitoring of Agricultural Crops: A Critical Review. Agronomy 2023, 13, 3040. [Google Scholar] [CrossRef]
- Radočaj, D.; Šiljeg, A.; Marinović, R.; Jurišić, M. State of Major Vegetation Indices in Precision Agriculture Studies Indexed in Web of Science: A Review. Agriculture 2023, 13, 707. [Google Scholar] [CrossRef]
- Rehman, T.H.; Lundy, M.E.; Linquist, B.A. Comparative Sensitivity of Vegetation Indices Measured via Proximal and Aerial Sensors for Assessing N Status and Predicting Grain Yield in Rice Cropping Systems. Remote Sens. 2022, 14, 2770. [Google Scholar] [CrossRef]
- Gong, Z.; Ge, W.; Guo, J.; Liu, J. Satellite Remote Sensing of Vegetation Phenology: Progress, Challenges, and Opportunities. ISPRS J. Photogramm. Remote Sens. 2024, 217, 149–164. [Google Scholar] [CrossRef]
- Garcia-Perez, M.A.; Rodriguez-Galiano, V.; Sanchez-Rodriguez, E.; Egea-Cobrero, V. Yield Estimation of Wheat Using Cropland Masks from European Common Agrarian Policy: Comparing the Performance of EVI2, NDVI, and MTCI in Spanish NUTS-2 Regions. Remote Sens. 2023, 15, 5423. [Google Scholar] [CrossRef]
- Ji, Z.; Pan, Y.; Zhu, X.; Zhang, D.; Wang, J. A Generalized Model to Predict Large-Scale Crop Yields Integrating Satellite-Based Vegetation Index Time Series and Phenology Metrics. Ecol. Indic. 2022, 137, 108759. [Google Scholar] [CrossRef]
- Nolasco, M.; Ovando, G.; Sayago, S.; Magario, I.; Bocco, M. Estimating Soybean Yield Using Time Series of Anomalies in Vegetation Indices from MODIS. Int. J. Remote Sens. 2021, 42, 405–421. [Google Scholar] [CrossRef]
- Prasad, N.R.; Patel, N.R.; Danodia, A. Cotton Yield Estimation Using Phenological Metrics Derived from Long-Term MODIS Data. J. Indian Soc. Remote Sens. 2021, 49, 2597–2610. [Google Scholar] [CrossRef]
- Bognár, P.; Kern, A.; Pásztor, S.; Steinbach, P.; Lichtenberger, J. Testing the Robust Yield Estimation Method for Winter Wheat, Corn, Rapeseed, and Sunflower with Different Vegetation Indices and Meteorological Data. Remote Sens. 2022, 14, 2860. [Google Scholar] [CrossRef]
- Ji, Z.; Pan, Y.; Zhu, X.; Wang, J.; Li, Q. Prediction of Crop Yield Using Phenological Information Extracted from Remote Sensing Vegetation Index. Sensors 2021, 21, 1406. [Google Scholar] [CrossRef]
- Al-Shammari, D.; Whelan, B.M.; Wang, C.; Bramley, R.G.V.; Bishop, T.F.A. Assessment of Red-Edge Based Vegetation Indices for Crop Yield Prediction at the Field Scale across Large Regions in Australia. Eur. J. Agron. 2025, 164, 127479. [Google Scholar] [CrossRef]
- Amaral, L.R.; Oldoni, H.; Baptista, G.M.M.; Ferreira, G.H.S.; Freitas, R.G.; Martins, C.L.; Cunha, I.A.; Santos, A.F. Remote Sensing Imagery to Predict Soybean Yield: A Case Study of Vegetation Indices Contribution. Precis. Agric. 2024, 25, 2375–2393. [Google Scholar] [CrossRef]
- Mezera, J.; Lukas, V.; Horniacek, I.; Smutny, V.; Elbl, J. Comparison of Proximal and Remote Sensing for the Diagnosis of Crop Status in Site-Specific Crop Management. Sensors 2022, 22, 19. [Google Scholar] [CrossRef] [PubMed]
- Tunca, E.; Koksal, E.S.; Taner, S.C. Silage Maize Yield Estimation by Using Planetscope, Sentinel-2A and Landsat 8 OLI Satellite Images. Smart Agric. Technol. 2023, 4, 100165. [Google Scholar] [CrossRef]
- Bellini, E.; Moriondo, M.; Dibari, C.; Leolini, L.; Staglianò, N.; Stendardi, L.; Filippa, G.; Galvagno, M.; Argenti, G. Impacts of Climate Change on European Grassland Phenology: A 20-Year Analysis of MODIS Satellite Data. Remote Sens. 2023, 15, 218. [Google Scholar] [CrossRef]
- Yang, S.; Wang, H.; Tong, J.; Bai, Y.; Alatalo, J.M.; Liu, G.; Fang, Z.; Zhang, F. Impacts of Environment and Human Activity on Grid-Scale Land Cropping Suitability and Optimization of Planting Structure, Measured Based on the MaxEnt Model. Sci. Total Environ. 2022, 836, 155356. [Google Scholar] [CrossRef]
- Zhang, L.; Zhang, K.; Zhu, X.; Chen, H.; Wang, W. Integrating Remote Sensing, Irrigation Suitability and Statistical Data for Irrigated Cropland Mapping over Mainland China. J. Hydrol. 2022, 613, 128413. [Google Scholar] [CrossRef]
- Manafifard, M.; Huang, J. A Comprehensive Review on Wheat Yield Prediction Based on Remote Sensing. Multimed. Tools Appl. 2024, 83, 1–74. [Google Scholar] [CrossRef]
- Che, Y.; Gu, Y.; Bai, D.; Li, D.; Li, J.; Zhao, C.; Wang, Q.; Qiu, H.; Huang, W.; Yang, C.; et al. Accurately Estimate Soybean Growth Stages from UAV Imagery by Accounting for Spatial Heterogeneity and Climate Factors across Multiple Environments. Comput. Electron. Agric. 2024, 225, 109313. [Google Scholar] [CrossRef]
- Xu, H.; Twine, T.E.; Girvetz, E. Climate Change and Maize Yield in Iowa. PLoS ONE 2016, 11, e0156083. [Google Scholar] [CrossRef]
- Zhang, J.; Lu, C.; Feng, H.; Hennessy, D.; Guan, Y.; Wright, M.M. Extreme Climate Increased Crop Nitrogen Surplus in the United States. Agric. For. Meteorol. 2021, 310, 108632. [Google Scholar] [CrossRef]
- Ma, Y.; Liang, S.-Z.; Myers, D.B.; Swatantran, A.; Lobell, D.B. Subfield-Level Crop Yield Mapping Without Ground Truth Data: A Scale Transfer Framework. Remote Sens. Environ. 2024, 315, 114427. [Google Scholar] [CrossRef]
- Awesome-Gee-Community-Catalog. QDANN 30 m Yield Map. Available online: https://gee-community-catalog.org/projects/qdann/ (accessed on 21 February 2025).
- Earth Engine Data Catalog. Harmonized Sentinel-2 MSI: MultiSpectral Instrument, Level-1C. Available online: https://developers.google.com/earth-engine/datasets/catalog/COPERNICUS_S2_HARMONIZED (accessed on 22 February 2025).
- Wu, H.; Liu, B.; Zhu, B.; Zhen, Z.; Song, K.; Ren, J. Combining Vegetation Indices to Identify the Maize Phenological Information Based on the Shape Model. Agriculture 2024, 14, 1608. [Google Scholar] [CrossRef]
- Swain, S.; Wardlow, B.D.; Narumalani, S.; Rundquist, D.C.; Hayes, M.J. Relationships Between Vegetation Indices and Root Zone Soil Moisture under Maize and Soybean Canopies in the US Corn Belt: A Comparative Study Using a Close-Range Sensing Approach. Int. J. Remote Sens. 2013, 34, 2814–2828. [Google Scholar] [CrossRef]
- Gitelson, A.A. Wide Dynamic Range Vegetation Index for Remote Quantification of Biophysical Characteristics of Vegetation. J. Plant Physiol. 2004, 161, 165–173. [Google Scholar] [CrossRef]
- Rouse, J.; Haas, R.H.; Schell, J.A.; Deering, D.W. Monitoring Vegetation Systems in the Great Plains with ERTS. NASA Spec. Publ. 1974, 351, 309. [Google Scholar]
- Huete, A.; Didan, K.; Miura, T.; Rodriguez, E.P.; Gao, X.; Ferreira, L.G. Overview of the Radiometric and Biophysical Performance of the MODIS Vegetation Indices. Remote Sens. Environ. 2002, 83, 195–213. [Google Scholar] [CrossRef]
- Jiang, Z.; Huete, A.R.; Didan, K.; Miura, T. Development of a Two-Band Enhanced Vegetation Index without a Blue Band. Remote Sens. Environ. 2008, 112, 3833–3845. [Google Scholar] [CrossRef]
- Bajocco, S.; Di Giulio, M.; Sallah, A.H.M.; Bregaglio, S. Exploring the Relationships Between Ground Observations and Remotely Sensed Hazelnut Spring Phenology. Int. J. Biometeorol. 2025, 69, 281–294. [Google Scholar] [CrossRef]
- Park, T.; Chen, C.; Macias-Fauria, M.; Tømmervik, H.; Choi, S.; Winkler, A.; Bhatt, U.S.; Walker, D.A.; Piao, S.; Brovkin, V.; et al. Changes in Timing of Seasonal Peak Photosynthetic Activity in Northern Ecosystems. Glob. Change Biol. 2019, 25, 2382–2395. [Google Scholar] [CrossRef]
- Jönsson, P.; Eklundh, L. TIMESAT—A Program for Analyzing Time-Series of Satellite Sensor Data. Comput. Geosci. 2004, 30, 833–845. [Google Scholar] [CrossRef]
- Zhen, Z.; Chen, S.; Yin, T.; Chavanon, E.; Lauret, N.; Guilleux, J.; Henke, M.; Qin, W.; Cao, L.; Li, J.; et al. Using the Negative Soil Adjustment Factor of Soil Adjusted Vegetation Index (SAVI) to Resist Saturation Effects and Estimate Leaf Area Index (LAI) in Dense Vegetation Areas. Sensors 2021, 21, 2115. [Google Scholar] [CrossRef] [PubMed]
- Iowa Annual Weather Summary. 2021. Available online: https://iowaagriculture.gov/sites/default/files/climatology/2021/Iowa-Annual-Weather-Summary-2021.pdf (accessed on 24 February 2025).
- Iowa Annual Weather Summary. 2022. Available online: https://iowaagriculture.gov/sites/default/files/climatology/2022/Iowa-Annual-Weather-Summary-2022.pdf (accessed on 24 February 2025).
- Iowa Agricultural Statistics. 2022. Available online: https://www.nass.usda.gov/Statistics_by_State/Iowa/Publications/Annual_Statistical_Bulletin/2022-Iowa-Annual-Bulletin.pdf (accessed on 24 February 2025).
- Amankulova, K.; Farmonov, N.; Mukhtorov, U.; Mucsi, L. Sunflower Crop Yield Prediction by Advanced Statistical Modeling Using Satellite-Derived Vegetation Indices and Crop Phenology. Geocarto Int. 2023, 38, 2197509. [Google Scholar] [CrossRef]
- Ali, A.; Martelli, R.; Lupia, F.; Barbanti, L. Assessing Multiple Years’ Spatial Variability of Crop Yields Using Satellite Vegetation Indices. Remote Sens. 2019, 11, 2384. [Google Scholar] [CrossRef]
- Parida, P.K.; Somasundaram, E.; Krishnan, R.; Radhamani, S.; Sivakumar, U.; Parameswari, E.; Raja, R.; Shri Rangasami, S.R.; Sangeetha, S.P.; Gangai Selvi, R. Unmanned Aerial Vehicle-Measured Multispectral Vegetation Indices for Predicting LAI, SPAD Chlorophyll, and Yield of Maize. Agriculture 2024, 14, 1110. [Google Scholar] [CrossRef]
- Bao, L.; Li, X.; Yu, J.; Li, G.; Chang, X.; Yu, L.; Li, Y. Forecasting Spring Maize Yield Using Vegetation Indices and Crop Phenology Metrics from UAV Observations. Food Energy Secur. 2024, 13, e505. [Google Scholar] [CrossRef]
- Radočaj, D.; Jurišić, M.; Gašparović, M.; Plaščak, I.; Antonić, O. Cropland Suitability Assessment Using Satellite-Based Biophysical Vegetation Properties and Machine Learning. Agronomy 2021, 11, 1620. [Google Scholar] [CrossRef]
- Rinaldi, M.; Ruggieri, S.; Garofalo, P.; Vonella, A.V.; Satalino, G.; Soldo, P. Leaf Area Index Retrieval Using High Resolution Remote Sensing Data. Ital. J. Agron. 2010, 5, 155–166. [Google Scholar] [CrossRef]
- Zhen, Z.; Chen, S.; Yin, T.; Gastellu-Etchegorry, J.-P. Globally Quantitative Analysis of the Impact of Atmosphere and Spectral Response Function on 2-Band Enhanced Vegetation Index (EVI2) over Sentinel-2 and Landsat-8. ISPRS J. Photogramm. Remote Sens. 2023, 205, 206–226. [Google Scholar] [CrossRef]
- Vélez, S.; Martínez-Peña, R.; Castrillo, D. Beyond Vegetation: A Review Unveiling Additional Insights into Agriculture and Forestry Through the Application of Vegetation Indices. J 2023, 6, 421–436. [Google Scholar] [CrossRef]
- Jin, H.; Eklundh, L. A Physically Based Vegetation Index for Improved Monitoring of Plant Phenology. Remote Sens. Environ. 2014, 152, 512–525. [Google Scholar] [CrossRef]
- Qiao, K.; Zhu, W.; Xie, Z.; Wu, S.; Li, S. New Three Red-Edge Vegetation Index (VI3RE) for Crop Seasonal LAI Prediction Using Sentinel-2 Data. Int. J. Appl. Earth Obs. Geoinf. 2024, 130, 103894. [Google Scholar] [CrossRef]
- Yao, X.; Wang, N.; Liu, Y.; Cheng, T.; Tian, Y.; Chen, Q.; Zhu, Y. Estimation of Wheat LAI at Middle to High Levels Using Unmanned Aerial Vehicle Narrowband Multispectral Imagery. Remote Sens. 2017, 9, 1304. [Google Scholar] [CrossRef]
- Sun, Y.; Ren, H.; Zhang, T.; Zhang, C.; Qin, Q. Crop Leaf Area Index Retrieval Based on Inverted Difference Vegetation Index and NDVI. IEEE Geosci. Remote Sens. Lett. 2018, 15, 1662–1666. [Google Scholar] [CrossRef]
- Europe, Daily. Plant Phenology Index 2016-Present (Raster 10 m). Available online: https://land.copernicus.eu/api/en/products/vegetation/high-resolution-plant-phenology-index (accessed on 27 February 2025).
- Radočaj, D.; Gašparović, M.; Jurišić, M. Cropland Suitability Prediction Method Based on Biophysical Variables from Copernicus Data and Machine Learning. Appl. Sci. 2025, 15, 372. [Google Scholar] [CrossRef]
- Rudin, C. Stop Explaining Black Box Machine Learning Models for High Stakes Decisions and Use Interpretable Models Instead. Nat. Mach. Intell. 2019, 1, 206–215. [Google Scholar] [CrossRef]
- Perich, G.; Turkoglu, M.O.; Graf, L.V.; Wegner, J.D.; Aasen, H.; Walter, A.; Liebisch, F. Pixel-Based Yield Mapping and Prediction from Sentinel-2 Using Spectral Indices and Neural Networks. Field Crops Res. 2023, 292, 108824. [Google Scholar] [CrossRef]
- Shen, Y.; Zhang, X.; Yang, Z.; Ye, Y.; Wang, J.; Gao, S.; Liu, Y.; Wang, W.; Tran, K.H.; Ju, J. Developing an Operational Algorithm for Near-Real-Time Monitoring of Crop Progress at Field Scales by Fusing Harmonized Landsat and Sentinel-2 Time Series with Geostationary Satellite Observations. Remote Sens. Environ. 2023, 296, 113729. [Google Scholar] [CrossRef]
- Diao, C.; Li, G. Near-Surface and High-Resolution Satellite Time Series for Detecting Crop Phenology. Remote Sens. 2022, 14, 1957. [Google Scholar] [CrossRef]


| Crop | Year | Iowa | Illinois | ||
|---|---|---|---|---|---|
| Mean (kg ha−1) | CV | Mean (kg ha−1) | CV | ||
| Maize | 2019 | 12,882.6 | 0.126 | 12,310.5 | 0.106 |
| 2020 | 12,561.0 | 0.122 | 13,049.2 | 0.115 | |
| 2021 | 13,535.8 | 0.107 | 13,206.4 | 0.109 | |
| 2022 | 13,143.8 | 0.099 | 13,854.4 | 0.087 | |
| Soybean | 2019 | 3446.4 | 0.102 | 3471.6 | 0.116 |
| 2020 | 3662.1 | 0.118 | 3909.8 | 0.107 | |
| 2021 | 3959.8 | 0.094 | 4024.7 | 0.105 | |
| 2022 | 3731.3 | 0.077 | 3910.4 | 0.089 | |
| Vegetation Index | Abbreviation | Formula | Reference |
|---|---|---|---|
| Normalized Difference Vegetation Index | NDVI | [37] | |
| Enhanced Vegetation Index | EVI | [38] | |
| Enhanced Vegetation Index 2 | EVI2 | [39] | |
| Wide Dynamic Range Vegetation Index | WDRVI | [36] |
| Crop | Vegetation Index | Phenology Metric | Iowa | Illinois | Mean | ||||||
|---|---|---|---|---|---|---|---|---|---|---|---|
| 2019 | 2020 | 2021 | 2022 | 2019 | 2020 | 2021 | 2022 | ||||
| Maize | NDVI | MAX | 0.533 | 0.487 | 0.409 | 0.450 | 0.545 | 0.395 | 0.371 | 0.402 | 0.449 |
| POS | 0.489 | 0.464 | 0.434 | 0.434 | 0.477 | 0.367 | 0.340 | 0.368 | 0.422 | ||
| AUC | 0.171 | 0.196 | 0.254 | 0.355 | 0.280 | 0.134 | 0.050 | 0.339 | 0.222 | ||
| EVI | MAX | 0.037 | 0.000 | 0.003 | 0.113 | 0.132 | 0.027 | 0.027 | 0.048 | 0.048 | |
| POS | 0.490 | 0.465 | 0.390 | 0.482 | 0.545 | 0.342 | 0.363 | 0.387 | 0.433 | ||
| AUC | 0.298 | 0.360 | 0.416 | 0.474 | 0.416 | 0.206 | 0.228 | 0.428 | 0.353 | ||
| EVI2 | MAX | 0.570 | 0.471 | 0.382 | 0.493 | 0.581 | 0.342 | 0.388 | 0.396 | 0.453 | |
| POS | 0.557 | 0.510 | 0.421 | 0.503 | 0.575 | 0.360 | 0.367 | 0.427 | 0.465 | ||
| AUC | 0.300 | 0.358 | 0.358 | 0.489 | 0.401 | 0.213 | 0.204 | 0.426 | 0.344 | ||
| WDRVI | MAX | 0.578 | 0.521 | 0.410 | 0.558 | 0.582 | 0.484 | 0.385 | 0.531 | 0.506 | |
| POS | 0.561 | 0.462 | 0.437 | 0.510 | 0.558 | 0.456 | 0.352 | 0.520 | 0.482 | ||
| AUC | 0.400 | 0.494 | 0.504 | 0.600 | 0.465 | 0.322 | 0.311 | 0.493 | 0.449 | ||
| Soybean | NDVI | MAX | 0.372 | 0.634 | 0.486 | 0.361 | 0.513 | 0.466 | 0.385 | 0.457 | 0.459 |
| POS | 0.330 | 0.620 | 0.421 | 0.319 | 0.452 | 0.439 | 0.307 | 0.457 | 0.418 | ||
| AUC | 0.127 | 0.198 | 0.140 | 0.097 | 0.155 | 0.040 | 0.011 | 0.193 | 0.120 | ||
| EVI | MAX | 0.005 | 0.123 | 0.143 | 0.075 | 0.143 | 0.017 | 0.056 | 0.333 | 0.112 | |
| POS | 0.440 | 0.643 | 0.528 | 0.366 | 0.533 | 0.484 | 0.418 | 0.533 | 0.493 | ||
| AUC | 0.275 | 0.420 | 0.413 | 0.252 | 0.243 | 0.214 | 0.222 | 0.451 | 0.311 | ||
| EVI2 | MAX | 0.472 | 0.664 | 0.552 | 0.387 | 0.571 | 0.532 | 0.420 | 0.557 | 0.519 | |
| POS | 0.443 | 0.681 | 0.541 | 0.421 | 0.543 | 0.535 | 0.400 | 0.552 | 0.515 | ||
| AUC | 0.289 | 0.402 | 0.415 | 0.256 | 0.253 | 0.224 | 0.182 | 0.417 | 0.305 | ||
| WDRVI | MAX | 0.436 | 0.638 | 0.473 | 0.365 | 0.498 | 0.505 | 0.357 | 0.459 | 0.466 | |
| POS | 0.401 | 0.634 | 0.452 | 0.375 | 0.481 | 0.476 | 0.334 | 0.428 | 0.448 | ||
| AUC | 0.340 | 0.403 | 0.336 | 0.275 | 0.327 | 0.274 | 0.154 | 0.422 | 0.316 | ||
Disclaimer/Publisher’s Note: The statements, opinions and data contained in all publications are solely those of the individual author(s) and contributor(s) and not of MDPI and/or the editor(s). MDPI and/or the editor(s) disclaim responsibility for any injury to people or property resulting from any ideas, methods, instructions or products referred to in the content. |
© 2025 by the authors. Licensee MDPI, Basel, Switzerland. This article is an open access article distributed under the terms and conditions of the Creative Commons Attribution (CC BY) license (https://creativecommons.org/licenses/by/4.0/).
Share and Cite
Radočaj, D.; Jurišić, M. A Phenology-Based Evaluation of the Optimal Proxy for Cropland Suitability Based on Crop Yield Correlations from Sentinel-2 Image Time-Series. Agriculture 2025, 15, 859. https://doi.org/10.3390/agriculture15080859
Radočaj D, Jurišić M. A Phenology-Based Evaluation of the Optimal Proxy for Cropland Suitability Based on Crop Yield Correlations from Sentinel-2 Image Time-Series. Agriculture. 2025; 15(8):859. https://doi.org/10.3390/agriculture15080859
Chicago/Turabian StyleRadočaj, Dorijan, and Mladen Jurišić. 2025. "A Phenology-Based Evaluation of the Optimal Proxy for Cropland Suitability Based on Crop Yield Correlations from Sentinel-2 Image Time-Series" Agriculture 15, no. 8: 859. https://doi.org/10.3390/agriculture15080859
APA StyleRadočaj, D., & Jurišić, M. (2025). A Phenology-Based Evaluation of the Optimal Proxy for Cropland Suitability Based on Crop Yield Correlations from Sentinel-2 Image Time-Series. Agriculture, 15(8), 859. https://doi.org/10.3390/agriculture15080859