Article

Construction of an SNP Fingerprinting Database and Population Genetic Analysis of Auricularia heimuer

1
Engineering Research Centre of Chinese Ministry of Education for Edible and Medicinal Fungi, Jilin Agricultural University, Changchun 130118, China
2
Laboratory of the Genetic Breeding of Edible Mushroom, College of Horticulture, Jilin Agricultural University, Changchun 130118, China
*
Author to whom correspondence should be addressed.
Agriculture 2025, 15(8), 884; https://doi.org/10.3390/agriculture15080884
Submission received: 3 March 2025 / Revised: 9 April 2025 / Accepted: 10 April 2025 / Published: 18 April 2025
(This article belongs to the Special Issue Genetics and Breeding of Edible Mushroom)

Abstract

:
Auricularia heimuer is the second most widely cultivated edible fungus in China, with significant food and medicinal value, and is highly popular throughout Asia and globally. However, the differentiation of A. heimuer is simple, as its morphology is characterized by a small “black disc”, making it difficult to distinguish among germplasms with highly similar agronomic traits, thus posing challenges for germplasm identification. To address this issue, this study conducted whole-genome resequencing analysis on 150 A. heimuer germplasms. Through filtering 9,589,911 SNPs obtained from 280 G resequencing data, a total of 1,202,947 high-quality SNP sites were identified. Based on these high-quality SNPs, population structure analysis, principal component analysis (PCA), and phylogenetic tree analysis revealed that the 150 A. heimuer germplasms could be divided into five groups, with wild strains from the same geographical origin exhibiting significant geographical clustering patterns. This finding underscores the relationship between the genetic diversity of wild A. heimuer and its geographical distribution in China. A further selection of 71 SNP sites was made, and 61 KASP markers were successfully developed using kompetitive allele-specific PCR (KASP) technology, with 54 of them demonstrating good polymorphism. The average values for the polymorphism information content (PIC), minor allele frequency (MAF), gene diversity, and heterozygosity of these core KASP markers were 0.34, 0.35, 0.34, and 0.43, respectively. Based on the 54 core KASP markers, a DNA fingerprinting map of the 150 A. heimuer germplasms was constructed in this study. The findings provide important molecular marker resources and theoretical support for the identification of A. heimuer germplasm, molecular marker-assisted breeding, and the selection of superior varieties.

1. Introduction

Auricularia heimuer is an important edible and medicinal fungus worldwide [1]. Due to its good flavor [2], high nutritional value [3,4], and strong anticancer effects [5], it has become increasingly popular in daily diets. The production of A. heimuer has been continuously increasing over recent decades, reaching 7.0643 million tons in 2021, making it the second-largest edible fungus in China [6]. However, due to the simple differentiation of A. heimuer, characterized only by a black ear-like disk, it is difficult to distinguish among germplasm resources with similar agronomic traits and other phenotypic characteristics. This poses significant challenges for germplasm identification and breeding. Therefore, conducting investigations and collections of A. heimuer germplasm resources, subsequent genetic diversity assessment and DNA fingerprinting are essential for accurately characterizing germplasm resources and facilitating the breeding of high-performing varieties.
With the development of molecular biology techniques, significant progress has been made in molecular marker research. Due to their resistance to environmental influences, abundant polymorphism, and suitability for high-throughput detection, molecular markers have been widely applied in various research areas such as germplasm identification and variety improvement [7]. Single nucleotide polymorphisms (SNPs), as third-generation molecular markers, have become widely adopted in agricultural genetic studies due to their low cost, high throughput, strong reproducibility, even genomic distribution, and ease of automated data collection [8,9,10]. Currently, the International Union for the Protection of New Varieties of Plants (UPOV) uses SNP as the molecular detection guideline [11].
Kompetitive allele-specific PCR (KASP), a competitive amplification technique based on allele-specific PCR, allows the design of specific composite markers for a given population, or the development of functional molecular markers based on specific functional loci. This provides great flexibility in the detection loci and sample types [12,13]. Compared with other SNP genotyping approaches, KASP technology stands out for its high precision, cost-effectiveness, flexibility across diverse experimental conditions, and suitability for large-scale SNP screening [14]. These characteristics make KASP technology suitable for crop gene identification, genetic diversity analysis, and the construction of fingerprint maps. The construction of DNA fingerprint maps is crucial for ensuring the varietal specificity and species authenticity of edible fungi [15,16]. Currently, KASP technology has been widely used in the construction of fingerprint maps for crops such as wheat [17], rice [18], cucumber [19], and cigar tobacco [16]. In edible fungi, 12 core SNP markers were selected from 60 Grifola frondosa germplasms using KASP genotyping technology, and a fingerprint map of G. frondosa germplasm resources was constructed [20]. However, there have been no reports on the construction of fingerprint maps using SNP markers in A. heimuer to date.
In this study, whole-genome resequencing data from 150 A. heimuer germplasm accessions were employed to identify high-confidence SNP loci. Utilizing these SNPs, we conducted comprehensive analyses of population structure and genetic diversity within the A. heimuer collection. Polymorphic SNPs with uniform genomic distribution were selected and subsequently converted into KASP markers. These markers were used to genotype all 150 accessions, enabling the identification of core loci for constructing a germplasm DNA fingerprinting system. The resulting fingerprint map provides a robust molecular tool for variety identification and offers a valuable reference for the conservation and genetic improvement of A. heimuer germplasm in future breeding efforts.

2. Materials and Methods

2.1. Materials

Test Strain

A total of 150 A. heimuer germplasms were collected for this experiment, sourced from 14 provinces across China, as well as two wild germplasms collected from Russia and Korea. All wild germplasms were collected by our team for many years. Strains are preserved at the College of Horticulture, Jilin Agricultural University (Table S1). The mycelia were inoculated onto potato dextrose agar (PDA) medium and placed in a constant-temperature incubator at 25 °C for dark cultivation until the mycelia covered the entire Petri dish. The mycelia were then collected with a spatula into centrifuge tubes for further use. This experiment was conducted in March 2024.

2.2. Methods

2.2.1. DNA Extraction and Library Construction

Genomic DNA was extracted from A. heimuer mycelia using the CTAB methods [21]. The extracted DNA was subjected to quality control tests and DNA samples that met the quality criteria (>3 µg; concentration >30 ng/µL; OD260/OD280 = 1.80–2.00) were used for further analysis. The extracted DNA was randomly fragmented using ultrasonic treatment, followed by end repair. The End Repair Mix2 from the kit was used to remove the protruding bases at the 5′ end of the DNA sequence, add a phosphate group, and fill in any missing bases at the 3′ end. To prevent self-legation of DNA fragments and facilitate the ligation with sequencing adapters (which carry a protruding T base at their 3′ end), an A nucleotide was added to the 3′ ends of the DNA inserts. Sequencing adapters containing unique index sequences were then ligated to the 5′ ends to enable anchoring of DNA molecules onto the flow cell during sequencing. Following adapter ligation, magnetic bead-based selection using BECKMAN AMPure XP (Indianapolis, IN, USA). Beads was carried out to eliminate adapter dimers and purify the library. The adapter-tagged DNA fragments were subsequently amplified via PCR to enrich the sequencing library. A second round of purification using the same bead system was performed to remove PCR byproducts. Finally, target fragments were size-selected and further purified by 2% agarose gel electrophoresis to obtain the final library for sequencing.

2.2.2. Variant Detection and Annotation

The reference genome data for A. heimuer were obtained from the NCBI database (https://www.ncbi.nlm.nih.gov). High-quality sequencing reads (clean reads) were aligned to the reference genome sequence using BWA software (v.0.7.17) [22], generating a sequence alignment map (SAM format file). The SAM file was then sorted and merged using SAMtools, and duplicate reads were removed using Picard. Based on the alignment results, sequencing depth and coverage were calculated using a custom Perl script. The valid BAM files underwent SNP detection through the HaplotypeCaller module of GATK [23], generating Variant Call Format (VCF) files, which were then quality filtered using the VCFtools Variant Filtration function (parameters: QD < 2.0 || FS > 60.0 || MQ < 40.0 || SOR > 10.0). Detected variants were annotated using ANNOVAR (version released on 8 June 2020), including SNPs (synonymous/non-synonymous mutations), while structural variants (SVs) were identified using Break Dancer. High-quality SNPs were selected from the entire database based on the following filtering criteria: average coverage depth > 5×, minor allele frequency (MAF) > 0.05, average quality value (AverageQ) > 30, and minimum integrity > 0.9. The filtering tools used were BCFtools and VCFtools [24].

2.2.3. Genetic Diversity and Population Structure Analysis

Cluster analysis was performed using the neighbor-joining method in MEGA7.0.26 software [25], and a cluster tree was constructed. Principal component analysis (PCA) of the A. heimuer germplasms was conducted using NTSYS-PC 2.10 software. The population genetic structure was analyzed using the admixture software (v1.3.0), with the range for the optimal number of population clusters (K) set from 2 to 9. Each K value was run five times, and the appropriate K value was selected based on the principle of the lowest error rate, which determined the number of populations.

2.2.4. Design of KASP Markers and Genotyping

To develop KASP markers, candidate SNP sites were extracted along with 100 bp of flanking sequence on both sides. These sequences were aligned to the reference genome using BLASTN to exclude non-specific regions, ensuring marker specificity. For each selected SNP locus, two allele-specific forward primers and one common reverse primer were designed. Fluorescent tags were incorporated at the 5′ ends of the primers: F1 (FAM): GAAGGTGACCAAGTTCATGCT and F2 (VIC): GAAGGTCGGAGTCAACGGATT. The primers were synthesized and diluted to a final concentration of 10 µM using TE buffer (pH 8.0). Prior to genotyping, they were mixed in a 1:1:3 ratio of the two allele-specific primers to the common primer and then used for PCR amplification on the KASP platform. For each 5 µL reaction system, 1.25 µL of the primer mixture was added. DNA samples were diluted in bulk to a concentration corresponding to the lowest sample concentration, with 1.25 µL of the diluted DNA sample added to each 5 µL reaction system. The PCR reaction system consisted of 5 µL, including 2.5 µL of 2 × KASP Master Mix, 1.25 µL of the KASP primer mix, and 1.25 µL of template (30 ng genomic DNA). The 96-well PCR reaction plate was sealed, shaken, and centrifuged to ensure proper mixing of the reaction system. After centrifugation, PCR was performed with the following conditions: 95 °C for 10 min for pre-denaturation; 95 °C for 20 s for denaturation, followed by 61–55 °C for 60 s for annealing and extension in 10 Touchdown cycles (each cycle reducing by 0.6 °C); the second round of PCR was performed with 95 °C for 20 s for denaturation and 55 °C for 60 s for annealing and extension, for 30 cycles. After the reaction, fluorescence detection was conducted using the BMG POLARstar Omega 5.10 R2 reader, and the data were analyzed using KlusterCaller software (LGC Biosearch Technologies, Hoddesdon, UK).

2.2.5. DNA Fingerprinting Map Construction

Based on the obtained high-quality SNPs, DNA fingerprinting was constructed using a Perl script [26]. The aim was to identify as many varieties as possible using the fewest markers, achieving simplicity, effectiveness, and cost-efficiency [27]. Core markers were selected based on their high detection efficiency, pronounced polymorphism, and capacity to differentiate all tested varieties. Selection criteria included PIC values and allele frequency distribution. The finalized set of core markers was subsequently employed to establish the DNA fingerprinting profile for the A. heimuer germplasm.

3. Results

3.1. Quality Control and Alignment Analysis of Resequencing Data

In this study, resequencing analysis was conducted on 150 A. heimuer strains, yielding a total of 280 G of data. The data for each sample were statistically analyzed, with an average GC content of 54.53%, an average Q20 value of 98.40%, and an average Q30 value of 95.52%. Detailed results can be found in Table S2. The sequencing data included some adapter-containing and low-quality reads, which required further filtering. The basic information on data filtering is presented in Table S3. The high-quality data obtained after filtering were aligned to the reference genome, with an average alignment rate of 90.09% and an average sequencing depth of 34.47 X. Sequencing depth (Figure 1A) and cumulative sequencing depth (Figure 1B), as well as sequence alignment results and sequencing depth distribution, are shown in Table S4 and Figure S1. The sequencing quality is high, allowing for subsequent analysis.

3.2. SNP Detection and Annotation

SNP detection was performed using GATK software (v.4.6.0.0) [28]. To ensure the reliability of the SNP sites, further filtering was applied to the obtained SNPs, resulting in 1,202,947 high-quality SNPs for subsequent analysis. Among these, 630,506 were transitions and 571,991 were transversions, with a transition-to-transversion ratio of 1:1.1. These high-quality SNPs are ideal for constructing the A. heimuer fingerprint map and conducting genetic diversity analysis. Furthermore, a distribution analysis of SNPs in the coding regions and the entire genome revealed that 71.99% of SNPs in the coding regions were synonymous mutations, and 27.32% were non-synonymous mutations (Figure 2A). In the genome, SNPs were distributed as follows: 12.04% in intergenic regions, 34.86% in introns, 22.17% in exons, 12.95% in the upstream 1 kb region of the transcription start site, and 11.65% in the downstream 1 kb region of the transcription termination site. Additionally, 6.23% of SNPs were found in both the upstream 1 kb region of one gene and the downstream 1 kb region of another gene (Figure 2B). Finally, an SNP distribution map was constructed based on the number and density of SNPs (Figure 2C). The darker the color in the map, the higher the concentration of SNPs.

3.3. Genetic Diversity and Population Structure Analysis

Based on the high-quality SNP data obtained from resequencing, a phylogenetic tree of 150 A. heimuer germplasms was constructed using the neighbor-joining method (Figure 3A). The 150 germplasms were divided into five major groups, named pop-1, pop-2, pop-3, pop-4, and pop-5. Wild strains from Gansu Province were clustered in the pop-2 group, wild strains from Jilin were mainly clustered in the pop-3 group, the pop-4 group contained most of the wild strains from Yunnan, and wild strains from Inner Mongolia were predominantly grouped in the pop-5 group. This suggests that the genetic diversity of wild A. heimuer in China may be associated with its geographical distribution. The population structure of A. heimuer was analyzed using the admixture software, and the optimal number of clusters (K) was determined based on the cross-validation (CV) error value (Figure 3B). Line plots were drawn for each K value, and the CV error was repeated 10 times. The optimal number of clusters was determined by the minimum cross-validation error rate. When K = 5, the minimum cross-validation error rate was 0.27, indicating that the 150 strains could be divided into five groups. The different colors in the plot suggest that the genetic background of the tested A. heimuer strains is complex, with different strains being both interconnected and independent (Figure 3C,D). Based on the genotypic data, we further performed principal component analysis (PCA), which revealed that the 150 A. heimuer strains were divided into four groups. Specifically, pop-1 and pop-4 were grouped together, and wild strains from Gansu were clustered in the pop-2 group. This suggests a correlation between the PCA results and the geographic origin of the germplasm. The first and second principal components explained 19.69% and 9.02% of the data variation. The results show that the five groups interact closely with each other, and wild A. heimuer strains from the same geographic origin are clustered in the same group. The 150 strains are genetically closely related and exhibit a certain correlation with the geographic origin of the germplasm.

3.4. Conversion and Selection of KASP Markers

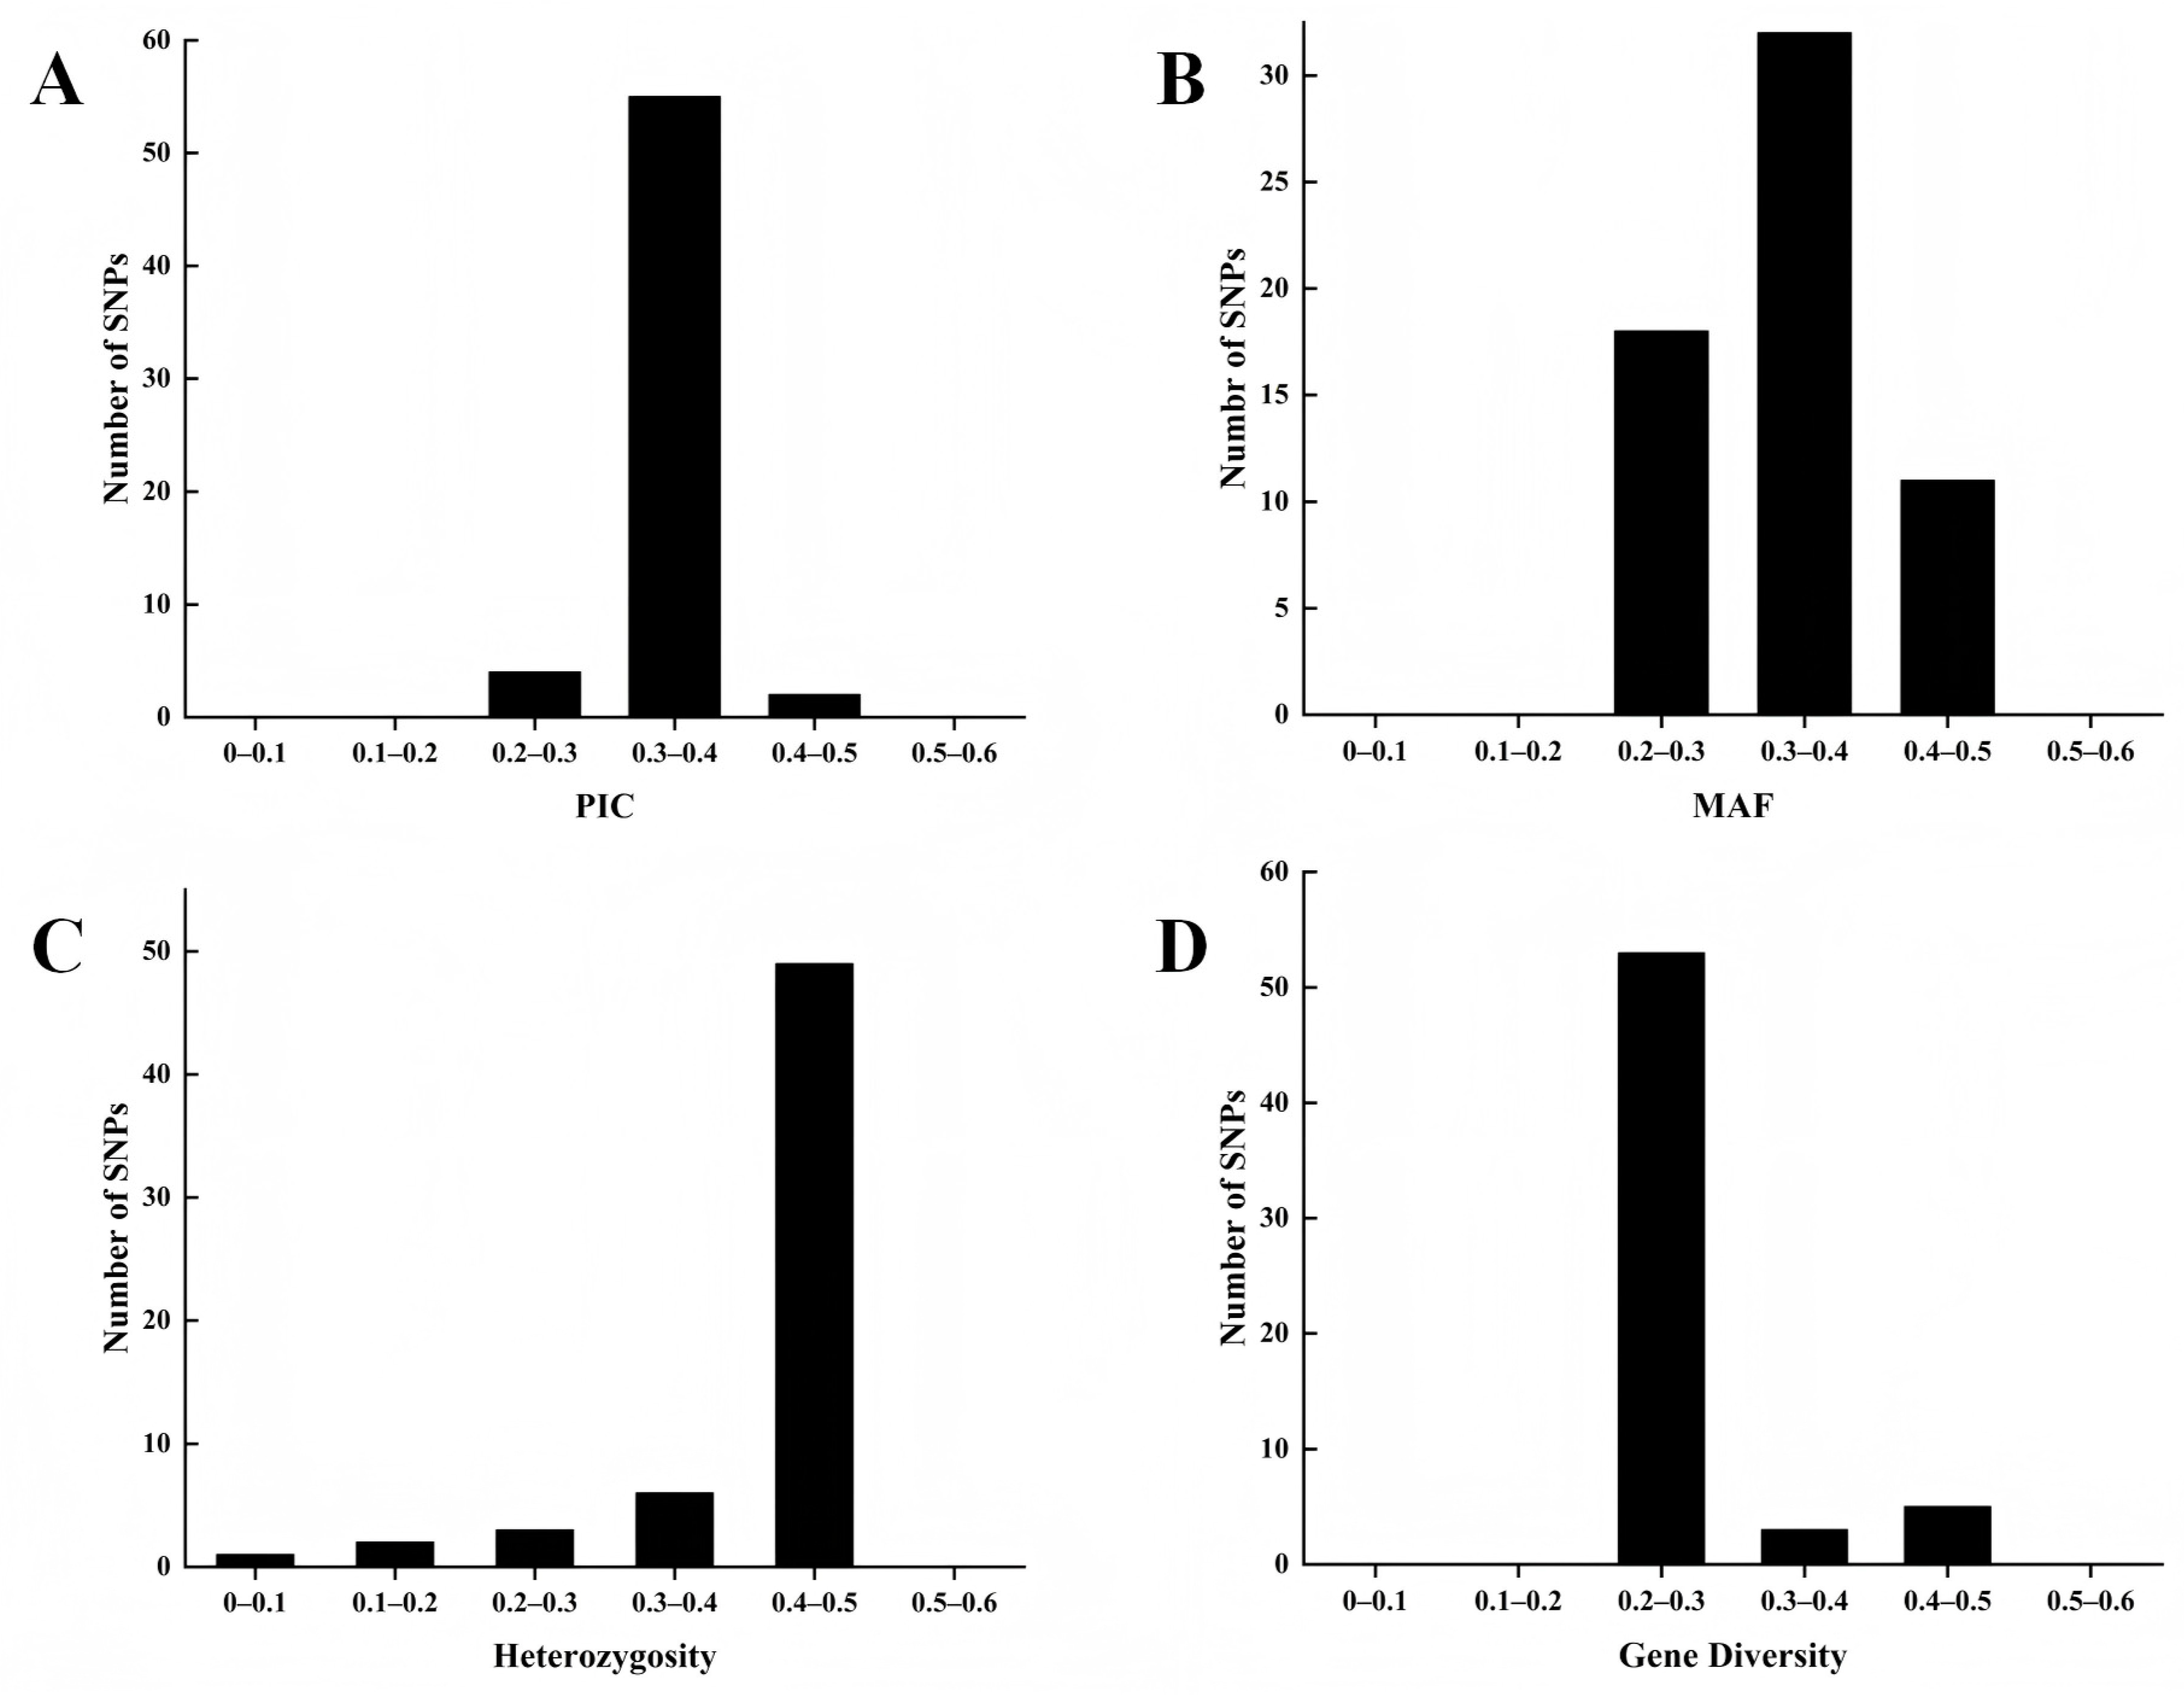
Based on the resequencing results, the total SNP sites obtained were filtered with the following criteria: removal of SNPs with a missing rate greater than 0.1, a missing value less than 0.05, minor allele frequency (MAF) > 0.05, and heterozygosity (het) < 0.1. A total of 141,573 SNP sites were selected, which were evenly distributed across the A. heimuer genome. The polymorphism information content (PIC) can be used to measure the polymorphism of DNA molecular markers in a population. Further filtering was performed with PIC > 0.2 and Pi > 0.4, resulting in 167 high-quality SNP sites. Additional screening for SNPs with no missing genotypic data, predominantly homozygous variation, and detected in as many individuals as possible led to the selection of 71 SNP sites. KASP primers were designed for 71 SNP sites, and 61 (85.9%) successfully converted into KASP markers. The PIC values of the 61 KASP markers ranged from 0.221 to 0.405, with an average of 0.342. Among the 61 core markers, four had PIC values lower than 0.3. The average MAF value of the 61 markers was 0.353, ranging from 0.271 to 0.489. The average observed heterozygosity was 0.428, and the average gene diversity was 0.344, with a range of 0.201 to 0.492. These results indicate that the 61 KASP markers exhibit sufficient polymorphism (Figure 4). The 61 KASP markers are highly reliable for genetic diversity analysis of A. heimuer germplasm resources.

3.5. Genotyping Validation of KASP Markers

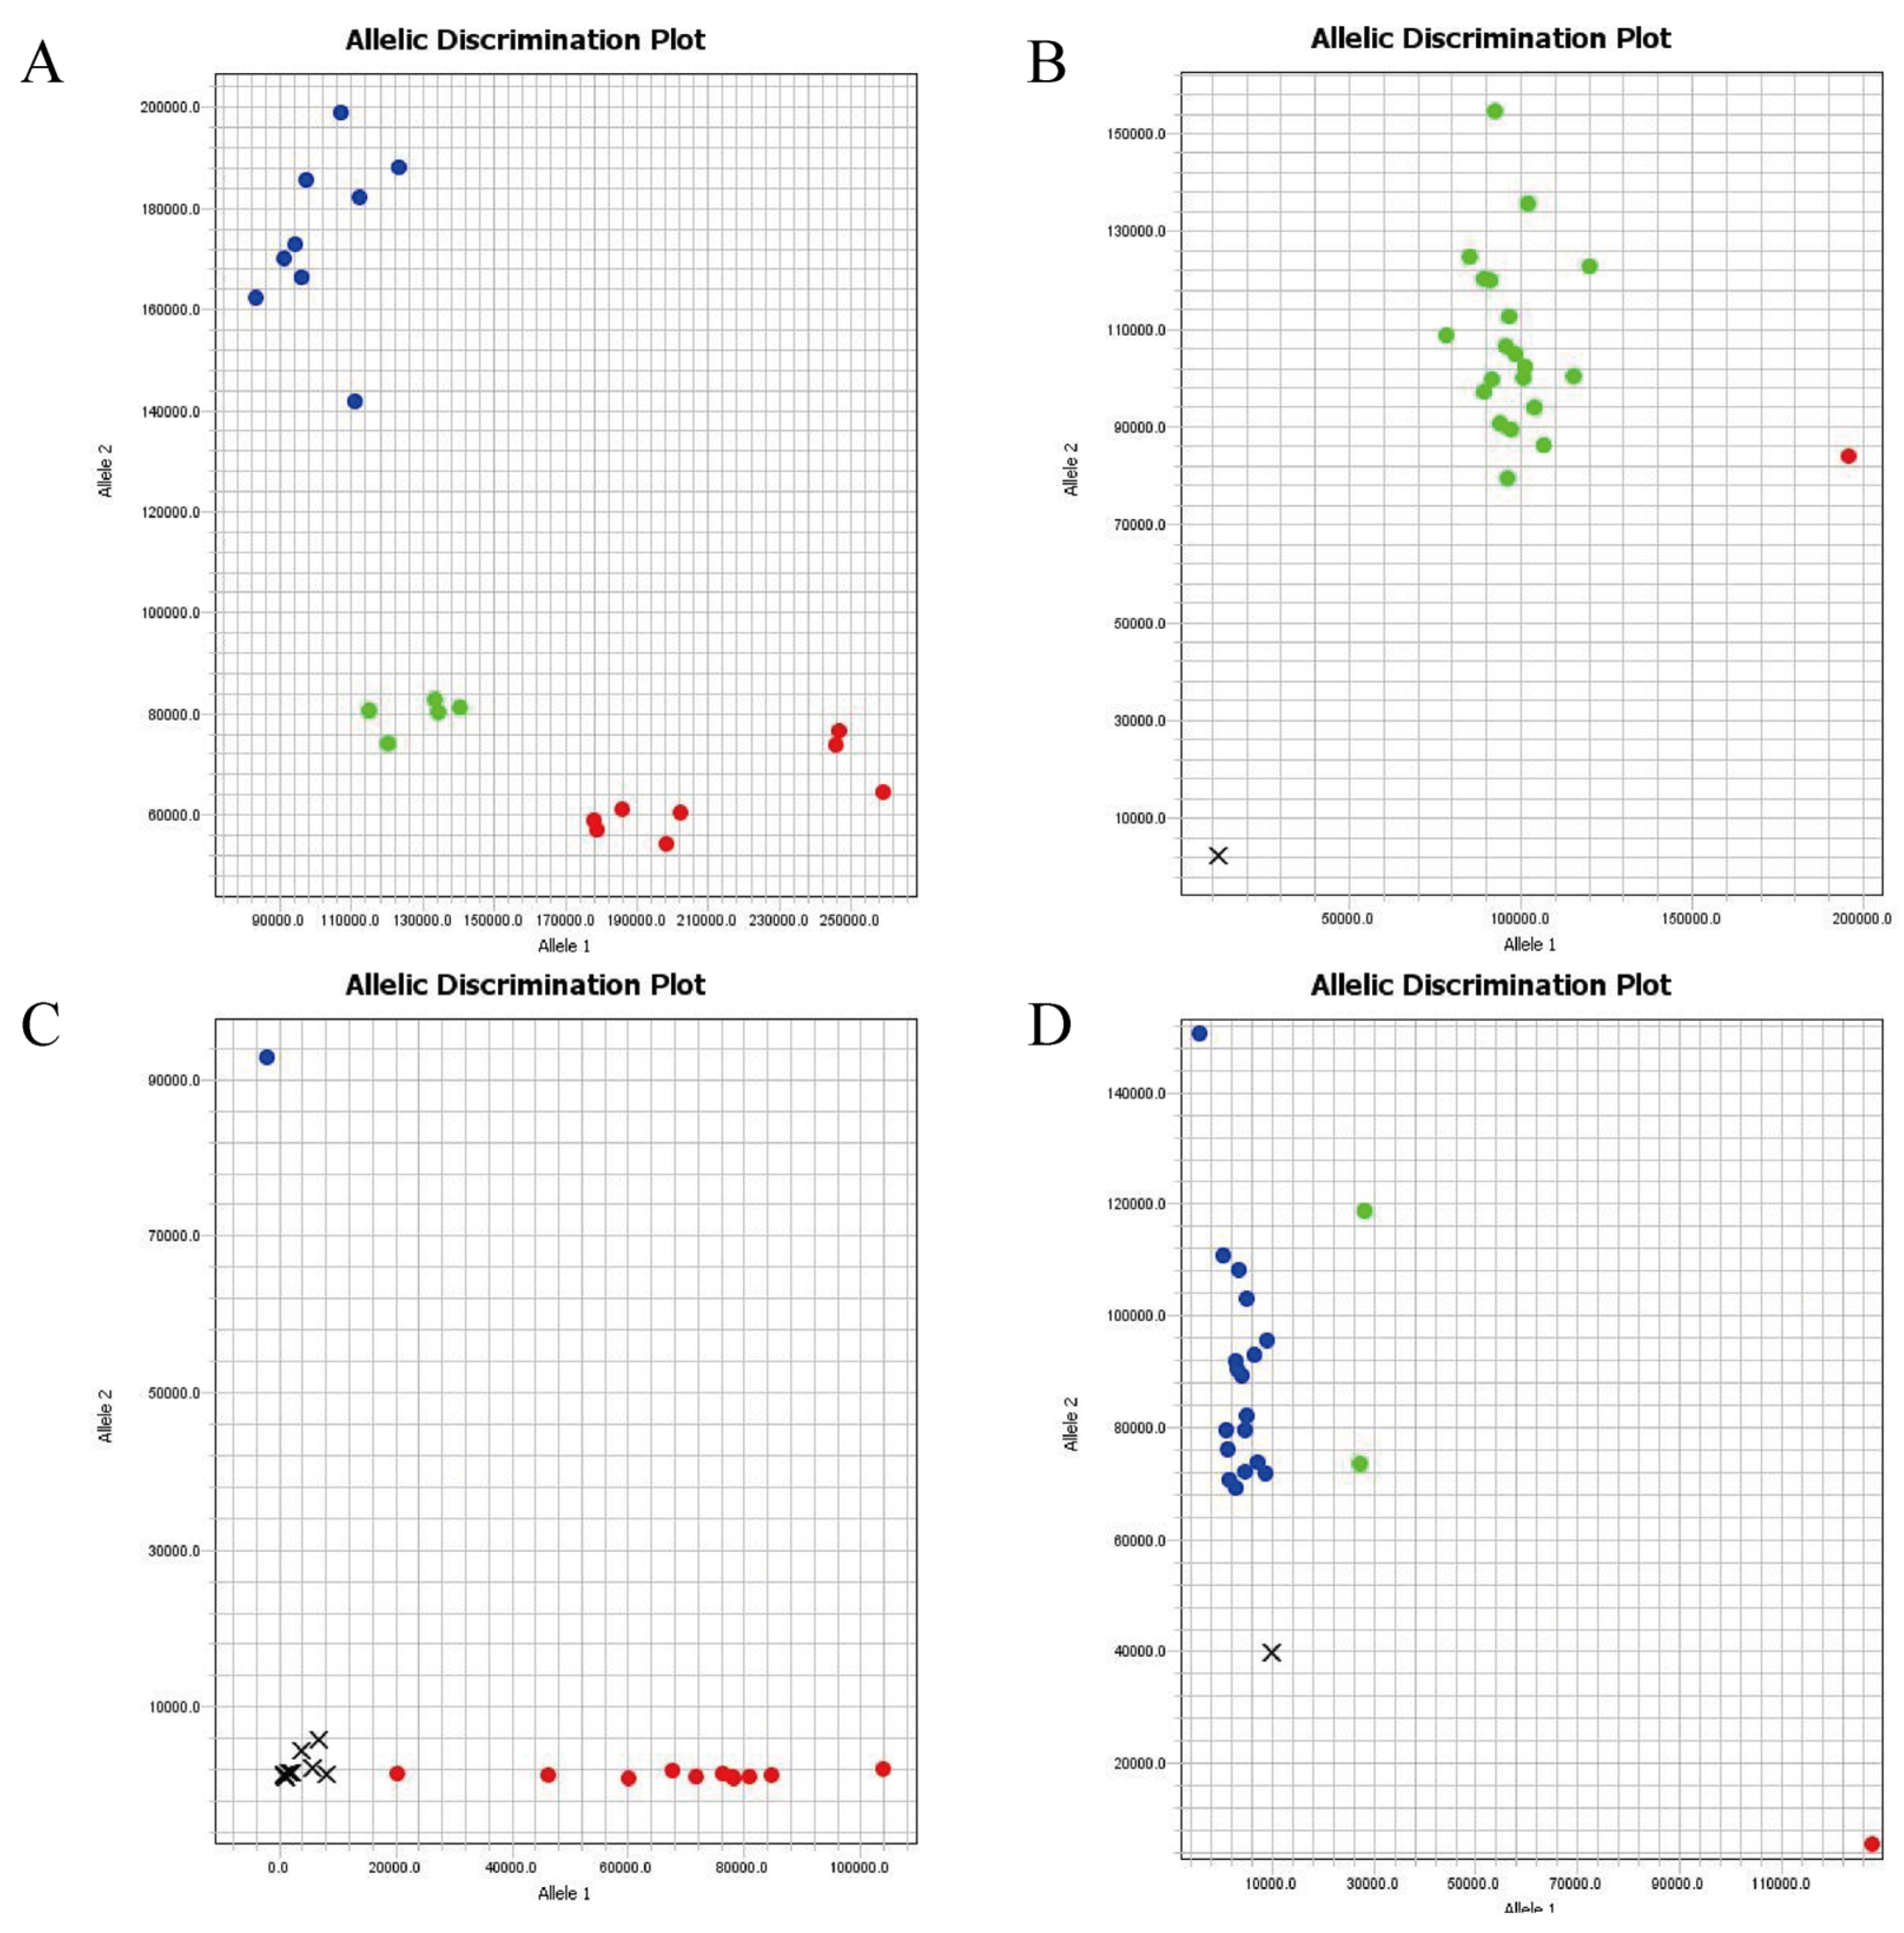
Genotyping validation of the 61 KASP markers was conducted by genotyping 150 A. heimuer germplasms using KASP primers. Based on the genotyping results, 54 high-accuracy KASP markers were selected. Figure 5 shows the genotyping results for some KASP markers, where red and blue dots represent two different homozygous genotypes, and green dots represent heterozygous genotypes. Based on the genotyping results, one marker failed to amplify, and six markers were discarded due to monomorphism or missing rates exceeding 10%. Ultimately, 54 high-quality KASP markers were retained as the core set of KASP markers (Table 1). Table S5 provides detailed information on the 54 KASP markers, including marker names, locations, mutation types, and primer sequences.

3.6. Construction of DNA Fingerprinting

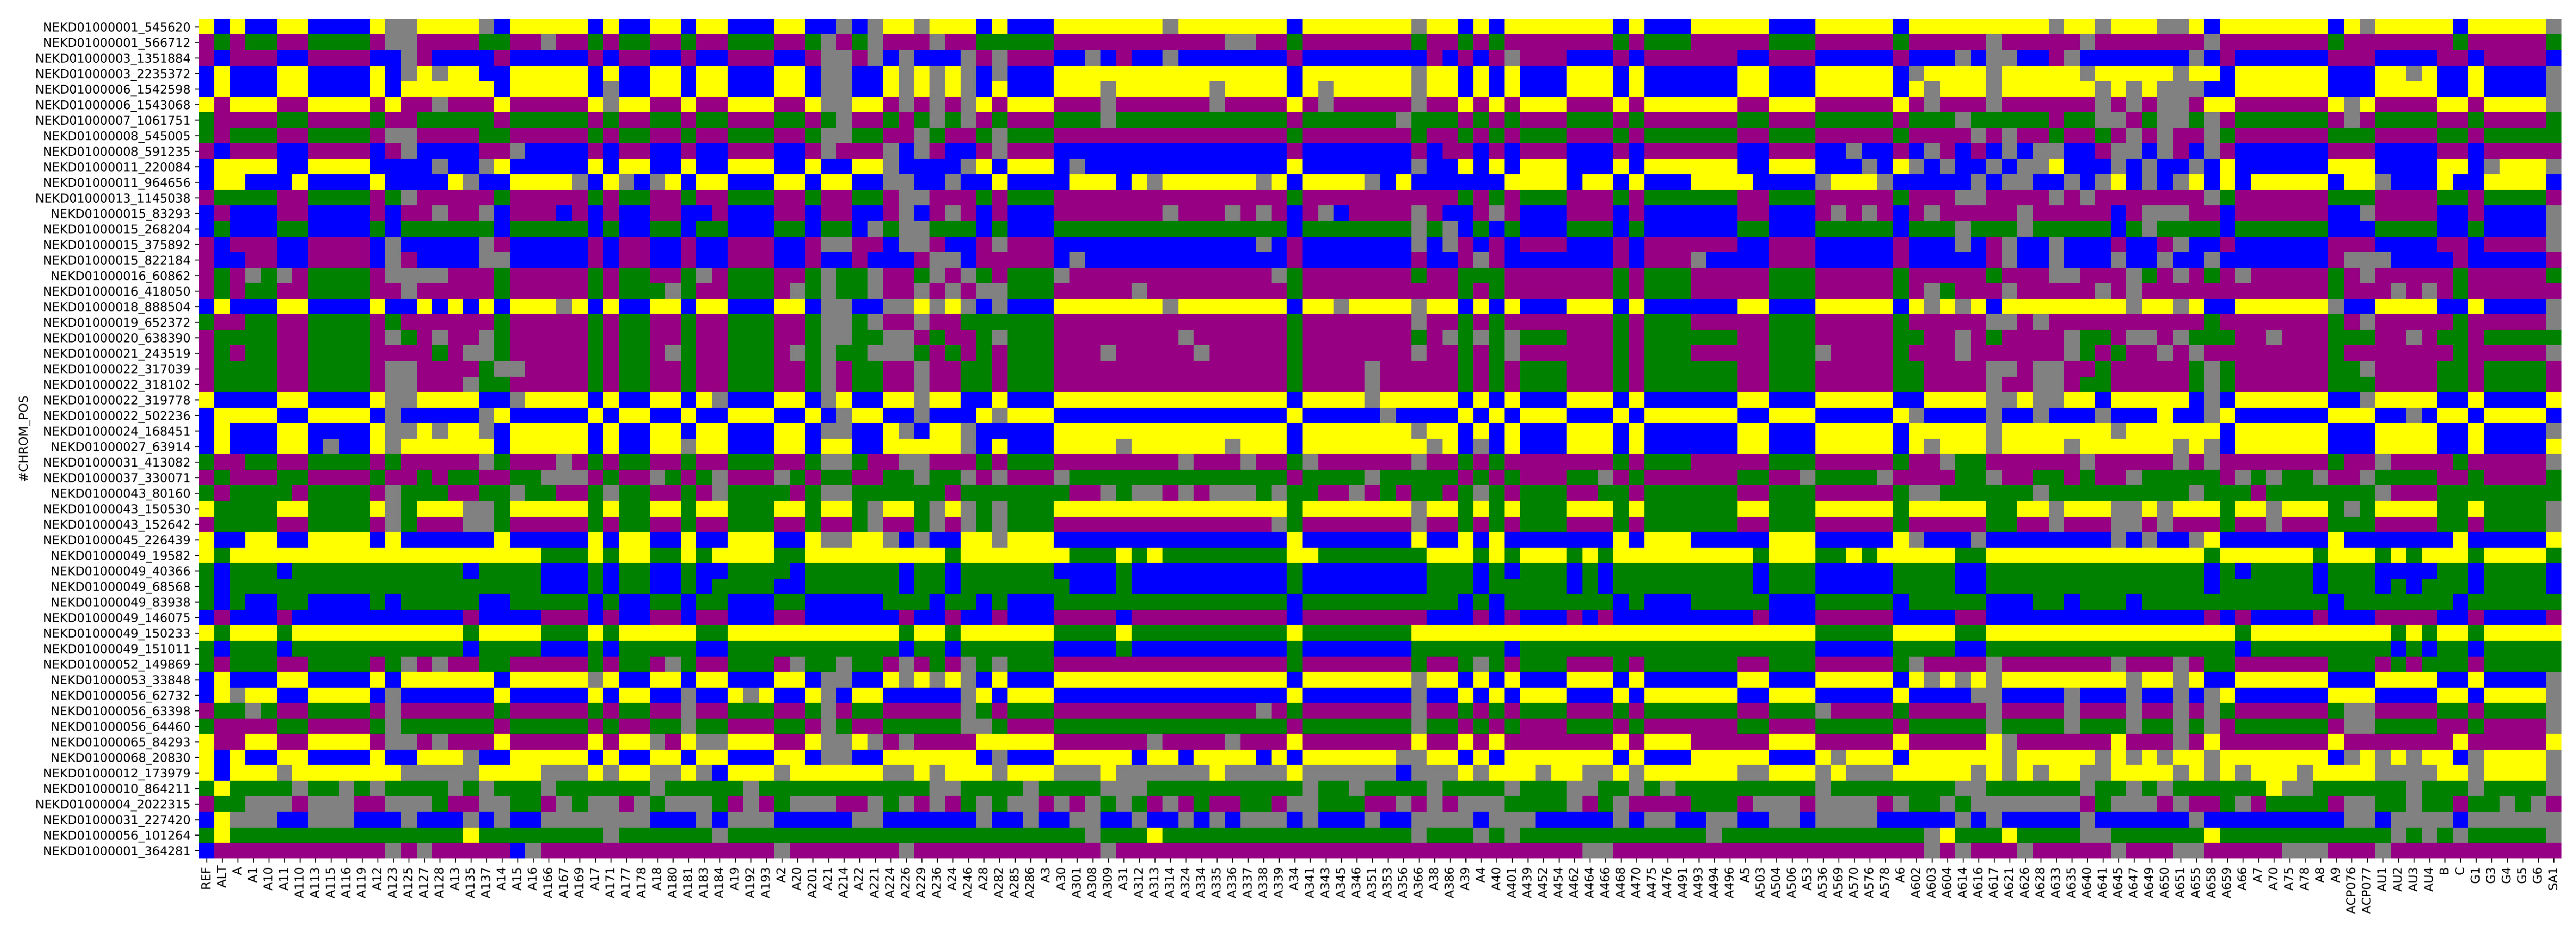
By integrating a custom-developed set of 41 core KASP SNP markers with 150 strains of A. heimuer germplasm, a high-throughput molecular fingerprint database covering genetic diversity was constructed. Additionally, a genotype-based accurate identification system for A. heimuer varieties was established (Figure 6). In this system, each row represents an SNP genotype, and each column represents a sample. Yellow, green, blue, and purple represent nucleotide genotypes C/C, A/A, T/T, and G/G, respectively. Missing data and heterozygous loci are displayed in gray. These 41 KASP markers exhibit high polymorphism, strong identification capability, and can be directly applied for variety genotyping and identification.

4. Discussion

A. heimuer, an important edible and medicinal mushroom, holds significant nutritional value. However, the phenomenon of “nomenclature confusion” in A. heimuer and the lack of accurate identification methods for variety protection have, to some extent, hindered breeding efforts. To better utilize germplasm resources and protect the rights of A. heimuer varieties, it is essential to understand the phylogenetic relationships and population genetic structure of different varieties at the genomic level. With the development of DNA molecular marker technologies, various types of markers, such as RAPD, AFLP, SSR, and SCAR, have been applied to the identification and genetic diversity studies of A. heimuer germplasm resources [29,30,31,32]. However, these markers have gradually been phased out due to their instability and complexity in operation. With the advancement of high-throughput sequencing, single nucleotide polymorphisms (SNPs), due to their stability and high-throughput reproducibility, have become ideal genetic analysis markers. With the application of KASP technology, SNP markers have been widely used in genetic analysis, variety identification, and fingerprint profiling in crops such as potato [33], tomato [34], and cowpea [35]. However, a SNP fingerprinting system for A. heimuer has yet to be established, and there is an urgent need to develop an efficient and accurate fingerprinting platform for the authenticity and population genetic analysis of A. heimuer varieties.
PIC, MAF, gene diversity, and heterozygosity averages of the KASP markers developed in this study were 0.34, 0.35, 0.34, and 0.43, respectively, indicating a high level of genetic information and stability. Compared to traditional SSR markers, SNP markers offer higher coverage and resolution, allowing for a more accurate reflection of the genetic background of germplasm. The successful application of KASP technology has further enhanced the detection efficiency and practicality of SNP markers, providing a powerful tool for the rapid identification of A. heimuer germplasm resources and molecular marker-assisted breeding.
A. heimuer germplasm resources are a crucial material foundation for the breeding of new A. heimuer varieties and genetic theoretical research. China possesses a rich diversity of A. heimuer germplasm resources. Accurate identification of these resources is beneficial for their collection and conservation, as well as for the full development and study of A. heimuer. Genetic analysis of population structure can enhance the integration and utilization efficiency of germplasm resources. Yin et al. [36] analyzed 72 wild A. heimuer strains using 30 pairs of SSR primers, dividing them into six groups and selecting nine core SSR primers to construct a fingerprint profile for A. heimuer, providing important reference information for genetic breeding, germplasm resource conservation, and intelligent management. Furthermore, Jiao et al. [29] studied the genetic diversity and population structure of 52 wild A. heimuer germplasm resources using 13 pairs of EST-SSR primers, dividing them into three groups and discovering that the genetic diversity of A. heimuer from Northeast China was particularly rich. These studies have laid an important foundation for the scientific management and efficient utilization of A. heimuer germplasm resources. In this study, through population structure analysis, principal component analysis, and genetic phylogenetic tree analysis, 150 A. heimuer germplasm samples were divided into five groups. The strains in pop-1 and pop-4 are geographically proximate, which may facilitate gene flow and consequently result in similar genetic structures. This inference is also supported by the population structure plot. Wild strains from the same geographic region exhibited significant geographic clustering characteristics, a result consistent with the findings of Meng [37], suggesting that geographic isolation and environmental adaptability may be the primary factors driving genetic differentiation in A. heimuer. The correlation between geographic distribution and genetic diversity may stem from A. heimuer’s adaptive selection to different ecological environments during long-term evolution, such as variations in temperature, humidity, and substrate types. In addition, the limited natural dispersal ability of wild A. heimuer and geographic isolation may reduce gene flow, thereby intensifying genetic differentiation between populations. This finding provides scientific evidence for the regional protection and utilization of A. heimuer germplasm resources.
In this study, a set of 54 core KASP markers was employed to establish a DNA fingerprinting profile for 150 A. heimuer germplasm accessions, enabling the precise differentiation of all tested samples. These results offer a providing crucial support for the identification of new varieties and the application and protection of plant variety rights. Moreover, by identifying molecular markers associated with target traits, early selection of superior individuals becomes possible, thereby improving breeding efficiency. The genetic information obtained in this study can serve as a reference for future screening of elite germplasm and the design of breeding parent combinations. In the future, as the new A. heimuer germplasm resources in China continue to increase, more SNP markers will need to be integrated, and molecular markers tightly linked to key agronomic traits should be developed. Additionally, combining GWAS and phenotypic data will allow for further identification of genes associated with important agronomic traits in A. heimuer, as well as genes that regulate phenotypic trait variation, to promote the fine mapping of candidate functional regions.
Although this study has made significant progress, there are still some limitations. Firstly, while the sample size covers the major A. heimuer production areas in China, there is still a need to further expand the sample size, especially by increasing the collection of germplasm from peripheral distribution areas and foreign sources, to fully reveal the genetic diversity of A. heimuer. As germplasm resources are more widely collected, the germplasm bank is also continuously expanding, which greatly increases the management costs of the germplasm bank and the difficulty of selecting specific germplasm. At the same time, breeders are unable to effectively evaluate and identify large amounts of genetic material, leading to the loss of germplasm and a reduction in genetic diversity over time [38]. The future development of variety identification technology not only requires accuracy and speed but also demands simplicity and automation. Therefore, using SNP markers to identify varieties of A. heimuer in China’s existing germplasm resources will help screen out redundant germplasm, ensuring the standardization and authenticity of the A. heimuer germplasm bank, while laying a foundation for future genetic breeding efforts. Currently, high-throughput SNP detection for large sample sizes has demonstrated clear advantages. In the future, as the number of varieties increases and SNP markers are further enriched, SNP detection technology will have a broad application prospect in the authentication and specificity identification of new varieties.

5. Conclusions

In this study, a whole-genome resequencing analysis of 150 A. heimuer germplasm samples was conducted, resulting in the identification of 1,202,947 high-quality SNP loci. Furthermore, 54 core KASP markers with good polymorphism were developed. Population structure analysis indicated that the A. heimuer germplasm could be divided into five groups, with genetic diversity significantly correlated with geographic distribution. The DNA fingerprinting constructed based on core KASP markers provides an efficient and accurate technical method for the identification of A. heimuer germplasm resources. The research findings lay an important theoretical foundation for the conservation of A. heimuer germplasm resources, molecular marker-assisted breeding, and the selection of superior varieties, and have significant scientific and practical value.

Supplementary Materials

The following supporting information can be downloaded at https://www.mdpi.com/article/10.3390/agriculture15080884/s1, Figure S1: Sequencing depth distribution map; Table S1: Information of 150 A. heimuer stains; Table S2: Sequencing data statistics; Table S3: Statistical results of sequence comparison; Table S4: SNP number and type of each sample statistics; Table S5: Fifty-four pairs of core marker information.

Author Contributions

F.Y. designed the experiments; L.L. and M.F. revised the manuscript; X.M. guided the experiment; X.S. and Q.F. conducted the formal analysis; K.S. prepared the materials for the experiments, analyzed the data, and wrote the manuscript. All authors have read and agreed to the published version of the manuscript.

Funding

This study was supported by the National Key Research and Development Program of China (No. 2023YFD1201604-4).

Institutional Review Board Statement

Not applicable.

Data Availability Statement

The data presented in this study are available in the article and Supplementary Materials.

Acknowledgments

The authors thank the reviewers for their valuable suggestions.

Conflicts of Interest

The authors declare no conflicts of interest.

References

  1. Wu, F.; Yuan, Y.; Malysheva, V.F.; Du, P.; Dai, Y.-C. Species clarification of the most important and cultivated Auricularia mushroom “Heimuer”: Evidence from morphological and molecular data. Phytotaxa 2014, 186, 241–253. [Google Scholar] [CrossRef]
  2. Islam, T.; Yao, F.; Kang, W.; Lu, L.; Xu, B. A systematic study on mycochemical profiles, antioxidant, and anti-inflammatory activities of 30 varieties of Jew’s ear (Auricularia auricula-judae). Food Sci. Hum. Wellness 2022, 11, 781–794. [Google Scholar] [CrossRef]
  3. Xu, S.; Zhang, Y.; Jiang, K. Antioxidant activity in vitro and in vivo of the polysaccharides from different varieties of Auricularia auricula. Food Funct. 2016, 7, 3868–3879. [Google Scholar] [CrossRef] [PubMed]
  4. Islam, T.; Yu, X.; Xu, B. Phenolic profiles, antioxidant capacities and metal chelating ability of edible mushrooms commonly consumed in China. LWT-Food Sci. Technol. 2016, 72, 423–431. [Google Scholar] [CrossRef]
  5. Yoon, S.-J.; Yu, M.-A.; Pyun, Y.-R.; Hwang, J.-K.; Chu, D.-C.; Juneja, L.R.; Mourão, P.A.S. The nontoxic mushroom Auricularia auricula contains a polysaccharide with anticoagulant activity mediated by antithrombin. Thromb. Res. 2003, 112, 151–158. [Google Scholar] [CrossRef]
  6. Yao, F.; Zhang, Y.; Lu, L.; Fang, M. Research progress on genetics and breeding of Auricularia auricula-judae. J. Fungal Res. 2015, 13, 125–128+122. [Google Scholar] [CrossRef]
  7. Oliveira, M.; Azevedo, L. Molecular Markers: An Overview of Data Published for Fungi over the Last Ten Years. J. Fungi 2022, 8, 803. [Google Scholar] [CrossRef] [PubMed]
  8. Kumar, R.; Das, S.P.; Choudhury, B.U.; Kumar, A.; Prakash, N.R.; Verma, R.; Chakraborti, M.; Devi, A.G.; Bhattacharjee, B.; Das, R.; et al. Advances in genomic tools for plant breeding: Harnessing DNA molecular markers, genomic selection, and genome editing. Biol. Res. 2024, 57, 80. [Google Scholar] [CrossRef]
  9. Tsykun, T.; Rellstab, C.; Dutech, C.; Sipos, G.; Prospero, S. Comparative assessment of SSR and SNP markers for inferring the population genetic structure of the common fungus Armillaria cepistipes. Heredity 2017, 119, 371–380. [Google Scholar] [CrossRef]
  10. Li, H.; Shi, L.; Tang, W.; Xia, W.; Zhong, Y.; Xu, X.; Xie, B.; Tao, Y. Comprehensive Genetic Analysis of Monokaryon and Dikaryon Populations Provides Insight Into Cross-Breeding of Flammulina filiformis. Front. Microbiol. 2022, 13, 887259. [Google Scholar] [CrossRef]
  11. Jördens, R. Progress of plant variety protection based on the International Convention for the Protection of New Varieties of Plants (UPOV Convention). World Pat. Inf. 2005, 27, 232–243. [Google Scholar] [CrossRef]
  12. Dipta, B.; Sood, S.; Mangal, V.; Bhardwaj, V.; Thakur, A.K.; Kumar, V.; Singh, B. KASP: A high-throughput genotyping system and its applications in major crop plants for biotic and abiotic stress tolerance. Mol. Biol. Rep. 2024, 51, 508. [Google Scholar] [CrossRef] [PubMed]
  13. Semagn, K.; Babu, R.; Hearne, S.; Olsen, M. Single nucleotide polymorphism genotyping using Kompetitive Allele Specific PCR (KASP): Overview of the technology and its application in crop improvement. Mol. Breed. 2014, 33, 1–14. [Google Scholar] [CrossRef]
  14. Wang, F.-q.; Fan, X.-c.; Zhang, Y.; Sun, L.; Liu, C.-h.; Jiang, J.-f. Establishment and application of an SNP molecular identification system for grape cultivars. J. Integr. Agric. 2022, 21, 1044–1057. [Google Scholar] [CrossRef]
  15. Yang, Y.; Lyu, M.; Liu, J.; Wu, J.; Wang, Q.; Xie, T.; Li, H.; Chen, R.; Sun, D.; Yang, Y.; et al. Construction of an SNP fingerprinting database and population genetic analysis of 329 cauliflower cultivars. BMC Plant Biol. 2022, 22, 522. [Google Scholar] [CrossRef]
  16. Wang, Y.; Lv, H.; Xiang, X.; Yang, A.; Feng, Q.; Dai, P.; Li, Y.; Jiang, X.; Liu, G.; Zhang, X. Construction of a SNP Fingerprinting Database and Population Genetic Analysis of Cigar Tobacco Germplasm Resources in China. Front. Plant Sci. 2021, 12, 618133. [Google Scholar] [CrossRef]
  17. Grewal, S.; Hubbart-Edwards, S.; Yang, C.; Devi, U.; Baker, L.; Heath, J.; Ashling, S.; Scholefield, D.; Howells, C.; Yarde, J.; et al. Rapid identification of homozygosity and site of wild relative introgressions in wheat through chromosome-specific KASP genotyping assays. Plant Biotechnol. J. 2020, 18, 743–755. [Google Scholar] [CrossRef]
  18. Tang, W.; Lin, J.; Wang, Y.; An, H.; Chen, H.; Pan, G.; Zhang, S.; Guo, B.; Yu, K.; Li, H.; et al. Selection and Validation of 48 KASP Markers for Variety Identification and Breeding Guidance in Conventional and Hybrid Rice (Oryza sativa L.). Rice 2022, 15, 48. [Google Scholar] [CrossRef]
  19. Zhang, J.; Yang, J.; Zhang, L.; Luo, J.; Zhao, H.; Zhang, J.; Wen, C. A new SNP genotyping technology Target SNP-seq and its application in genetic analysis of cucumber varieties. Sci. Rep. 2020, 10, 5623, Erratum in Sci. Rep. 2021, 11, 8010. https://doi.org/10.1038/s41598-021-86981-x. [Google Scholar] [CrossRef]
  20. Diao, B.; Xu, Z.; Liu, M.; Zhang, G.; Wang, G.; Zhang, Y.; Tian, X. Establishment and application of a SNP molecular identification system in Grifola frondosa. Front. Microbiol. 2024, 15, 1417014. [Google Scholar] [CrossRef] [PubMed]
  21. Zhou, X.; Li, Q.; Zhao, J.; Tang, K.; Lin, J.; Yin, Y. Comparison of rapid DNA extraction methods applied to PCR identification of medicinal mushroom Ganoderma spp. Prep. Biochem. Biotechnol. 2007, 37, 369–380. [Google Scholar] [CrossRef] [PubMed]
  22. Li, H.; Durbin, R. Fast and accurate short read alignment with Burrows–Wheeler transform. Bioinformatics 2009, 25, 1754–1760. [Google Scholar] [CrossRef]
  23. McKenna, A.; Hanna, M.; Banks, E.; Sivachenko, A.; Cibulskis, K.; Kernytsky, A.; Garimella, K.; Altshuler, D.; Gabriel, S.; Daly, M.; et al. The Genome Analysis Toolkit: A MapReduce framework for analyzing next-generation DNA sequencing data. Genome Res. 2010, 20, 1297–1303. [Google Scholar] [CrossRef] [PubMed]
  24. Danecek, P.; Auton, A.; Abecasis, G.; Albers, C.A.; Banks, E.; DePristo, M.A.; Handsaker, R.E.; Lunter, G.; Marth, G.T.; Sherry, S.T.; et al. The variant call format and VCFtools. Bioinformatics 2011, 27, 2156–2158. [Google Scholar] [CrossRef]
  25. Kumar, S.; Stecher, G.; Tamura, K. MEGA7: Molecular Evolutionary Genetics Analysis Version 7.0 for Bigger Datasets. Mol. Biol. Evol. 2016, 33, 1870–1874. [Google Scholar] [CrossRef]
  26. Xu, C.; Ren, Y.; Jian, Y.; Guo, Z.; Zhang, Y.; Xie, C.; Fu, J.; Wang, H.; Wang, G.; Xu, Y.; et al. Development of a maize 55 K SNP array with improved genome coverage for molecular breeding. Mol. Breed. 2017, 37, 20. [Google Scholar] [CrossRef] [PubMed]
  27. Wang, M.L.; Zhu, C.; Barkley, N.A.; Chen, Z.; Erpelding, J.E.; Murray, S.C.; Tuinstra, M.R.; Tesso, T.; Pederson, G.A.; Yu, J. Genetic diversity and population structure analysis of accessions in the US historic sweet sorghum collection. Theor. Appl. Genet. 2009, 120, 13–23. [Google Scholar] [CrossRef]
  28. Cibulskis, K.; McKenna, A.; Fennell, T.; Banks, E.; DePristo, M.; Getz, G. ContEst: Estimating cross-contamination of human samples in next-generation sequencing data. Bioinformatics 2011, 27, 2601–2602. [Google Scholar] [CrossRef]
  29. Jiao, L.; Han, C.; Zhu, J.; Zhang, P.; Ma, Y.; Dai, X.; Zhang, Y. Transcriptome analysis and development of EST-SSR markers in the mushroom Auricularia heimuer. Sci. Rep. 2024, 14, 12340. [Google Scholar] [CrossRef]
  30. Sun, X.; Yang, C.; Ma, Y.; Zhang, J.; Wang, L. Research progress of Auricularia heimuer on cultivation physiology and molecular biology. Front. Microbiol. 2022, 13, 1048249. [Google Scholar] [CrossRef]
  31. Du, P.; Cui, B.-K.; Zhang, C.-F.; Dai, Y.-C. Genetic diversity of wild Auricularia auricula-judae revealed by ISSR analysis. Biochem. Syst. Ecol. 2013, 48, 199–205. [Google Scholar] [CrossRef]
  32. Yao, F.-J.; Lu, L.-X.; Wang, P.; Fang, M.; Zhang, Y.-M.; Chen, Y.; Zhang, W.-T.; Kong, X.-H.; Lu, J.; Honda, Y. Development of a Molecular Marker for Fruiting Body Pattern in Auricularia auricula-judae. Mycobiology 2018, 46, 72–78. [Google Scholar] [CrossRef]
  33. Gazendam, I.; Mojapelo, P.; Bairu, M.W. Potato Cultivar Identification in South Africa Using a Custom SNP Panel. Plants 2022, 11, 1546. [Google Scholar] [CrossRef] [PubMed]
  34. Xu, W.; Gong, C.; Mai, P.; Li, Z.; Sun, B.; Li, T. Genetic diversity and population structure analysis of 418 tomato cultivars based on single nucleotide polymorphism markers. Front. Plant Sci. 2024, 15, 1445734. [Google Scholar] [CrossRef]
  35. Ongom, P.O.; Fatokun, C.; Togola, A.; Salvo, S.; Oyebode, O.G.; Ahmad, M.S.; Jockson, I.D.; Bala, G.; Boukar, O. Molecular Fingerprinting and Hybridity Authentication in Cowpea Using Single Nucleotide Polymorphism Based Kompetitive Allele-Specific PCR Assay. Front. Plant Sci. 2021, 12, 734117. [Google Scholar] [CrossRef]
  36. Yin, L.; Yao, F.; Shi, C.; Lu, L.; Wang, T.; Liu, W. Genetic diversity of wild Auricularia heimuer germplasm resources based on SSR markers. Acta Edulis Fungi 2022, 29, 1–9. [Google Scholar] [CrossRef]
  37. Meng, Q.; Xie, Z.; Jiang, Z.; Xu, H.; Guo, J.; Li, Y.; Wang, C.; Hu, Z.; Yan, S.; Liu, H. Population genetic structure analysis of the wild esculenta clade (yellow morels) of Morchella spp. in Qinghai. Mycosystema 2021, 40, 1328–1342+1370–1372. [Google Scholar] [CrossRef]
  38. Lee, Y.-J.; Mun, J.-H.; Jeong, Y.-M.; Joo, S.-H.; Yu, H.-J. Assembly of a radish core collection for evaluation and preservation of genetic diversity. Hortic. Environ. Biotechnol. 2018, 59, 711–721. [Google Scholar] [CrossRef]
Figure 1. Sequencing depth and coverage of 150 A. heimuer strains. (A) Distribution of sequencing depths of the strains. (B) Proportion of accumulated bases at different sequencing depths.
Agriculture 15 00884 g001
Figure 2. A. heimuer genome SNP analysis. (A) The number of different types of SNPs in the coding regions. (B) The number of SNPs in different genomic regions. (C) SNP density distribution across each chromosome. The x-axis represents chromosome length, while the y-axis represents the number of chromosomes. Different colors represent the number of SNPs in different regions.
Agriculture 15 00884 g002
Figure 3. Genetic analysis of 150 A. heimuer germplasm based on SNP polymorphic sites. (A) Phylogenetic tree of 150 A. heimuer strains. (B) Principal component analysis (PCA). (C) Cross-validation error rates corresponding to different K values. (D) Population structure analysis. Note: The populations are represented with consistent colors in (A,D), facilitating comparison of the performance of each population across different analyses.
Agriculture 15 00884 g003
Figure 4. Genetic information content based on 61 KASP markers. (A) PIC. (B) MAF. (C) Heterozygosity. (D) Genetic diversity.
Agriculture 15 00884 g004
Figure 5. Fluorescence determination results of representative KASP markers. (A) KASP marker with good genotyping. (B) KASP marker with heterozygous monomorphic pattern. (C) KASP marker with monomorphic pattern and high missing rate. (D) KASP marker with homozygous monomorphic pattern. Note: Red dots (homozygous type 1), blue dots (homozygous type 2), green dots (heterozygous type) and black “×” (negative control).
Agriculture 15 00884 g005
Figure 6. Fingerprint profile of 150 strains of A. heimuer germplasm. Each row represents an SNP locus, and each column represents a sample. Yellow, green, blue, and purple represent nucleotide genotypes C/C, A/A, T/T, and G/G, respectively. Missing and heterozygous data are displayed in gray.
Agriculture 15 00884 g006
Table 1. Information of 54 pairs of core KASP primers. Note: Ref = reference allele; Alt = alternative allele; PIC = polymorphism information content; MAF = minor allele frequency.
Marker IDPositionRefAltPICMAFHeterozygosityGene Diversity
rs1545,620CT0.3200.2760.3990.200
rs2566,712GA0.3210.2790.4020.201
rs31,351,884GT0.3630.3920.4770.238
rs42,235,372TC0.3630.3900.4760.338
rs51,542,598TC0.3640.3950.4780.239
rs61,543,068CG0.3630.3920.4770.238
rs71,061,751AG0.3620.3880.4750.237
rs8545,005AG0.3650.4030.4810.241
rs9591,235GT0.3720.4500.4950.447
rs10220,084TC0.3600.3810.4720.236
rs11964,656TC0.3750.4790.4990.450
rs121,145,038GA0.3540.3590.4600.230
rs1383,293TG0.3680.4200.4870.244
rs14268,204TA0.3550.3620.4620.231
rs15375,892GT0.3650.4030.4810.241
rs16822,184GT0.3310.2990.4190.309
rs1760,862GA0.3420.3230.4370.219
rs18418,050GA0.3240.2840.4070.203
rs19888,504TC0.3670.4140.4850.243
rs20652,372AG0.3210.2790.4020.301
rs21638,390GA0.3730.4550.4960.448
rs22243,519GA0.3380.3150.4320.216
rs23317,039GA0.3610.3850.4730.237
rs24318,102GA0.3640.3960.4780.239
rs25319,778CT0.3630.3920.4770.238
rs26502,236TC0.3570.3700.4660.233
rs27168,451TC0.3600.3800.4710.236
rs2863,914TC0.3530.3540.4570.229
rs29413,082AG0.3240.2830.4060.203
rs30330,071GA0.3730.4580.4970.248
rs3180,160AG0.3290.2940.4150.207
rs32150,530CA0.3610.3850.4730.237
rs33152,642GA0.3630.3920.4770.238
rs34226,439CT0.3290.2930.4150.207
rs3519,582CA0.3320.3000.4200.210
rs3640,366AT0.3580.3730.4680.234
rs3768,568AT0.3430.3270.4400.220
rs3883,938AT0.3290.2930.4150.207
rs39146,075TG0.3620.3870.4740.437
rs40150,233CA0.3220.2800.4030.202
rs41151,011AT0.3250.2870.4090.204
rs42149,869AG0.3700.4300.4900.245
rs4333,848TC0.3590.3750.4690.234
rs4462,732TC0.3510.3470.4530.227
rs4563,398GA0.3510.3480.4540.227
rs4664,460AG0.3480.3390.4480.224
rs4784,293CG0.3350.3070.4250.213
rs4820,830CT0.3390.3170.4330.217
rs49173,979CT0.2490.2770.2920.246
rs50864,211AC0.1280.4220.1370.269
rs512,022,315GA0.3750.4890.5000.250
rs52227,420TC0.2510.3930.2950.247
rs53101,264AC0.1240.2770.1330.266
rs54364,281TG0.0930.2930.0980.249
Disclaimer/Publisher’s Note: The statements, opinions and data contained in all publications are solely those of the individual author(s) and contributor(s) and not of MDPI and/or the editor(s). MDPI and/or the editor(s) disclaim responsibility for any injury to people or property resulting from any ideas, methods, instructions or products referred to in the content.