
Real-Time Monitoring of Particulate Matter (PM10 and PM2.5) Emitted from Paddy Fields in South Korea: A One-Year Study


Abstract
:1. Introduction
2. Materials and Methods
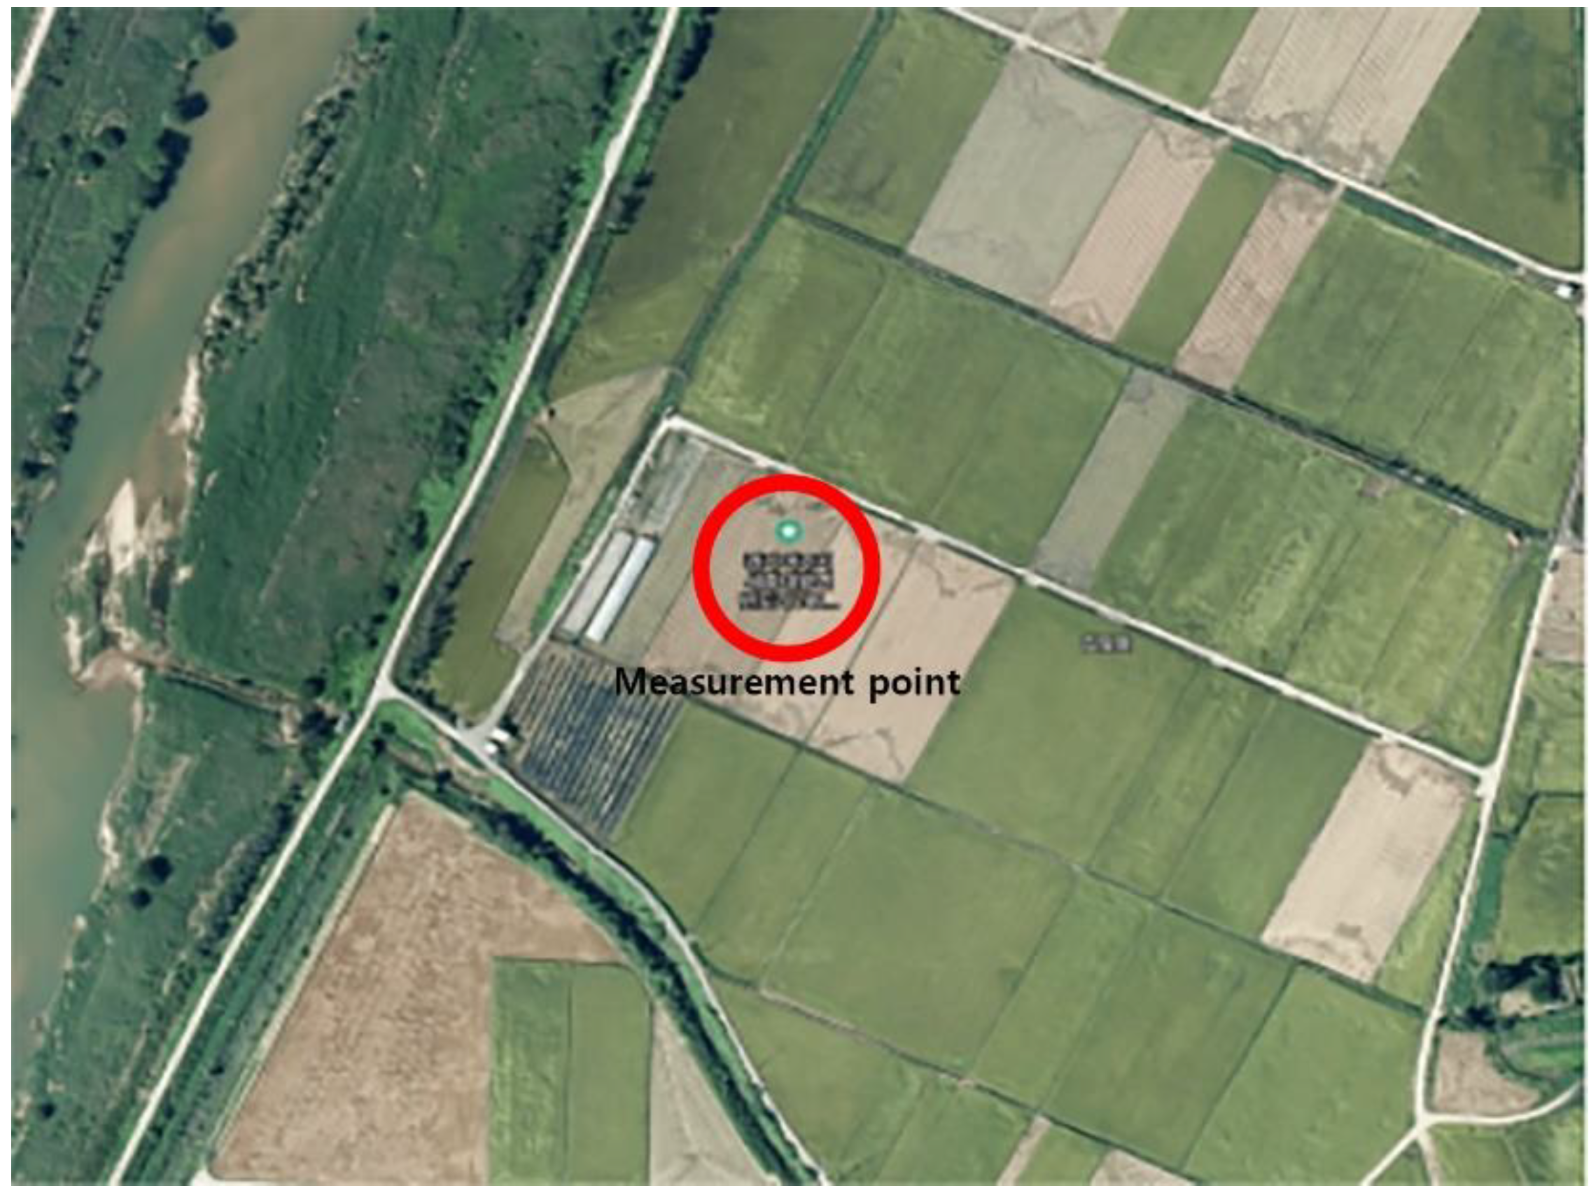
2.1. Subject
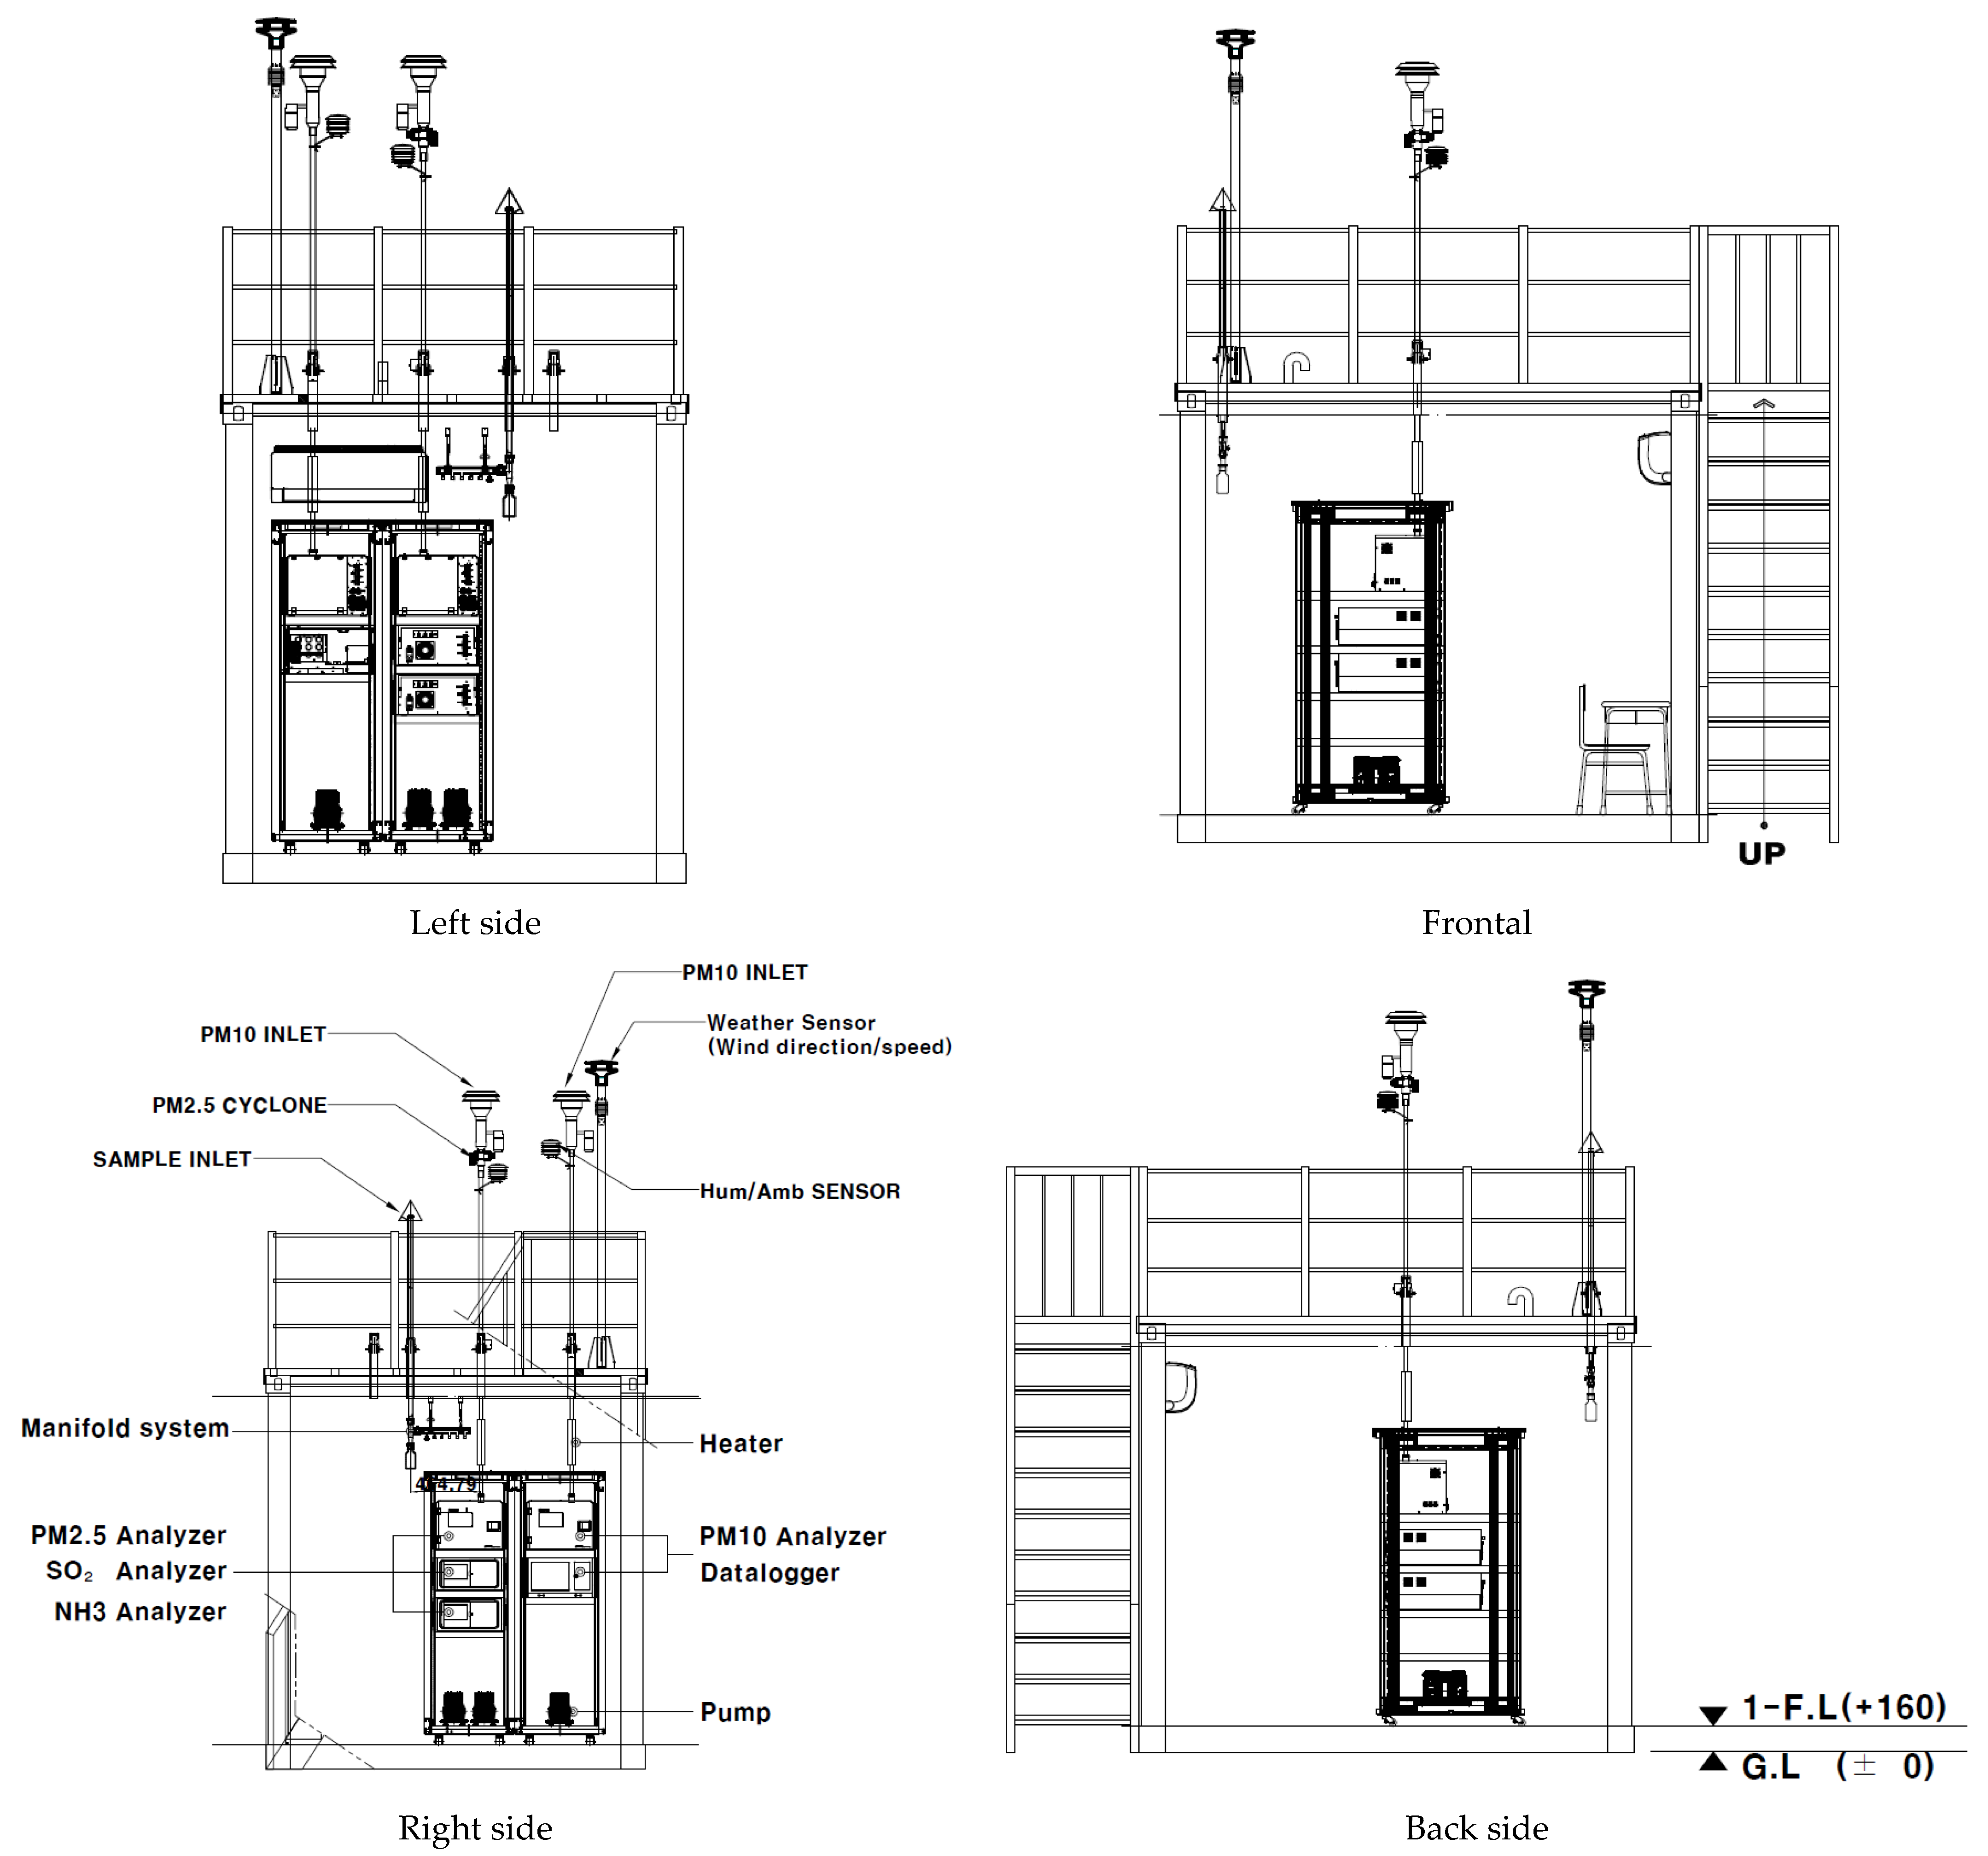
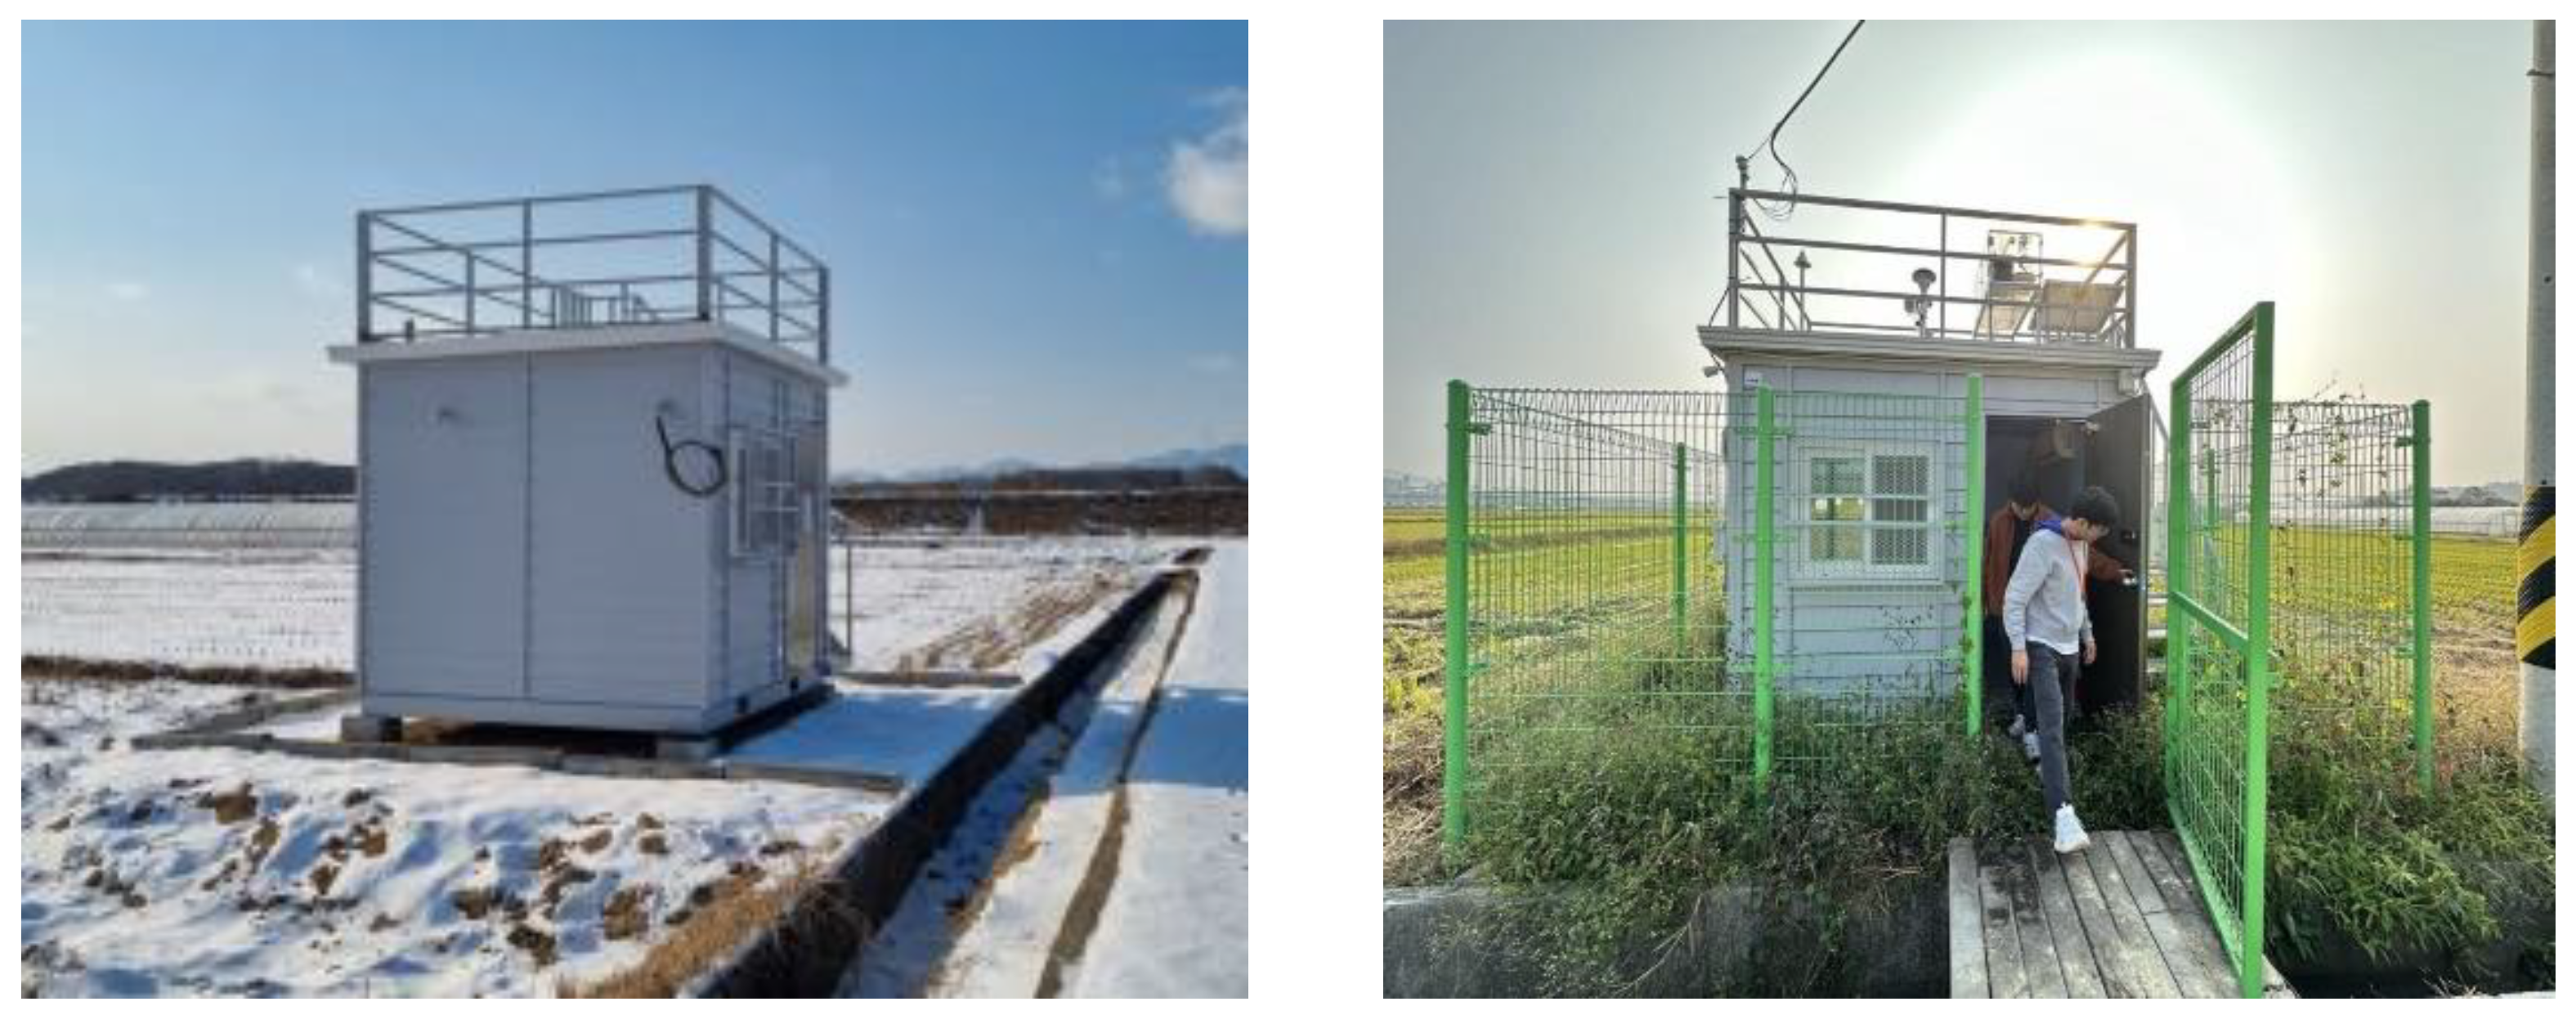
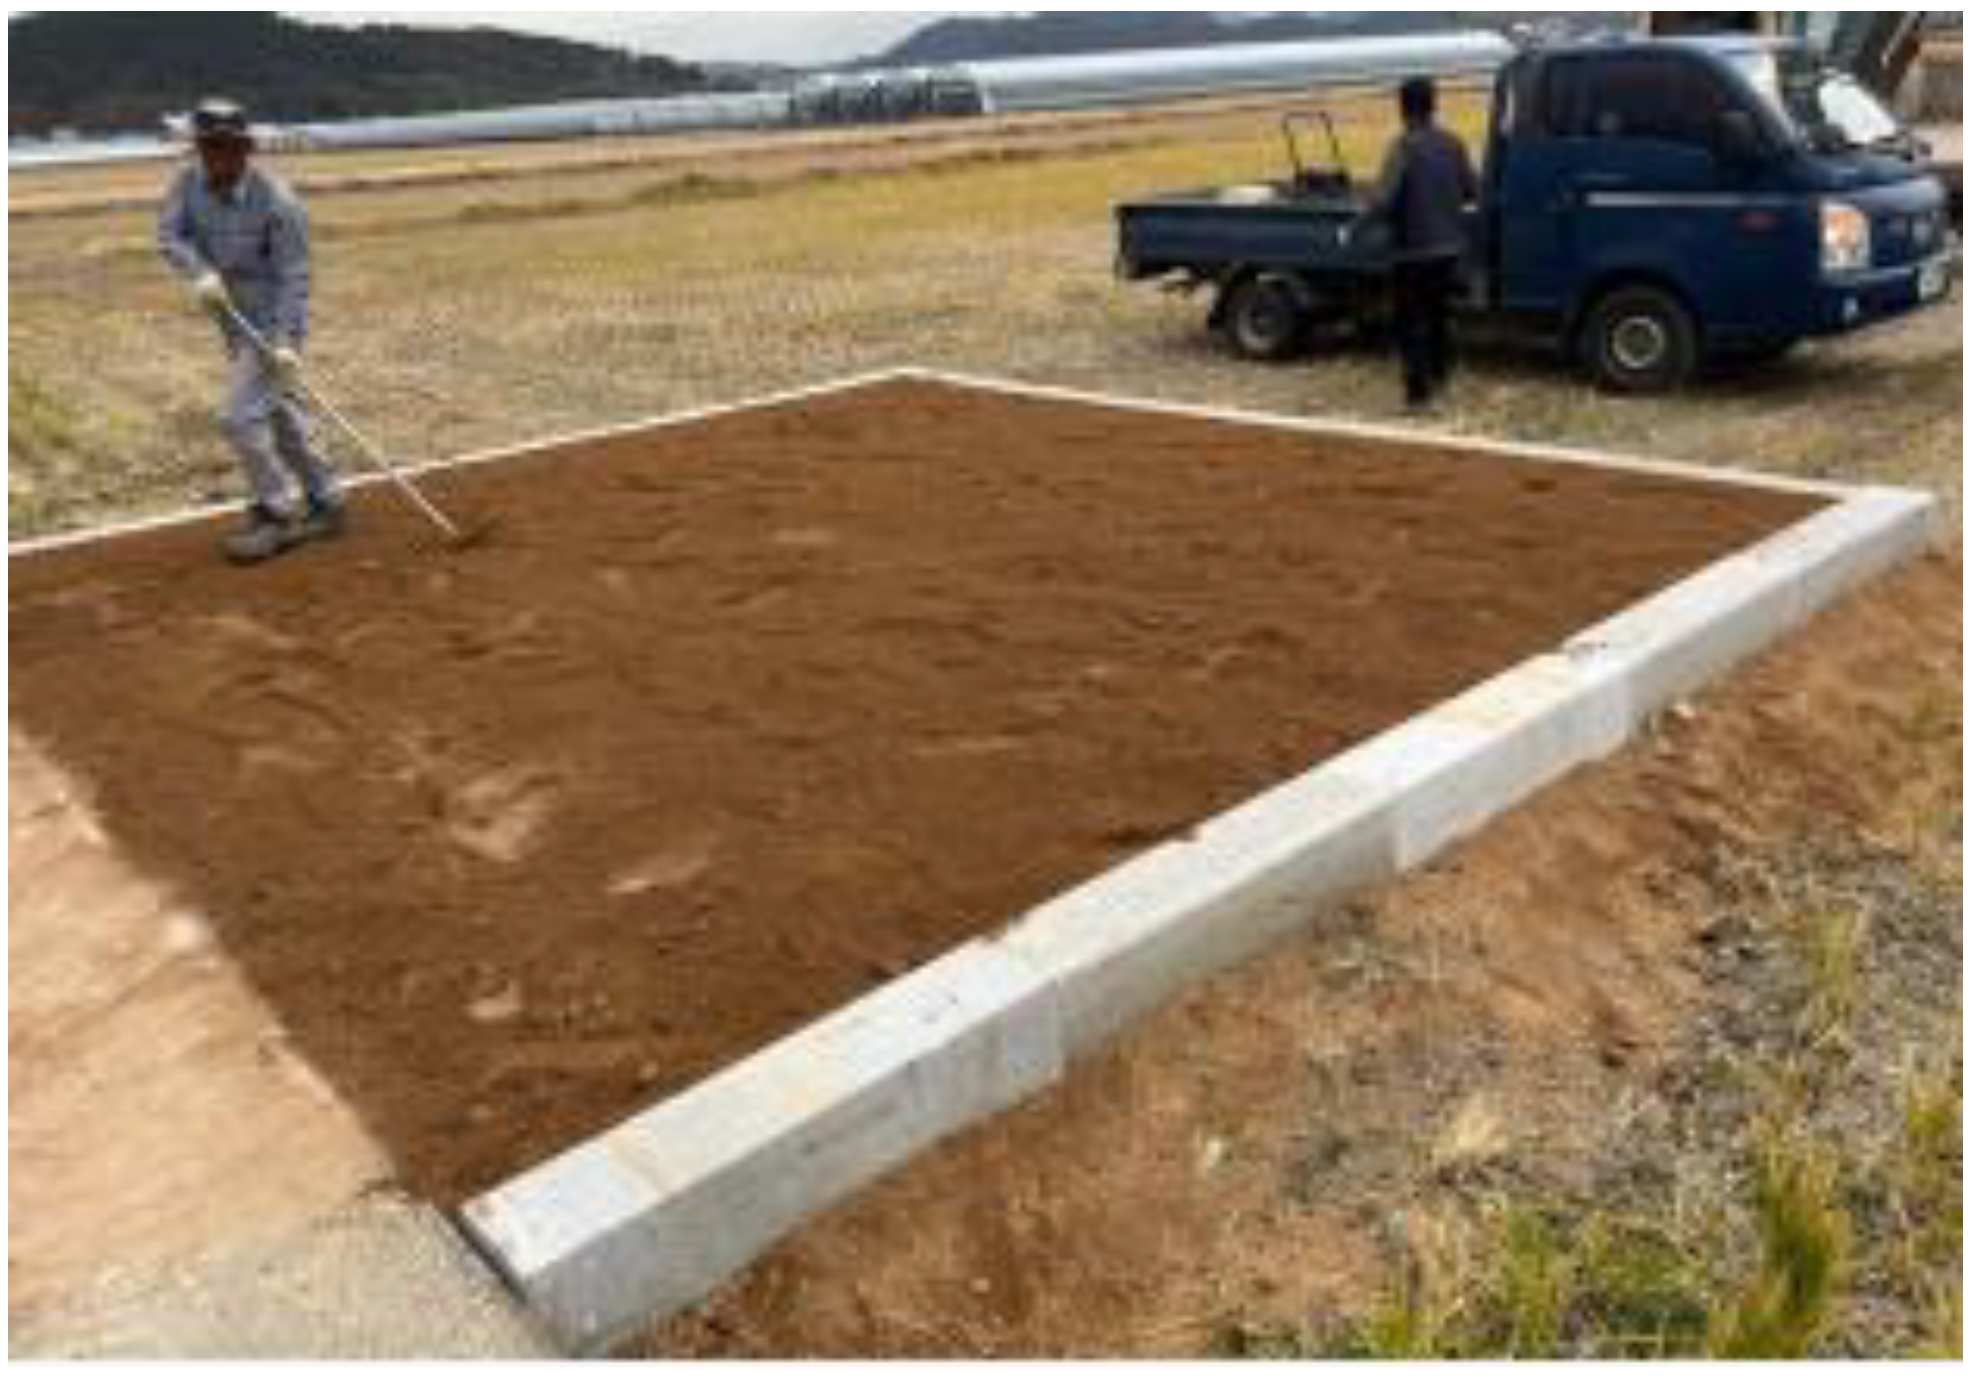
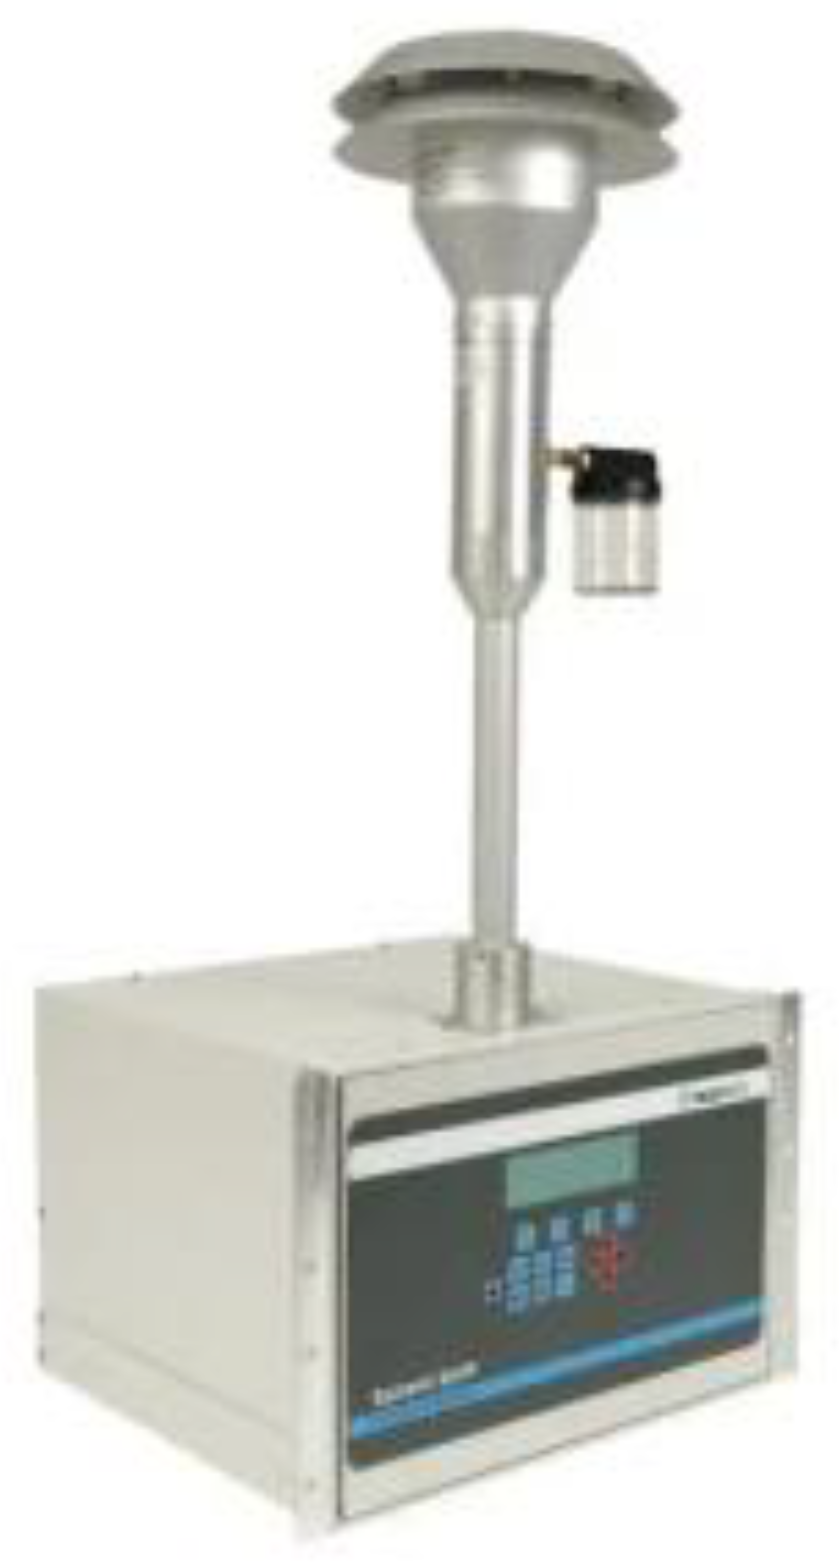
2.2. Method
2.3. Data Analysis
3. Results
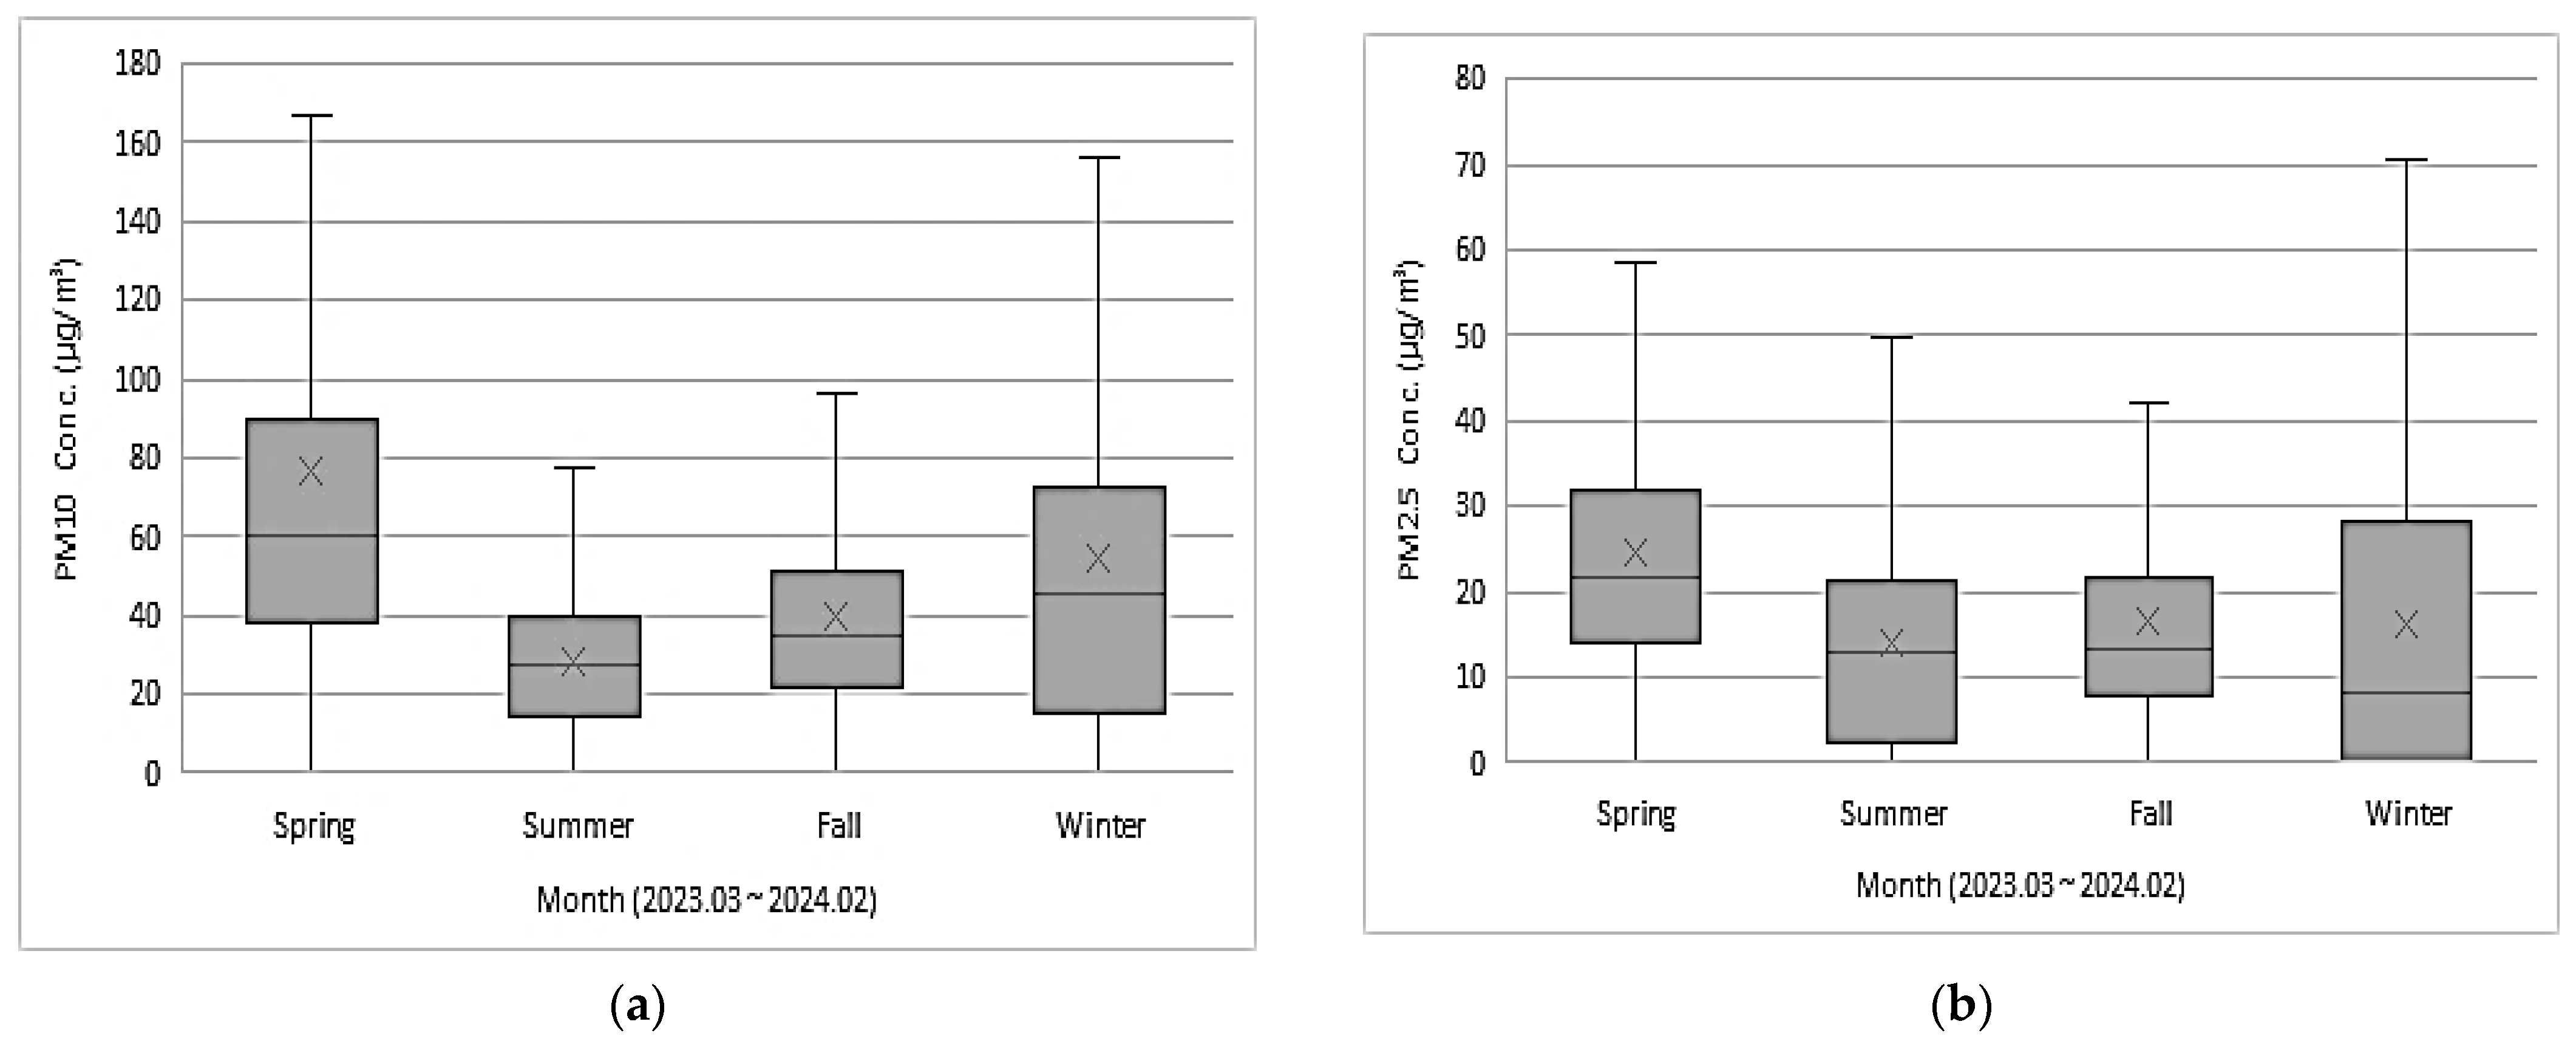
3.1. Seasonal Concentrations of PM10 and PM2.5
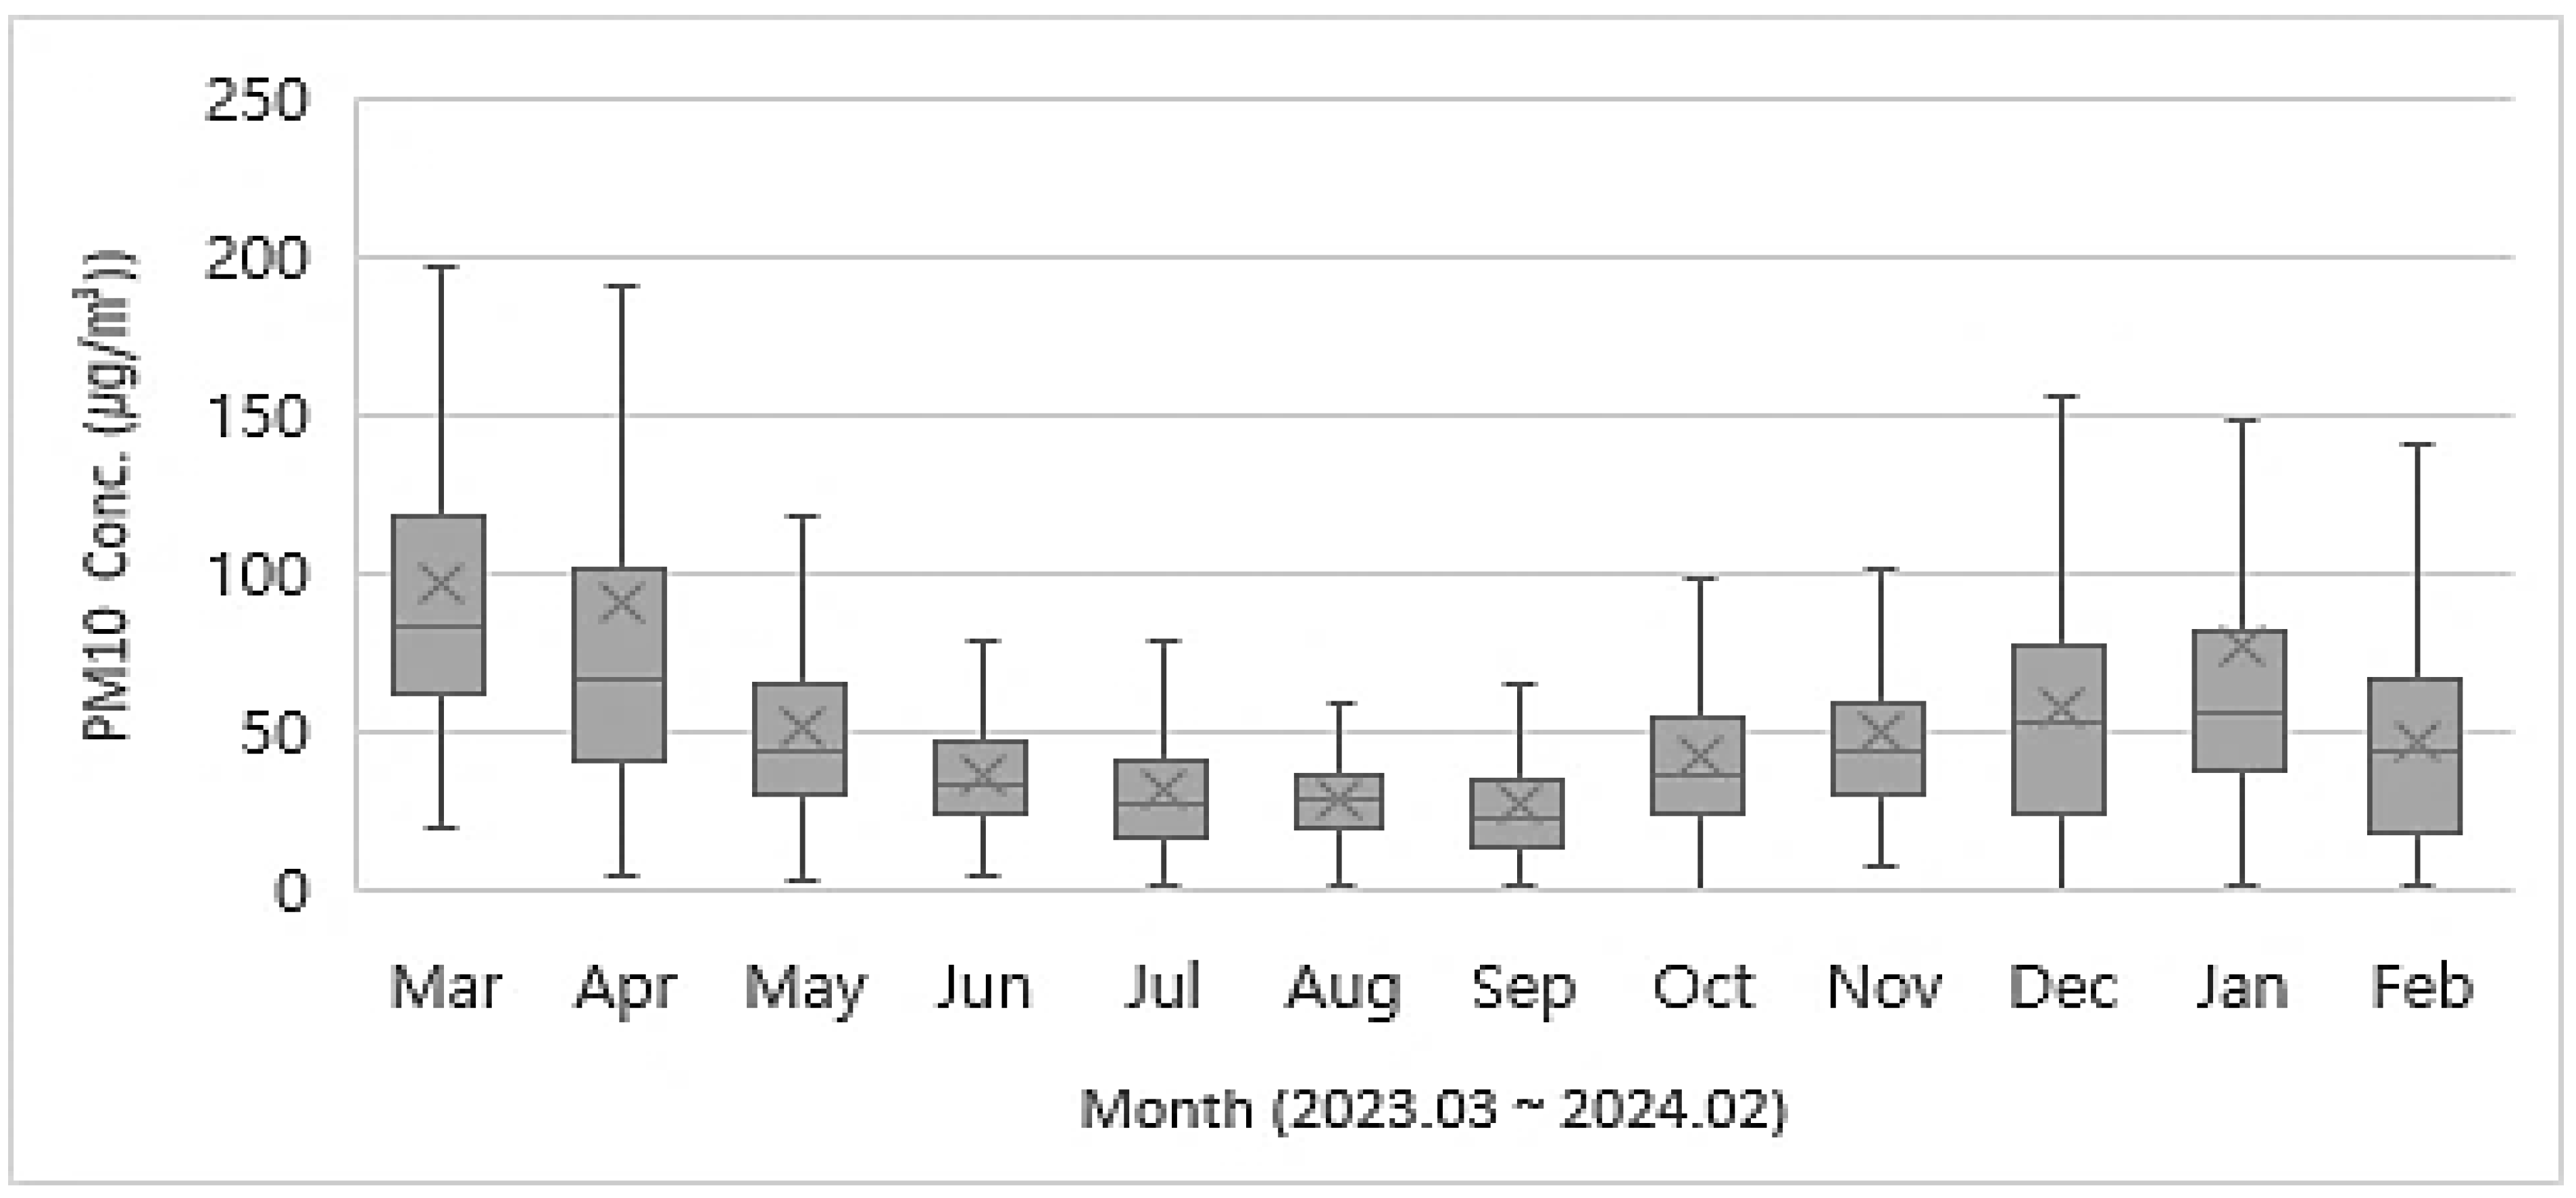
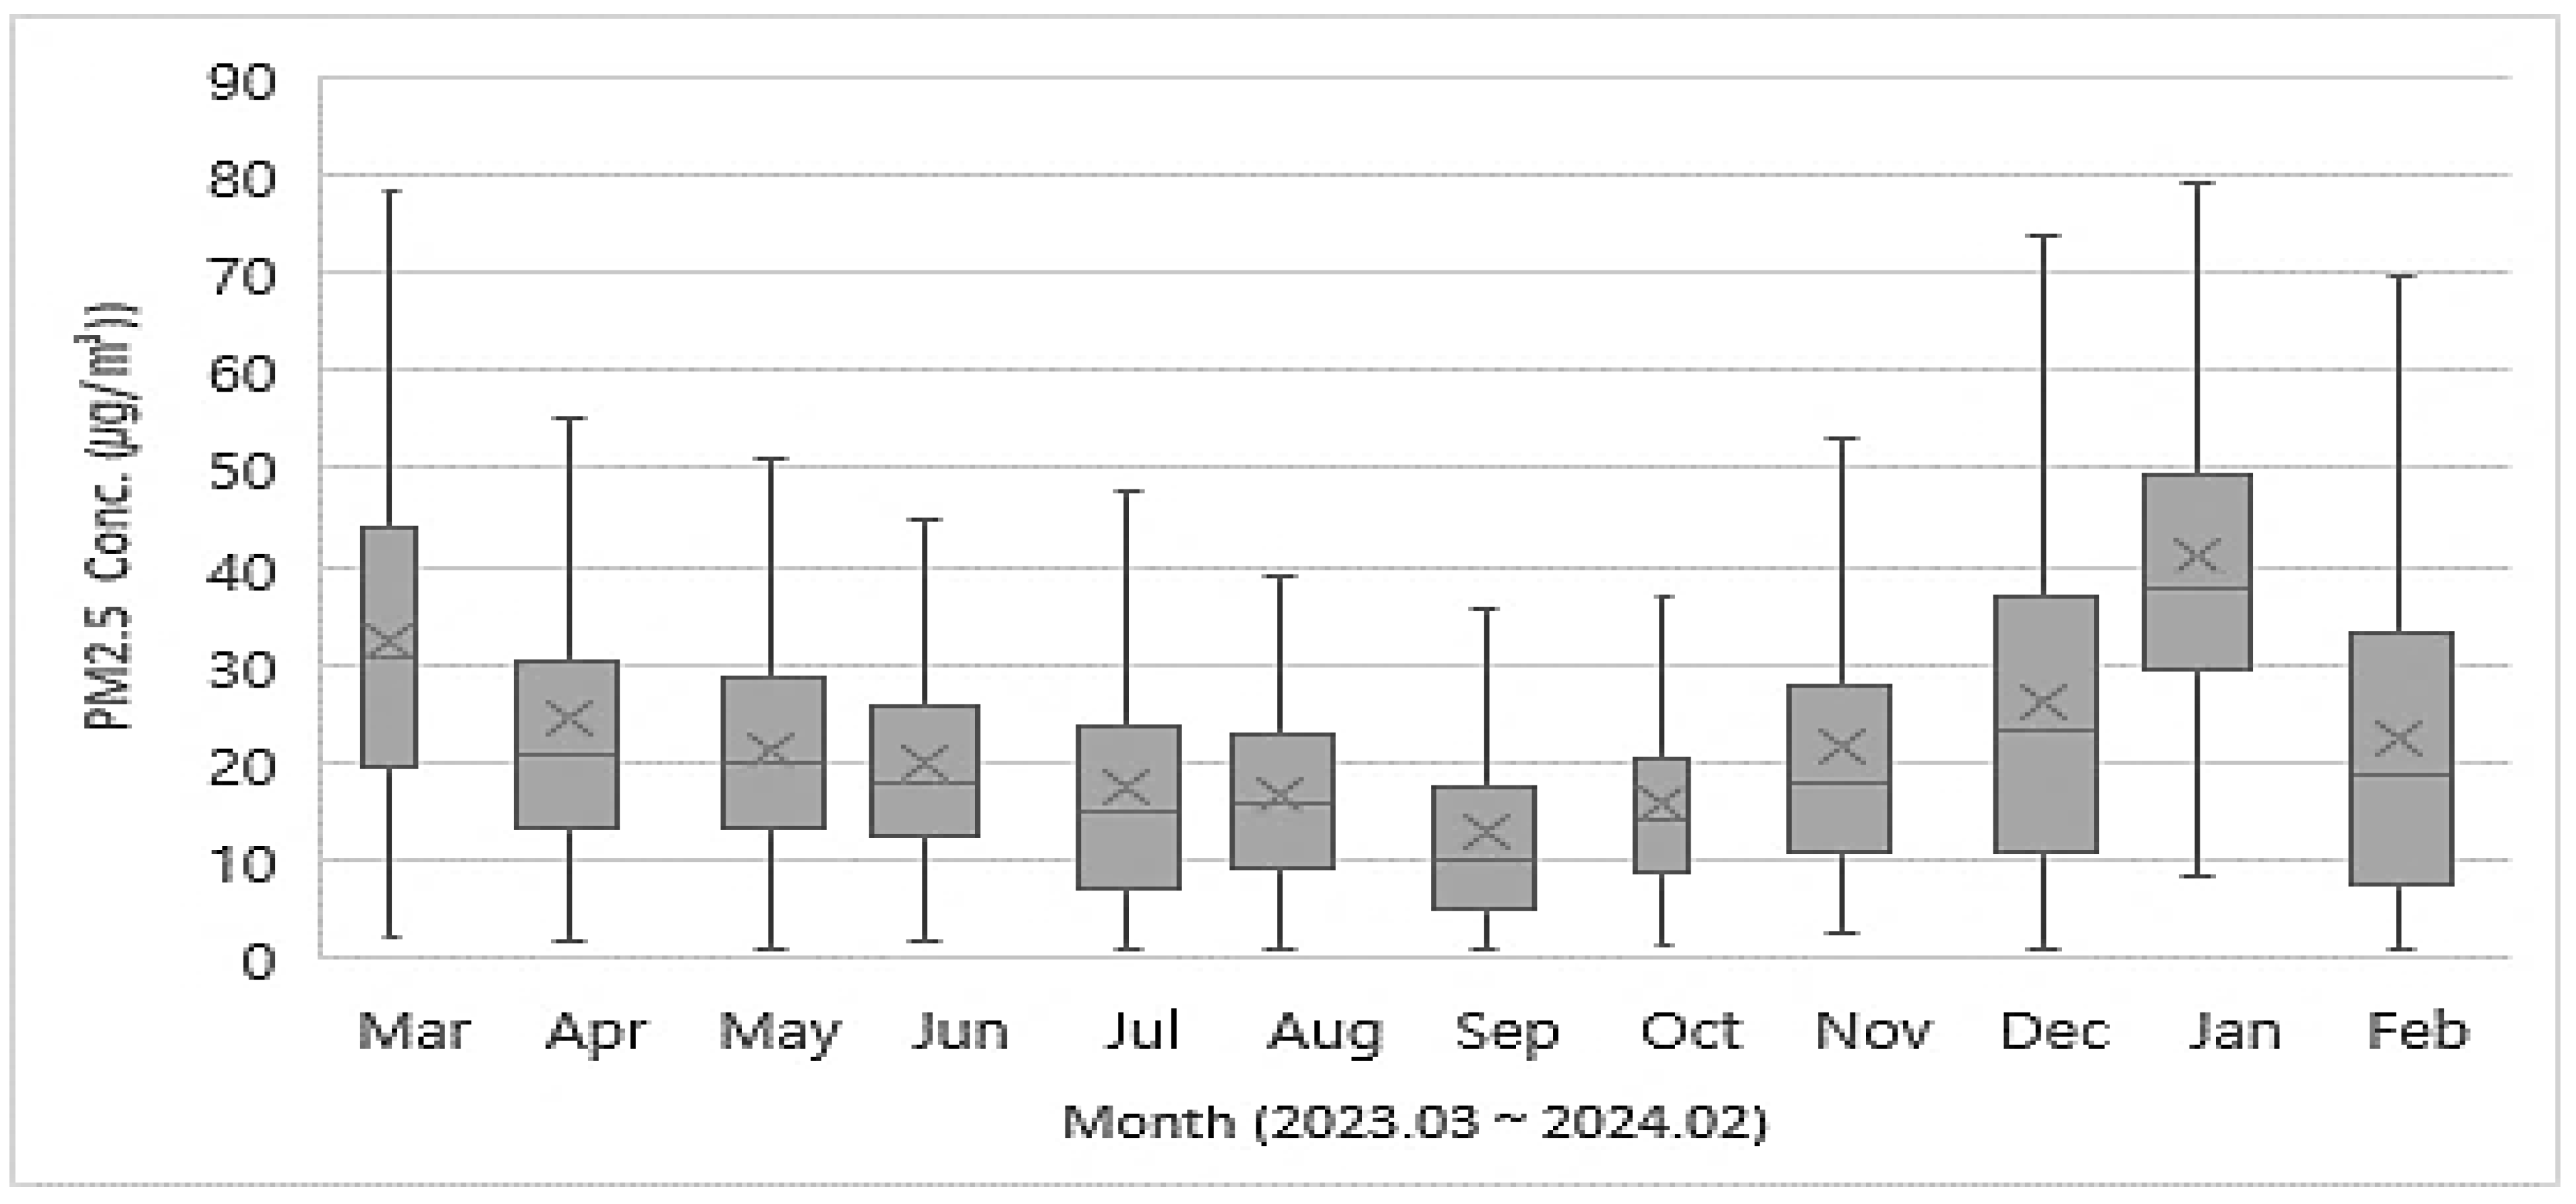
3.2. Monthly Concentrations of PM10 and PM2.5
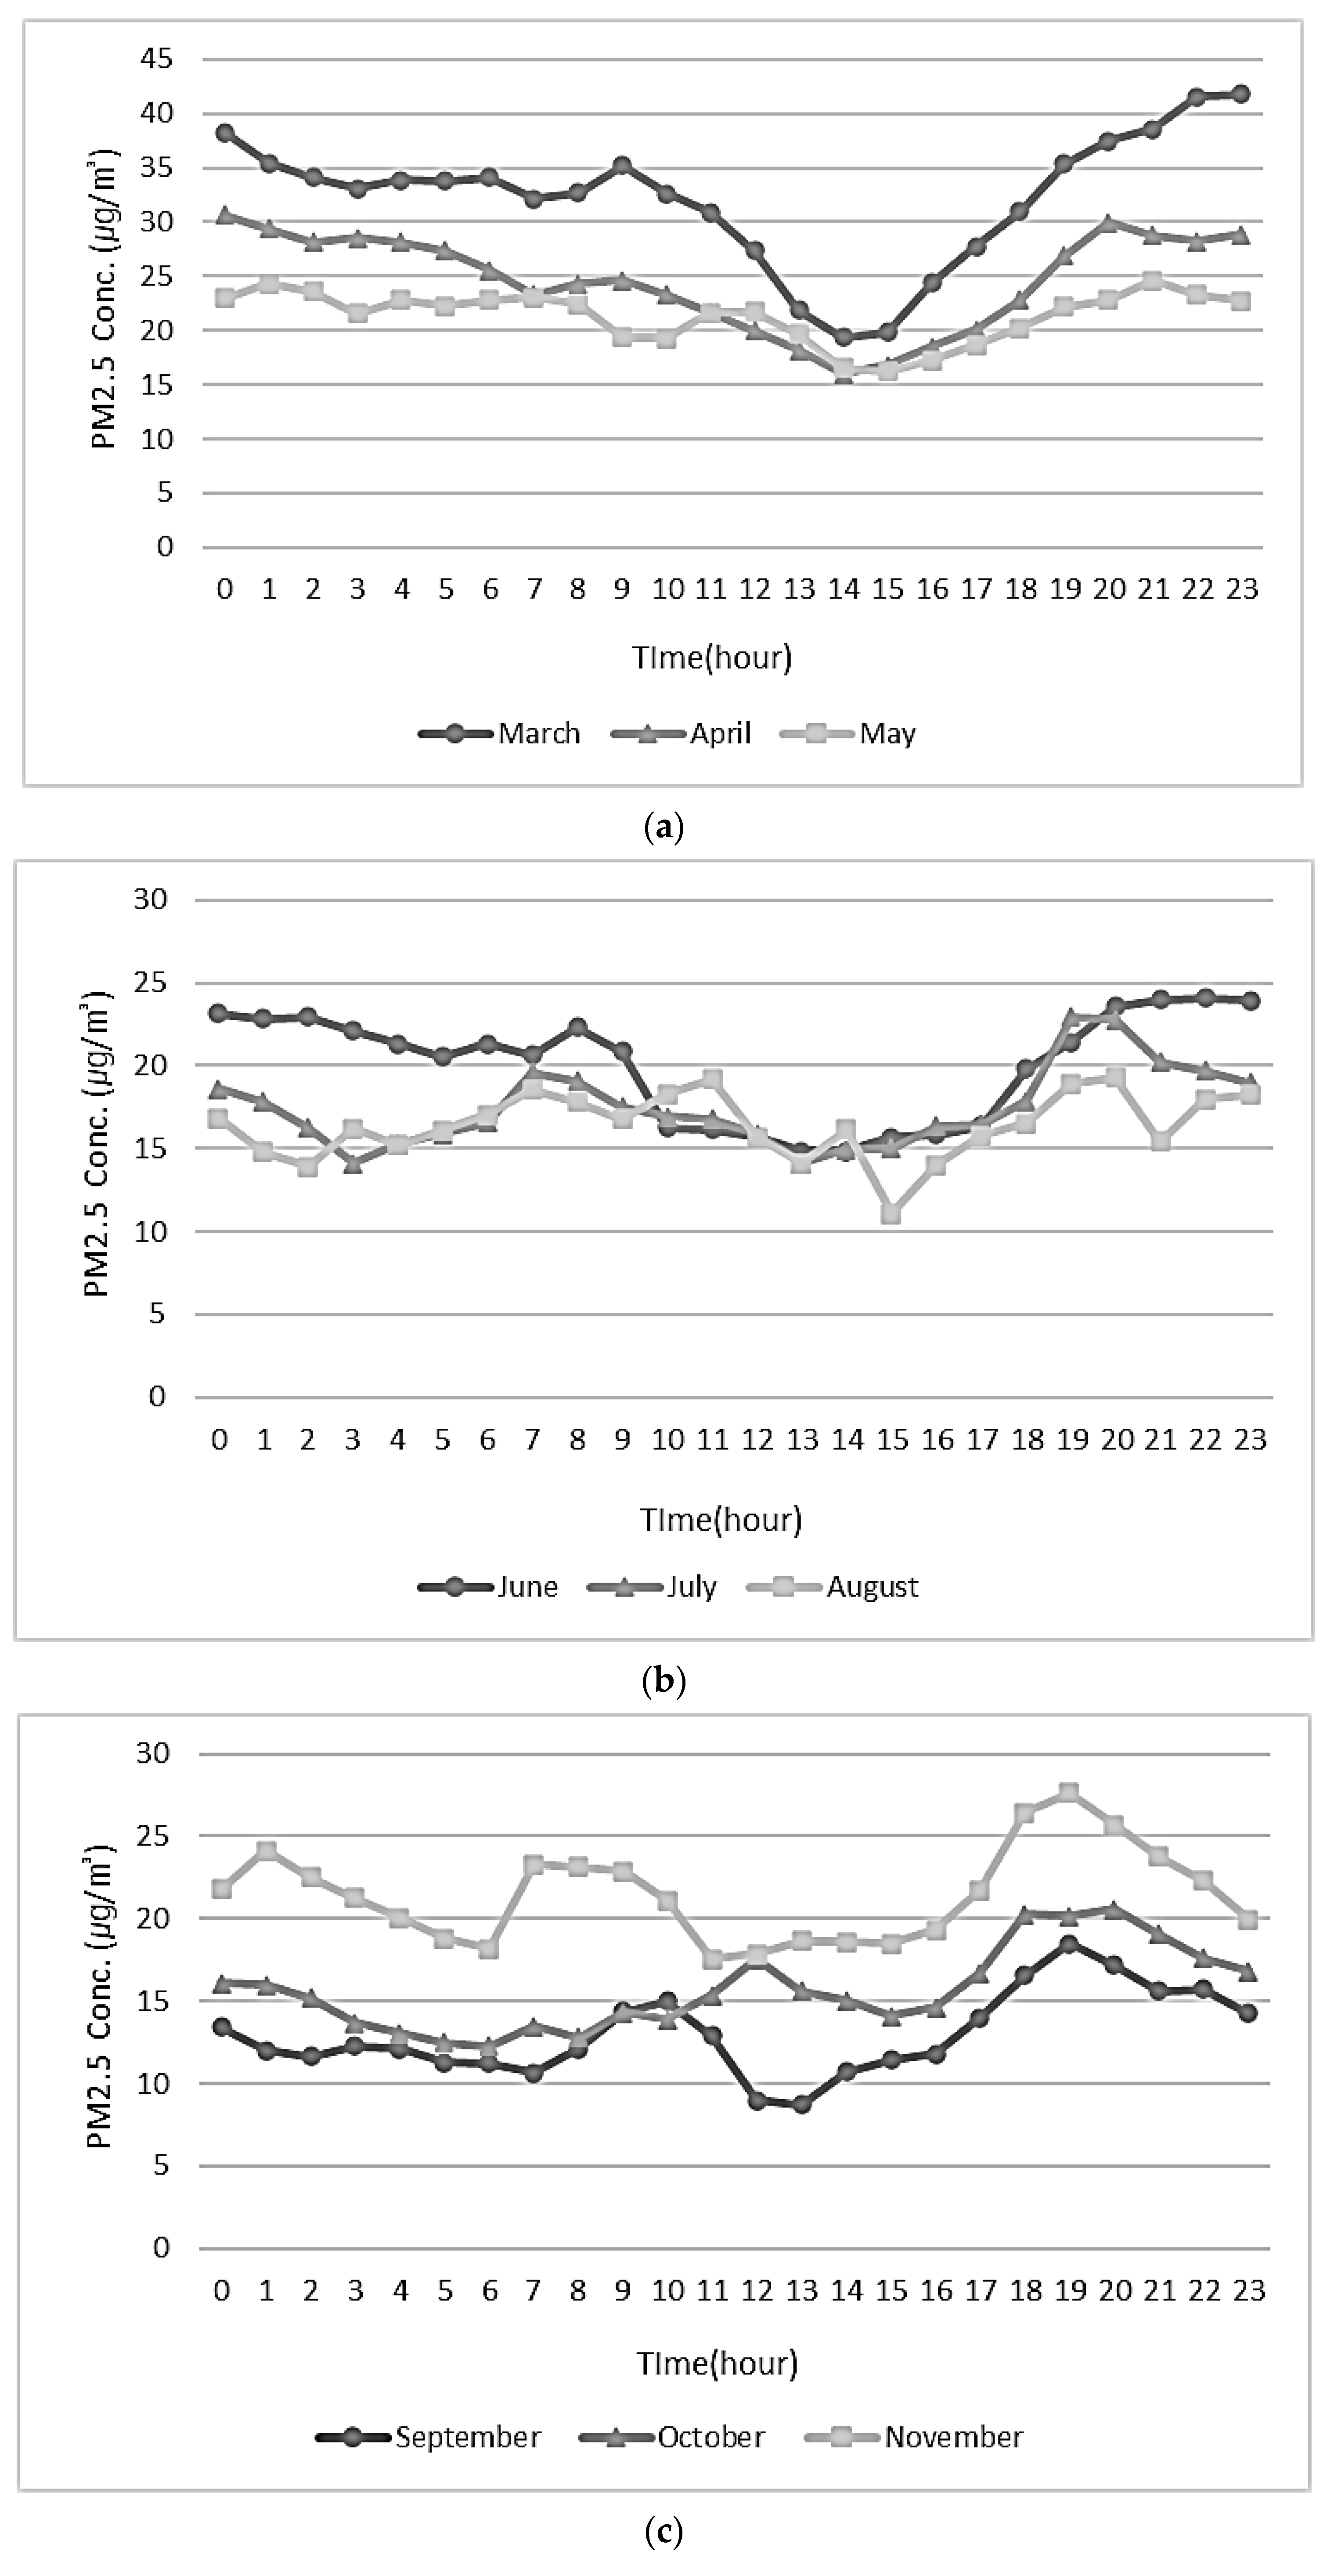
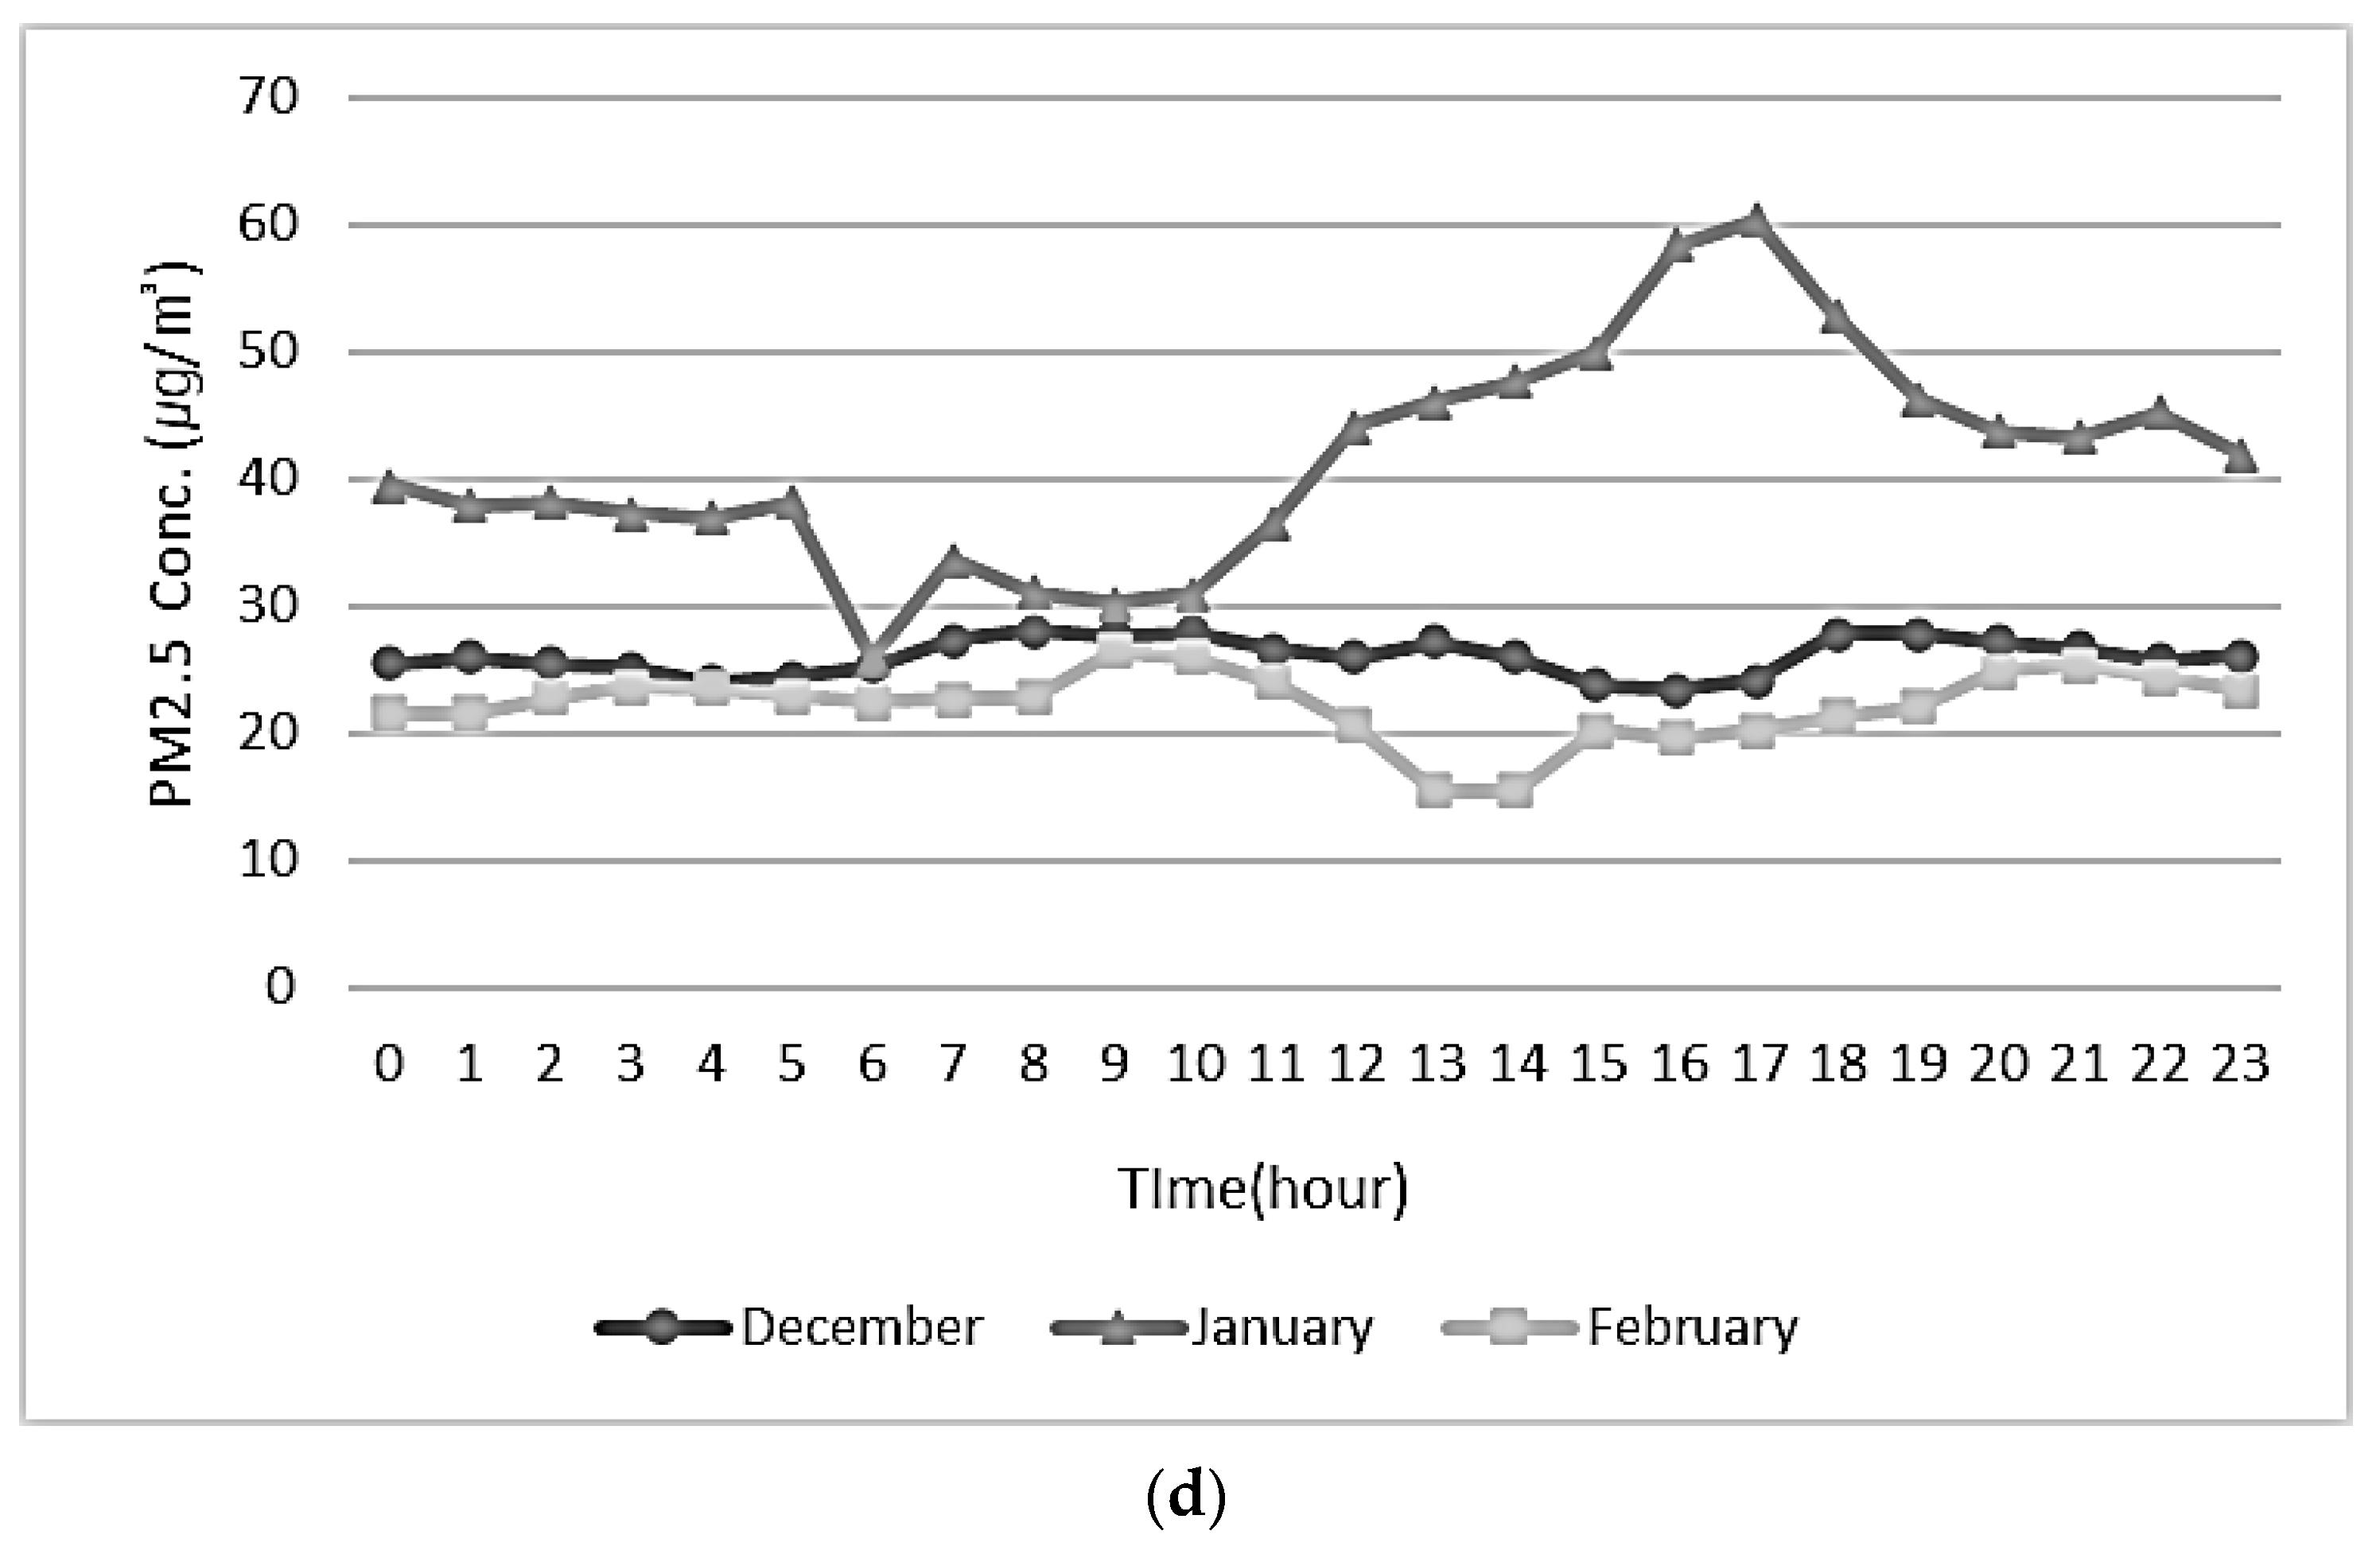
3.3. Time-Based Concentration Fluctuations of PM10 and PM2.5
3.4. Statistical Analysis of Time-Based Concentrations of PM10 and PM2.5
4. Discussion
4.1. PM10
4.2. PM2.5
5. Conclusions
Author Contributions
Funding
Institutional Review Board Statement
Data Availability Statement
Conflicts of Interest
References
- Ain, N.U.; Qamar, S.U.R. Particulate matter-induced cardiovascular dysfunction: A mechanistic insight. Cardiovasc. Toxicol. 2021, 21, 505–516. [Google Scholar] [CrossRef] [PubMed]
- Behera, S.N.; Sharma, M.; Aneja, V.P.; Balasubramanian, R. Ammonia in the atmosphere: A review on emission sources, atmospheric chemistry and deposition on terrestrial bodies. Environ. Sci. Pollut. Res. 2013, 20, 8092–8131. [Google Scholar] [CrossRef] [PubMed]
- Calvo, A.; Alves, C.; Castro, A.; Pont, V.; Vicente, A.; Fraile, R. Research on aerosol sources and chemical composition: Past, current and emerging issues. Atmos. Res. 2013, 120, 1–28. [Google Scholar] [CrossRef]
- Chen, W.; Tong, D.Q.; Zhang, S.; Zhang, X.; Zhao, H. Local PM10 and PM2.5 emission inventories from agricultural tillage and harvest in northeastern China. J. Environ. Sci. 2017, 57, 15–23. [Google Scholar] [CrossRef]
- Deng, Q.; Deng, L.; Miao, Y.; Guo, X.; Li, Y. Particle deposition in the human lung: Health implications of particulate matter from different sources. Environ. Res. 2019, 169, 237–245. [Google Scholar] [CrossRef]
- Kang, N.; Wang, R.; Lu, H.; Onyai, F.; Tang, M.; Ni, X.; Zhong, M.; Deng, J.; Dong, Y.; Li, P.; et al. Burden of child anemia attributable to fine particulate matters brought by sand dusts in low- and middle-incom countries. Environ. Sci. Technol. 2024, 58, 12954–12965. [Google Scholar] [CrossRef]
- Georgakopoulou, V.E.; Taskou, C.; Diamanti, A.; Beka, D.; Papalexis, P.; Trakas, N.; Spandidos, D.A. Saharan dust and respiratory health: Understanding the link between airborne particulate matter and chronic lung diseases (Review). Exp. Ther. Med. 2024, 28, 460–469. [Google Scholar] [CrossRef]
- Ravindra, K.; Vig, N.; Biswal, M.; Sehgal, R.; Mor, S. Characterization and morphometric indentification of household fan dust and its human health-risk implications. Water Air Soil Pollut. 2024, 235, 614–631. [Google Scholar] [CrossRef]
- Dominici, F.; Peng, R.D.; Bell, M.L.; Pham, L.; McDermott, A.; Zeger, S.L.; Samet, J.M. Fine particulate air pollution and hospital admission for cardiovascular and respiratory diseases. JAMA 2006, 295, 1127–1134. [Google Scholar] [CrossRef]
- Jia, L.; Zhou, X.; Wang, Q. Effects of agricultural machinery operations on PM2.5, PM10 and TSP in farmland under different tillage patterns. Agriculture 2023, 13, 930. [Google Scholar] [CrossRef]
- Kim, M.-W.; Kim, J.-H.; Kim, K.-S.; Hong, S.-C. Study on the emission characteristics of air pollutants from agricultural area. Korean J. Environ. Agric. 2021, 40, 211–218. [Google Scholar] [CrossRef]
- Korea Meteorological Administration. 2023 Abnormal Climate Report; Korea Meteorological Administration: Seoul, Republic of Korea, 2024.
- Korea Meteorological Administration. Precipitation Analysis of Icheon; Korea Meteorological Administration: Seoul, Republic of Korea, 2024.
- Ministry of Employment and Labor. Employment Permit System; Ministry of Employment and Labor: Sejong-si, Republic of Korea, 2024.
- Li, C.; Huang, Y.; Guo, H.; Wu, G.; Wang, Y.; Li, W.; Cui, L. The Concentrations and Removal Effects of PM10 and PM2.5 on a Wetland in Beijing. Sustainability 2019, 11, 1312. [Google Scholar] [CrossRef]
- Li, R.; Chen, W.; Xiu, A.; Zhao, H.; Zhang, X.; Zhang, S.; Tong, D.Q. A comprehensive inventory of agricultural atmospheric particulate matters (PM10 and PM2.5) and gaseous pollutants (VOCs, SO2, NH3, CO, NOx and HC) emissions in China. Ecol. Indic. 2019, 107, 105609. [Google Scholar] [CrossRef]
- Meister, K.; Johansson, C.; Forsberg, B. Estimated short-term effects of coarse particles on daily mortality in Stockholm, Sweden. Environ. Health Perspect. 2012, 120, 431–436. [Google Scholar] [CrossRef]
- Moran, R.E.; Bennett, D.H.; Garcia, J.; Schenker, M.B. Occupational exposure to particulate matter from three agricultural crops in California. Int. J. Hyg. Environ. Health 2014, 217, 226–230. [Google Scholar] [CrossRef]
- Nieuwenhuijsen, M.J.; Schenker, M.B. Determinants of personal dust exposure during field crop operations in California agriculture. Am. Ind. Hyg. Assoc. J. 1998, 59, 9–13. [Google Scholar] [CrossRef]
- WHO. Personal interventions and risk communication on air pollution. In Summary Report of WHO Expert Consultation, Switzerland; WHO: Geneva, Switzerland, 2020. [Google Scholar]
- Park, R.; Han, K. Contribution of long-range transported air pollution from China to particulate matter over Korean Peninsula. J. Korean Soc. Hazard Mitig. 2014, 14, 26–36. [Google Scholar]
- Pope, C.A., III; Dockery, D.W. Health effects of fine particulate air pollution: Lines that connect. J. Air Waste Manag. Assoc. 2006, 56, 709–742. [Google Scholar] [CrossRef]
- Kennedy, S.; Kullman, G.; Lacasse, Y.; Lawson, B.; Malmberg, P.; May, J.; McCurdy, S.; Merchant, J.; Schenker, M.B.; Myers, J.; et al. Respiratory health hazards in agriculture. Am. J. Resp. Crit. Care Med. 1998, 158, S1–S76. [Google Scholar]
- Schenker, M.B. Inorganic agricultural dust exposure causes pneumoconiosis among farmworkers. Proc. Am. Thorac. Soc. 2010, 7, 107–110. [Google Scholar] [CrossRef]
- Son, S.; Lee, H.-S. The Characteristics of Population Distribution and Change in Rural Areas: 1995–2020. J. Korean Geogr. Soc. 2021, 56, 607–622. [Google Scholar]
- Sullivan, J.; Sheppard, L.; Schreuder, A.; Ishikawa, N.; Siscovick, D.; Kaufman, J. Relation between short-term fine-particulate matter exposure and onset of myocardial infarction. Epidemiology 2005, 16, 41–48. [Google Scholar] [CrossRef] [PubMed]
- Tang, Y.S.; Flechard, C.R.; Dämmgen, U.; Vidic, S.; Djuricic, V.; Mitosinkova, M.; Uggerud, H.T.; Sanz, M.J.; Simmons, I.; Dragosits, U. Pan-European rural monitoring network shows dominance of NH3 gas and NH4 NO3 aerosol in inorganic atmospheric pollution load. Atmos. Chem. Phys. 2021, 21, 875–914. [Google Scholar] [CrossRef]
- Tatarko, J.; Kucharski, M.; Li, H.; Li, H. PM2.5 and PM10 emissions by breakage during saltation of agricultural soils. Soil Tillage Res. 2021, 208, 104902. [Google Scholar] [CrossRef]
- Yi, G.; Kim, G. A Study on housing policies for agricultural foreign workers in South Korea. Korean J. Immigr. Policy Adm. 2023, 6, 127–152. [Google Scholar]


| PM10 | PM2.5 | ||||||||||
|---|---|---|---|---|---|---|---|---|---|---|---|
| n | Mean (μg/m3) | Std. (μg/m3) | F | p | n | Mean (μg/m3) | Std. (μg/m3) | F | p | ||
| March | 24 | 37.02 | 27.30 | 134.225 | 0.00 *** | March | 24 | 37.02 | 27.30 | 134.225 | 0.00 *** |
| April | 24 | 91.09 | 85.49 | April | 24 | 91.09 | 85.49 | ||||
| May | 24 | 51.71 | 35.06 | May | 24 | 51.71 | 35.06 | ||||
| June | 24 | 36.73 | 17.01 | June | 24 | 36.73 | 17.01 | ||||
| July | 24 | 31.55 | 20.36 | July | 24 | 31.55 | 20.36 | ||||
| August | 24 | 16.65 | 18.46 | August | 24 | 16.65 | 18.46 | ||||
| September | 24 | 27.10 | 19.06 | September | 24 | 27.10 | 19.06 | ||||
| October | 24 | 42.91 | 25.38 | October | 24 | 42.91 | 25.38 | ||||
| November | 24 | 50.29 | 28.92 | November | 24 | 50.29 | 28.92 | ||||
| December | 24 | 56.99 | 90.54 | December | 24 | 56.99 | 90.54 | ||||
| January | 24 | 75.10 | 89.25 | January | 24 | 75.10 | 89.25 | ||||
| February | 24 | 47.62 | 34.99 | February | 24 | 47.62 | 34.99 | ||||
Disclaimer/Publisher’s Note: The statements, opinions and data contained in all publications are solely those of the individual author(s) and contributor(s) and not of MDPI and/or the editor(s). MDPI and/or the editor(s) disclaim responsibility for any injury to people or property resulting from any ideas, methods, instructions or products referred to in the content. |
© 2025 by the authors. Licensee MDPI, Basel, Switzerland. This article is an open access article distributed under the terms and conditions of the Creative Commons Attribution (CC BY) license (https://creativecommons.org/licenses/by/4.0/).
Share and Cite
Kim, K.-Y.; Khvat, B.R.; Kim, J. Real-Time Monitoring of Particulate Matter (PM10 and PM2.5) Emitted from Paddy Fields in South Korea: A One-Year Study. Agriculture 2025, 15, 928. https://doi.org/10.3390/agriculture15090928
Kim K-Y, Khvat BR, Kim J. Real-Time Monitoring of Particulate Matter (PM10 and PM2.5) Emitted from Paddy Fields in South Korea: A One-Year Study. Agriculture. 2025; 15(9):928. https://doi.org/10.3390/agriculture15090928
Chicago/Turabian StyleKim, Ki-Youn, Bun Rath Khvat, and Jinho Kim. 2025. "Real-Time Monitoring of Particulate Matter (PM10 and PM2.5) Emitted from Paddy Fields in South Korea: A One-Year Study" Agriculture 15, no. 9: 928. https://doi.org/10.3390/agriculture15090928
APA StyleKim, K.-Y., Khvat, B. R., & Kim, J. (2025). Real-Time Monitoring of Particulate Matter (PM10 and PM2.5) Emitted from Paddy Fields in South Korea: A One-Year Study. Agriculture, 15(9), 928. https://doi.org/10.3390/agriculture15090928