Abstract
Nitrogen (N), phosphorus (P), and potassium (K) are important fertilizers frequently applied to soils to ensure agricultural production. However, how an excess of N, P and K affects metals’ geochemical availability, and thereby soil fertility, is poorly under-stood in the tea agro-system. Instead of using the total concentration, this study evaluated soil fertility based on the available concentration of fertilizers (N, P, and K), macro elements (Ca, Mg, Fe, and Mn), and trace elements (Cu and Zn) on tea plantations in the eight main tea-producing regions of Puerh, Yunnan Province, Southwest China. In addition, the correlations of fertilizer, soil pH, and metals’ availability, as well as their effect on soil fertility, were clarified. The results showed that tea-growing soils were acidified (pH = 3.83–5.5; n = 323). Soil pH (98.7%), available Fe (100%), Ca (98.5%), Cu (97.2%), and Zn (86.4%) were within suitable ranges for tea tree growth, while N (97%), Mg (84%), and P (86.1%) should be enhanced. The overall fertility (IFI = 0.47–0.89) was distributed in levels I–III, with Jiangcheng showing the highest IFI at level I. This was attributed to the highly available concentration of metals induced by low pH (3.83–4.99). In terms of the driven factor, available P and K posed greater effects than available N in mediating the availability of metals (R = 0.14–0.28 and 0.27–0.75; p < 0.01 or p < 0.05) by decreasing soil pH (R = −0.17 and −0.17; p < 0.01) in the studied tea plantations. This study indicates that more attention should be paid to P and K during fertilization management for tea plantations.
1. Introduction
Tea is a widely consumed nonalcoholic beverage that contains catechins, procyanidins, rutin, and phenolic acids, which can reduce serum cholesterol levels, decrease the risk of cancer, and prevent the oxidation of low-density lipoproteins [1]. Tea plants prefer to grow in acidic soil. Tea is widely planted in tropical and subtropical areas in Southern China [2]. Specifically, Yunnan province, located in Southwest China, ac-counts for 15.3% of the national tea acreage and 16% of tea production. Interestingly, growing tea plants further increased soil acidification, with soil pH being decreased by 0.07 per year [3].
Nitrogen (N), phosphorus (P), and potassium (K) are essential nutrients critical for agricultural yield but show low availability for plant uptake [4]. Due to the limited availability of N, P, and K in soils, excess fertilizers are applied to achieve desirable plant growth annually [3], which facilitates soil acidification and changes nutrient availability [5]. Given that essential elements (K, Mn, Cu, and Zn) are beneficial for human health [6], the nutritional elements in tea are the most commonly studied [7]. However, soil element availability determines the subsequent plant uptake, which has received limited study.
Major (Ca, Mg, Fe, and Mn) and trace elements (Cu and Zn) are necessary for plants’ development, playing roles in promoting enzyme activity, leaf photosynthesis, and carbohydrate formation [8,9]. The available fraction of elements represents the forms that can potentially be taken up by the roots [10]; this fraction is highly influenced by soil properties (especially pH) and the fertilizer concentration. Typically, soil pH on a tea plantation is increasingly reduced with a prolonged planting time due to the organic acids that are produced by roots and by the decomposition of plant litter [3,11]. For instance, the soil pH value was decreased by 0.43 units after growing tea plants for 90 years [12]. Furthermore, intensive fertilizer application decreases soil pH. For instance, soil pH was decreased by 1.2 units after amending 800 kg ha−1 N due to the formation of NH4+ [13]. In addition, the soil buffering capacity decreases with in-creasing acidification [14]. As such, tea planting coupled with fertilizer application leads to increased soil acidification on tea plantations, thereby changing element availability [15]. In addition, soil pH is an important factor affecting elements’ availability and, thereby, soil fertility [16]. Therefore, it is hypothesized that excess N application may decrease soil pH, leading to increased dissolution and mobilization of metals. However, the detailed correlations of fertilization, soil acidification, availability of multi-metals, and fertility on tea plantations are unclear.
Puerh in Yunnan province, Southwest China, is the predominant producer of big leaf tea, accounting for 4.46% of the national supply. However, the effects of N, P, and K fertilization on macro elements and trace elements’ geochemical behavior and availability are poorly understood in the tea agro-system. Furthermore, the total con-tent of elements is generally used to evaluate soil fertility, which leads to overestimation. Therefore, this study sampled 323 tea-growing soils from eight regions (Jingdong, Jinggu, Mojiang, Simao, Lancang, Zhenyuan, Jiangcheng, and Ninger) in Puerh. The aims are to (1) examine soil pH and available concentrations of fertilizers (N, P, and K), macro elements (Ca, Mg, Fe, and Mn), and trace elements (Cu and Zn) in soils; (2) analyze the relationships among fertilizers, soil pH, and macro elements and trace elements’ available concentrations; and (3) evaluate soil fertility via the integrated fertility index (IFI) using fuzzy mathematical membership analysis. Quantifying the correlations of fertilizer, soil pH, and metals’ available concentration helps to better under-stand the mechanisms and identify the key factors contributing to guiding fertilization strategies and optimizing nutrient dynamics to achieve tea growth and production.
2. Materials and Methods
2.1. Sample Collection and Pretreatment
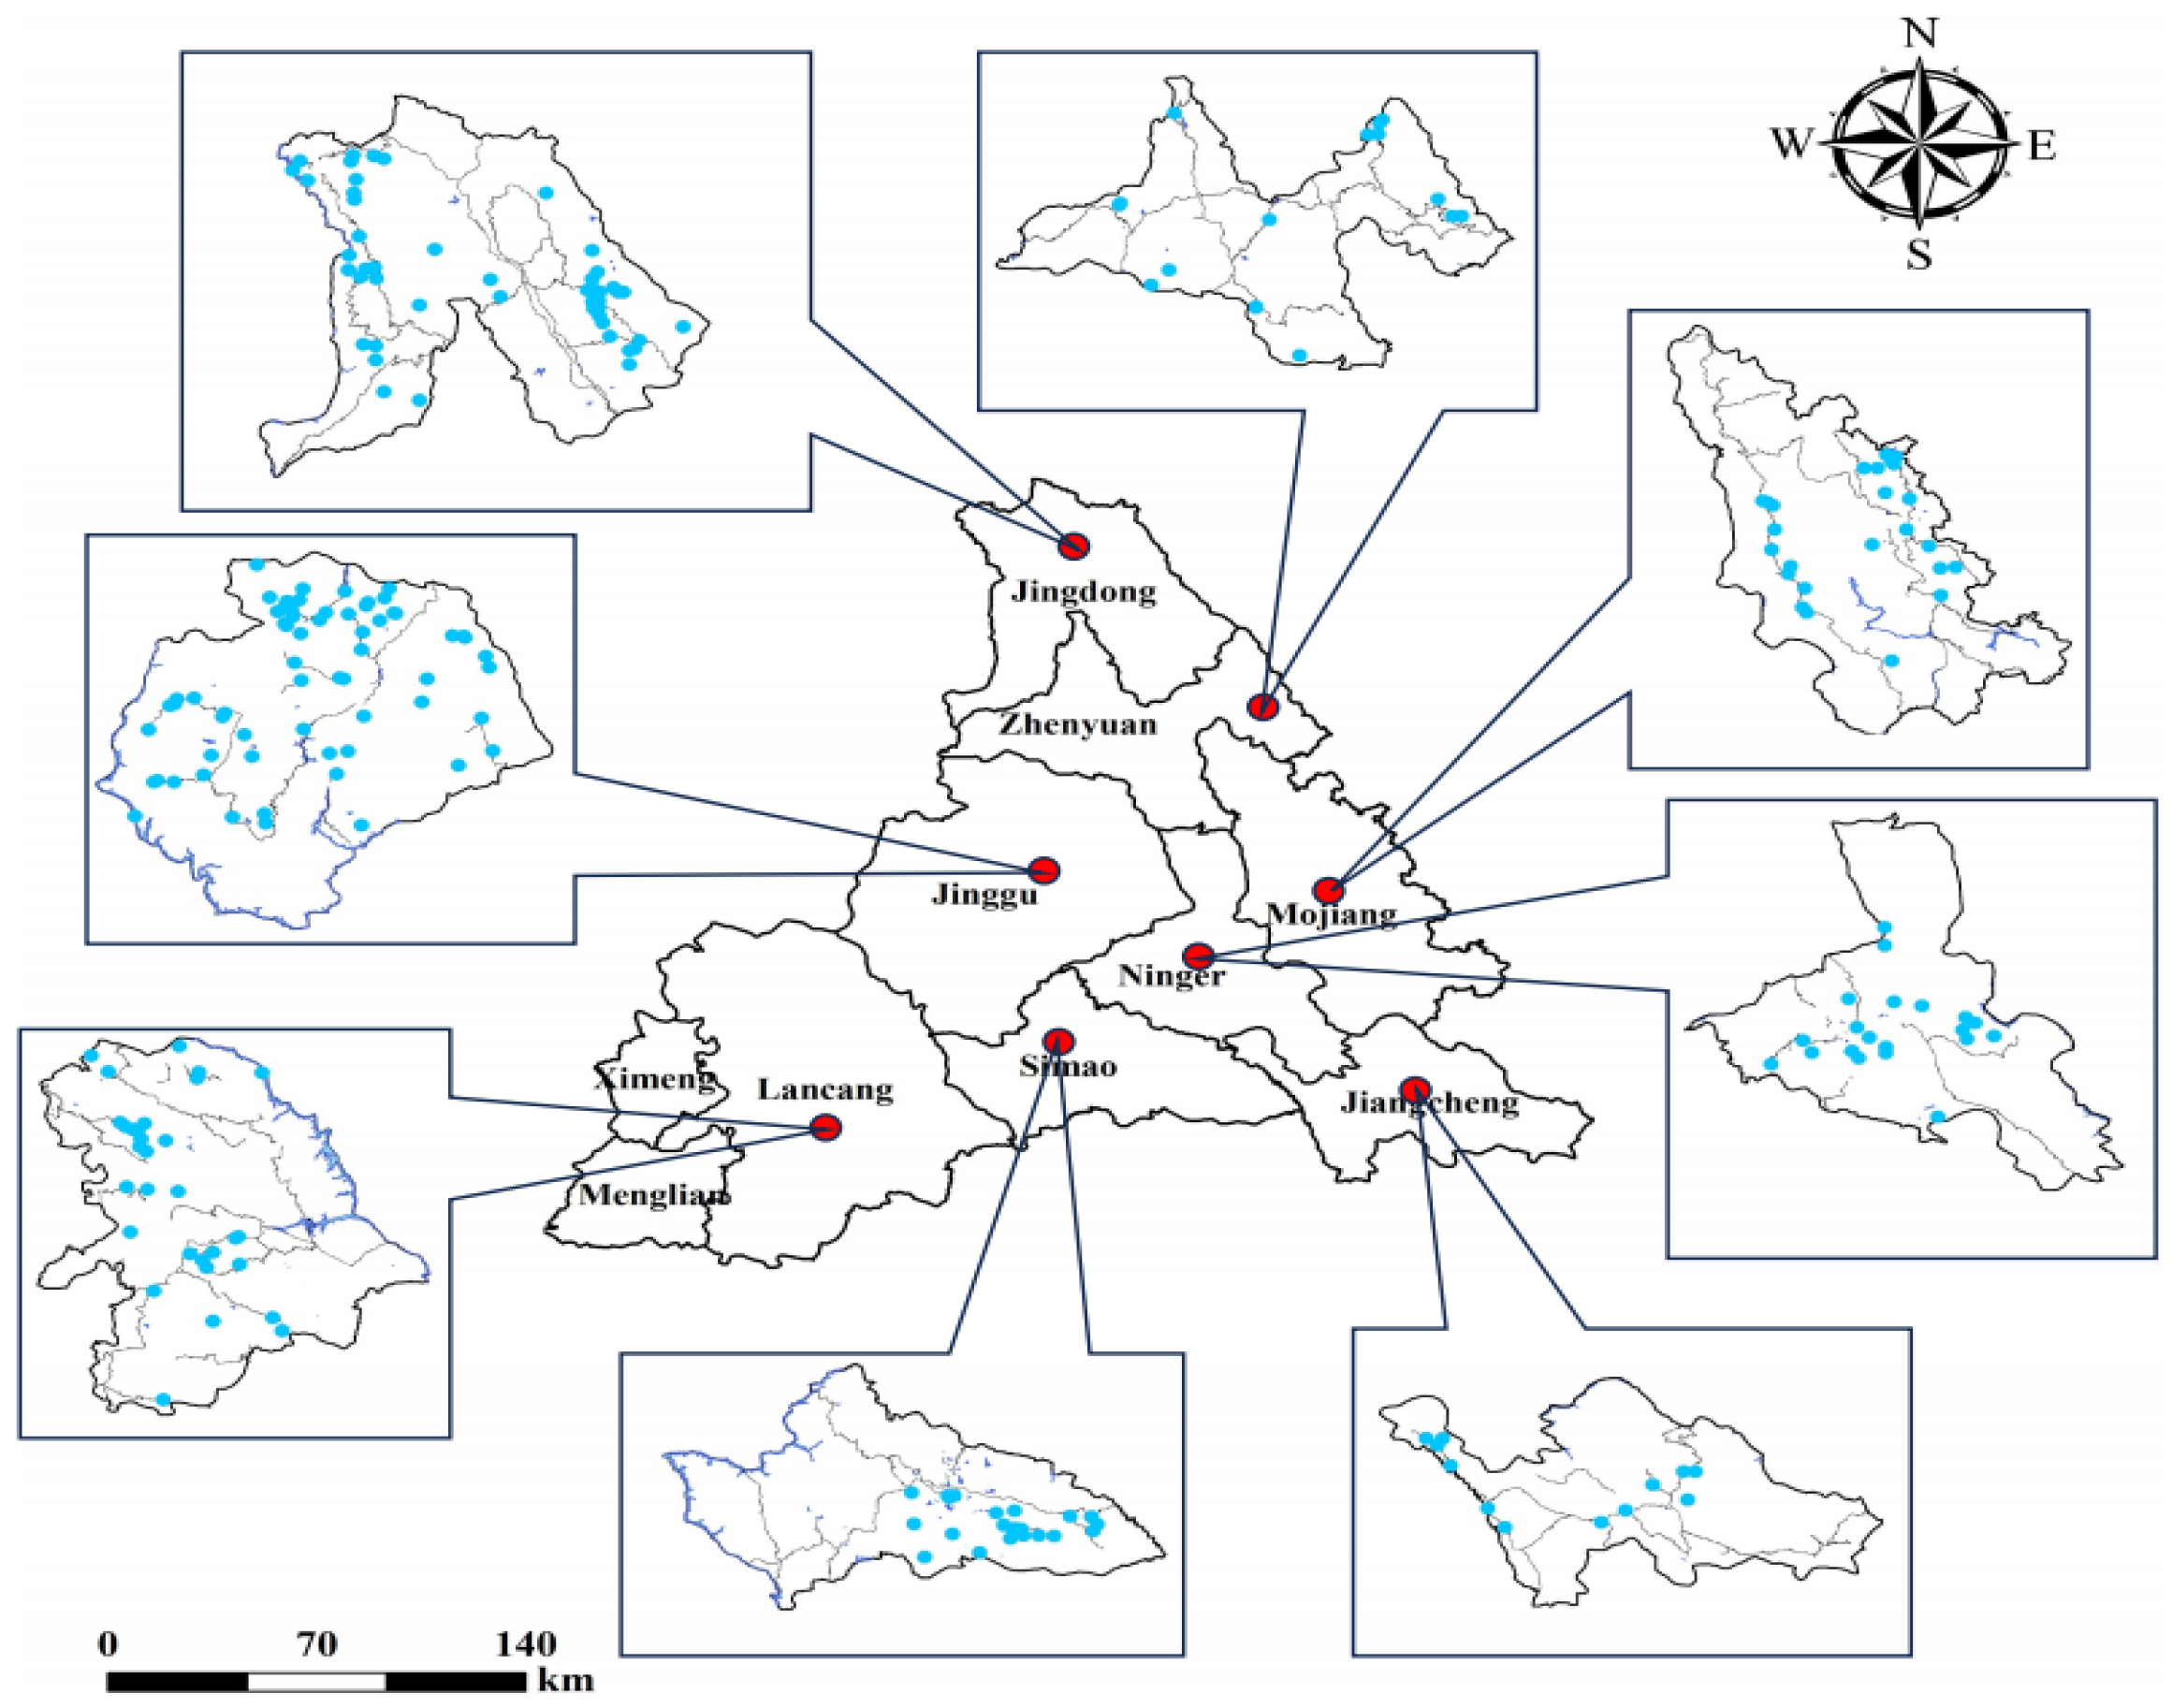
N (urea; 150–225 kg ha−1), P (calcium superphosphate, 25–50 kg ha−1), and K (K2SO4, 15–25 kg ha−1) were applied to soils at 15–20 cm depth and 20–30 cm from the roots in October and the next March. Surface soils (0–30 cm) (n = 323) were collected in eight regions in Puerh, Southwest China, including Jingdong (n = 98), Jinggu (n = 65), Mojiang (n = 51), Simao (n = 36), Lancang (n = 31), Zhenyuan (n = 15), Jiangcheng (n = 14), and Ninger (n = 13) (Figure 1). Each soil sample was made up of six well-mixed sub-samples. Soils were air-dried, ground to homogenous powder, well mixed, and passed through a nylon sieve (0.15 mm).
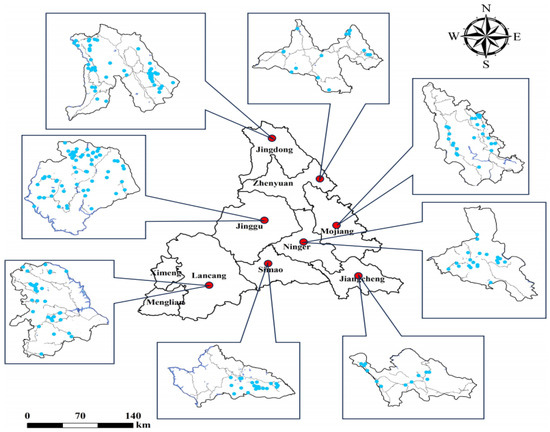
Figure 1.
The distribution of 323 sampling sits (blue dots) in tea plantations in eight regions, in-cluding Jingdong (n = 98), Jinggu (n = 65), Mojiang (n = 51), Simao (n = 36), Lancang (n = 31), Zhenyuan (n = 15), Jiangcheng (n = 14), and Ninger (n = 13) in Puerh, Southwest China.
2.2. Chemical Analysis
Soil pH was determined by mixing soil with Milli-Q water at a solid/liquid ratio of 1:2.5 (m/v) (Millipore, Burlington, MA, USA) and shaken for 1 h (180 rpm, 25 °C) [7], and the supernatant was tested with a pH meter (Mettler-Toldo, Columbus, OH, USA).
Available concentration of fertilizers (N, P and K), macro elements (Ca, Mg, Fe, and Mn) and trace elements (Cu and Zn) in soils was exacted and analyzed according to methods outlined by Milani et al. [17] and Aitta et al. [18]. Briefly, available N was analyzed using a semi-automatic micro Kjeldahl (Behr2) after extraction with 2 M KCl. Available P was extracted using ammonium bicarbonate–diethylenetriaminepentaacetic (AB-DTPA) and determined calorimetrically using the ascorbic acid method using a UV-Vis-spectrophotometer. Available K, Ca, and Mg were extracted with Milli-Q water at a solid/liquid ratio of 1:5 (m/v) and measured using inductively coupled plasma mass spectrometry (ICP–MS; NexION300X, Perkin Elmer, Waltham, MA, USA). Available Fe, Mn, Cu, and Zn were extracted using AB-DTPA and analyzed using ICP–MS. The internal standard (In) was used to ensure instrumental accuracy and precision. Standard solution and extraction sample were prepared in 0.1 M of HNO3 (Suprapur; Merck, Darmstadt, Germany) [19]. Standard solution (2 µg L–1 elements) was analyzed every 20 samples to monitor the stability of ICP–MS. The average recoveries were 101 ± 1.6%–104 ± 1.2%.
2.3. Integrated Evaluation of Soil Fertility Quality
The integrated fertility index (IFI) involves indices that strongly affect plant growth. In this study, soil pH and available concentration of N, P, K, Ca, Mg, Fe, Mn, Cu, and Zn were used. The fertility was classified into levels I to III based on Environ-mental Quality of Green Food Production Areas of China (NY/T391-2021) (Table 1A).

Table 1.
Classification of soil nutritional level basing on pH, major and trace elements available concentrations (A), turning point values of the membership curve (B), membership value Ni (C), correlation coefficient average value Vi (D), and weight coefficient Wi (E) in tea plantations from 8 regions.
Table 1 Soil nutritional level classification based on soil pH, available concentration of major and trace elements (A), membership curve turning point value (B), membership value Ni (C), average value of correlation coefficient Vi (D), and weight coefficient Wi (E) of tea plantations in 8 regions.
Due to the incompatibility of indices’ units, fuzzy membership function was used to determine the score, which ranged from 0.1 to 1.0, to assign each index according to the sensitivity. Parabolic (Equation (1)) and S type (Equation (2)) equations were used to analyze the membership function of soil pH value and available elements, respectively [20,21].
where x is the analyzed value of indices of the studied soils, x1 to x4 are membership curve turning point values (Table 1B), and Ni is standardized membership value of indices (Table 1C).
Elements often interact with each other in soils. The weight coefficient (Wi) of each index was used and calculated via Equation (3):
where Vi is the mean value of correlation coefficient between specific index and the other indices (Table 1D). ΣVi is the sum of individual Vi. The established Wi value is presented in Table 1E.
IFI was calculated via Equation (4):
where Ni and Wi are presented in Table 1C,E. IFI ≥ 0.75, 0.5 ≤ IFI < 0.75, 0.25 ≤ IFI < 0.5, and IFI < 0.25 indicate soil fertility at levels I, II, III, and IV, respectively.
2.4. Statistical Analysis
Pearson correlation was analyzed via SPSS 25.0 (SPSS Inc., Chicago, IL, USA) at p < 0.05 or p < 0.01. Figures were built using Origin 2021 (Origin Lab Corporation, Northampton, MA, USA).
3. Results and Discussion
3.1. Soil pH Value and Available Concentrations of N, P, and K
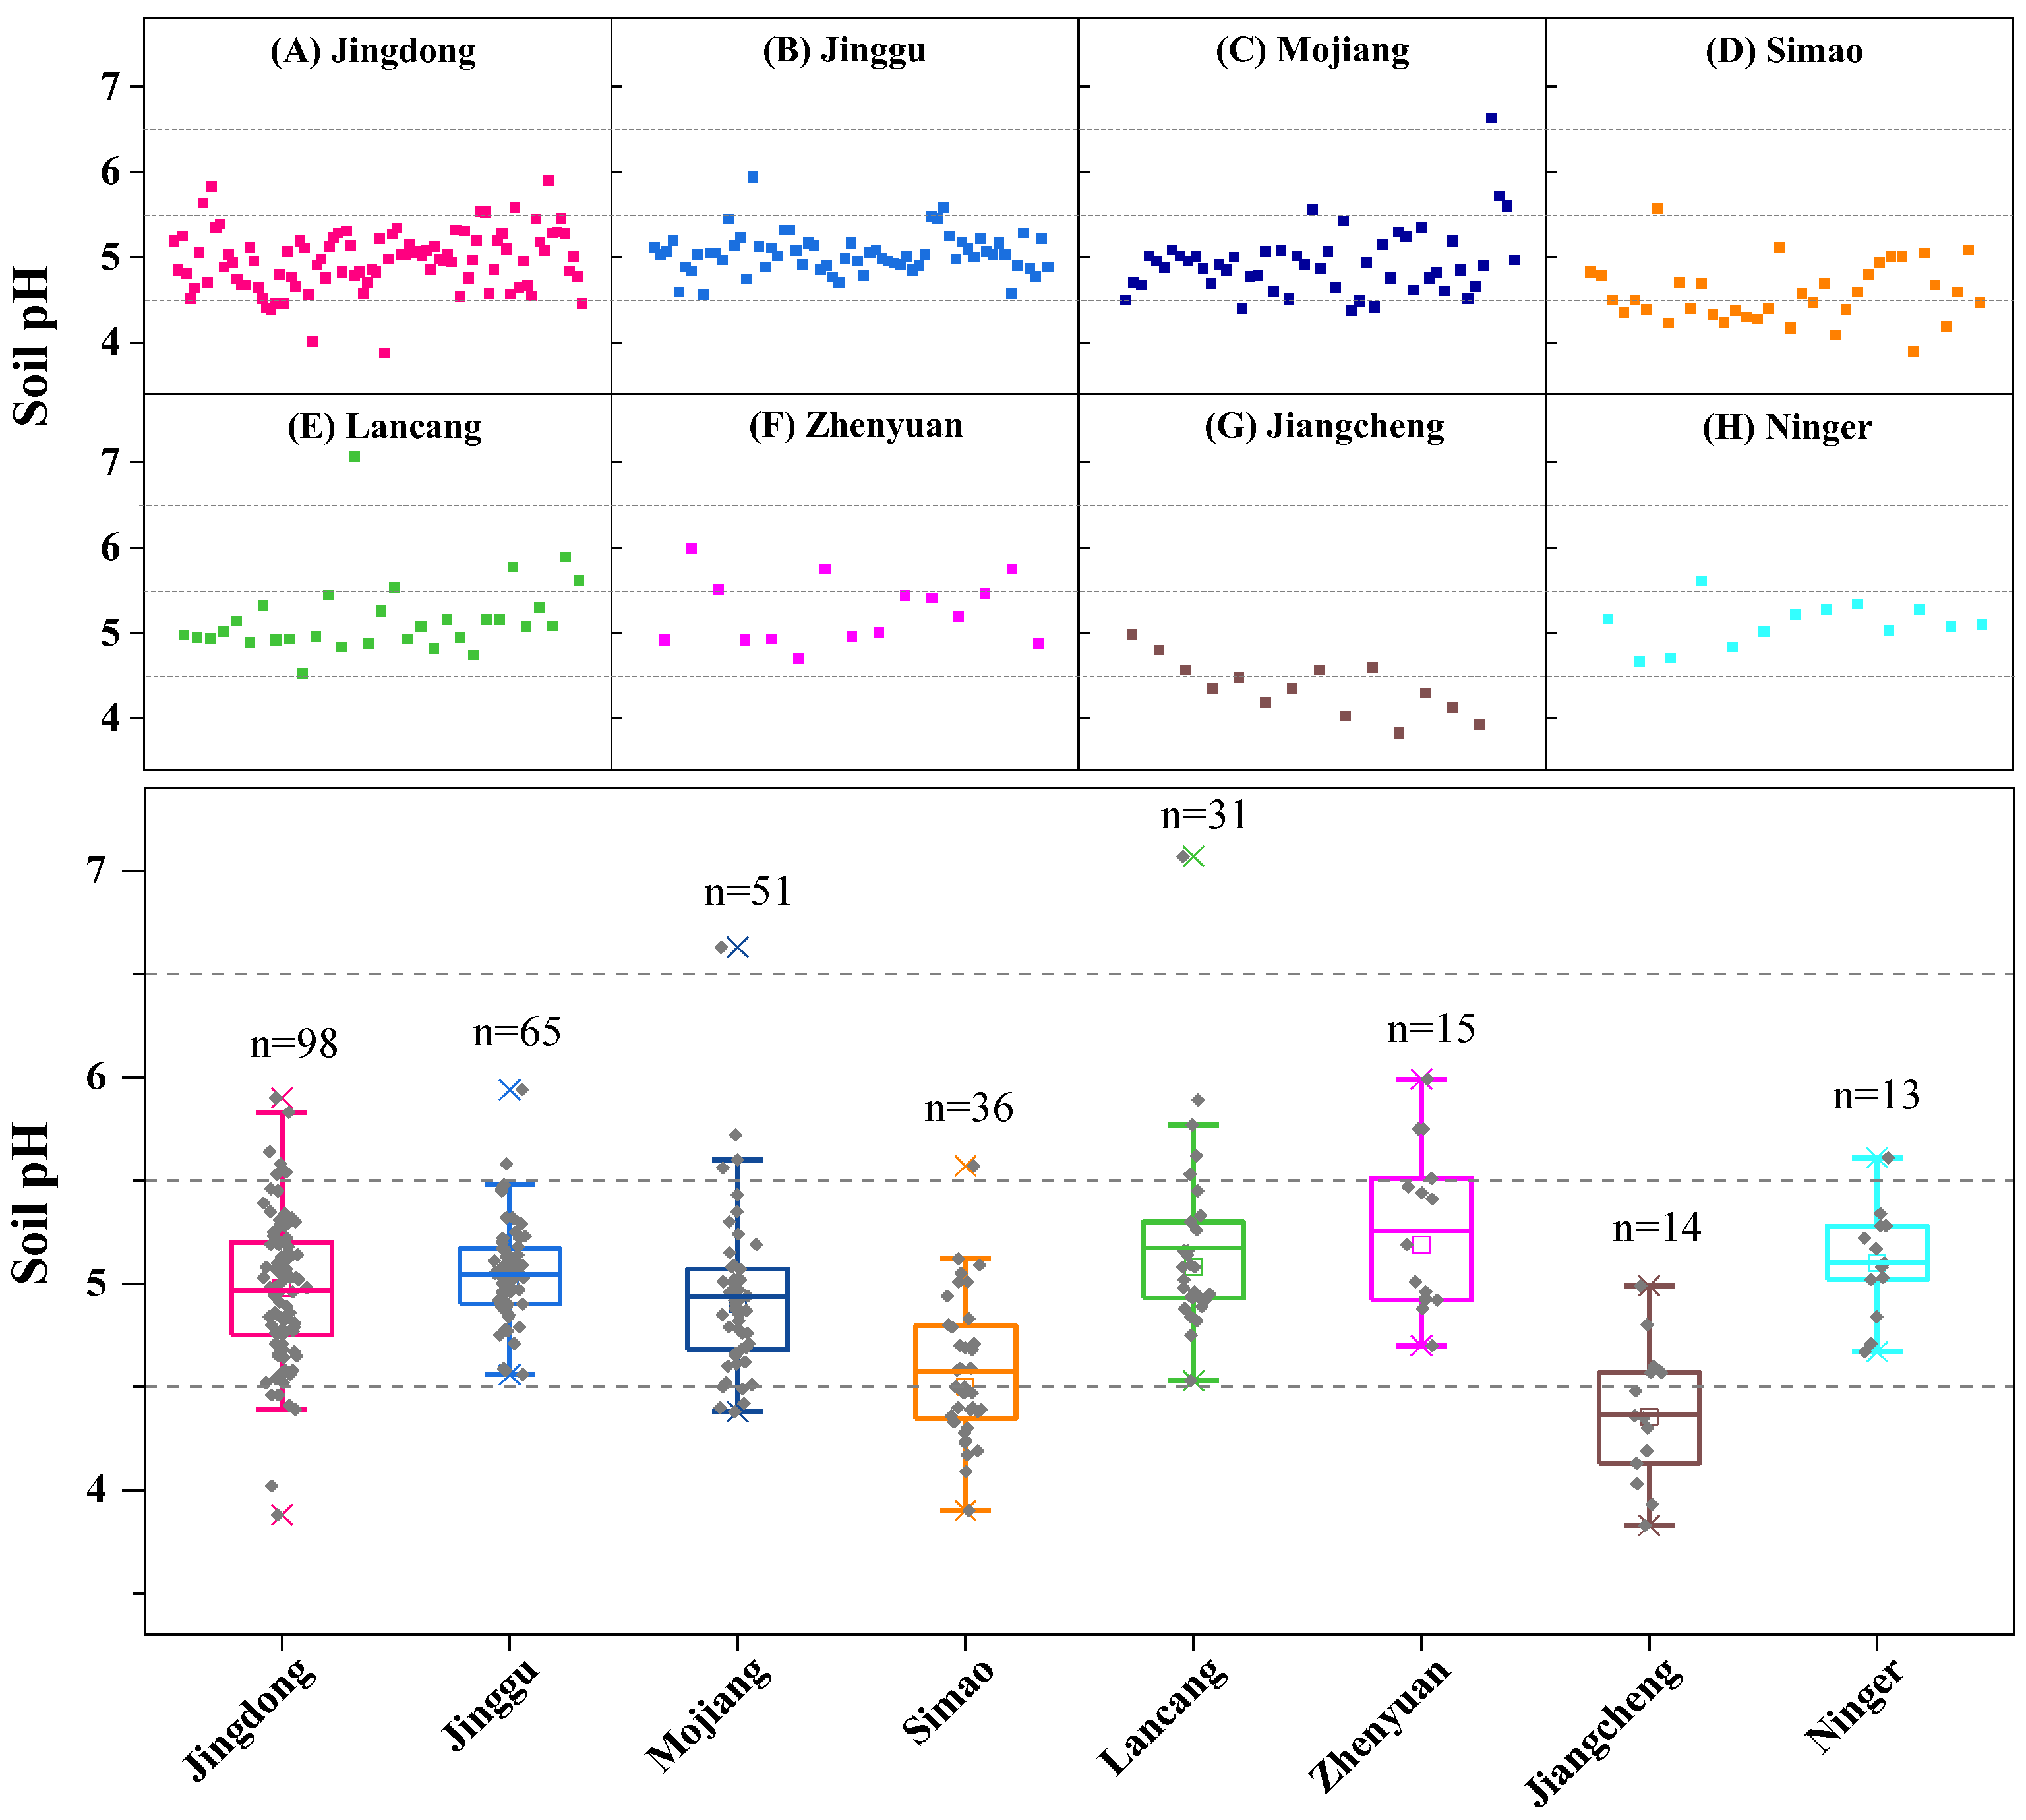
Tea planting and fertilizer application lead to soil acidification on tea plantations. The decreased pH, in turn, affects fertilizers and elements accessibility for plant up-take. The soil pH of the 323 sampling sites was in the range of 3.83–7.07 (Table S1; Figure 2) and averaged 4.37–5.26 in the eight regions (Table 2A). In general, Southwest China has calcareous soils in karst areas, with soil pH at 6.07–8.53 [22]. The data indicated that soil acidification occurred in the studied areas. The data were comparable with tea plantations in Anhui (pH = 4.8, n = 26) and Jiangsu (pH = 5.0, n = 74), China [15,23]. The nutritional status of pH value was divided into levels I, II, and III at 4.5–5.5, 4–4.5 or 5.5–6.5, and >6.5 or <4 (Table 1A). In the studied soil samples (n = 323), the ratio of soil pH reaching levels I, II, and III was 35.7–96.9%, 3.08–50%, and 1.02–14.3%, respectively (Table 2B). The data suggested that the pH value in these areas was within suitable ranges for tea plant growth. Indeed, tea trees often grow in soils with a pH of 4.0–6.5 [24]. Specifically, 98.7% of the pH values in the studied areas were within this range (Figure 2), again suggesting suitability for growing tea trees. The decreased soil pH was attributed to long-term tea planting [3], fertilizer application (especially N fertilizer) [13], root exudations like organic acids (oxalate, citrate, malate, and pyruvate) [5], and tea litter decomposition [11]. Among the eight regions, Jiangcheng showed the lowest soil pH, at 3.83–4.99 (averaging 4.37) (Figure 2 and Table 2A). Normally, a slightly acidic environment (pH = 4.0–6.5) benefits the growth of tea plants, while a highly acidic environment (pH < 4.0) can inhibit growth [24]. The strong acid environment renders nutrients being desorbed or dissolved, resulting in nutrient losses. Therefore, the soil pH in Jiangcheng should receive more attention to avoid acidification-induced nutrient losses. Moreover, decreased soil pH can change the phytoavailability of fertilizers and nutritional metals. Therefore, the available concentration of fertilizers and nutritional metals was analyzed, and the relationship with soil pH was examined.
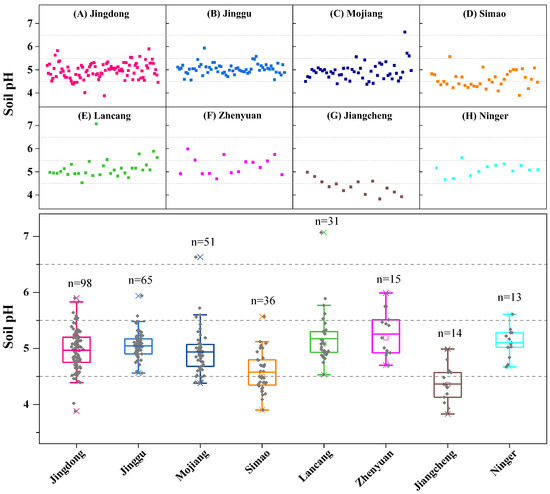
Figure 2.
The pH value of 323 sites in tea-growing soils from eight regions, including Jingdong (n = 98), Jinggu (n = 65), Mojiang (n = 51), Simao (n = 36), Lancang (n = 31), Zhenyuan (n = 15), Jiangcheng (n = 14), and Ninger (n = 13). Dashed lines classify nutritional status into level I (pH = 4.5–5.5), II (pH = 4–4.5 or 5.5–6.5), and III (pH > 6.5 or < 4) (NY/T 391–2021). The bottom and top of the box represent 25th and 75th percentiles, and error bar represents minimum and maximum value within the normal range, respectively. The square and solid line inside the box represent the median and mean value, respectively.
Table 2.
The mean values of soil pH, available concentration of fertilizer (N, P, and K), major elements (Ca, Mg, Fe, and Mn) and trace elements (Cu and Zn) (A), and percentage distribution of elemental nutritional status (%) (B) of tea plantations in 8 regions, including Jingdong (n = 98), Jinggu (n = 65), Mojiang (n = 51), Simao (n = 36), Lancang (n = 31), Zhenyuan (n = 15), Jiangcheng (n = 14), and Ninger (n = 13) in Puerh, Southwest China.
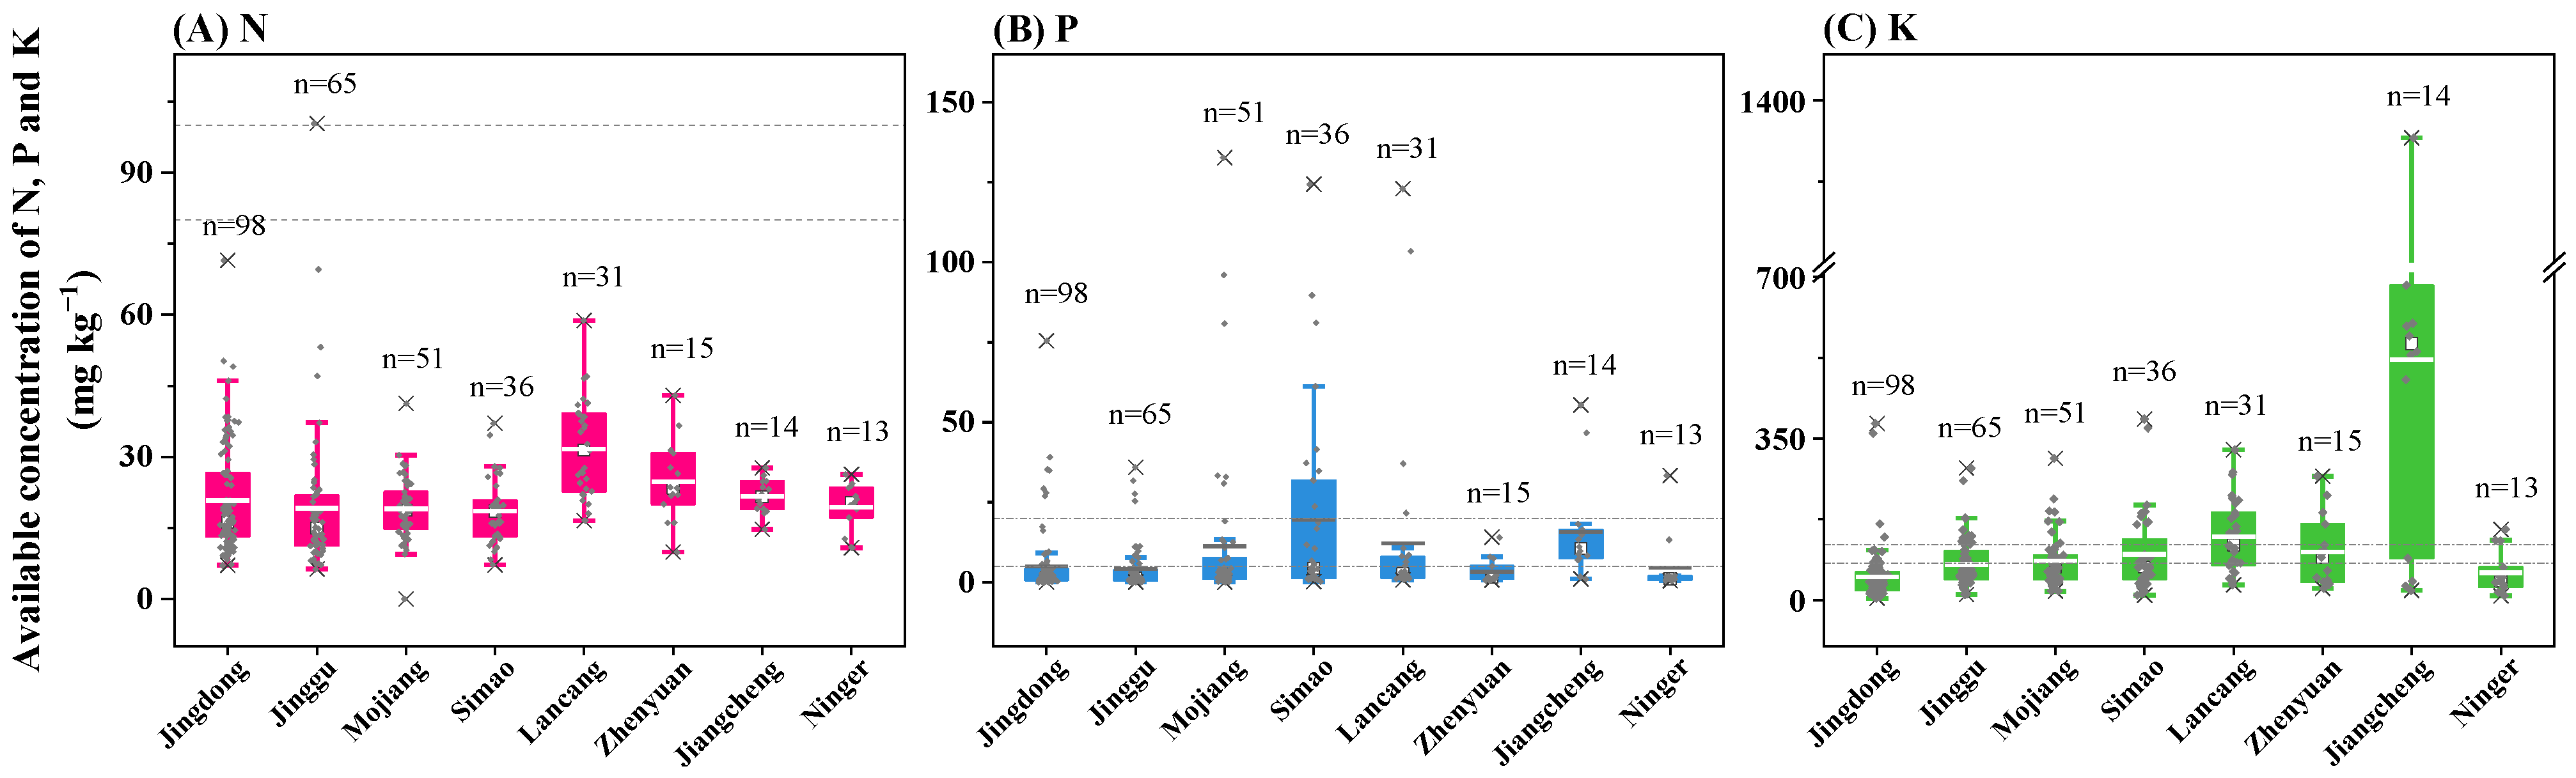
Available concentrations of N, P, and K showed strong heterogeneity, ranging at 0–358, 0.04–289, and 4.17–1319 mg kg−1 (Figure 3), with 0.3%, 11.5%, and 21.4% of the samples reaching nutritional level I (>100, >20 or >120 mg kg−1) (Table 1A and Table 2B). The data suggested a relatively low nutritional level of fertilizers evaluated based on the available concentration, which can be enhanced (especially N) to achieve better growth and yields of tea. Specifically, except for one soil in Jinggu that showed available N reached level I (>100 mg kg−1) (Figure 3A), all samples were classified at level III. Among the eight regions, Lancang had the most soil-available N (16.5–58.8 mg kg−1), while Simao had the lowest amount (7.23–37.1 mg kg−1), with mean values of 31.7 and 18.5 mg kg−1 (Figure 3A and Table 2A). The desirable concentration of available N for tea trees ranges from 120 to 150 mg kg−1 [25]. This again implies that the available N can be improved in the studied areas.
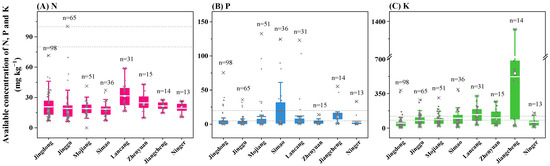
Figure 3.
Available concentration of N (A), P (B), and K (C) in tea plantations of 8 regions in Puerh, Southwest China (n = 323). Available concentrations of N (80, 100 mg kg−1), P (5, 20 mg kg−1), and K (80, 120 mg kg−1) classify soil nutritional status into level I (>100, >20, >120 mg kg−1), II (80–100, 5–20, 80–120 mg kg−1), and III (<80, <5, <80 mg kg−1) (NY/T 391–2021). The bottom and top of the box show the 25th and 75th percentiles, and error bar shows the minimum and maximum value within the normal range, respectively. The square and solid line inside the box represent the median and mean value, respectively.
Though Simao was the lowest in terms of soil-available N (Figure 3A), it was the highest in available P (0.18–289, averaging 34.2 mg kg−1) (Figure 3B). Specifically, 33.3% and 16.7% of soil-available P in Simao (Table 2B) reached nutritional levels I (>20 mg kg−1) and II (5–20 mg kg−1) (Table 1A). In contrast, Jinggu showed the highest ratio (3.08%) in soil-available N reaching level I, while that for available P was the lowest, at 6.15% (Table 2B). The data suggested strong heterogeneity of available N and P among different regions. Similarly to available N (96.9–100%), the majority of soil-available P (50–84.6%) was distributed at nutritional level III, except for Jiangcheng (14.3%). The suggested available P concentration to support plant growth is 15–30 mg kg−1 in acidic soils [26]. However, available P in 86.1% of the studied soils was at 0.044–14.1 mg kg−1, indicating that P fertilization can be improved in these areas. Generally, soils in Southwest China contain abundant Fe or Al oxy-hydroxides, which can bind P to decrease its availability [27]. Therefore, the levels of available P should be improved. To increase the available P concentration without elevating exogenous P application, organic P (like phytate) can be used as an abundant P source. Organic P, accounting for 20–80% of the total P, can be transformed to P via phosphatase-mediated hydrolysis [28]. Hence, methods to facilitate organic P hydrolysis can be used to improve the available P concentration [16].
In terms of soil-available K, Jiangcheng was the highest, at 21–1319 mg kg−1 (averaging 521 mg kg−1), which was 10-fold that of the lowest, Jingdong (4.17–382, aver-aging 50.2 mg kg−1) (Figure 3C and Table 2A). Consistent with the highest soil-available K concentration in Jiangcheng, its ratio at level I was the highest (71.4%) (Table 2B). However, the ratio of available K reaching nutritional level I in Jingdong was low (4.08%), with 87.8% at level III. Therefore, in addition to available N and P, available K should also be improved in these areas.
3.2. Available Concentrations of Macro-Metals
In addition to fertilization elements (N, P, and K), soil-available macro-metal concentrations were determined. Available concentrations of Ca, Mg, Fe, and Mn were also highly heterogeneous (8.17–4911, 2.42–334, 30.8–1768, and 0.95–442 mg kg−1) (Figure 4).
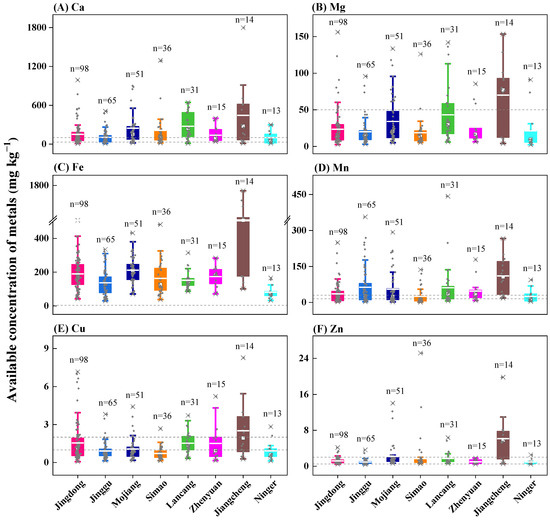
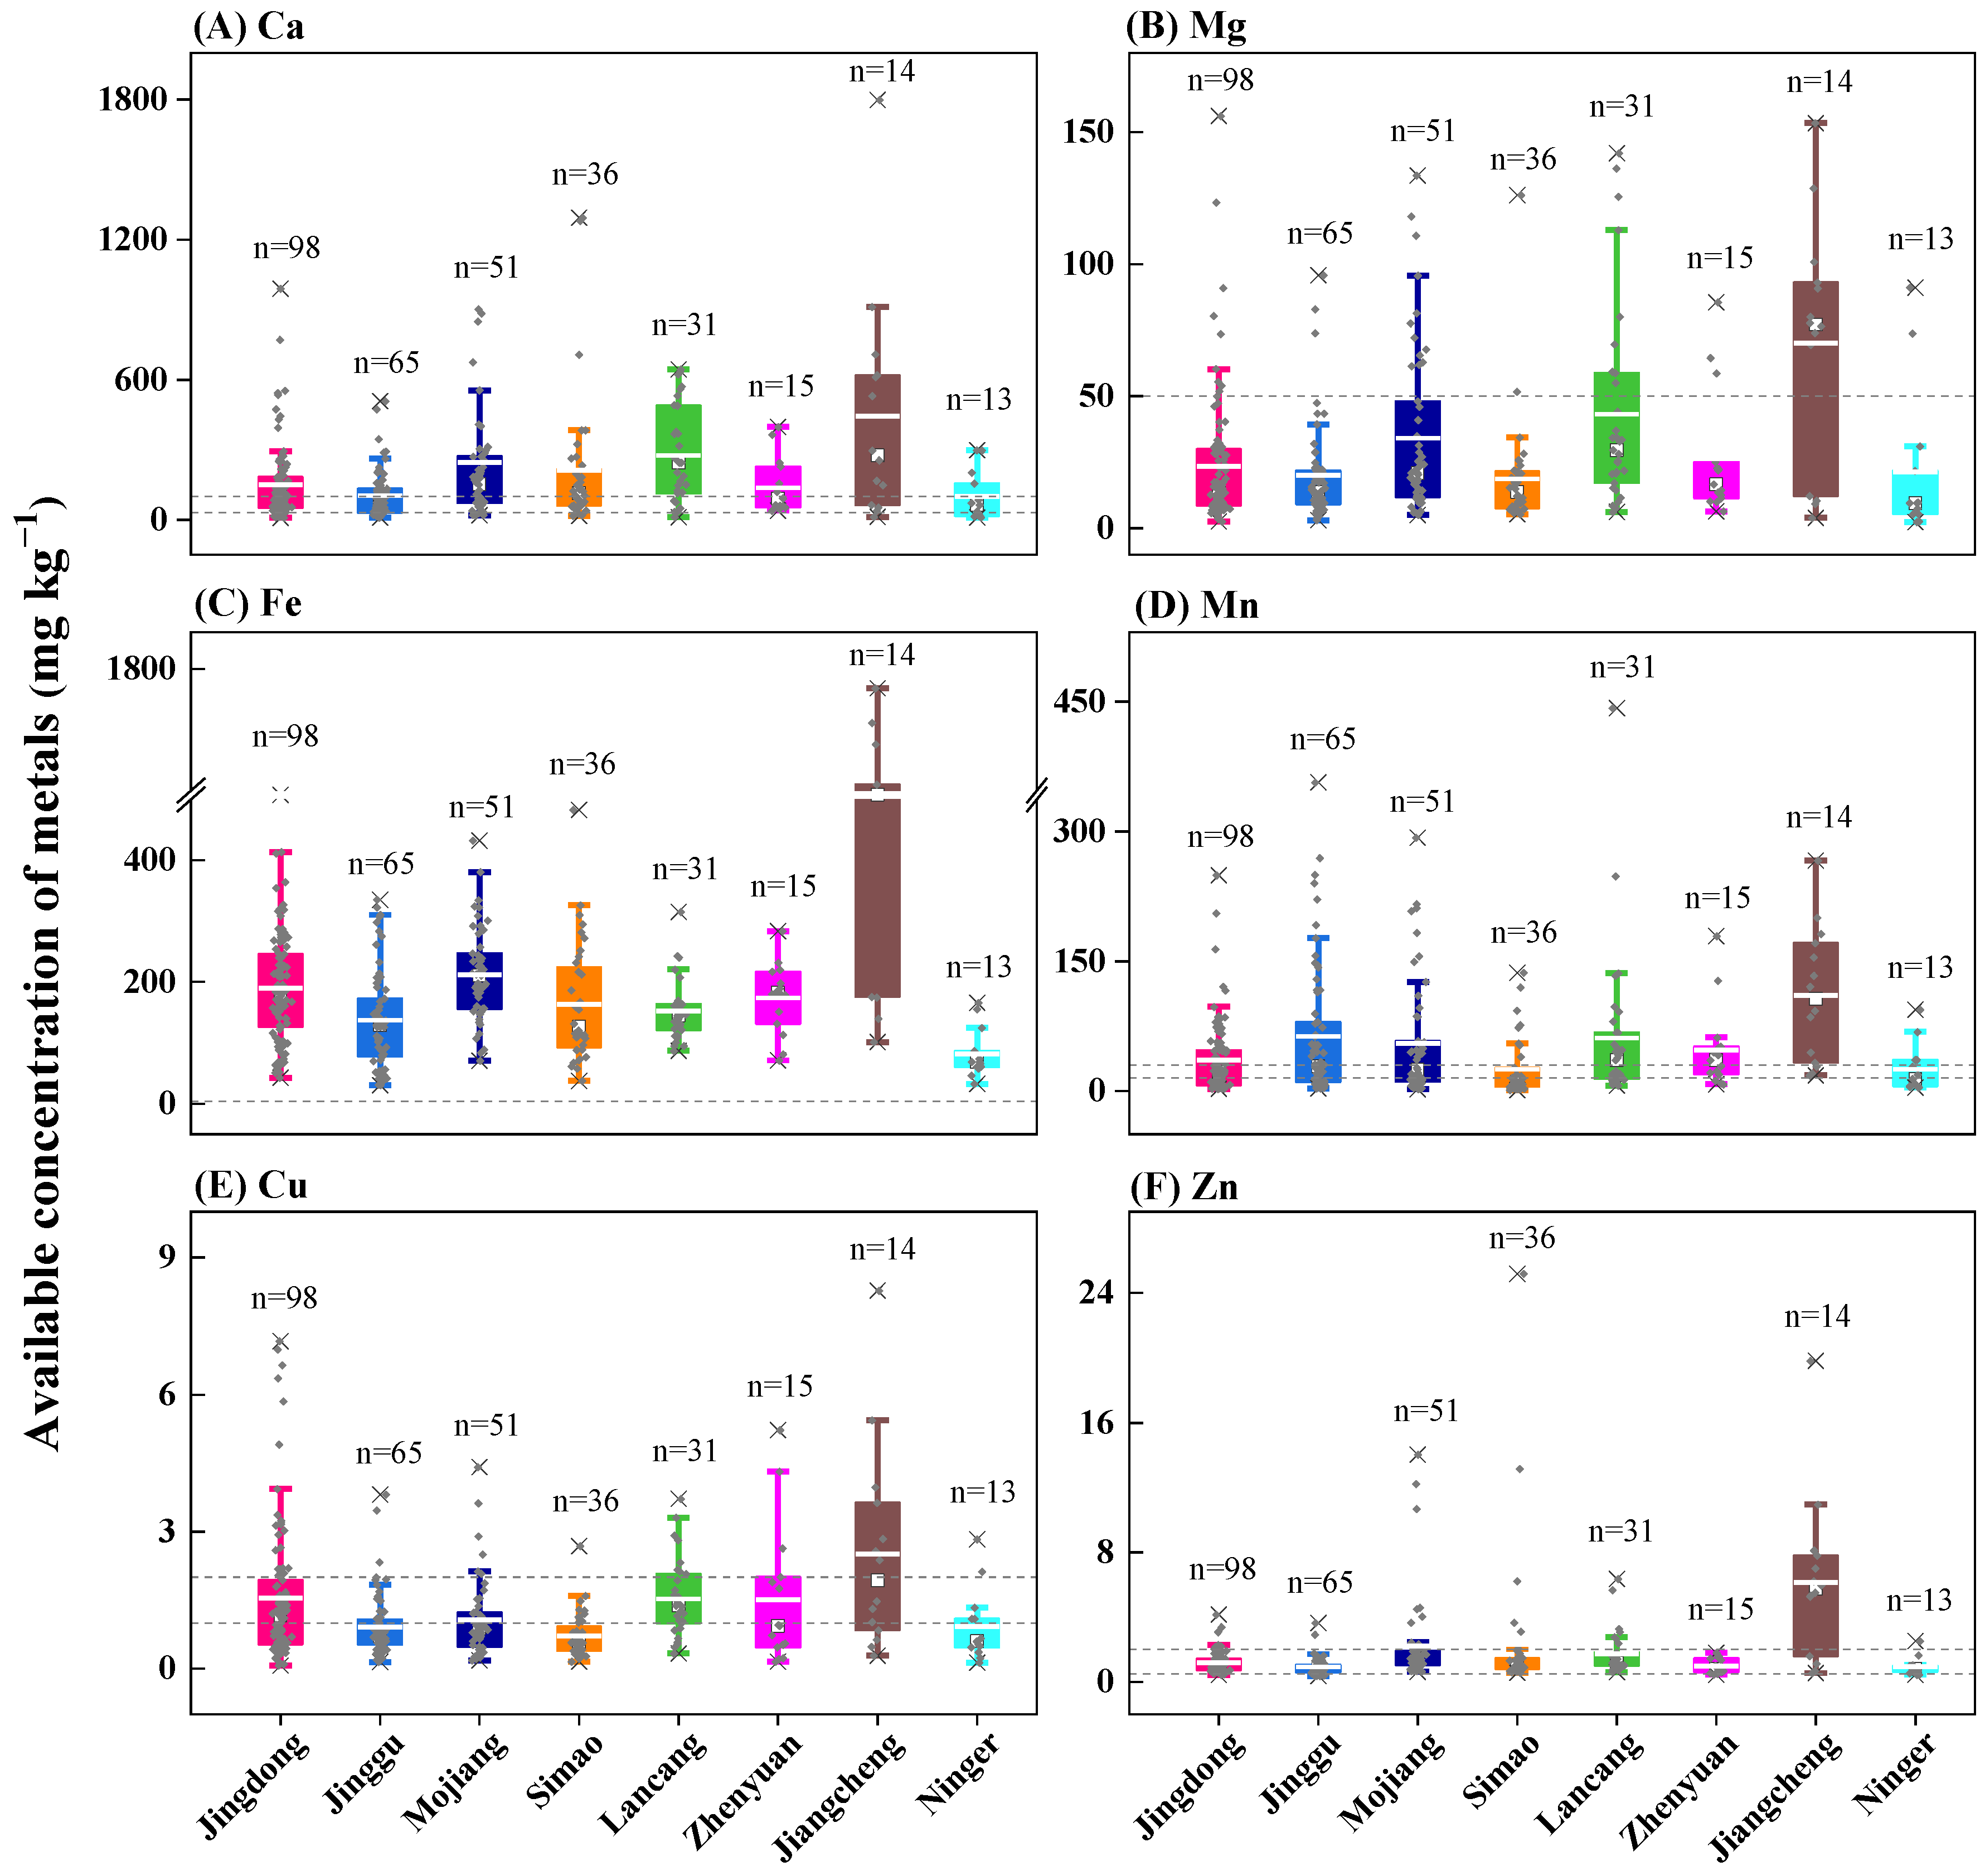
Figure 4.
Available concentration of Ca (A), Mg (B), Fe (C), Mn (D), Cu (E), and Zn (F) on tea plantations of eight regions in Puerh, Southwest China (n=323). Available concentrations of Ca (300, 1000 mg kg−1), Mg (50 mg kg−1), Fe (4.5 mg kg−1), Mn (15, 30 mg kg−1), Cu (1, 2 mg kg−1), and Zn (0.5, 2 mg kg−1) classify soil nutritional status into level I (>1000, >300, >4.5, >30, >2, >2 mg kg−1), II (300–1000, 50–300, >4.5, 15–30, 1–2, 0.5–2 mg kg−1), and III (<300, <50, <4.5, <15, <1, <0.5 mg kg−1) (NY/T 391–2021). The bottom and top of the box represent the 25th and 75th percentiles, and error bar rep-resents minimum and maximum value within the normal range, respectively. The square and solid line inside the box represent the median and mean value, respectively.
Similar to the highest K in Jiangcheng, the region also showed the highest available Ca (12–1799, averaging 444 mg kg−1), which was 4.48-fold that of the lowest in Ninger (10–298, averaging 99.1 mg kg−1) (Figure 4A and Table 2A). Correspondingly, the ratios at level I (>1000 mg kg−1) and II (300–1000 mg kg−1) were the highest, at 7.14% and 35.7% (Table 2B). In addition, available Ca concentrations were mainly (57.1–100%) distributed at nutritional level III (Table 1A and Table 2B). Sufficient available Ca (300–1000 mg kg−1) is important for plant growth, as it is involved in biochemical reactions such as photosynthesis, but extremely high concentrations (>1000 mg kg−1) can decrease P availability through fixation and show toxic effects on plants [26,29]. Therefore, available Ca (304–990 mg kg−1) in 13.3% of the studied soils was within suitable ranges for tea tree growth (Figure 4A).
Again, Jiangcheng was the highest in terms of soil-available Mg (3.97–291, aver-aging 84.3 mg kg−1). The data for the other regions were in the order of Lancang (6.16–334, 52.9 mg kg−1) > Mojiang (5.14–134, 34.2 mg kg−1) > Zhenyuan (6.47–85.6, 26.4 mg kg−1) > Jingdong (2.68–156, 23.6 mg kg−1) > Ninger (2.42–91.1, 21.3 mg kg−1) > Jinggu (3.14–95.9, 20.1 mg kg−1) > Simao (5.38–126, 18.7 mg kg−1) (Figure 4B and Table 2A). Similarly to Ca, except for Jiangcheng (71.4% at level II), available Mg in the other regions was mainly (67.7–94.4%) distributed at level III (<50 mg kg−1).
Similarly to available K, Ca, and Mg, Jiangcheng showed the highest soil-available Fe (101–1768, averaging 1060 mg kg−1), which was 12.9-fold that of the lowest in Ninger (32.9–166, averaging 82.3 mg kg−1) (Figure 4C and Table 2A). The available Fe concentration was consistent with that in Usangu Basin Mbeya–Tanzata at 81.1–471 mg kg−1 [26] while significantly higher than that in the Northern Nile Delta, Egypt (38.4–41.9 mg kg−1) [18]. The higher amount of available K, Ca, Mg, and Fe in soils of Jiangcheng was attributed to the lowest pH value (4.37) (Table 2A). In contrast to Ca and Mg, available Fe concentrations in all sites reached level I. The proposed concentration of available Fe for crop growth ranges from 0.3 to 10 mg kg−1 [29]. However, the high available Fe in these areas (30.8–1768 mg kg−1) (Figure 4C) may decrease P avail-ability, typically when the soil pH is below 5.5 [30]. This was consistent with the low available concentration of P, with 71.5% being at level III (Figure 3B).
The soil-available Mn concentration was in the order of Jiangcheng (17.8–266, 111 mg kg−1) > Jinggu (2.89–357, 63.1 mg kg−1) > Lancang (6.42–442, 61 mg kg−1) > Mojiang (2.02–293, 55.1 mg kg−1) > Zhenyuan (7.66–179, 47.4 mg kg−1) > Jingdong (2.51–249, 35.7 mg kg−1) > Simao (0.95–137, 25.2 mg kg−1) = Ninger (3.88–93.9, 25.2 mg kg−1) (Figure 4D and Table 2A). In general, 22.2–78.6% of the samples were distributed at nutritional level I, 11.1–26.7% at level II, and 20–66.7% at level III (Table 2B). Again, Jiangcheng showed the highest available Mn concentration, with the highest ratio (78.6%) reaching level I (>30 mg kg−1) (Table 2B), which was related to its low pH values.
3.3. Soil-Available Trace Metal Concentrations
Cu and Zn were essential trace elements for tea trees’ development, affecting tea production [31]. Soil-available Cu and Zn concentrations were 0.07–8.28 and 0.36–25.2 mg kg−1 (Figure 4E,F). The soil-available Cu concentration was in the order of Jiangcheng (0.29–8.28, 2.51 mg kg−1) > Jingdong (0.07–7.18, 1.54 mg kg−1) > Lancang (0.34–3.72, 1.53 mg kg−1) > Zhenyuan (0.15–5.23, 1.51 mg kg−1) > Mojiang (0.18–4.42, 1.07 mg kg−1) > Ninger (0.13–2.84, 0.92 mg kg−1) > Jinggu (0.41–3.82, 0.91 mg kg−1) > Simao (0.16–2.69, 0.71 mg kg−1) (Figure 4E and Table 2A). Consistent with fertilizer (K) and macro-metals, Jiangcheng showed the highest available Cu concentration and the highest ratio at level I (50%) (Table 2B). Moreover, similar to the lowest available Mg (18.7 mg kg−1) and Mn (25.2 mg kg−1), Simao showed the lowest available Cu (0.71 mg kg−1) and the lowest ratio at level I (2.78%). The proposed available Cu concentration for plant growth was > 0.2 mg kg−1 [26]. This indicated that available Cu (0.21–8.28 mg kg−1) in 97.2% of the sites was higher than the suggested value (Figure 4E).
The soil-available Zn concentration was in the order of Jiangcheng (0.54–19.8, 6.14 mg kg−1) > Simao (0.56–25.2, 2.32 mg kg−1) > Mojiang (0.63–14, 2.22 mg kg−1) > Lancang (0.62–6.37, 1.73 mg kg−1) > Jingdong (0.43–4.16, 1.18 mg kg−1) > Zhenyuan (0.44–1.79, 0.96 mg kg−1) > Ninger (0.44–2.52, 0.94 mg kg−1) > Jinggu (0.36–3.63, 0.94 mg kg−1) (Figure 4F and Table 2A). Among the eight regions, the available Zn concentration in 76.9–93.3% of soils was distributed at level II (0.5–2 mg kg−1), except for Jiangcheng (28.6%) (Table 2B). Specifically, Jiangcheng showed the highest ratio (71.4%) in reaching level I (>2 mg kg−1), corresponding to its highest available Zn concentration (0.54–19.8 mg kg−1). The average available Zn concentration (0.94–6.14 mg kg−1) (Table 2A) of 323 soil samples was greater than that of the tea-growing soils in the Eastern Black Sea, Turkey (1.21 mg kg−1) [32]. The proposed available concentration for Zn deficiency and excess for plant growth was 0.4–0.6 and 10–20 mg kg−1, respectively [29]. This indicated that available Zn in 86.4% of the studied soils reached a suitable level for tea plant growth.
3.4. Integrated Fertility Evaluation of Tea Plantations
The integrated fertility index (IFI) calculates soil fertility by integrating indices that strongly affect plant growth. Due to the different contributions of indices, coefficient variations were used to take the weight of indices into account. The coefficients include the membership value (Ni), average value of correlation coefficient (Vi), and weight coefficient (Wi) (Table 1C–E). The results showed that the IFI of the studied tea plantations in Puerh, Southwest China, was 0.47–0.89 (Table 2B). Specifically, Jiangcheng (IFI = 0.89) and Lancang (IFI = 0.83) were at level I (IFI ≥ 0.75), Ninger (IFI = 0.47) was at level III (0.25 ≤ IFI < 0.5), and the other regions were at level II (0.5 ≤ IFI < 0.75) (Table 2B). The fertility of soils is related to climate, soil-forming conditions, and anthropogenic influences [33,34]. Therefore, soil fertility analysis in tea plantations is important for fertility management and tea production [35,36].
3.5. Correlation Analysis
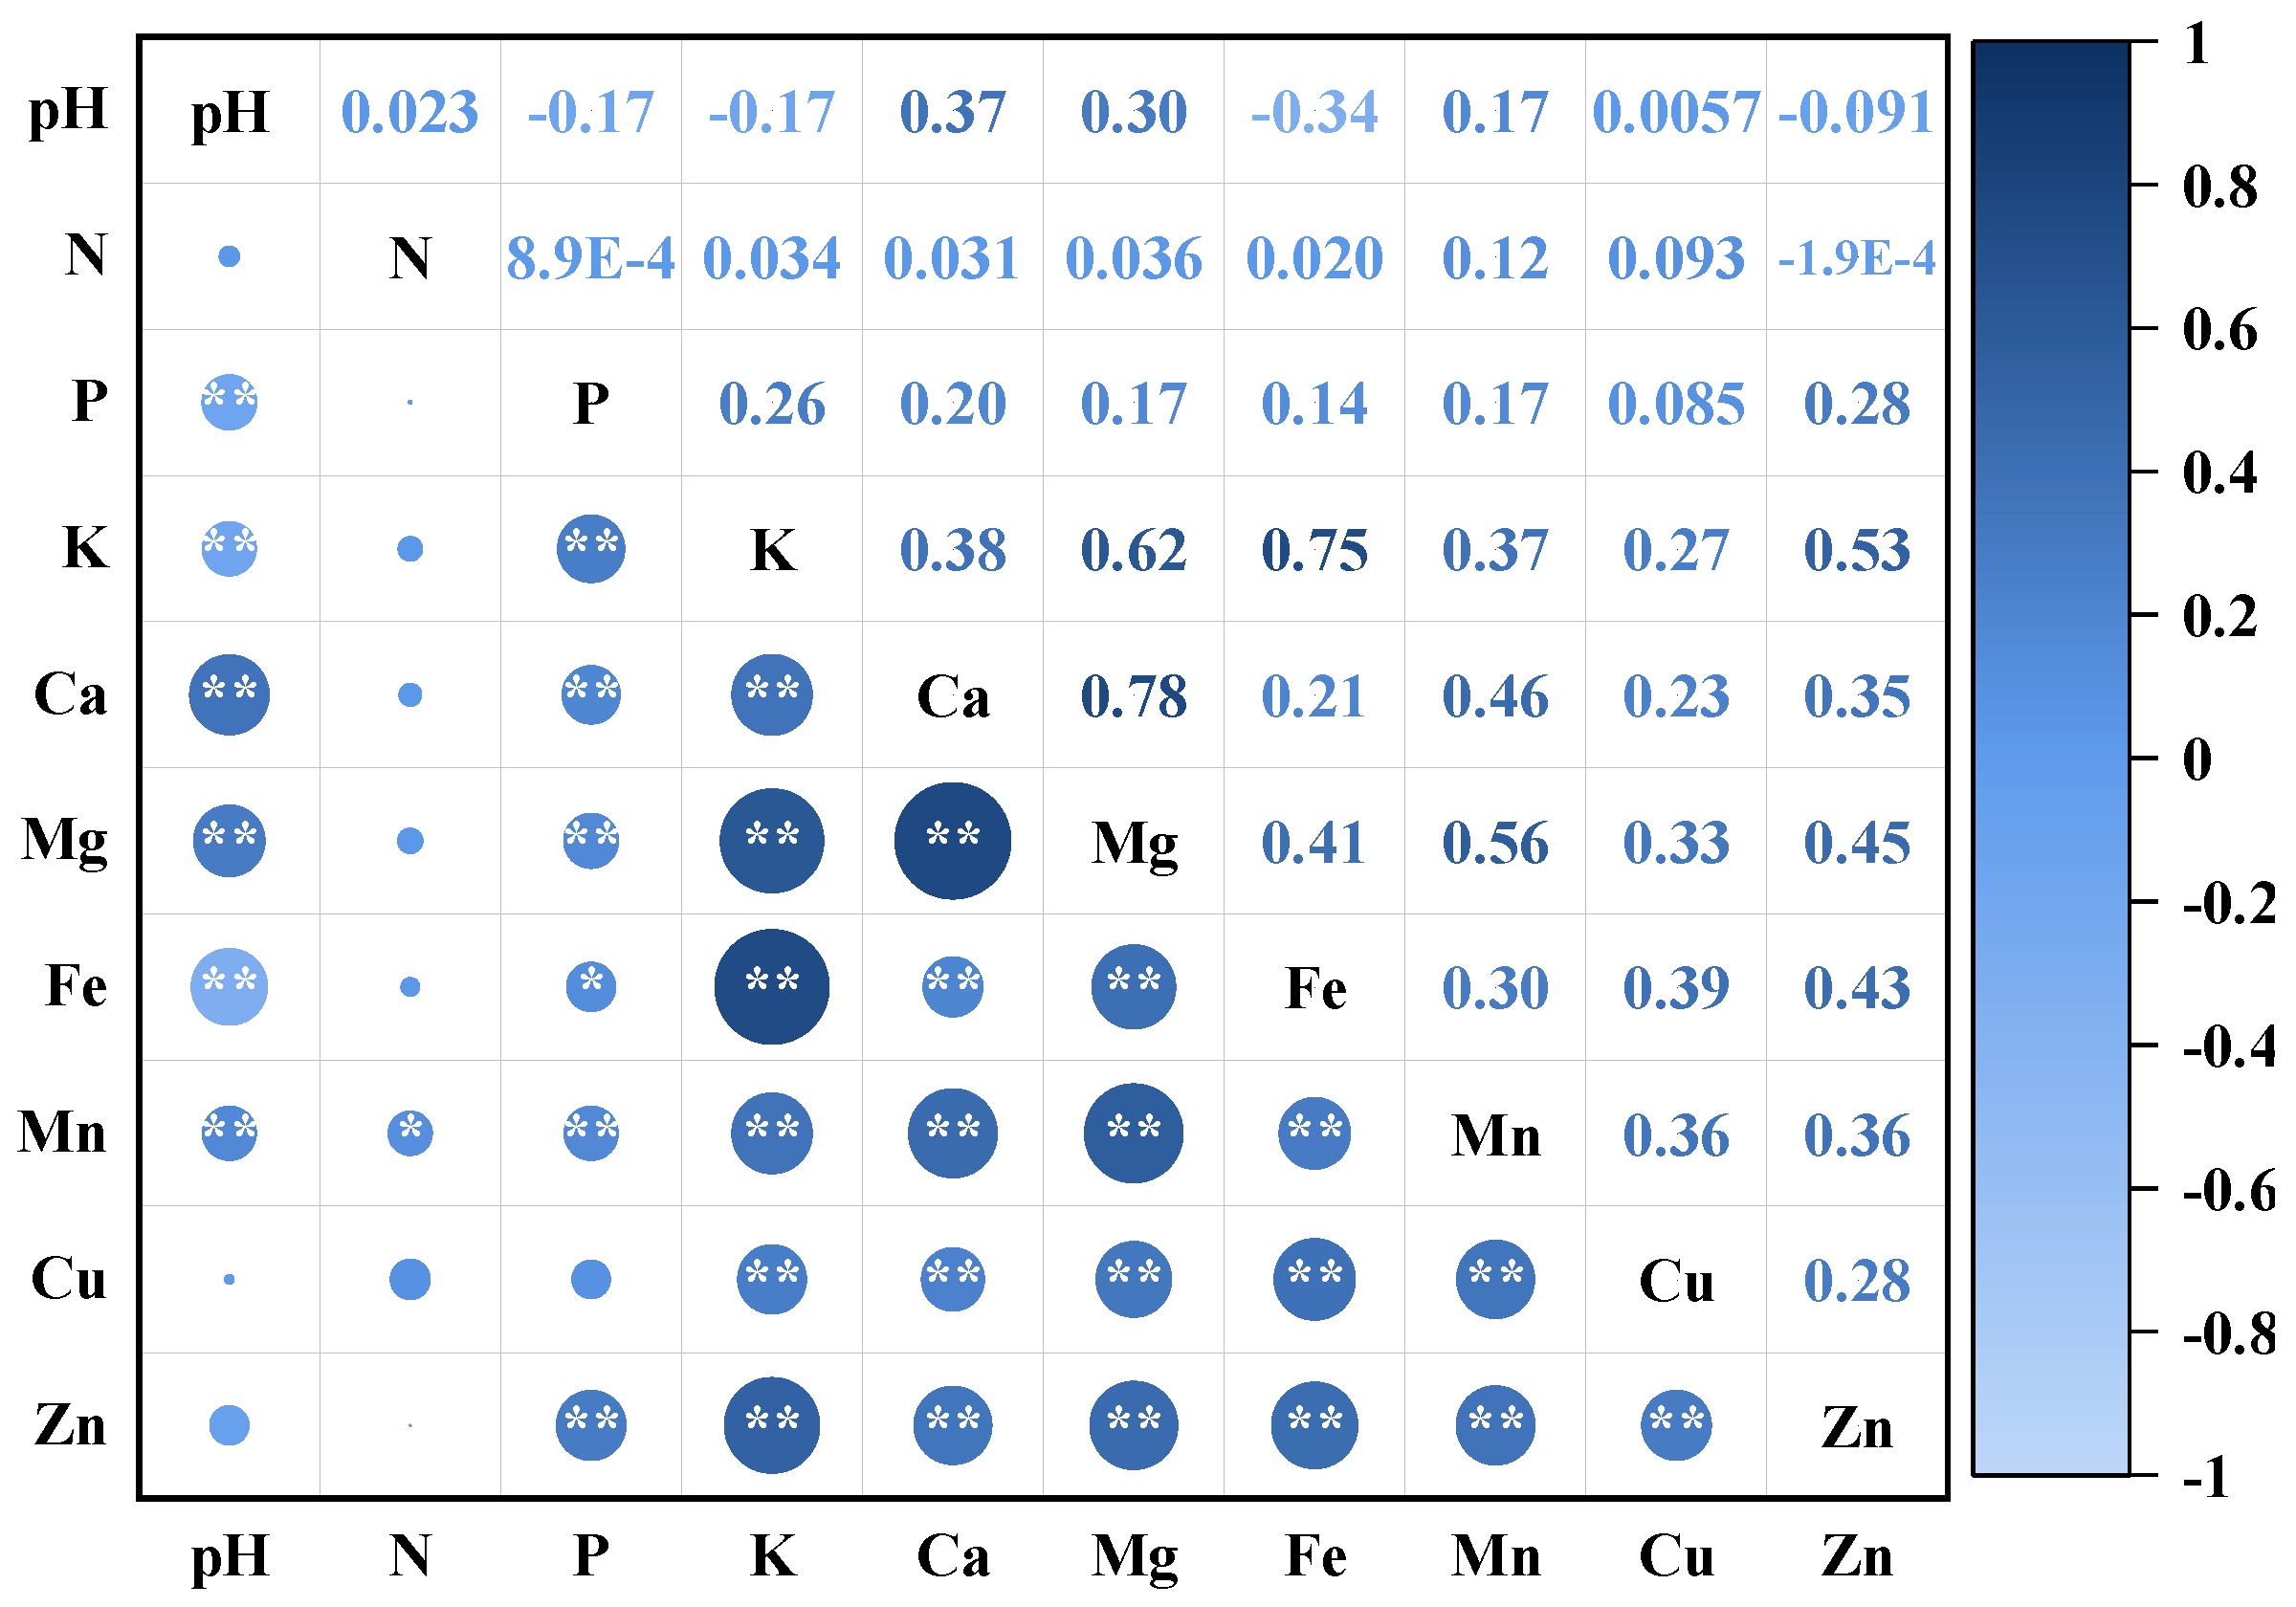
Soil major and trace elements’ availability varied with the soil pH value and fertilizer application. To quantify the effects, correlations of pH and available concentrations of fertilizers and multi-elements were analyzed (Figure 5). The data showed that soil pH was significantly negatively correlated with the available P and K (R = −0.17 and −0.17; p < 0.01) (Figure 5), indicating that excess P and K fertilization can decrease the soil pH. In soils, phosphoric acid in P fertilizers was transformed to H2PO4− and H+, which can induce soil acidification to pH < 2 [37]. However, available N showed no significant effect on soil pH (R = 0.023) (Figure 5). The correlation of N with soil pH was contrary to the reported trend that decreased pH with increasing N fertilizer application [38]. The difference may be due to the different N forms (available N vs. total N) used in Pearson correlation analysis between the studies. Normally, soil acidification induced by N fertilization was attributed to the formation of NH4+ [13], whose content corresponded to the total N content. In this study, the analyzed available N corresponded to exchangeable forms, including NH4+, NO3−, and NO2−. Therefore, the correlation between soil pH and total N was more significant than that with available N. Moreover, the available N concentration in the present study was relatively low (averaging 18.5–31.7 mg kg−1) (Table 2A), with only 3.08% reaching nutritional level I (>100 mg kg−1) (Table 2B), which may also contribute to the lack of a significant effect on soil pH. Therefore, the data indicated that available P and K had greater effects on soil pH than available N in the studied tea plantations.
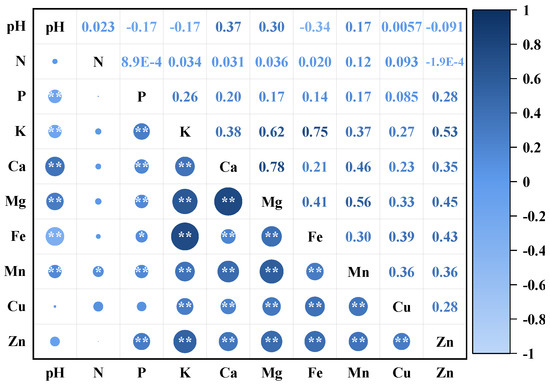
Figure 5.
Correlations among pH value, available concentrations of fertilizers, and macro- and micro-elements with significance levels at p < 0.05 (*) and p < 0.01 (**).
Given the strong negative correlation of available P and K with soil pH, it is hypothesized that the relatively high available P and K (11.5% and 21.4% reaching nutritional level I) may increase nutritional metals’ availability by decreasing the soil pH. This was supported by the data, which showed that available K was significantly positively correlated with the available concentration of metals (R = 0.27–0.75; p < 0.01). Similarly, available P was positively correlated with all metals except for Cu (R = 0.14–0.28; p < 0.01 or p < 0.05). This was further supported by the negative correlation of available Fe and Zn with soil pH (R = −0.34 and −0.091) and positive correlation with available P (R = 0.14 and 0.28; p < 0.01) and K (R = 0.75 and 0.53; p < 0.01) (Figure 5). The negative correlation between the soil pH and available Zn was consistent with that in tea-growing soils in Shaanxi Province, China (R = −0.02, p < 0.05) [39]. However, available N showed no significant correlation with available metals (R = 0.0019–0.12). This was consistent with the finding that N fertilization at 100–500 mg kg−1 showed no significant effect on soil acid-soluble Mn [11]. In addition to decreasing the soil pH, P can mobilize cations via chelation or adsorption reactions. Overall, the data indicated a stronger effect of P and K than N in affecting the availability of metals by decreasing the soil pH in the studied areas. Therefore, K and P should receive more attention during fertilization management in tea plantations.
4. Conclusions
To quantify the relationships among fertilizer, soil pH, and available concentration of metals, 323 tea-growing soils were sampled in eight regions of Puerh, Southwest China. The data showed that soils were acidified (pH = 3.83–5.5). Soil pH (98.7%), available Fe (100%), Ca (98.5%), Cu (97.2%), and Zn (86.4%) in the studied areas were within suitable ranges for tea tree growth. However, available N (97%) and Mg (84%) were lower than nutritional level III, and P (86.1%) was lower than the lowest value to support plant growth. The data suggested that N, P, and Mg can be improved in the studied areas to ensure tea tree growth. The nutritional level of each index was com-plex, suggesting that multiple indices should be involved to achieve a more reliable fertility assessment. Overall fertility (IFI = 0.47–0.89) was distributed at levels I–III, with Jiangcheng showing the highest IFI at level I. Among the fertilizers, available P and K showed a significant negative correlation with pH and a positive correlation with the available concentration of metals. However, available N showed no significant correlation with either soil pH or available metals, which was contrary to previous reports. The relationships among the indices of field samples are associative and limited in causality, so the difference and correlation of total N or available N with soil pH need further investigations. The data indicated that P and K have greater effects than N on mediating the availability of metals by decreasing the soil pH. Therefore, P and K should be paid more attention during fertilization management in tea plantations.
Supplementary Materials
The following supporting information can be downloaded at: https://www.mdpi.com/article/10.3390/agriculture15090953/s1, Table S1: Soil pH and available concentration of elements of 323 tea plantation soils from 8 regions, including Jingdong (n = 98), Jinggu (n = 65), Mojiang (n = 51), Simao (n = 36), Lancang (n = 31), Zhenyuan (n = 15), Jiangcheng (n = 14), and Ninger (n = 13).
Author Contributions
Conceptualization, Z.L. and Y.L.; methodology, Z.L. and Y.J.; software, Y.J.; formal analysis, Z.L.; investigation, Z.L.; resources, L.C. and X.Y.; data curation, Z.L.; writing—original draft preparation, Z.L. and Y.J.; writing—review and editing, X.L.; supervision, Y.L. and X.L.; funding acquisition, Y.L. and X.L. All authors have read and agreed to the published version of the manuscript.
Funding
This work was supported by Yunnan Science and Technology Department Technology Plan Projects (202402AE090015), Yunnan Agricultural Joint Research Foundation (202101BD070001-043 and 202301BD070001-154), and Yunnan Xingdian Talent Project (YNQR-QNRC-2019-027).
Institutional Review Board Statement
Not applicable.
Data Availability Statement
The data presented in this study are available on request from the corresponding author.
Acknowledgments
We thank Yuanyan Zhao from the Pu’er Institute of Agricultural Sciences for her help in sample collection and data analysis.
Conflicts of Interest
The authors declare no conflict of interest.
References
- Brzezicha-Cirocka, J.; Grembecka, M.; Ciesielski, T.; Flaten, T.P.; Szefer, P. Evaluation of macro- and microelement levels in black tea in view of its geographical origin. Biol. Trace Elem. Res. 2016, 176, 429–441. [Google Scholar] [CrossRef] [PubMed]
- Caputo, J.; Beier, C.M.; Sullivan, T.J.; Lawrence, G.B. Modeled effects of soil acidification on long-term ecological and economic outcomes for managed forests in the Adirondack region (USA). Sci. Total Environ. 2016, 565, 401–411. [Google Scholar] [CrossRef]
- Yang, X.D.; Ni, K.; Shi, Y.Z.; Yi, X.Y.; Zhang, Q.F.; Fang, L.; Ma, L.F.; Ruan, J.Y. Effects of long-term nitrogen application on soil acidification and solution chemistry of a tea plantation in China. Agric. Ecosyst. Environ. 2018, 252, 74–82. [Google Scholar] [CrossRef]
- Orimadegun, B.E.; Bolajoko, E.B.; Onyeaghala, A.A.; Ademola-Aremu, O.O. Quantitative analyses of phytochemical and trace elements contents of daily detox, herbal tea consumed in Nigeria. J. Med. Plants Res. 2018, 12, 289–295. [Google Scholar] [CrossRef]
- Yan, P.; Wu, L.Q.; Wang, D.H.; Fu, J.Y.; Shen, C.; Li, X.; Zhang, L.P.; Zhang, L.; Fan, L.C.; Han, W.Y. Soil acidification in Chinese tea plantations. Sci. Total Environ. 2020, 715, 136963–136969. [Google Scholar] [CrossRef]
- Brzezicha-Cirocka, J.; Grembecka, M.; Szefer, P. Monitoring of essential and heavy metals in green tea from different geographical origins. Environ. Monit. Assess. 2016, 188, 183–193. [Google Scholar] [CrossRef]
- Zhang, J.; Yang, R.; Chen, R.; Peng, Y.; Wen, X.; Gao, L. Accumulation of heavy metals in tea leaves and potential health risk assessment: A case study from Puan County, Guizhou Province, China. Int. J. Environ. Res. Public Health 2018, 15, 133. [Google Scholar] [CrossRef]
- Alnaimat, A.S.; Barciela-Alonso, M.C.; Herbello-Hermelo, P.; Dominguez-Gonzalez, R.; Bermejo-Barrera, P. In vitro assessment of major and trace element bioaccessibility in tea samples. Talanta 2021, 225, 122083–122091. [Google Scholar] [CrossRef]
- Laik, R.J.; Singh, S.K.; Pramanick, B.; Kumari, V.; Nath, D.; Dessoky, E.S.; Attia, A.O.; Hassan, M.M.; Hossain, A. Improved method of boron fertilization in rice (Oryza sativa L.)–Mustard (Brassica juncea L.) cropping system in upland calcareous soils. Sustainability 2021, 13, 5037. [Google Scholar] [CrossRef]
- Kelepertzis, E. Accumulation of heavy metals in agricultural soils of Mediterranean: Insights from Argolida basin, Peloponnese, Greece. Geoderma 2014, 221–222, 82–90. [Google Scholar] [CrossRef]
- Li, Y.; Liu, K.H.; Zhu, J.; Jiang, Y.R.; Huang, Y.Y.; Zhou, Z.M.; Chen, C.S.; Yu, F.M. Manganese accumulation and plant physiology behavior of Camellia oleifera in response to different levels of nitrogen fertilization. Ecotoxicol. Environ. Saf. 2019, 184, 109603–109611. [Google Scholar] [CrossRef] [PubMed]
- Yan, P.; Shen, C.; Fan, L.C.; Li, X.; Zhang, L.P.; Zhang, L.; Han, W.Y. Tea planting affects soil acidification and nitrogen and phosphorus distribution in soil. Agric. Ecosyst. Environ. 2018, 254, 20–25. [Google Scholar] [CrossRef]
- Qiao, C.L.; Mia, S.; Wang, Y.Q.; Hou, J.J.; Xu, B. Assessing the effects of nitrification inhibitor DMPP on acidification and inorganic N leaching loss from tea (Camellia sinensis L.) cultivated soils with increasing urea–N rates. Sustainability 2021, 13, 994. [Google Scholar] [CrossRef]
- Lucas, R.W.; Klaminder, J.; Futter, M.N.; Bishop, K.H.; Egnell, G.; Laudon, H.; Hogberg, P. A meta-analysis of the effects of nitrogen additions on base cations: Implications for plants, soils, and streams. Forest Ecol. Manag. 2011, 262, 95–104. [Google Scholar] [CrossRef]
- Wen, B.; Li, L.; Duan, Y.; Zhang, Y.; Shen, J.; Xia, M.; Wang, Y.; Fang, W.; Zhu, X. Zn, Ni, Mn, Cr, Pb and Cu in soil-tea ecosystem: The concentrations, spatial relationship and potential control. Chemosphere 2018, 204, 92–100. [Google Scholar] [CrossRef]
- Ye, F.X.; Luo, Z.W.; Ju, Y.W.; Huan, Q.; Liu, X. Roles of N and P in soil acidification, metals mobilization and bioavailable concentration-based soil fertility assessment in tea plantations in Yunnan, China. Agriculture 2025, 15, 543. [Google Scholar] [CrossRef]
- Milani, R.F.; Morgano, M.A.; Saron, E.S.; Silva, F.F.; Cadore, S. Evaluation of direct analysis for trace elements in tea and herbal beverages by ICP-MS. J. Braz. Chem. Soc. 2015, 26, 1211–1217. [Google Scholar] [CrossRef]
- Aitta, A.; Aitta, A.; El-Ramady, H.; Alshaal, T.; El-Henawy, A.; Shams, M.; Talha, N.; Elbehiry, F.; Brevik, E.C. Seasonal and spatial distribution of soil trace elements around Kitchener drain in the northern Nile Delta, Egypt. Agriculture 2019, 9, 152. [Google Scholar] [CrossRef]
- Liu, X.; Fu, J.W.; Tang, N.; da Silva, E.B.; Cao, Y.; Turner, B.L.; Chen, Y.S.; Ma, L.Q. Phytate induced arsenic uptake and plant growth in arsenic-hyperaccumulator Pteris vittata. Environ. Pollut. 2017, 226, 212–218. [Google Scholar] [CrossRef]
- Santos, W.P.D.; Silva, M.L.N.; Avanzi, J.C.; Acuna-Guzman, S.F.; Candido, B.M.; Cirillo, M.A.; Curi, N. Soil quality assessment using erosion-sensitive indices and fuzzy membership under different cropping systems on a Ferralsol in Brazil. Geoderma Reg. 2021, 25, e00385–e00394. [Google Scholar] [CrossRef]
- Orhan, D.; Serkan, I.; Fikret, S.; Ali, I. Assessment of soil quality index for tea cultivated soils in Ortaçay Micro catchment in Black Sea region. J. Agric. Sci. 2020, 26, 42–53. [Google Scholar]
- Qi, D.H.; Wieneke, X.W.; Tao, J.P.; Zhou, X.; Desilva, U. Soil pH is the primary factor correlating with soil microbiome in karst rocky desertification regions in the Wushan county, Chongqing, China. Front. Microbiol. 2018, 9, 1027–1038. [Google Scholar] [CrossRef] [PubMed]
- Peng, C.Y.; Zhu, X.H.; Hou, R.Y.; Ge, G.F.; Hua, R.M.; Wan, X.C.; Cai, H.M. Aluminum and heavy metal accumulation in tea leaves: An interplay of environmental and plant factors and an assessment of exposure risks to consumers. J. Food Sci. 2018, 83, 1165–1172. [Google Scholar] [CrossRef]
- Ruan, J.Y.; Gerendas, J.; Hardter, R.; Sattelmacher, B. Effect of nitrogen form and root-zone pH on growth and nitrogen uptake of tea (Camellia sinensis) plants. Ann. Bot. 2007, 99, 301–310. [Google Scholar] [CrossRef] [PubMed]
- Aslani, M.; Souri, M.K. Growth and quality of green bean (Phaseolus vulgaris L.) under foliar application of organic-chelate fertilizers. Open Agric. 2018, 3, 146–154. [Google Scholar] [CrossRef]
- Marco, M.; Linus, K.M.; William, B.; Sean, C.; Thomas, H.H.; Patrick, A.N. Soil fertility and land sustainability in Usangu Basin-Tanzania. Heliyon 2021, 7, e07745–e07756. [Google Scholar]
- McKenzie, N.N.; Jacquier, D.D.; Isbell, R.R.F.; Brown, K.K. Australian Soils and Landscapes: An Illustrated Compendium; CSIRO: Collingwood, BC, Canada, 2004; pp. 62–64.
- George, T.S.; Turner, B.L.; Gregory, P.J.; Cade-Menun, B.J.; Richardson, A.E. Depletion of organic phosphorus from Oxisols in relation to phosphatase activities in the rhizosphere. Eur. J. Soil Sci. 2006, 57, 47–57. [Google Scholar] [CrossRef]
- Ndakidemi, P.A.; Semoka, J.M.R. Soil fertility survey in western Usambara mountains, northern Tanzania. Pedosphere 2006, 16, 237–244. [Google Scholar] [CrossRef]
- Mhoro, L.; Semu, E.; Amuri, N.; Msanya, B.; Munishi, J.A.; Malley, Z. Growth and yield responses of rice, wheat and beans to Zn and Cu fertilizers in soils of Mbeya region, Tanzania. Int. J. Agric. Pol. Res. 2015, 3, 402–441. [Google Scholar]
- Chang, C.T.; You, C.F.; Aggarwal, S.K.; Chung, C.H.; Chao, H.C.; Liu, H.C. Boron and strontium isotope ratios and major/trace elements concentrations in tea leaves at four major tea growing gardens in Taiwan. Environ. Geochem. Health 2016, 38, 737–748. [Google Scholar] [CrossRef]
- Ozyazici, M.A.; Ozyazici, G.; Dengiz, O. Determination of micronutrients in tea plantations in the eastern Black Sea region, Turkey. Afr. J. Agric. Res. 2011, 6, 5174–5180. [Google Scholar]
- Liu, J.; Wu, L.C.; Chen, D.; Yu, Z.G.; Wei, C.J. Development of a soil quality index for Camellia oleifera forestland yield under three different parent materials in Southern China. Soil Tillage Res. 2018, 176, 45–50. [Google Scholar] [CrossRef]
- Tian, K.; Zhang, B.E.; Zhang, H.D.; Huang, B.; Darilek, J.L.; Zhao, Y.C.; Yang, J.S. Evaluation of soil quality in major grain-producing region of the north China plain: Integrating minimum data set and established critical limits. Ecol. Indic. 2020, 117, 106613–106622. [Google Scholar] [CrossRef]
- Xie, L.W.; Zhong, J.; Chen, F.F.; Cao, F.X.; Li, J.J.; Wu, L.C. Evaluation of soil fertility in the succession of karst rocky desertification using principal component analysis. Solid Earth 2015, 6, 515–524. [Google Scholar] [CrossRef]
- Chen, J.; Qu, M.K.; Zhang, J.L.; Xie, E.Z.; Huang, B.; Zhao, Y.C. Soil fertility quality assessment based on geographically weighted principal component analysis (GWPCA) in large-scale areas. Catena 2021, 201, 105197–105207. [Google Scholar] [CrossRef]
- Bolan, N.S.; Adriano, D.C.; Naidu, R. Role of phosphorus in (im) mobilization and bioavailability of heavy metals in the soil-plant system. Rev. Environ. Contam. T. 2003, 177, 1–44. [Google Scholar]
- Liu, Y.L.; Zhang, M.; Li, Y.; Zhang, Y.R.; Huang, X.C.; Yang, Y.H.; Zhu, H.Q.; Xiong, H.; Jiang, T.M. Influence of nitrogen fertilizer application on soil acidification characteristics of tea plantations in karst areas of southwest China. Agriculture 2023, 13, 849. [Google Scholar] [CrossRef]
- Zhao, Z.; Yan, S.; Duan, M.; Fu, J.; Tong, Y. Assessing heavy metal pollution and potential ecological risk of tea plantation soils. Int. J. Agric. Biol. Eng. 2019, 12, 185–191. [Google Scholar] [CrossRef]
Disclaimer/Publisher’s Note: The statements, opinions and data contained in all publications are solely those of the individual author(s) and contributor(s) and not of MDPI and/or the editor(s). MDPI and/or the editor(s) disclaim responsibility for any injury to people or property resulting from any ideas, methods, instructions or products referred to in the content. |
© 2025 by the authors. Licensee MDPI, Basel, Switzerland. This article is an open access article distributed under the terms and conditions of the Creative Commons Attribution (CC BY) license (https://creativecommons.org/licenses/by/4.0/).