Article

Modeling Sunflower Root Water Uptake Under Soil Water and Salinity Conditions Across Soil Depths

1
College of Water Conservancy and Civil Engineering, Inner Mongolia Agricultural University, Hohhot 010018, China
2
Autonomous Region Collaborative Innovation Center for Integrated Management of Water Resources and Water Environment in the Inner Mongolia Reaches of the Yellow River, Hohhot 010018, China
3
State Key Laboratory of Water Engineering Ecology and Environment in Arid Area, Inner Mongolia Agricultural University, Hohhot 010018, China
4
College of Energy and Environment, Inner Mongolia University of Science and Technology, Baotou 014020, China
*
Author to whom correspondence should be addressed.
Agriculture 2026, 16(10), 1050; https://doi.org/10.3390/agriculture16101050
Submission received: 13 March 2026 / Revised: 29 April 2026 / Accepted: 8 May 2026 / Published: 12 May 2026

Abstract

This study aims to quantify the response of sunflower root water uptake to stratified soil water and salinity stress. Based on field observations, the root water uptake function in the existing model was improved by developing a new equation for the root water uptake rate that accounts for spatial differences in root response. Field experiments were conducted in 2021 and 2022 using irrigation water with four salinity levels: CK (0.87 g/L), S1 (1.0 g/L), S2 (1.5 g/L), and S3 (2.0 g/L). Soil moisture and salinity in five soil layers (0–100 cm) were continuously monitored using sensors. The actual crop water requirement (ETa) was estimated using the soil water balance method, while the actual (Ta) and potential (Tp) plant transpiration rates were calculated based on the canopy-scale water consumption principle. Results indicated that with increasing irrigation water salinity, both soil moisture content and electrical conductivity exhibited an overall increasing trend. Significant differences were observed in the combined soil moisture and salinity conditions across soil depths. In particular, salt accumulation in the surface layer reduced root water uptake in the upper soil profile. Based on the differential root response to soil water and salinity stratification, the root water uptake function was further optimized, and the parameters representing water and salinity conditions in each soil layer were calibrated using the least squares method. Model validation with 2021 and 2022 data demonstrated good agreement between simulated and observed Ta values, with RMSE = 11.41 mm and MRE = 0.32%, R2 ranging from 0.66 to 0.98, NSE between 0.52 and 0.96, and regression slope b between 0.90 and 1.10. This enhancement in the root water uptake rate formulation significantly improves model simulation accuracy and provides a robust basis for optimizing irrigation management in saline–alkali environments.

1. Introduction

Freshwater scarcity poses a critical challenge to agricultural development and social stability in semi-arid regions [1]. To mitigate water shortages in arid and semi-arid areas, the use of unconventional water sources for irrigation has become increasingly common. However, if not properly managed, such practices may exacerbate water scarcity and accelerate soil salinization [2,3]. Salinity in the root zone inhibits the ability of plants to absorb water [4], and when transpiration cannot meet atmospheric demand, plants experience water deficits [5,6,7]. Therefore, quantifying the influence of soil moisture and salinity on root water uptake is crucial for understanding soil–plant–atmosphere interactions, simulating plant transpiration, and evaluating root zone water status. This understanding is vital for minimizing the negative impact of salinity on crops and improving water use efficiency.
Currently, two main approaches are used to study root water uptake: microscopic and macroscopic methods. The microscopic method, introduced by Gardner [8], requires detailed knowledge of root geometry and is difficult to apply under field conditions due to its complex parameterization [9]. Consequently, its use in field experiments remains limited [10]. In contrast, the macroscopic method integrates root water uptake with the Richards equation and employs empirical functions that account for both water and salinity [11,12,13,14]. This approach requires fewer input parameters and has been widely applied [11,12,15]. Several water–salt stress response functions, including linear, S-shaped, and convex-concave functions, have been developed based on matric and osmotic potential. Although these functions have been validated and applied in certain environments [16,17], there is still a challenge in determining the threshold values for specific plant responses to soil moisture and salinity [18]. To describe plant responses to water–salt stress, Van Genuchten [11] proposed a multiplicative interaction function, which has since been widely adopted in root water uptake modeling [19,20,21]. However, due to variability in soil types, evaporation patterns, and crop species, model predictions often lack precision [22]. A typical feature of macroscopic models is their reliance on soil water potential, plant transpiration rate, and root length density to estimate root water uptake. The combined effect of matric and osmotic potential is usually represented through the relationship between soil conditions and the relative transpiration rate in the root zone [23,24]. However, such models often overlook the spatial distribution of water and salt and its impact on uptake [6,7], and they fail to account for differences in root uptake at varying soil depths despite equal root lengths.
The parameters governing root water uptake under water–salt stress are strongly influenced by plant species, salt tolerance, and local soil characteristics. Typically, these parameters are derived from the literature, expert judgment, or repeated transpiration measurements [19,25], but simulations based on literature-derived values often show limited accuracy. For instance, Wang [26] improved the salt stress factor parameters in a winter wheat root uptake model by leveraging the linear relationship between root nitrogen content and the maximum root water uptake rate. Hence, parameter optimization is key to improving model performance.
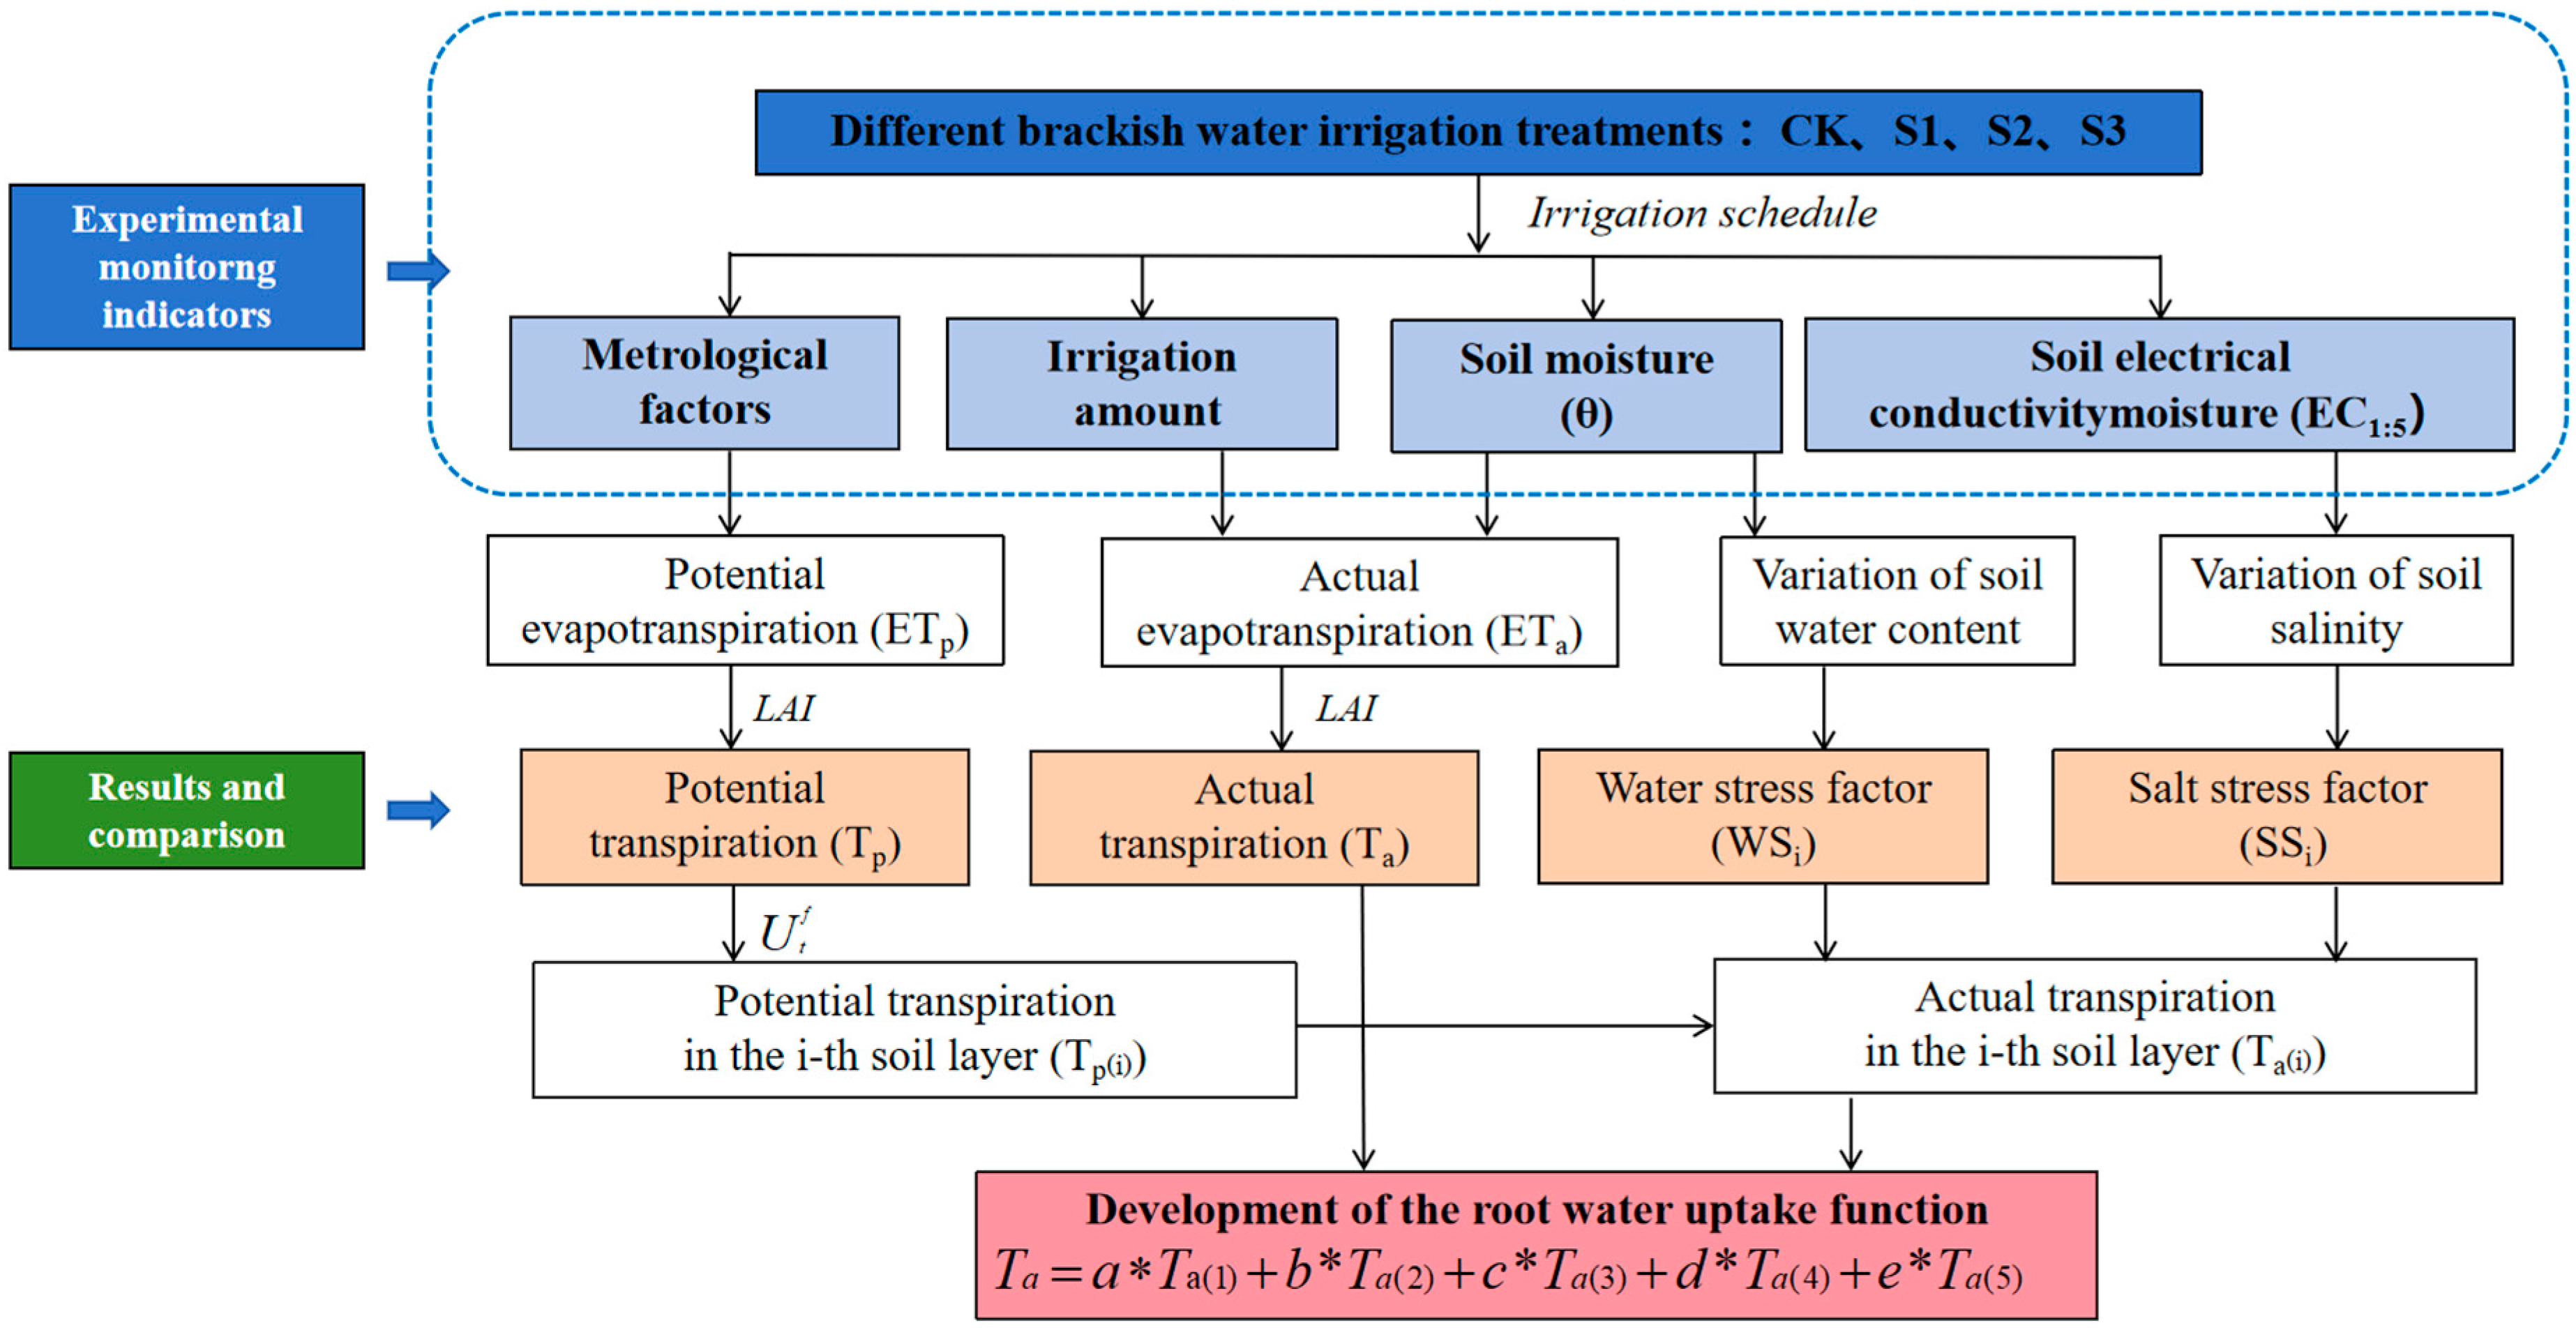
In this study, sunflower was subjected to irrigation treatments with varying salinity levels using monitoring pits to record soil moisture and salinity profiles. The primary objective of this research is to investigate the degree of water and salinity stress on root water uptake at different depths within the root zone based on field experimental data, and to establish a root water uptake rate equation that accounts for the spatial heterogeneity of root water uptake responses. The proposed equation introduces a correlation coefficient to quantify the effects of soil water and salinity stress at different soil depths, and it was further optimized to improve the predictive performance of the root water uptake model. The results provide a theoretical basis for understanding water and salt transport in plants under salinized conditions, improving root water uptake modeling, and optimizing irrigation systems. The structural framework of this study is illustrated in Figure 1.

2. Materials and Methods

2.1. Study Area

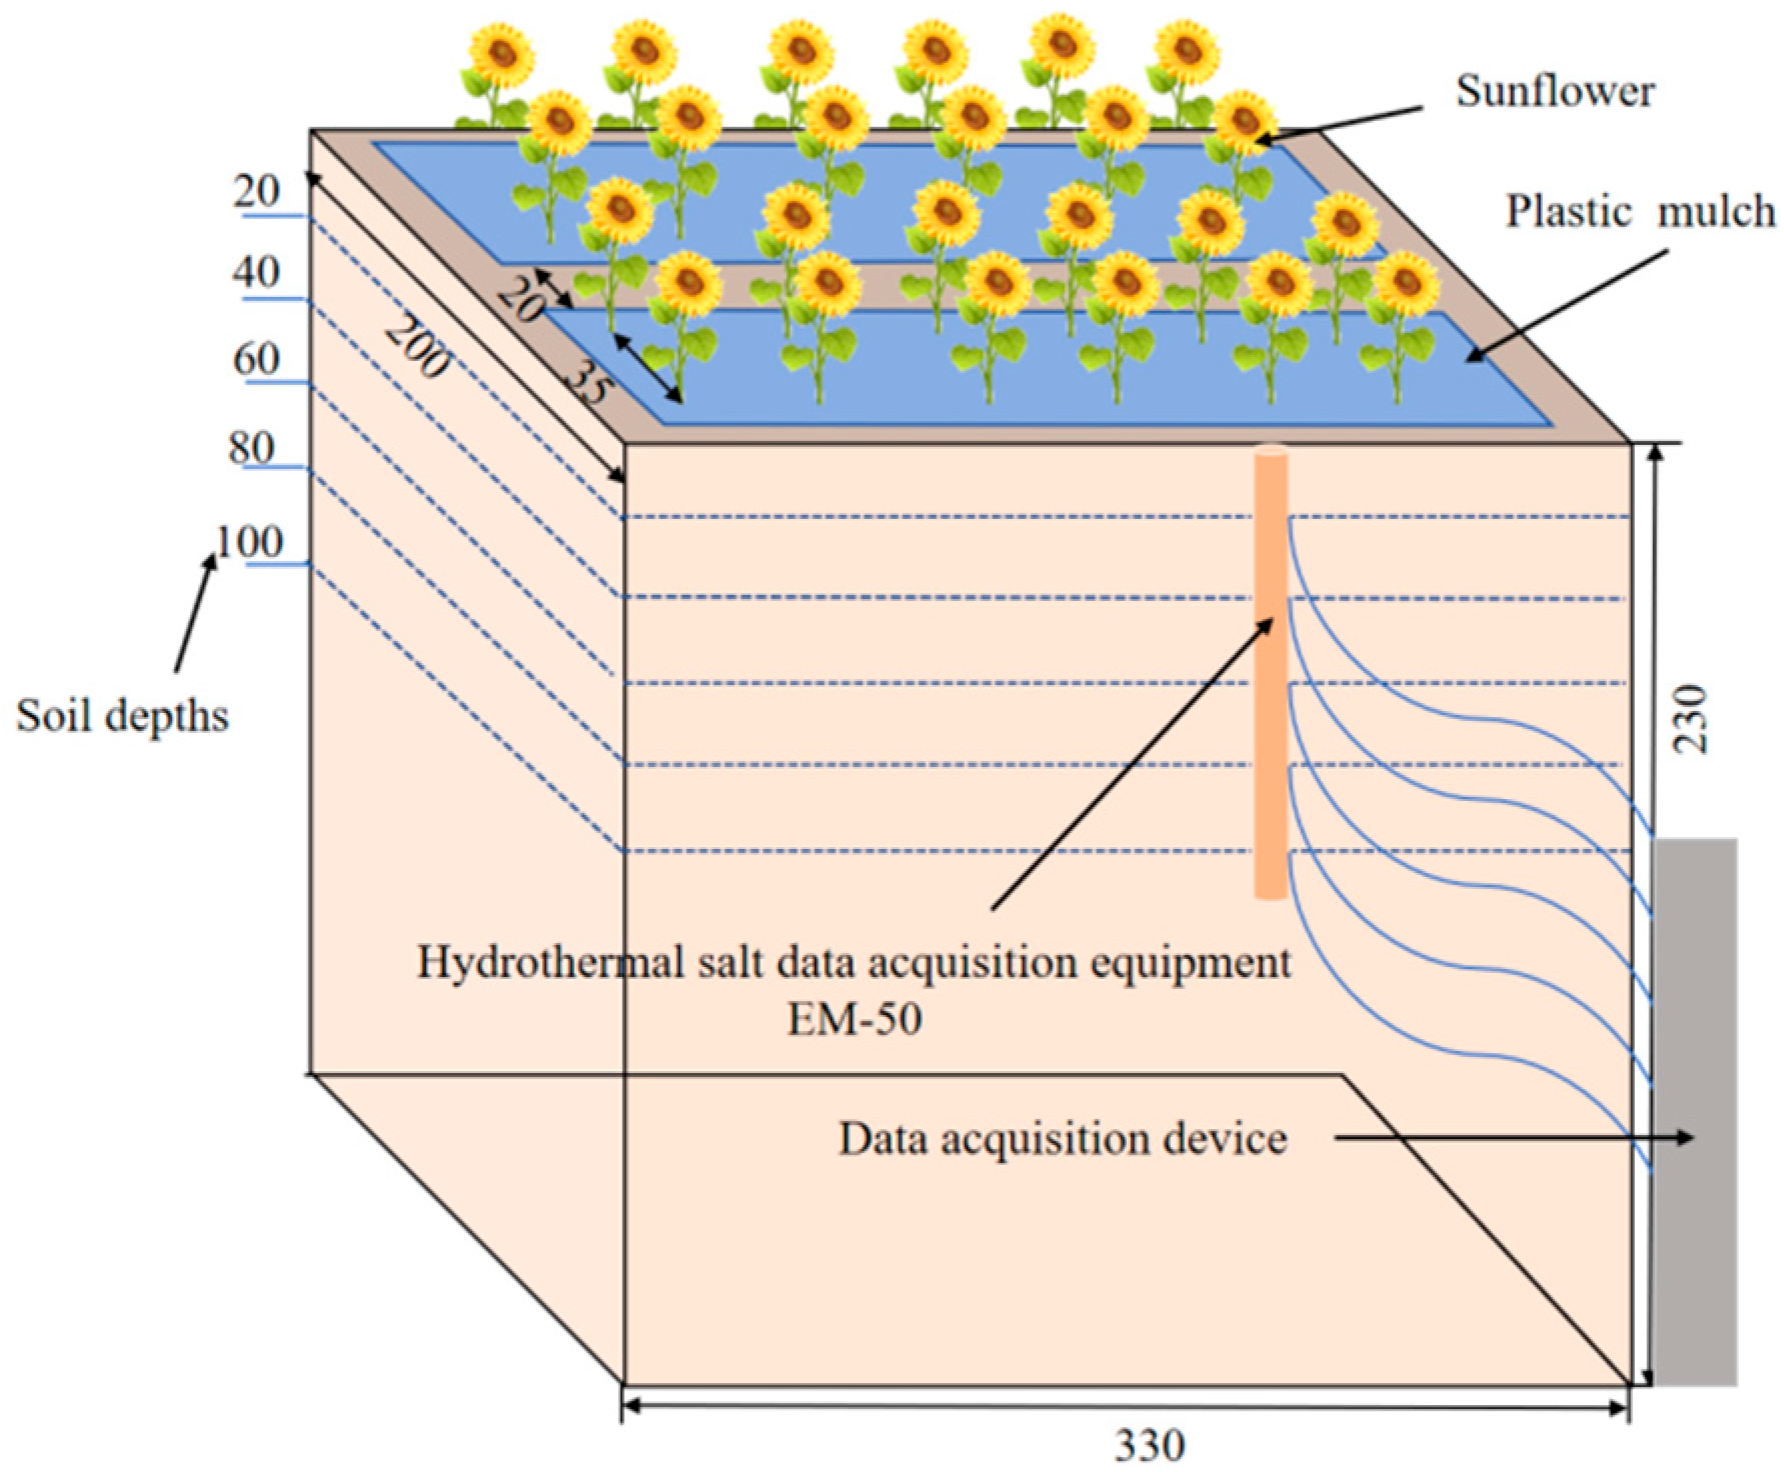
The experiment was conducted from June to September in both 2021 and 2022 at a field site (40°40′51″ N, 111°22′18″ E) located in the Hailiutu Science Park, Tumed Left Banner, Inner Mongolia Autonomous Region, China. The site lies at an altitude of 1059 m above sea level. The region experiences an average annual temperature of 7.5 °C, with average monthly temperature fluctuations of 8.9 °C. Annual rainfall is 421.6 mm, and evaporation exceeds 1500–1800 mm. The average wind speed is 2–3 m·s−1; the total annual sunshine duration is 3215 h [27], and the groundwater depth ranges from 3.5 to 4.0 m. Sunflower irrigation tests were conducted in experimental pits measuring 3.3 m × 2.0 m (area: 6.6 m2), each with a soil depth of 2.3 m. The pits were constructed with concrete masonry and treated with anti-seepage lining to prevent lateral water loss. This design was adopted to minimize lateral water and salt movement and to ensure controlled experimental conditions. The use of experimental pits allows for more accurate observation of soil water infiltration, salt transport, and root water uptake processes under different irrigation treatments. The layout of the pit profiles is shown in Figure 2. In 2021 and 2022, soil samples were collected from the experimental area for analysis. Soil bulk density, field capacity (measured using the double-ring infiltration method), and saturated hydraulic conductivity (determined from undisturbed soil samples using the laboratory constant-head method) were measured. In addition, the particle size distribution of each soil layer was determined using a laser particle size analyzer (BT-9300ST, Bettersize Instruments Ltd., Dandong, China). Soil physical properties are summarized in Table 1. Each pit was equipped with a complete data acquisition system along with irrigation and drainage devices.

2.2. Experiment

The experiment was conducted from June to September in both 2021 and 2022. Four irrigation water salinity treatments were established: CK (0.87 g·L−1), S1 (1.0 g·L−1), S2 (1.5 g·L−1), and S3 (2.0 g·L−1). The initial salinity level (0.87 g·L−1) represents the natural salinity of local groundwater, which was measured and verified by a certified laboratory. In this study, the groundwater is referred to as low-salinity water rather than fully purified freshwater. The selected salinity levels were designed to represent a practical range of irrigation water salinity under local conditions, covering low to moderate salinity levels commonly encountered in the study area, rather than strictly following equal incremental steps. Saline water for the treatments was prepared by adding NaCl to the groundwater to achieve the target salinity levels. This approach represents chloride-type salinity and is commonly used in experimental studies to control salinity levels while reducing the complexity associated with multiple ion interactions. Each treatment had three replicates, resulting in a total of 12 experimental plots arranged in a completely randomized design. The test crop was edible sunflower (cv. HZ2399), with 24 plants grown in each plot. Sowing was carried out on 1 June in both years. Basal fertilizers were manually applied before sowing, including diammonium phosphate (18% N, P2O5 44%) at 375 kg·hm−2 and urea (N 46%) at 130 kg·hm−2, followed by mulching. Additional urea (130 kg·hm−2) was applied at the budding stage. Pest control (using standard local pesticide applications), manual weeding, and other routine field management practices were carried out uniformly across all plots. Low-salinity water (0.87 g·L−1) was used for the first irrigation to ensure uniform seedling emergence, with an irrigation depth of 112.5 mm (equivalent to 1125 m3/ha). Subsequent irrigations were applied according to the experimental design and salinity treatments, resulting in a total irrigation quota of 3375 m3/ha. Irrigation dates were 29 June, 23 July, and 13 August in 2021, and 1 July, 24 July, and 13 August in 2022.

2.3. Soil and Plant Sampling and Meteorological Information

The leaf area of the crops was measured every 10 days on fixed sample plants. Three representative plants were randomly selected from each plot for measurement. The leaf area was estimated by multiplying the leaf length (from the tip to the base) by three-quarters of the maximum leaf width, and summing the areas of all leaves per plant.
Soil moisture content was measured at 20 cm depth intervals using an EM-50 soil moisture sensor (Decagon Devices, Pullman, WA, USA), with daily recordings throughout the entire growth period. The soil moisture content data determined by the drying method was used to calibrate the instrument data. Soil electrical conductivity (EC) was measured at the same sampling locations and times as the soil moisture content. Soil samples were collected at 7–10 days in different depths using a soil auger, and soil salinity was determined using the 1:5 soil–water extraction method (EC1:5). In addition, statistical analyses were performed using OriginPro 2024b (OriginLab Corporation, USA). One-way ANOVA followed by the LSD test (p < 0.05) was applied to evaluate differences among treatments.
Meteorological data were used to calculate reference evapotranspiration (ET0) using the FAO-56 Penman–Monteith method. Since the experimental plots were covered with a rain shelter, natural precipitation was excluded to ensure controlled irrigation conditions and was not included in the analysis. Meteorological data were obtained from an automatic weather station (YM-03B, Yimeng Electronic, China) located at the experimental site. The recorded parameters included air temperature, relative humidity, wind speed, wind direction, solar radiation, and atmospheric pressure.

2.4. Root Water Uptake Function in Response to Soil Water and Salt Stress

A root water uptake model was developed based on the approach by Kendy [28]. According to the principle proposed by Novak [29], canopy-scale water consumption is distributed across different soil layers within the crop root zone. Based on this concept, a root water uptake rate equation was established to account for the spatial variability of water uptake across soil layers under varying soil water and salinity conditions (see Equation (13)).

2.4.1. Soil Moisture Balance

The actual crop evapotranspiration (ETc, mm) between two soil sampling events was calculated using the soil water balance method [30]. Since the lysimeters were covered with a rain shelter, precipitation was excluded during the experimental period. Therefore, the water balance was calculated over each sampling interval according to the following equation:
W t + Δ t W t = I + F + P E T c
where I is the irrigation amount (mm), F is the exchange volume at the lower boundary of the soil within the calculation time (mm), P represents the effective rainfall (mm). W t and W t + Δ t are the soil water storage (mm) at time t and t + Δt, respectively, and Δt is the time interval between two measurements. Due to the rain shelter, P was assumed to be zero.
The calculation of crop water consumption and the lower boundary flux depends on the relationship between soil water content in the root zone and the field capacity. When the soil water content is lower than the field capacity, the lower boundary flux is calculated using Darcy’s law as follows:
F = K ( θ ) · d H d L
H = h g + h m
E T c = P + I + F W t + t + W t
where K ( θ ) is the unsaturated hydraulic conductivity (cm·d−1), the unsaturated hydraulic conductivity is derived from the saturated hydraulic conductivity (Ks). H is the total soil water potential (cm), composed of gravitational potential (h_g) and matrix potential (h_m). The hydraulic gradient (dH/dL) was determined between soil depths of 90 cm and 110 cm for 2021 and 2022, respectively. The unsaturated hydraulic conductivity is calculated using the Van Genuchten–Mualem model:
K ( θ ) = K s · ( θ θ r θ s θ r ) 0.5 1 1 θ θ r θ s θ r n n 1 n 1 n 2
where Ks is the saturated hydraulic conductivity (cm·d−1), θ is the soil moisture content, θr is the residual water content, θs is the saturated water content, n is the Van Genuchten shape parameter.
When the soil water content in the root zone exceeds the field capacity, the actual crop evapotranspiration is assumed to be equal to the potential evapotranspiration (ETP). The calculation is expressed as:
E T c = E T P
E T P = K c · E T 0
K c = 1.0 + ( K c m a x 1.0 ) · L A I L A I m x
F = W t + t W t + E T c I
where E T P is the potential evapotranspiration (mm), Kc is the crop coefficient, Kc,max is the maximum crop coefficient, LAI is the leaf area index, and LAImax is the maximum leaf area index. The reference evapotranspiration (ET0, mm) was calculated using the FAO-56 Penman–Monteith method [31]. The crop coefficient approach follows standard procedures [32].

2.4.2. Actual Plant Transpiration

The actual transpiration rate (Ta, mm·d−1) is derived from total crop evapotranspiration (ETa, mm·d−1) within the 0–100 cm root zone. The calculation is performed using the following equations:
E T c = E T a
T a = 1 τ · E T a
τ = e x p k b L A I
where τ is the soil surface evaporation fraction, Kb is the extinction coefficient for solar radiation, and LAI is the leaf area index, which changes with the growth cycle of the crop. In this study, Kb is set to 0.6.

2.4.3. Root Water Uptake Function in Response to Salinity Conditions

In this study, the root water uptake model was improved by modifying the canopy-scale water consumption equation. The total water consumption within the root zone was represented by the actual transpiration rate (Ta, mm·d−1). Root sampling was conducted to a depth of 140 cm at 20 cm intervals and analyzed using WinRHIZO Pro 2020. More than 97% of the total root length was distributed within the 0–100 cm soil layer; therefore, this depth was defined as the effective root zone. The 0–100 cm soil profile was divided into five layers of 20 cm each. The coefficients (a, b, c, d, and e) represent the layer-specific responses of root water uptake to soil water and salinity conditions. The root water uptake function was expressed as:
T a = a · T a 1 + b · T a 2 + c · T a 3 + d · T a 4 + e · T a 5
where Ta(i) is the actual transpiration in the ith soil layer (mm·d−1). The coefficients were estimated using multiple linear regression based on the data collected in 2021 and further refined using the 2022 dataset to obtain the final parameter values.

2.4.4. Actual Transpiration of Each Layer of the Soil Root Zone

The actual transpiration of the ith soil layer (Ta(i), mm·d−1) was calculated by combining the potential transpiration and reduction factors associated with soil water and salinity conditions:
T a i = T p i · W S ( i ) · S S i
where Tp(i) is the potential transpiration of the ith soil layer (mm·d−1), WS(i) is the soil water reduction factor, and SS(i) is the salinity reduction factor. The total potential evapotranspiration is composed of potential evaporation and potential transpiration. The potential transpiration (Tp, mm·d−1) is expressed as:
T p = 1 τ · E T p
Root distribution within the soil profile is assumed to follow an exponential function. The root water uptake rate at a given soil depth Z is expressed as:
S Z = T a · δ e x p δ Z Z r Z r 1 e x p δ
where S(Z) is the root water uptake rate at depth Z (mm·d−1), Ta is the actual transpiration rate (mm·d−1), Zr is the total root depth (cm), δ is the water resource distribution parameter, and δ is the empirical constant influencing the curvature of the exponential function.
The proportion of transpiration assigned to each soil layer between depths Z1 and Z2 was obtained by integrating Equation (16) over the corresponding depth interval. In this study, each layer thickness was 20 cm. The proportion for each layer ( U f t ) is expressed as:
U f t = 1 1 e x p δ e x p δ Z 1 Z 2 1 e x p δ Z 2 Z 1 Z r
The potential soil evaporation of the ith layer can be expressed as:
T p i = U f t T p Δ t
The soil water and salinity reduction factors are defined as:
W S ( i ) = 1 θ i θ w p b t
S S i = 1 B K y · 100 E C e i E C e t h r e s h o l d
where θ i is the soil water content of the ith layer, θ w p is the wilting point, and θ f c is the field capacity. K y is the crop yield response factor (dimensionless), and B is a coefficient describing the reduction in transpiration with increasing salinity. ECei is the electrical conductivity of the saturated soil extract of the ith layer (dS·m−1), and the ECe, threshold is the threshold value beyond which crop response is affected.
The relationship between ECe and the electrical conductivity measured from a 1:5 soil–water extract (EC1:5) is given by:
E C e = 1.33 + 5.88 · E C 1 : 5

2.5. Model Evaluation Indicators

In this study, the performance of the root water uptake model was assessed using several standard statistical metrics: the correlation coefficient (R2), root mean square error (RMSE) and mean relative error (MRE), Nash-Sutcliffe efficiency (NSE), and regression coefficient (b). The calibration and validation periods in the model are the entire growth period of the crops in 2021 and 2022 respectively. These indicators were calculated as follows:
R 2 = i = 1 N O i O ¯ P i P ¯ 2 i = 1 N O i O ¯ 2 0.5 i = 1 N P i P ¯ 2 0.5
b = i = 1 N O i · P i i = 1 N O i 2
R M S E = 1 N i = 1 N P i O i 2
M R E = 1 N i = 1 N P i O i O i × 100 %
N S E = 1 i = 1 N P i O i 2 i = 1 N O i O ¯ 2
where N is the number of observations, Pi and Oi are the simulated and measured values, P ¯ and O ¯ are the average values of the simulated and measured values, respectively.
Higher values of R2, b, and NSE indicate better model performance, whereas lower values of RMSE and MRE indicate better agreement between simulated and measured values. When NSE is less than 0, the model performance is considered unsatisfactory.

3. Results

3.1. Spatial Changes in Soil Water Content and Salinity Under Different Treatments

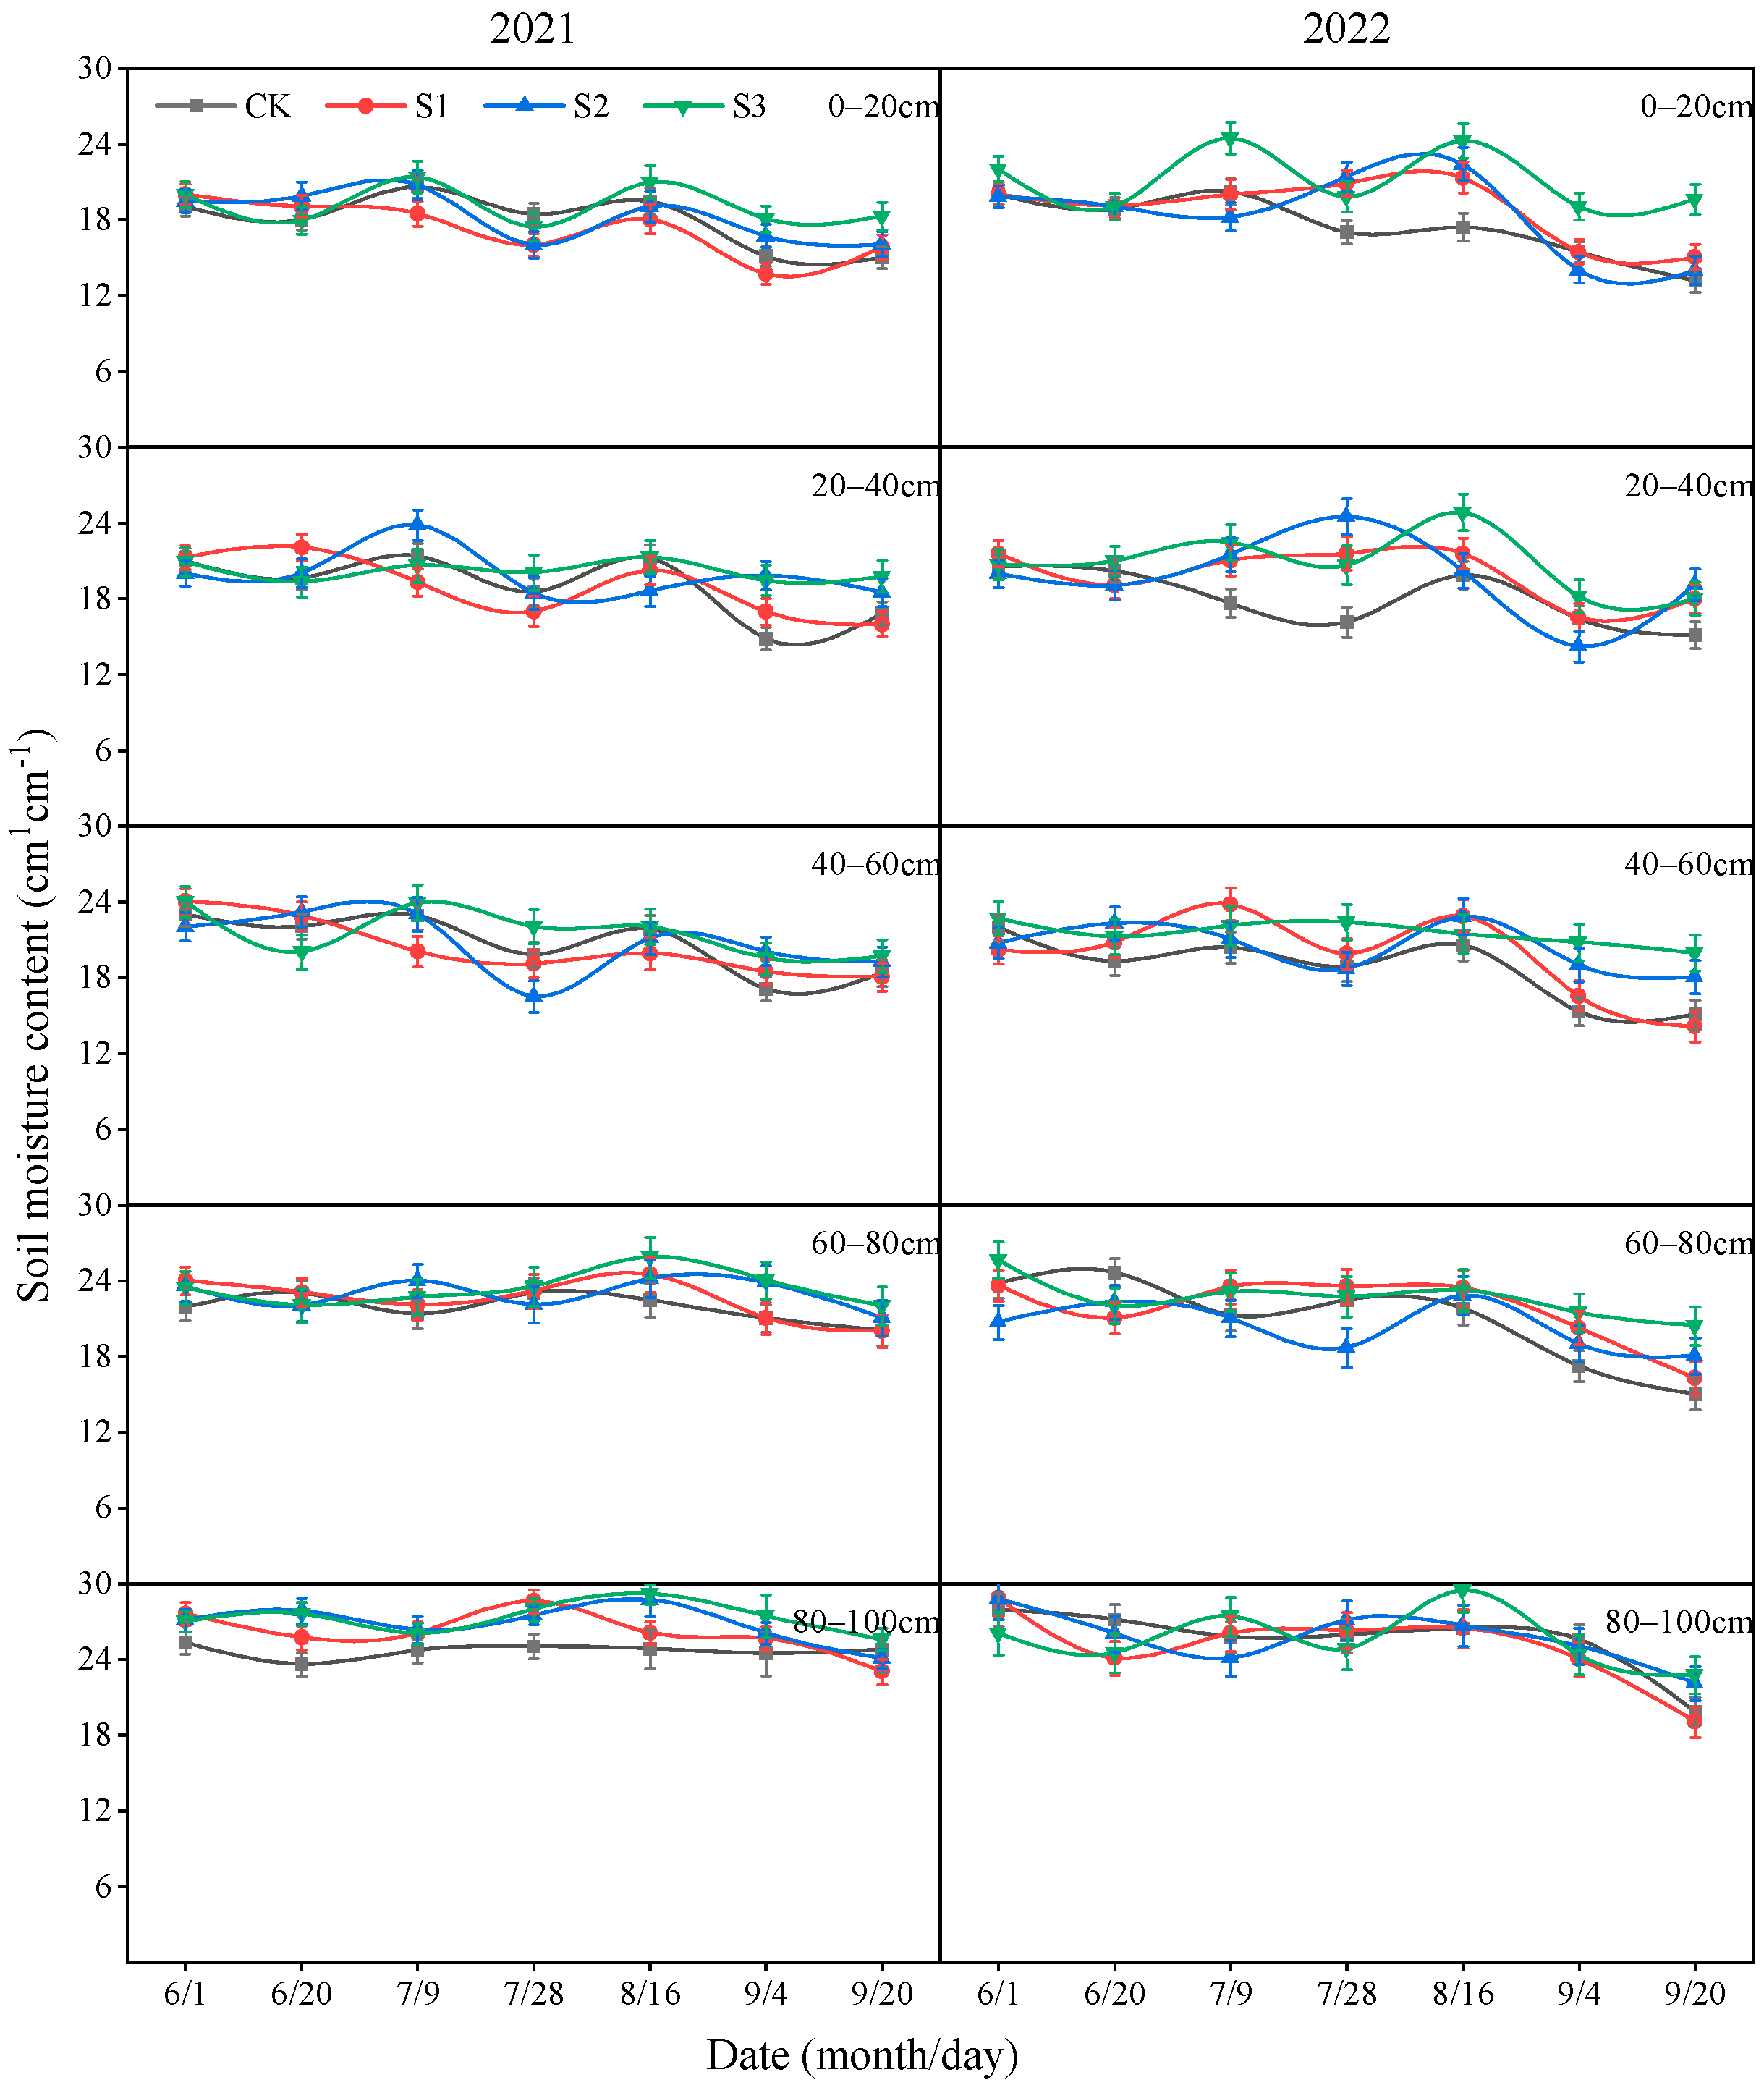
Water sources with different salinity gradients exert distinct effects on sunflower root water uptake. Figure 3 illustrates the soil moisture distribution at various depths under irrigation with different salinity levels in 2021 and 2022. In 2021, soil moisture within the 0–100 cm profile fluctuated with irrigation events, primarily driven by irrigation scheduling and surface evaporation. The 0–20 cm layer was the most sensitive to external factors, with evaporation playing a dominant role in regulating moisture dynamics. The average soil moisture contents under the CK, S1, S2, and S3 treatments were 17.96%, 17.31%, 18.28%, and 19.16%, respectively. No significant difference was observed between CK and S1 (p > 0.05), whereas S2 and S3 showed significantly higher values (p < 0.05).
In the 20–40 cm layer, soil moisture during the mid- to late-growth stages was strongly influenced by root water uptake, with the average values under S2 and S3 being 4.35% and 5.98% higher than that of CK (p < 0.05), respectively. The 40–100 cm layer maintained relatively higher moisture content, likely due to Na+-induced reductions in soil permeability and the restricted upward movement of capillary water, which collectively enhanced deep soil water retention.
In 2022, the overall distribution pattern of soil moisture was similar; however, differences among treatments became more pronounced, particularly within the 20–40 cm layer. The average soil moisture contents under CK, S1, S2, and S3 were 18.01%, 19.69%, 20.04%, and 20.85%, respectively. Soil moisture under S3 was significantly higher than that under CK (p < 0.05), indicating that increasing irrigation water salinity reduced soil water potential and enhanced the water-holding capacity of the soil.
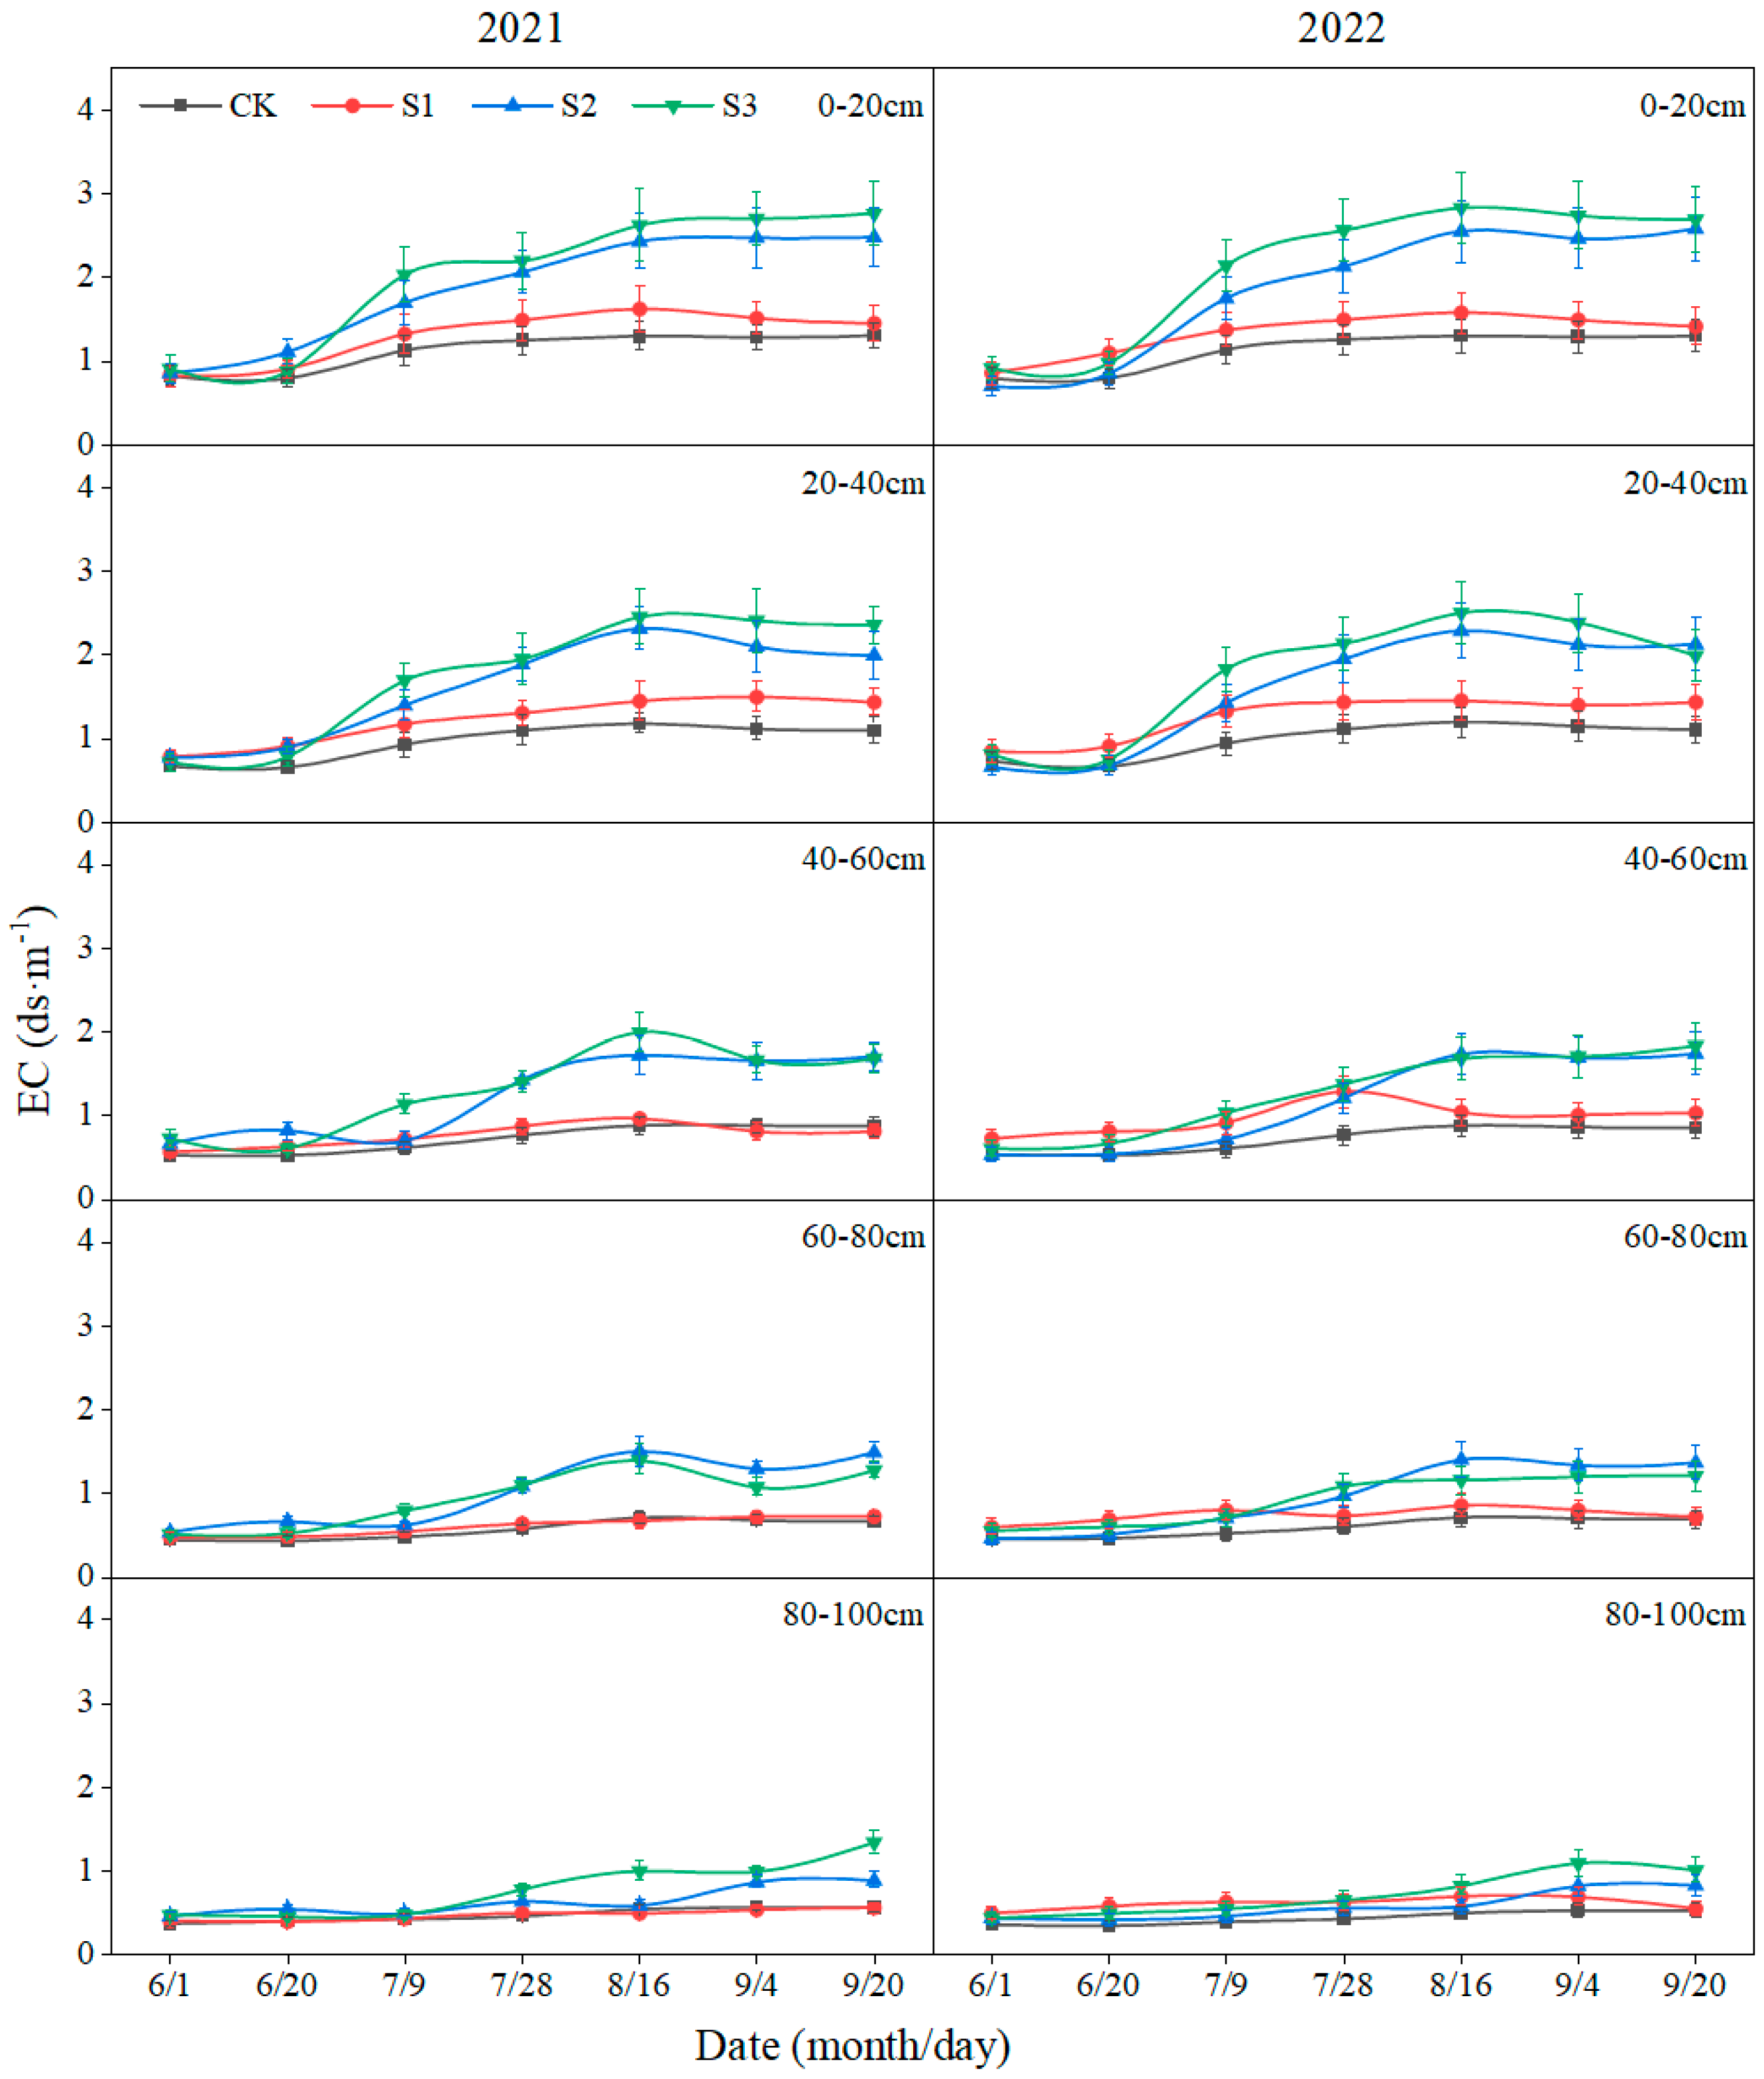
Figure 4 shows the electrical conductivity (EC) distribution at different soil depths under irrigation with water of varying salinity levels in 2021 and 2022. Soil salinity in the different layers exhibited corresponding fluctuations during the two-year experimental period. In the 0–20 cm soil layer, the average electrical conductivity during the growth period was 1.31, 1.45, 2.50, and 2.77 dS·m−1 across the four treatments, respectively. Compared with the CK treatment, the S1, S2, and S3 treatments showed increases of 0.14, 1.19, and 1.46 dS·m−1, respectively. Significant differences were observed between high-salinity treatments (S2 and S3) and low-salinity treatments (CK and S1) (p < 0.05), indicating pronounced salt accumulation in the surface soil under higher salinity irrigation. In the 20–40 cm soil layer, which was strongly influenced by sunflower root water uptake, the average EC values under different treatments were 0.99, 1.24, 1.62, and 1.77 dS·m−1, respectively. Significant differences were observed between high-salinity treatments (S2 and S3) and low-salinity treatments (CK and S1) (p < 0.05), indicating pronounced salt accumulation in the root-zone soil under higher salinity irrigation. In the 40–100 cm soil layer, the response to irrigation salinity became progressively delayed with increasing depth, and differences in salt content among treatments were less pronounced.
Similar patterns were observed in 2022, although salt accumulation increased across all treatments compared to that in the first year. The average EC values for the 0–100 cm soil profile in 2022 were 0.80, 1.00, 1.26, and 1.42 dS·m−1 across the respective treatments. Results clearly demonstrate a positive correlation between irrigation water salinity and soil salt accumulation, with higher salinity levels leading to more rapid salt build-up in the soil profiles.

3.2. Actual Crop Evapotranspiration (ETa) Under Each Treatment

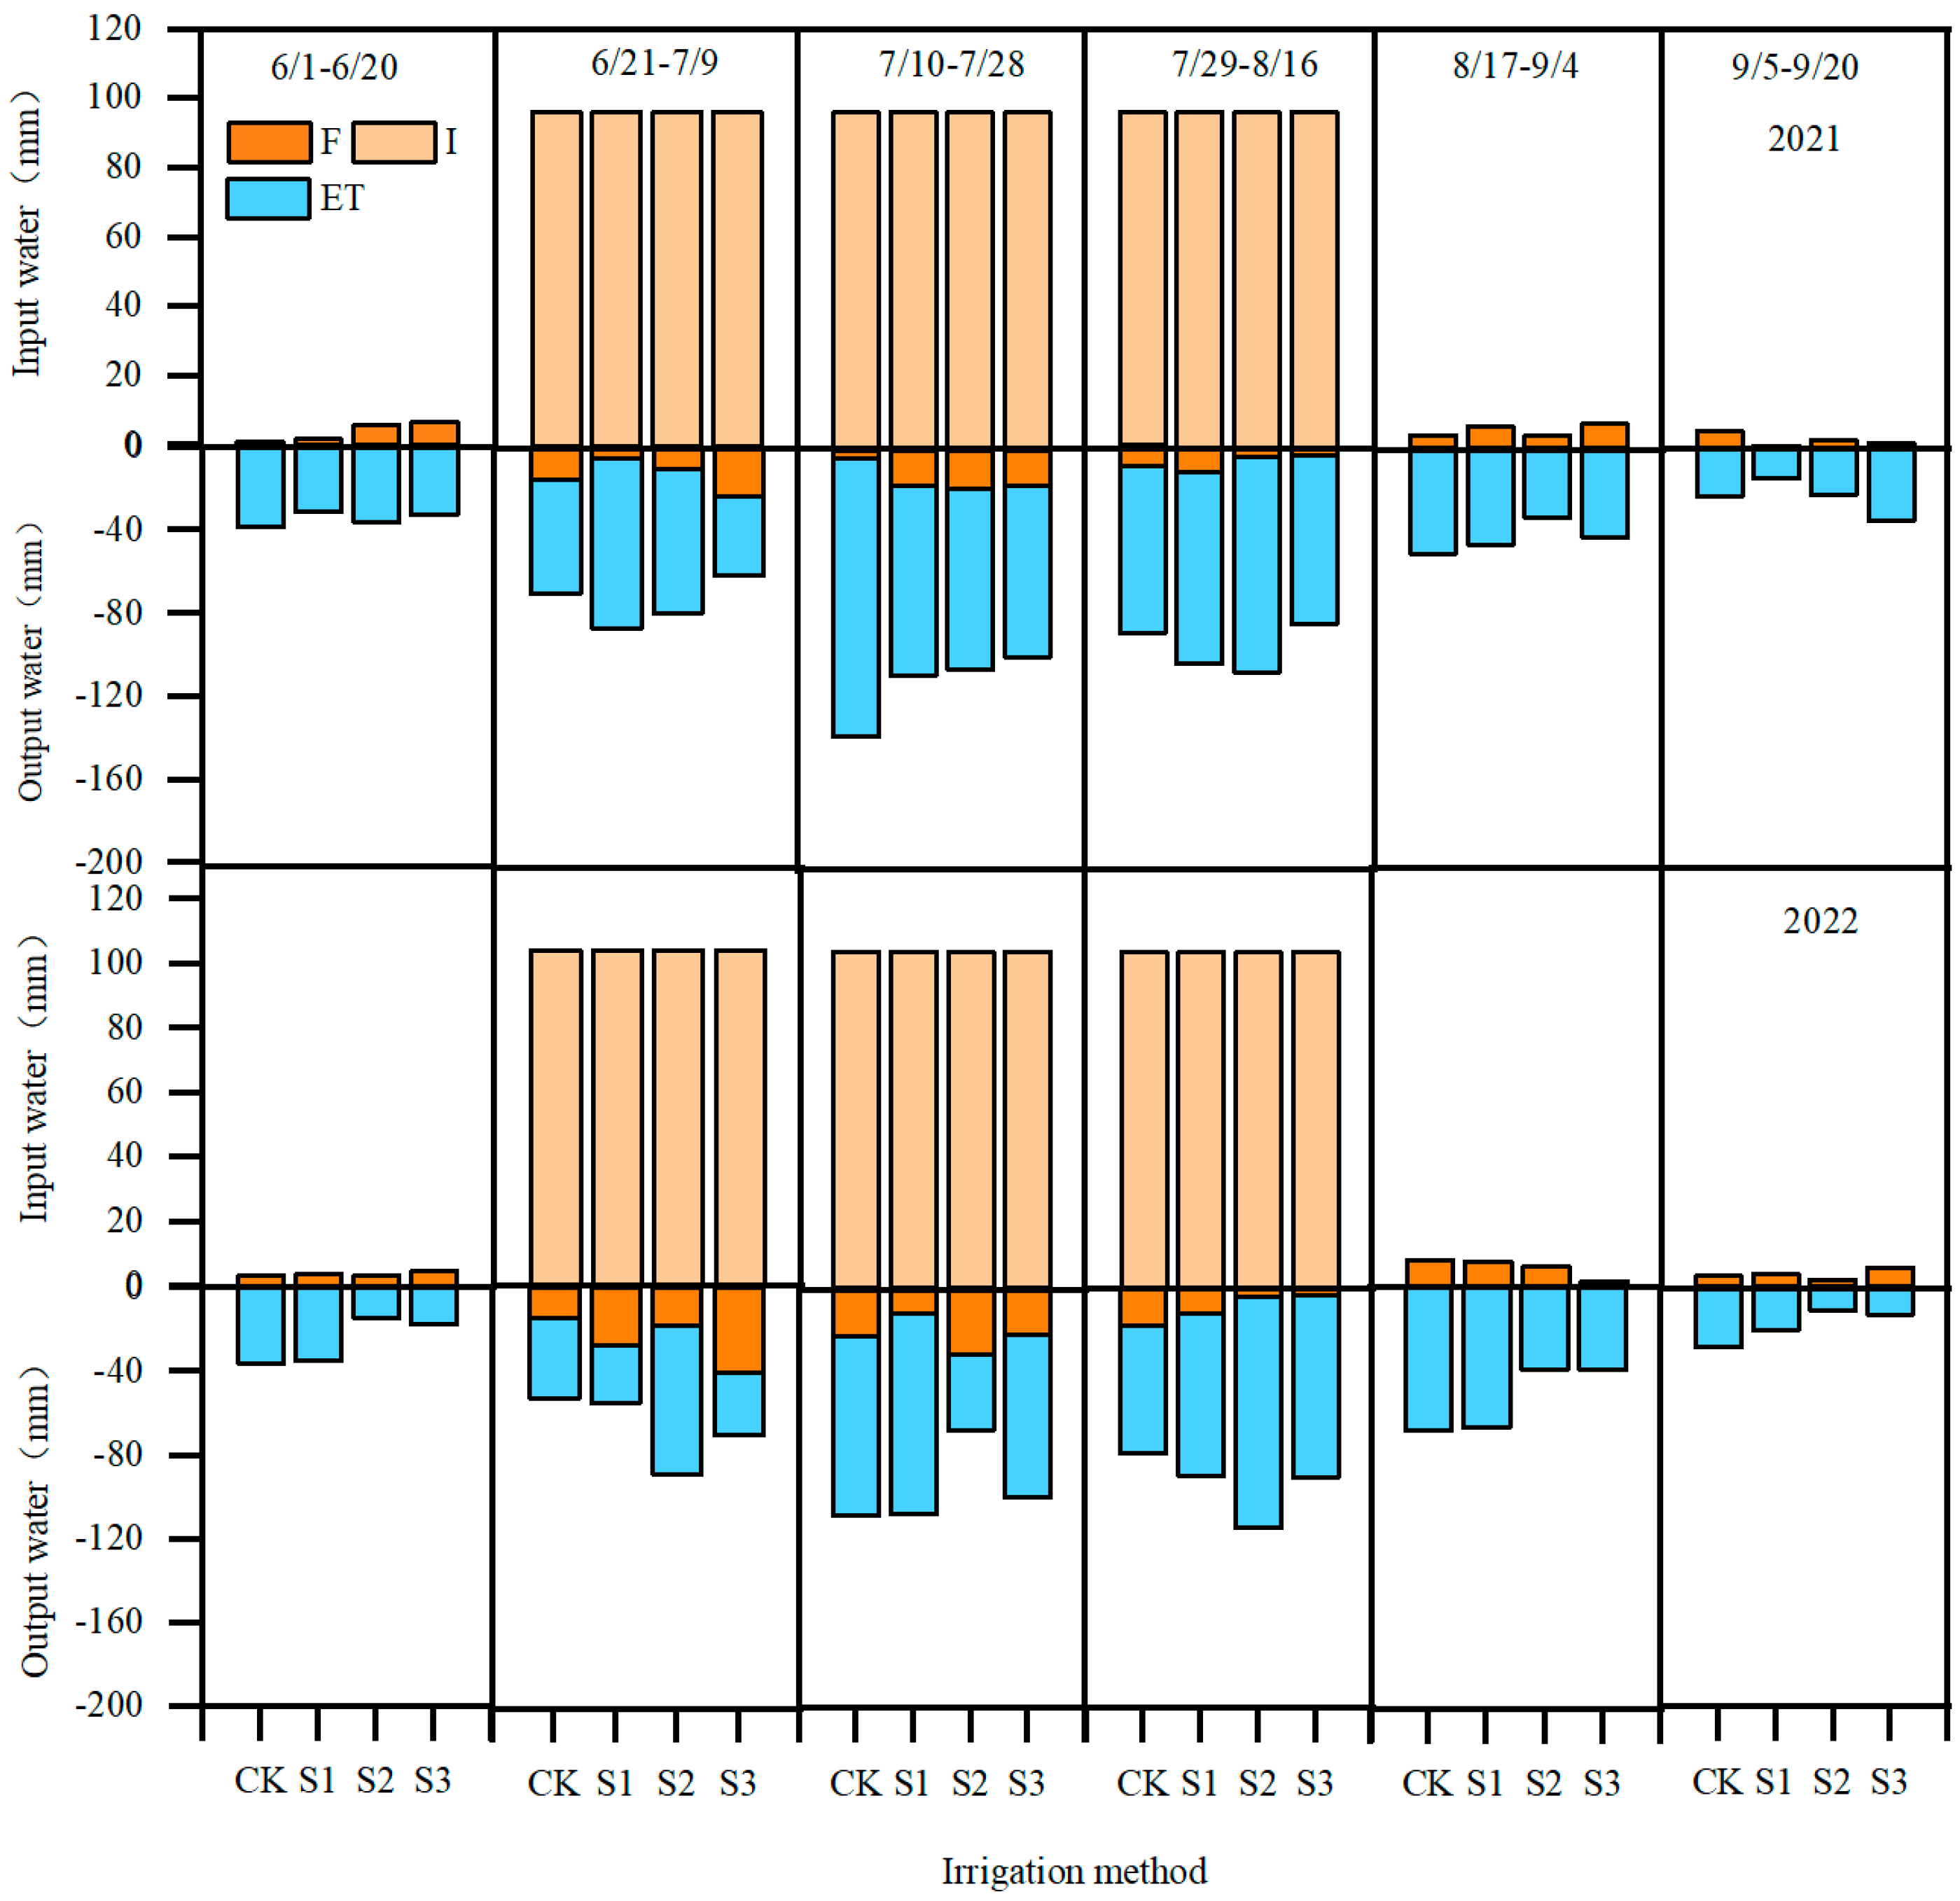
Figure 5 illustrates the water balance of sunflower across growth stages in 2021 and 2022. Positive values indicate water inputs (irrigation and precipitation), whereas negative values represent losses via actual evapotranspiration (ETa). Mid-season ETa peaked in July–August due to increased leaf area and physiological activity. During 9–28 July 2021, ETa values for CK, S1, S2, and S3 were 119.91, 107.34, 104.28, and 98.14 mm, respectively, with similar patterns observed in 2022. Water consumption was lower during early and late growth stages, largely because rain shelters minimized precipitation infiltration. Irrigation effectively satisfied crop water demand, and soil water remained relatively balanced during the mid-season.
Across the full growing season, ETa decreased with increasing irrigation salinity, from 387.44 to 351 mm (−9.4%) in 2021 and from 370 to 327 mm (−11.6%) in 2022. No significant ETa differences were observed between CK and S1 (p > 0.05), although ETa under S1 was slightly higher than that under CK in 2022. This minor and inconsistent difference does not indicate a significant improvement in soil water storage or evapotranspiration. Under higher salinity conditions (S2 and S3), ETa decreased significantly (p < 0.05), indicating that elevated salinity constrained root water uptake by reducing hydraulic conductivity and water absorption efficiency, ultimately limiting crop water use under high-salinity irrigation.

3.3. Responses of Potential and Actual Transpiration to Salinity Treatments

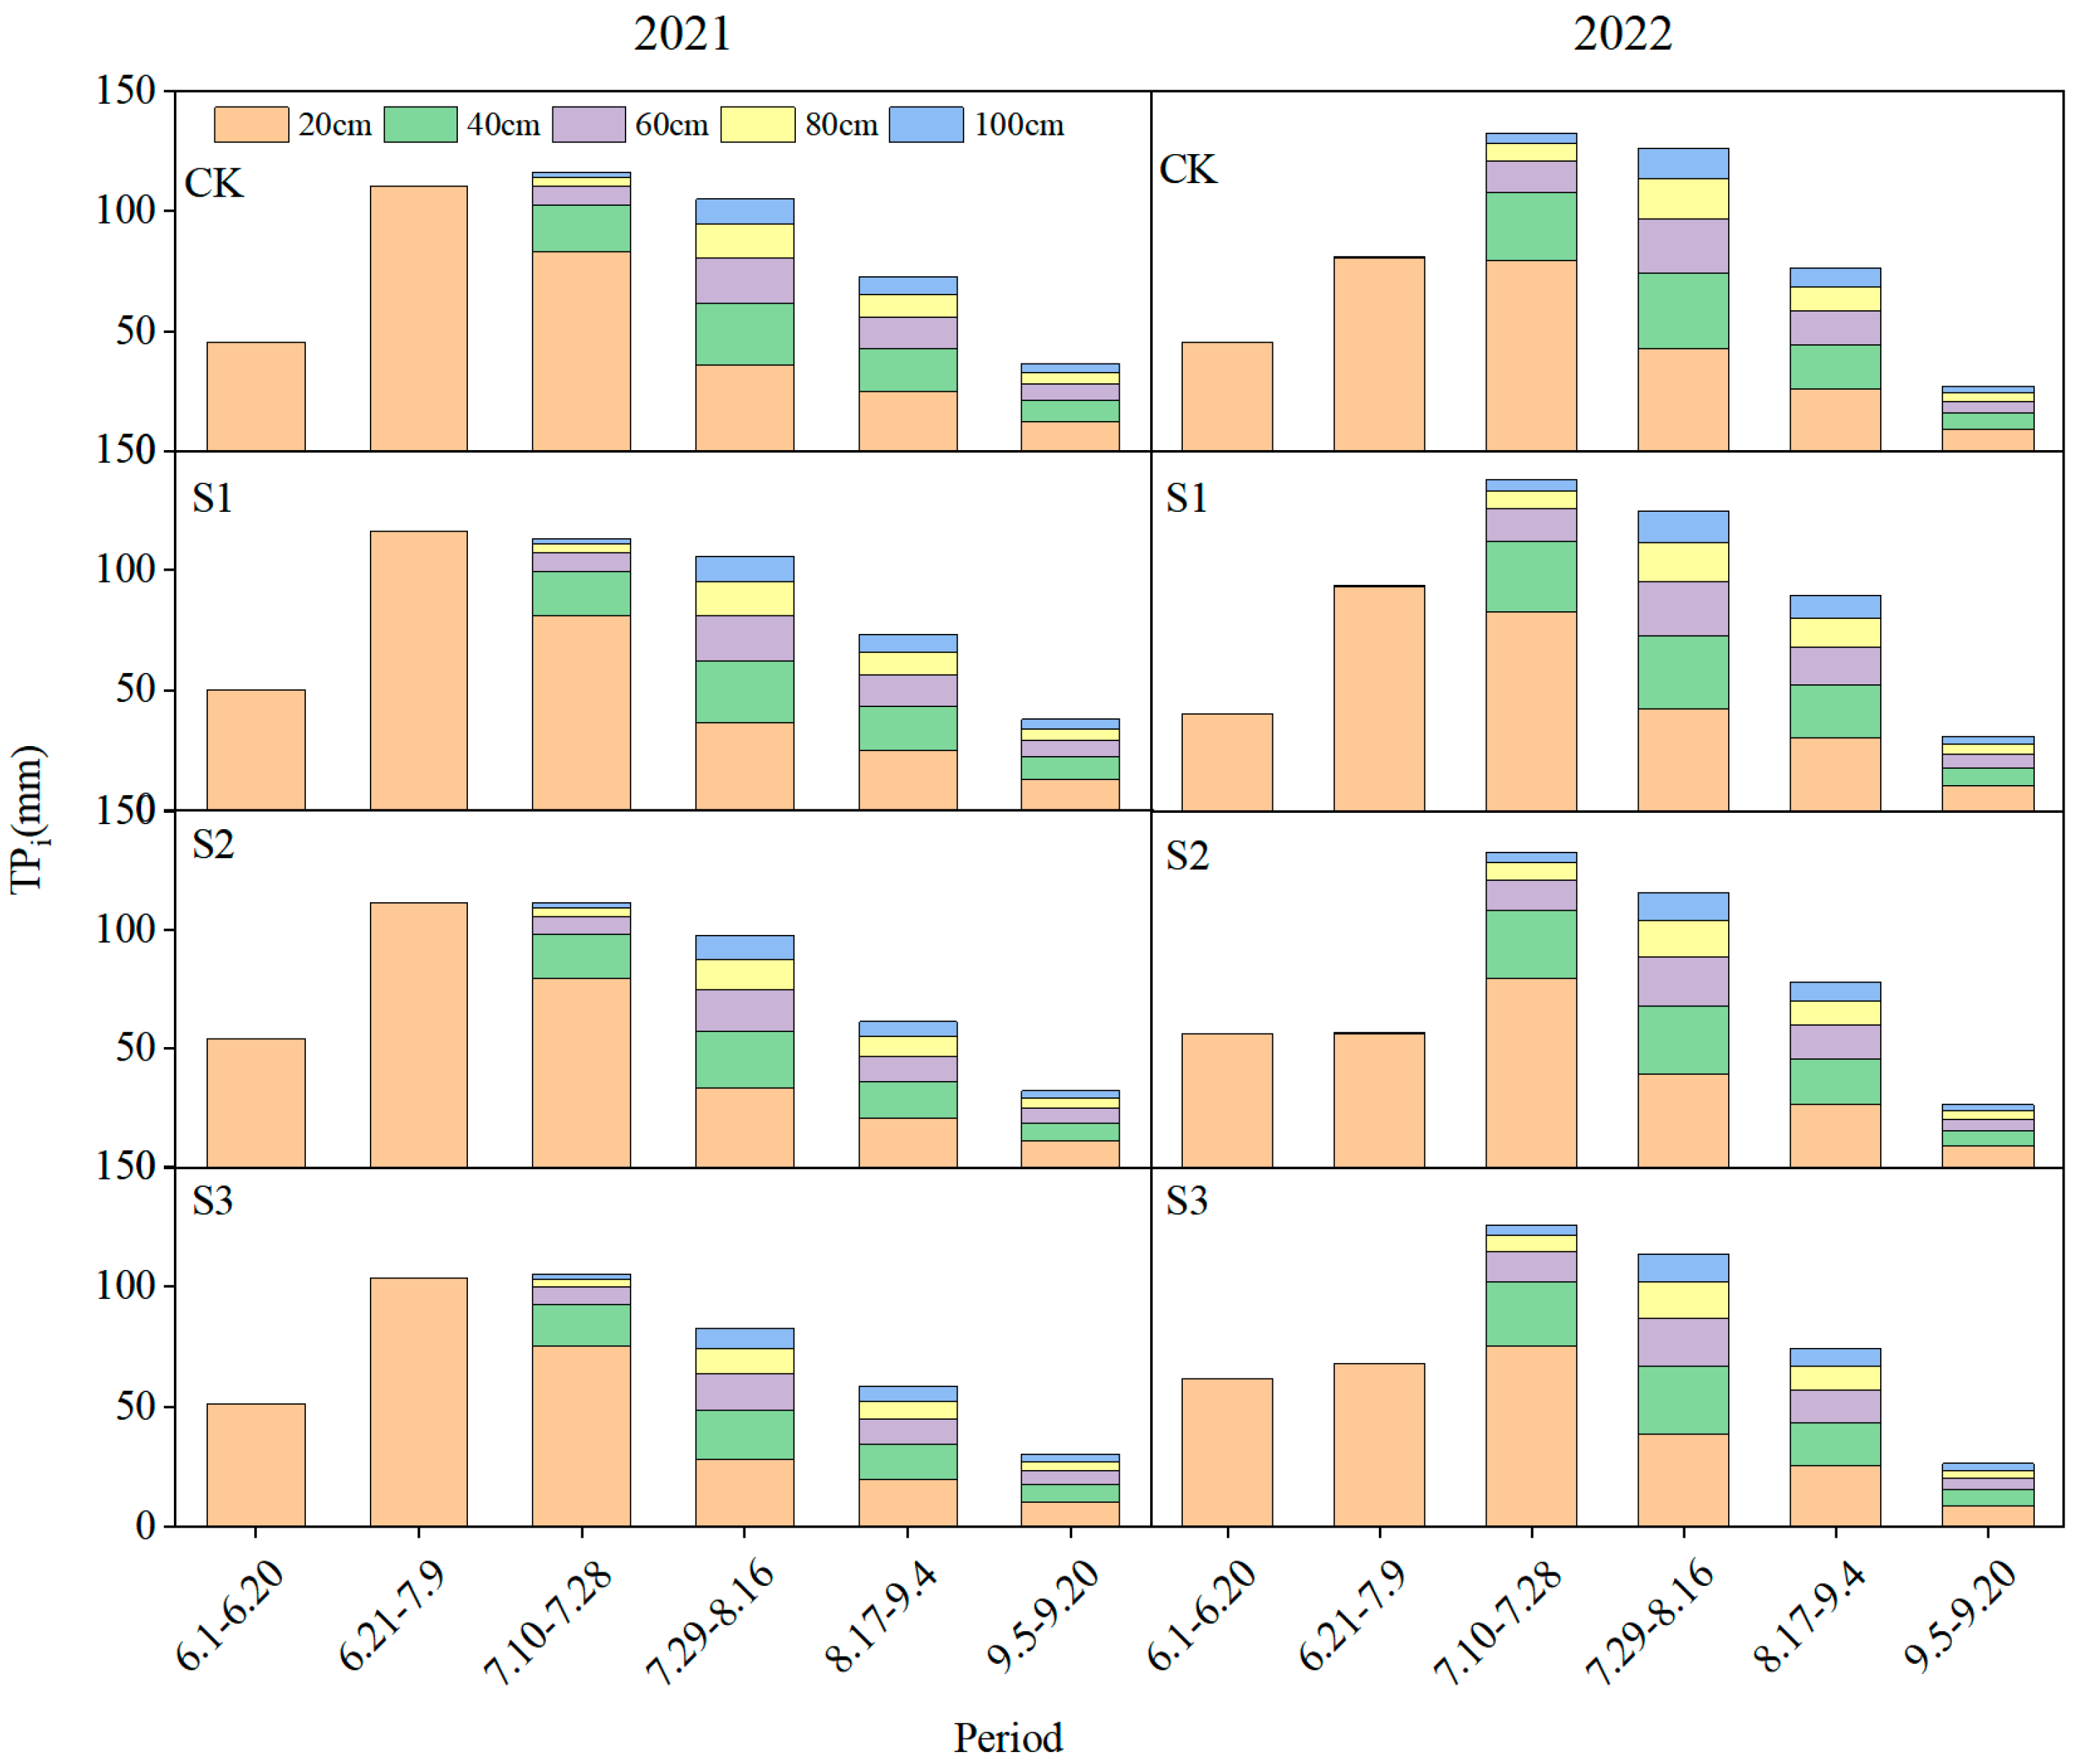
Table 2 summarizes the total values, differences, and percentage ratios (Ta/Tp) of actual and potential transpiration across all irrigation treatments during the reproductive stages in 2021 and 2022. As shown in Figure 6 and Table 2, irrigation with higher salinity levels (S2 and S3) significantly reduced both Ta and Tp compared with the control (CK). Specifically, under the S2 treatment, Ta decreased by 11.89% and 9.60% in 2021 and 2022, respectively, while Tp decreased by 3.67% and 2.60%. Under the S3 treatment, Ta declined by 21.47% and 14.25%, and Tp by 11.01% and 3.92%, respectively. In contrast, Ta and Tp under the S1 treatment were comparable to those under CK, indicating that moderate salinity irrigation (1.0 g/L) may stimulate root activity and enhance transpiration capacity. Further analysis of Table 2 shows that, except for the comparable Tp − Ta differences observed under S1 and S2 in 2021, the difference between Ta and Tp generally increased with increasing irrigation salinity, while the Ta/Tp ratio exhibited a consistent downward trend. This inverse relationship demonstrates that as salt stress intensifies, the inhibitory effect of salinity on the root system’s water absorption capacity becomes more pronounced. The reduced Ta/Tp ratio reflects the growing limitation of plant transpiration under coupled water-salt stress conditions.
The vertical distribution of potential transpiration (Tpi) among soil layers under different salinity irrigation treatments exhibited pronounced variations throughout the crop growth period (Figure 6). Total potential transpiration (Tp) was primarily allocated within the 0–40 cm soil layer, indicating that root water uptake was most active in the shallow zone in 2021 and 2022. As the growing season progressed, the contribution from deeper layers (60–100 cm) gradually increased, particularly under moderate salinity treatments (S1 and S2), suggesting that mild osmotic stress promoted deeper root development and water extraction. In contrast, under high-salinity irrigation (S3), the total Tp markedly decreased, implying that excessive salinity inhibited shallow root water uptake and limited overall transpiration capacity. Across growth stages, Tp peaked during the flowering to grain-filling period (10 July to 16 August), corresponding to the phase of maximum crop water demand. Compared with 2021, a slightly higher overall Tp was observed in 2022, likely due to more favorable soil moisture conditions during that year.
Overall, these results suggest that moderate saline irrigation may have a mild stimulatory effect on sunflower water use, while excessive salinity significantly suppresses transpiration and water uptake. Root water uptake exhibited temporal and spatial heterogeneity across soil depths during crop growth and development. The findings highlight the importance of controlling irrigation salinity within a threshold range to maintain efficient root water uptake and ensure stable crop growth under saline–alkali environments.

3.4. Composite Water–Salt Conditions at Different Soil Depths Under Salinity Treatments

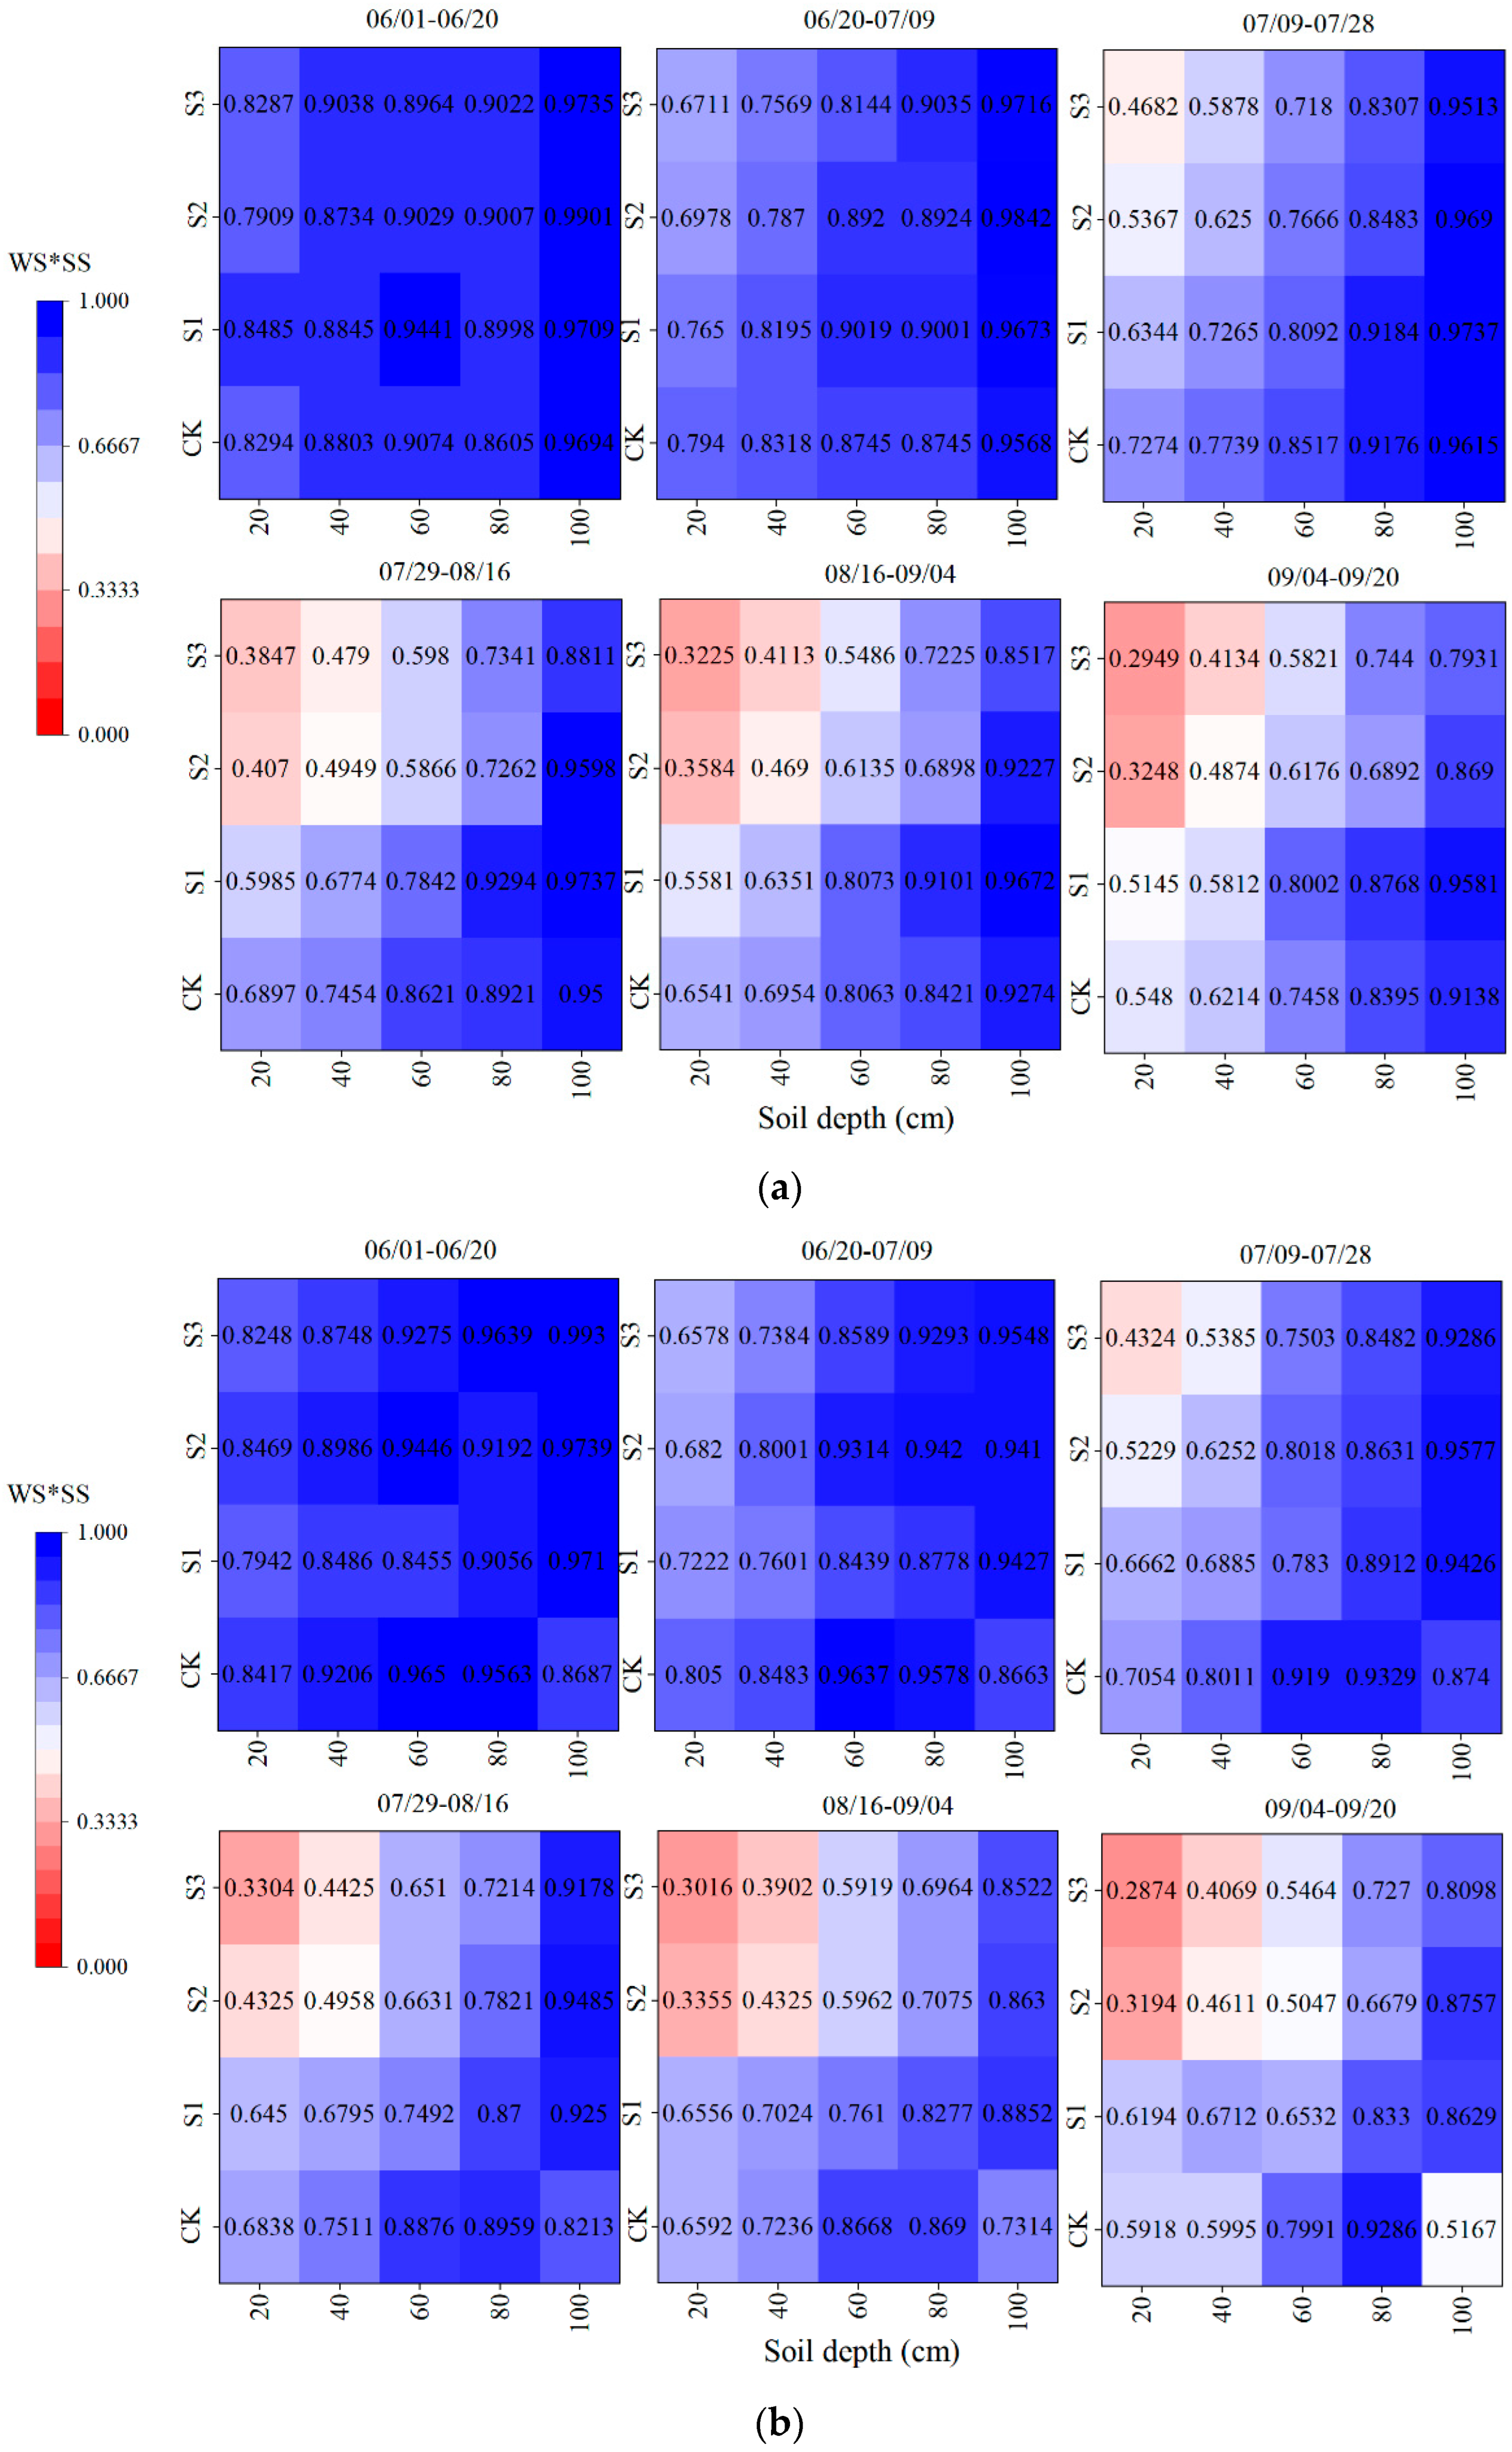
The growth stages defined in this study correspond approximately to the vegetative (V) and reproductive (R) phases of crop development. Figure 7a,b illustrate the spatiotemporal dynamics of the composite water–salt stress factor (WS × SS) across soil depths and treatments in 2021 and 2022. WS × SS varied significantly with soil depth, treatment, and growth stage, following a dynamic trend of “initial alleviation–mid-season intensification–late-stage mitigation”. Surface soils consistently experienced higher water–salt stress due to salinity accumulation caused by evaporation and upward capillary movement.
During early growth (1 June–8 July), WS × SS ranged from 0.671 to 0.974 in 2021 and from 0.658 to 0.971 in 2022, indicating generally weak stress that favored root water uptake. In the mid-growth stage (9 July–15 August), stress intensified markedly, particularly under S2 and S3, where surface WS × SS values fell below 0.40, forming pronounced stress zones that restricted root water absorption, while deeper layers remained less affected. In the late growth stage (16 August–20 September), S2 and S3 still exhibited low surface WS × SS and evident stress zones, whereas CK and S1 showed milder stress. Overall, WS × SS ranged from 0.295 to 0.958 in 2021 and from 0.287 to 0.929 in 2022, with stress persisting in surface layers and improved conditions in deeper soils, resulting in a downward shift in the main root water-uptake zone.
Across treatments, WS × SS values followed the order CK > S1 > S2 > S3, indicating that stronger combined water and salinity stress intensified overall stress effects. These findings demonstrate that WS × SS effectively characterizes the vertical heterogeneity of soil water and salinity across different layers and their constraining influence on root water uptake.

3.5. Constructing Multiple Linear Regression Equations to Find Parameters

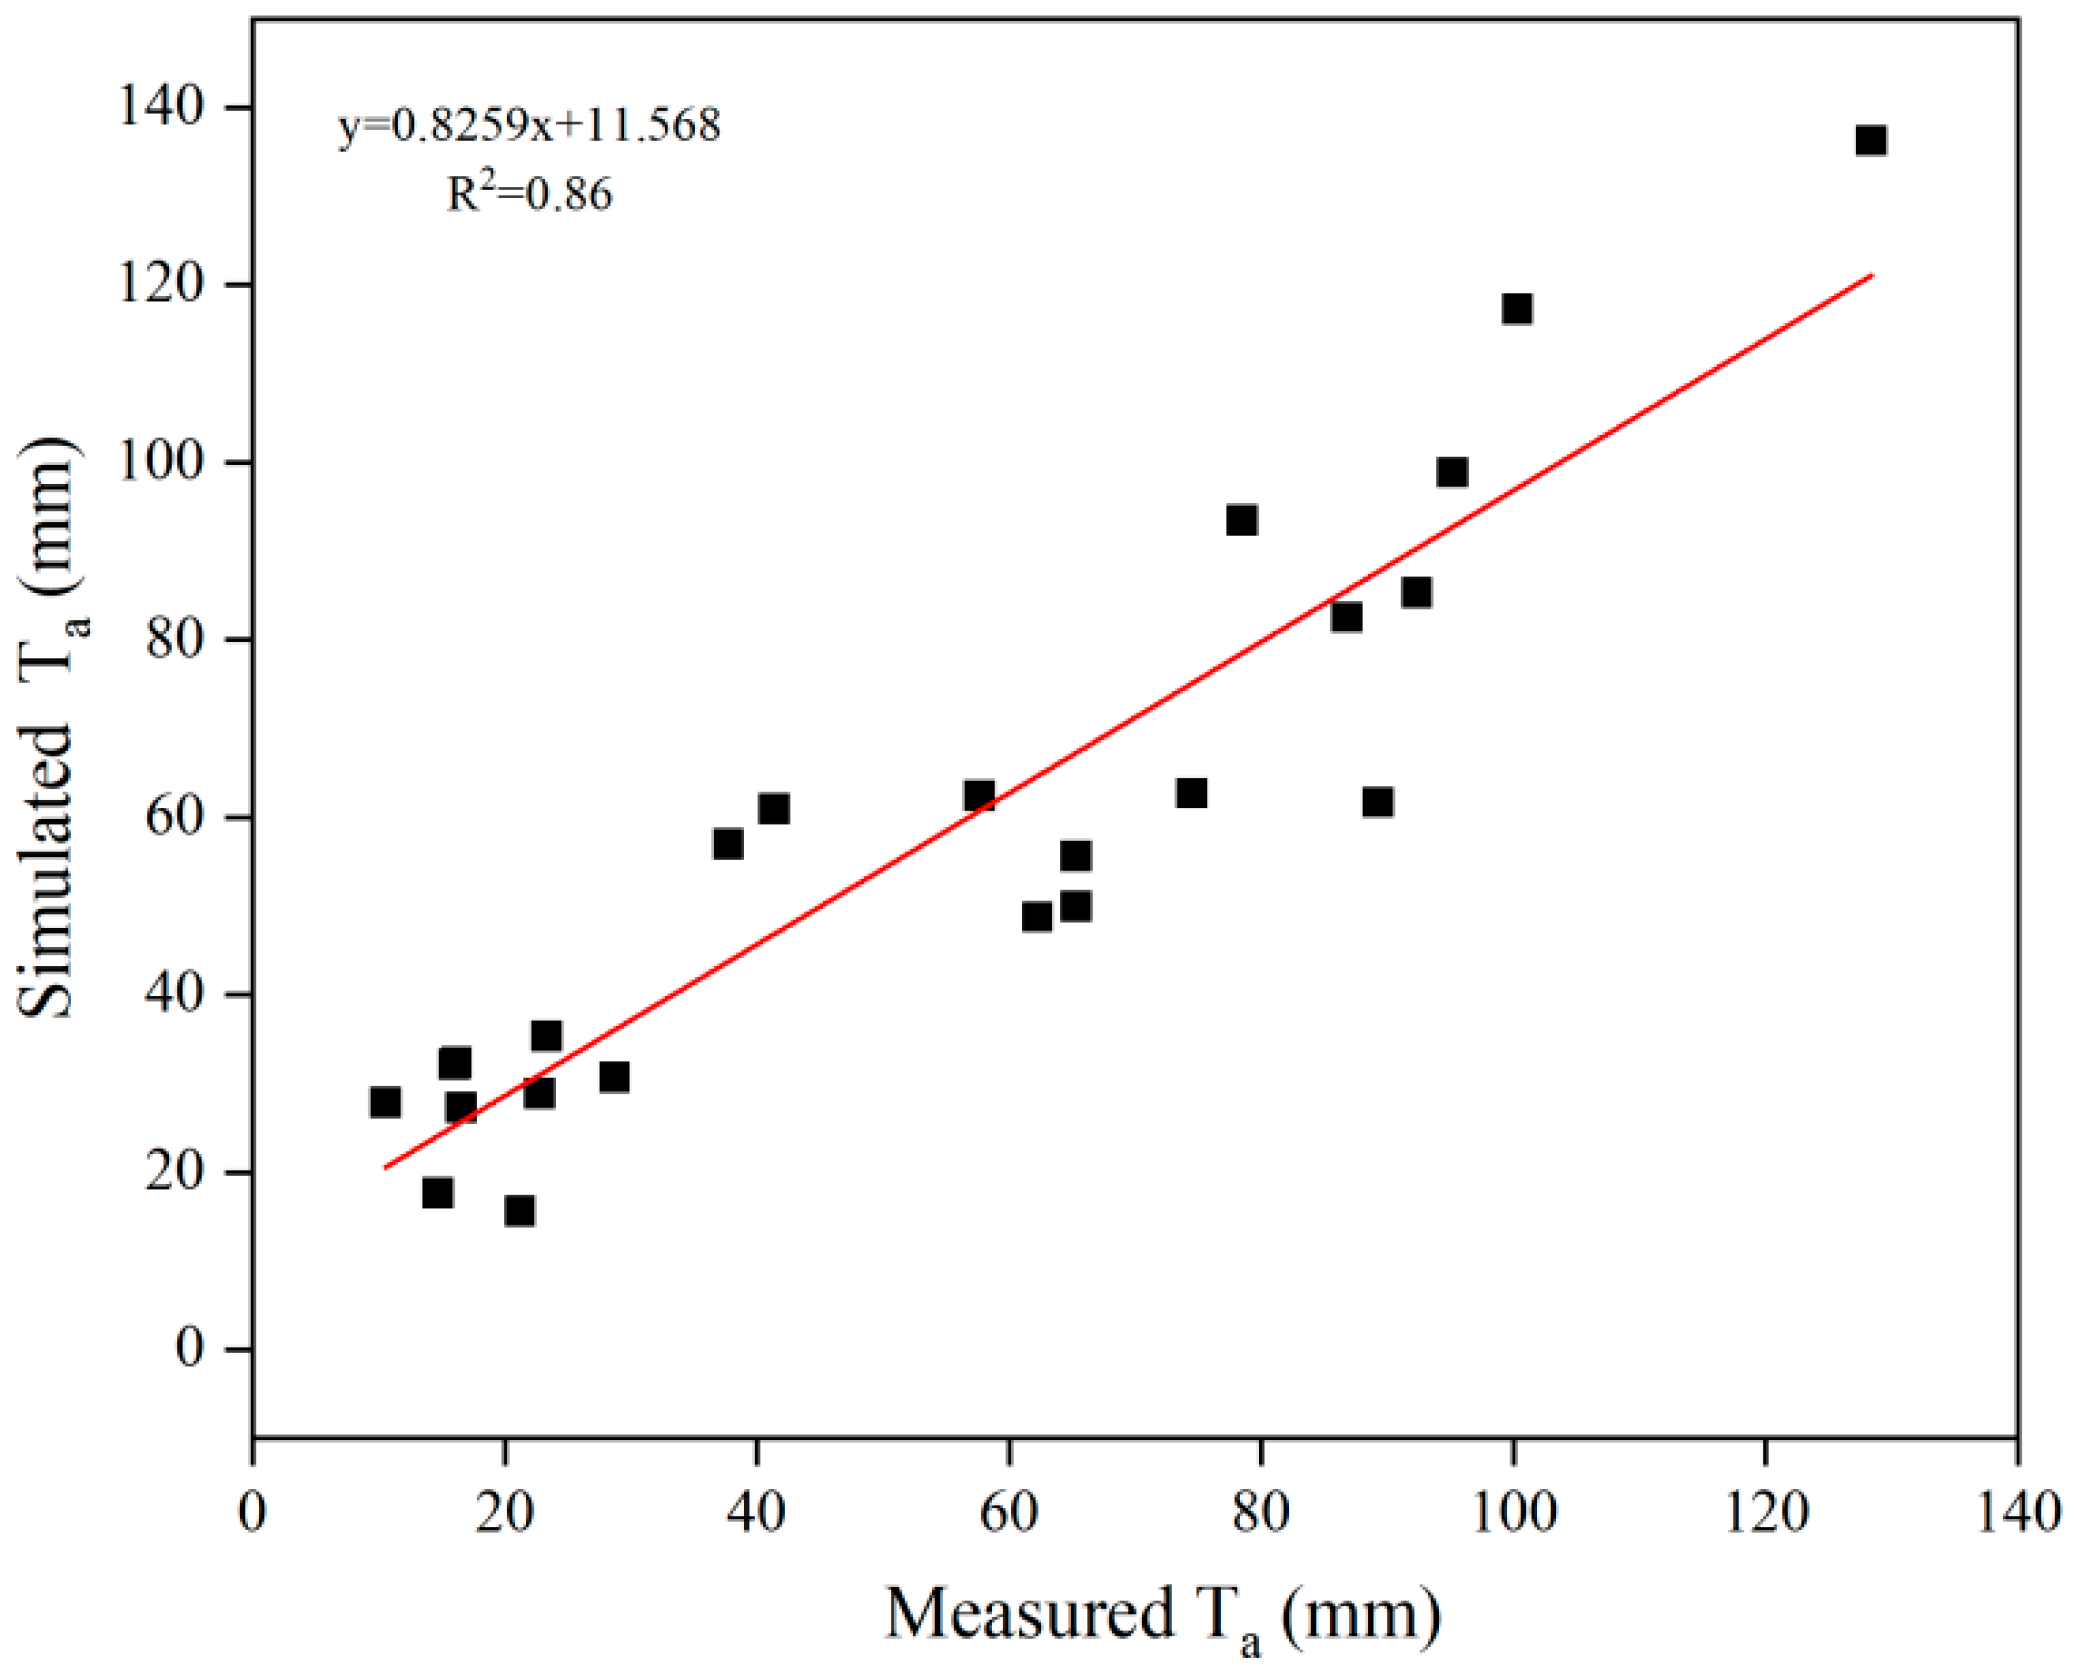
Based on field-measured data on the distribution of soil water and salinity at different depths and growth stages under various salinity treatments, as well as observed trends in actual plant transpiration (Ta), we constructed a multiple linear regression model to parameterize root water uptake. Using the 2021 Ta values for each treatment and the distribution of soil moisture and soil conductivity across soil layers (Figure 3 and Figure 4), the regression coefficients for each soil layer during the pre-reproductive stage of sunflower were derived from the root water uptake function (Equation (14)) as: a = 0.6758; b = 0; c = 0; d = 0; and e = 0. For the mid- and late-reproductive stages, the initial regression coefficients were: a = 1.9222; b = 0.9016; c = 0.2037; d = 0.3; and e = 2.00. The reliability of these fitting parameters was evaluated using Figure 8, where the actual and fitted Ta values were generally distributed around the 1:1 line, and the coefficient of determination R2 was 0.86, indicating that the derived parameters can effectively characterize the actual transpiration of plants. These results demonstrate the feasibility of the constructed root water uptake response function under salt stress conditions.

3.6. Optimization Parameters

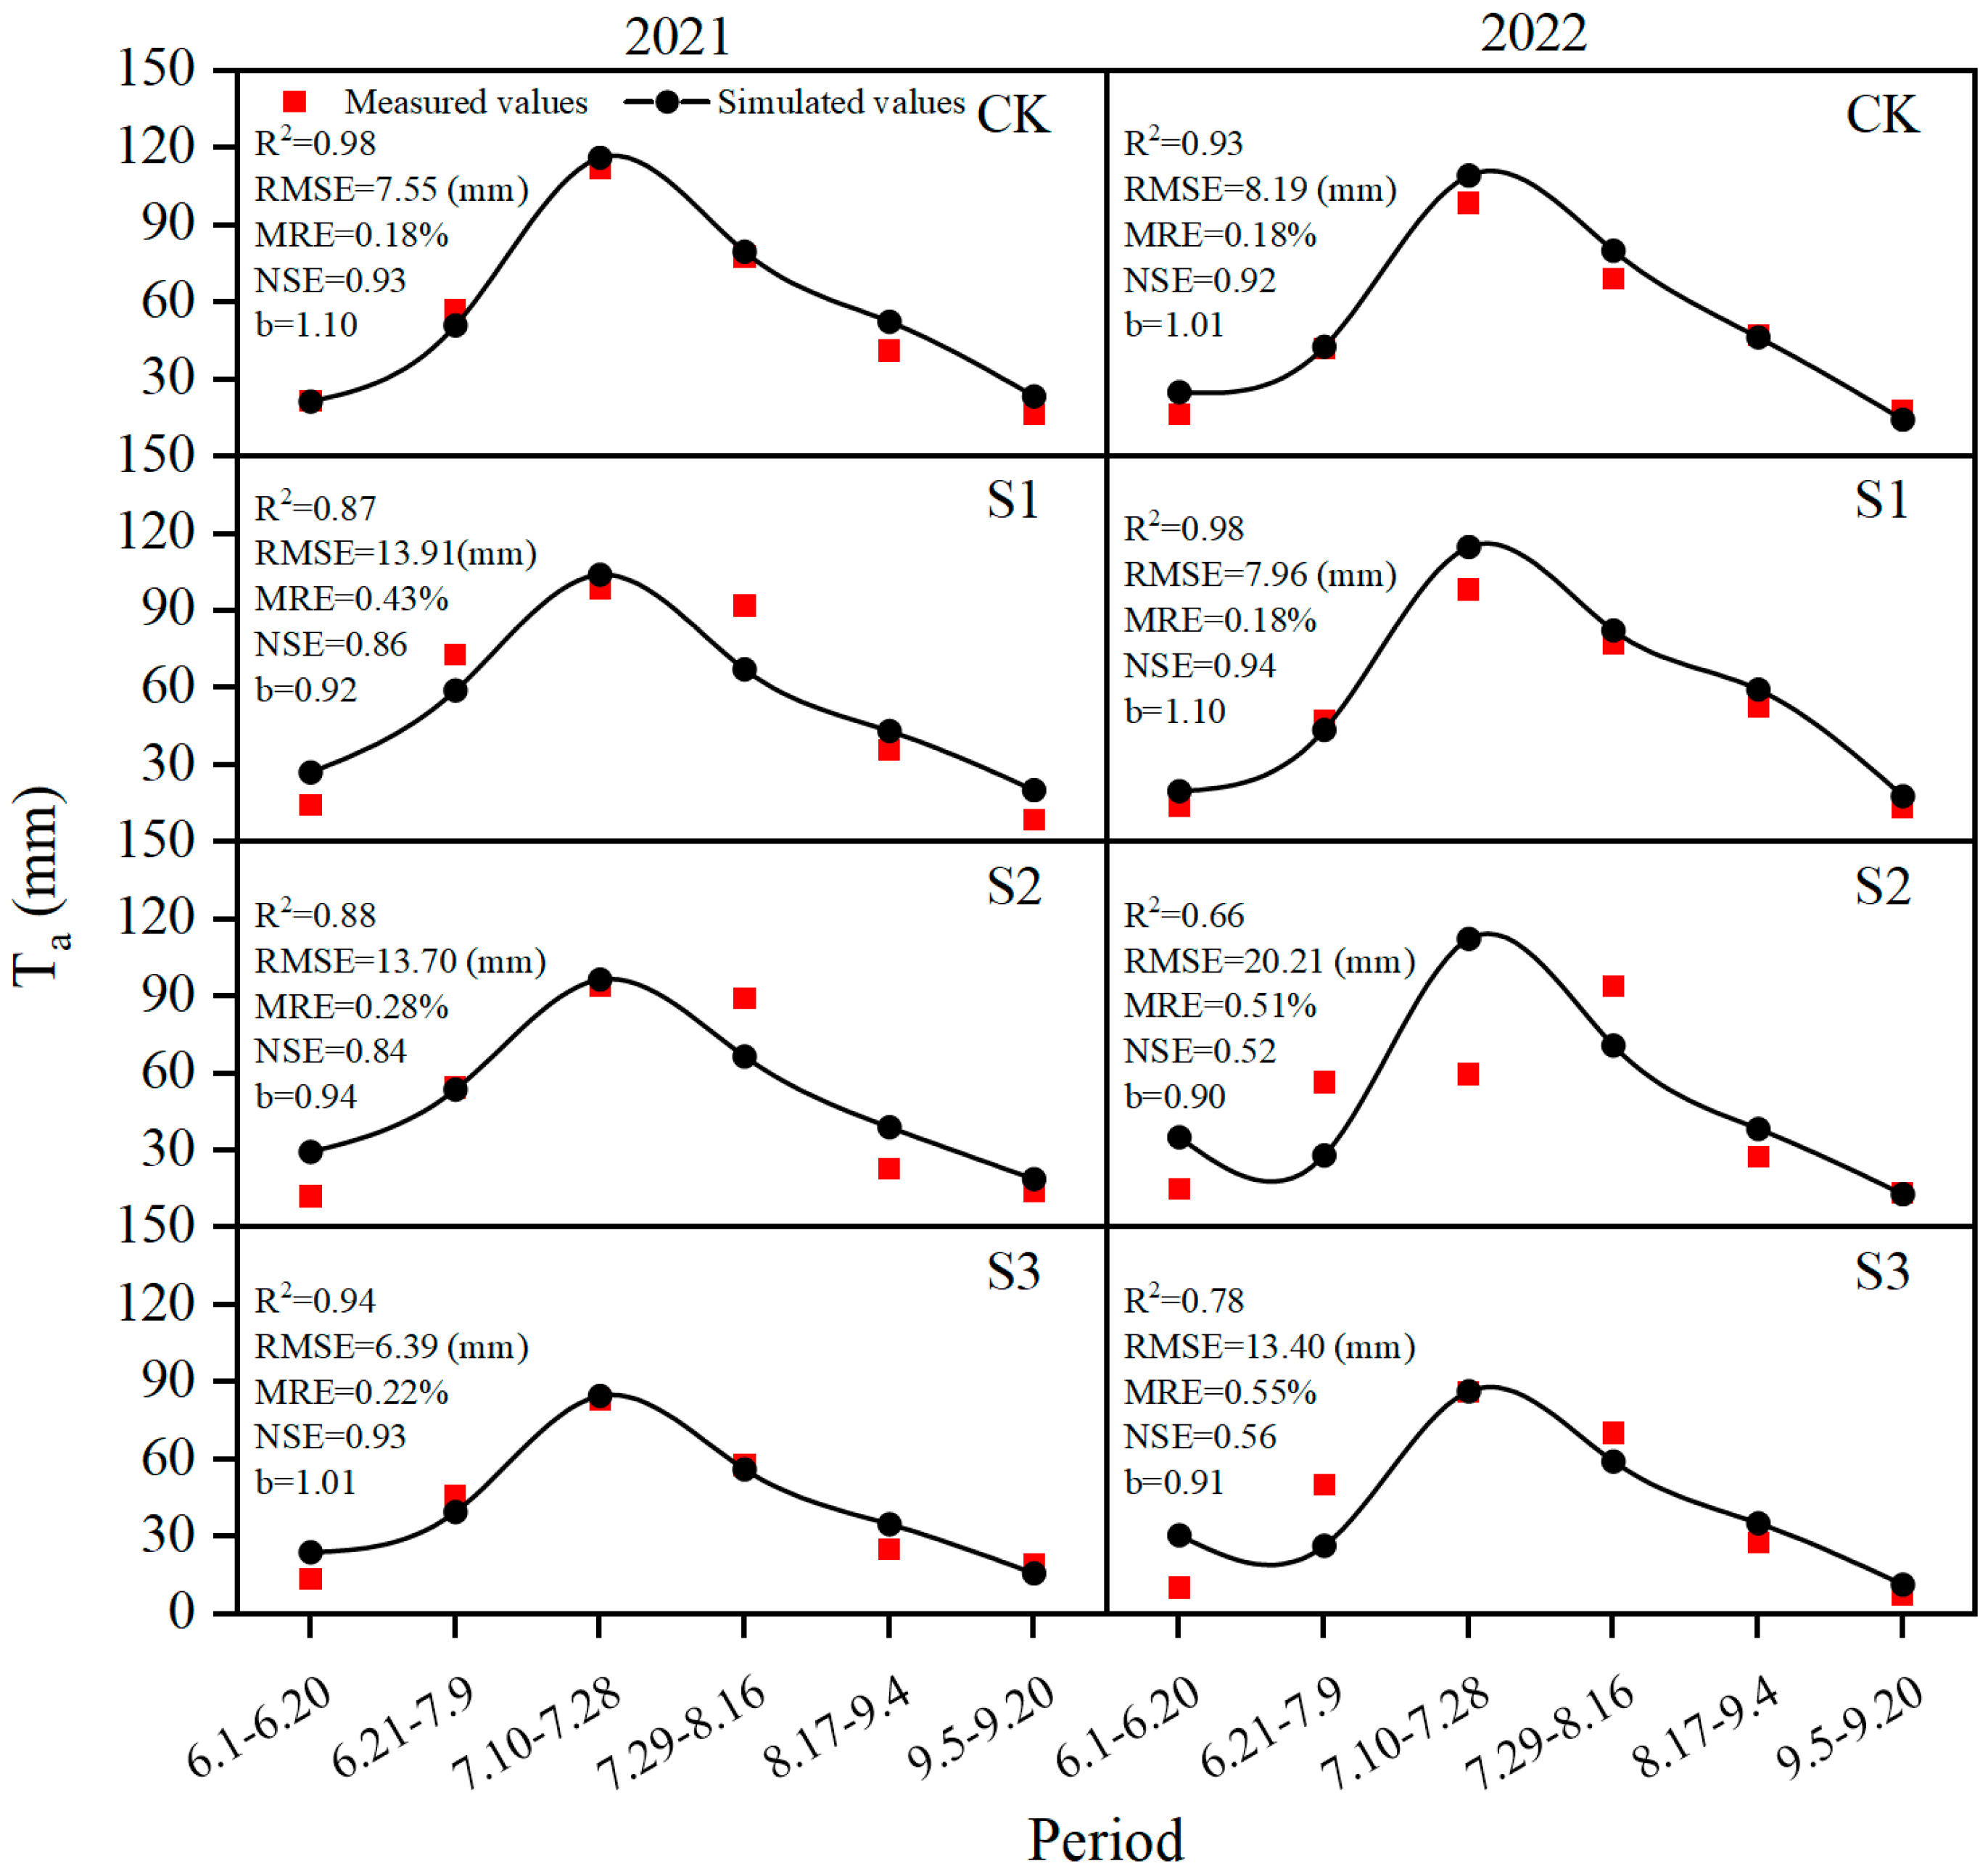
Based on the improved root water uptake rate equation, data from 2021 and 2022 were used to calibrate and validate the model. A reverse multiple linear regression approach was employed to assess the accuracy of parameter adjustments and further optimize the coefficients representing combined water and salinity stress in the root water uptake function. The final optimized coefficients for each treatment are presented in Table 3. The results indicate that the regression-based optimization effectively enhanced model performance, with the simulated transpiration (Ta) showing good agreement with measured values across different growth stages. The simulation of Ta provides valuable insights into the differential response of root water uptake to stratified soil water and salinity conditions. As shown in Figure 9, both simulated and actual Ta exhibited similar temporal patterns, with an initial increase followed by a gradual decline—corresponding to the physiological progression of sunflower from the seedling stage to the late growth stage.
During both calibration and validation, simulated Ta values were generally higher than the actual ones. This slight overestimation is likely attributed to the inherent simplifications of the regression-based approach, which may not fully capture the nonlinear and dynamic effects of water and salinity stress on root water uptake. In particular, the regression coefficients represent average responses at the growth-stage scale and do not account for short-term fluctuations in soil and root dynamics, resulting in a modest positive bias.
Model calibration and validation performance metrics are summarized in Figure 9. Overall, error values remained within acceptable ranges. During calibration, RMSE values ranged from 6.39 to 13.91 mm, NSE values from 0.84 to 0.93, and MRE values from 0.18% to 0.43%. The average coefficient of determination (R2) was 0.92, and the average regression coefficient (b) was 0.99. Validation results showed slightly decreased performance: average RMSE was 12.44 mm; NSE ranged from 0.52 to 0.94, and MRE values were between 0.18% and 0.55%, with an average R2 of 0.84 and b of 0.98. In addition, Sensitivity analysis further indicated that the model performance was relatively stable under moderate variations in the parameters (Table 4). The leave-one-treatment-out validation produced parameter sets that were generally consistent with the original calibrated values, with relatively larger coefficients observed in the surface and deep soil layers. The detailed parameter results are provided in Table 5 and Table 6.

4. Discussion

4.1. Effect of Combined Water and Salinity on ETa, Ta and Tp

Irrigation with saline water affects both soil water infiltration and salt transport processes. In this study, brackish water irrigation increased the spatial variability of soil moisture and salinity, consistent with previous findings [33,34,35]. Soil salinity exhibited an increasing trend with higher irrigation water salinity [36,37]. The accumulation of Na+ and other ions can induce soil particle swelling and reduce permeability, thereby altering soil structure and the distribution of water-stable aggregates. As a result, water infiltration into the middle soil layers was enhanced, while surface evaporation losses were reduced, leading to increased soil moisture and a redistribution of water within the soil profile [38]. Appropriately managed saline irrigation has been reported to reduce overall water consumption while improving crop yield and water use efficiency [39]. In the present study, crop evapotranspiration (ETa) decreased progressively with increasing irrigation water salinity. This reduction can be attributed to decreased photosynthetic activity, reduced root density, and lower soil water potential [40], which is consistent with previous studies [41,42]. Soil salinity also directly influences plant transpiration. High salinity levels lead to salt accumulation in the root zone [43,44], which restricts root water uptake and reduces actual transpiration (Ta). In our experiment, the ratio of actual to potential transpiration (Ta/Tp) showed a decreasing trend from the control treatment to the high-salinity treatments. These findings indicate that high-salinity irrigation suppresses both actual and potential transpiration by restricting root water uptake and increasing osmotic stress in the rhizosphere. Salinity reduces soil water potential, thereby decreasing the hydraulic conductivity at the root–soil interface and limiting water transport to the plant [45]. Given that transpiration is closely linked to plant growth and yield formation, its sensitivity to salinity stress should be carefully considered [46]. These results highlight the necessity of developing root water uptake functions that can explicitly account for plant responses to the spatial distribution of soil moisture and salinity.

4.2. Optimization of Root Water Uptake Parameters Under Salinity Stress

The optimization of root water uptake function parameters under saline stress conditions provides a theoretical foundation for designing efficient and sustainable irrigation strategies. To date, most parameters related to root water uptake under salinity stress cannot be directly obtained through experimentation [26]. Jalali [47] estimated salt stress reduction parameters by fitting measured soil salinity and crop yield data. Homaee [13] optimized these parameters using average soil solution salinity and the ratio of actual to potential transpiration. Wang [26] developed a method to refine the salt stress factors in a winter wheat root water uptake model based on the linear relationship between the maximum uptake rate and root nitrogen density.
In saline–alkaline soils, crops are often subjected to simultaneous drought and salinity stress. The combined effect of water and salt stress is typically modeled using a multiplicative approach, which has been widely adopted [5,19,21]. In contrast, the present study refines this method by stratifying the root zone and examining the depth-specific response of root water uptake to water and salt stress. This stratified modeling approach quantifies the layered influence of salinity on water uptake, clarifies the response functions at different root depths, and improves the integration of water and salt stress responses within the root water uptake model.
Overall, the results suggest that the improved root water uptake model is capable of reasonably simulating the temporal and spatial variation in root water uptake under saline irrigation conditions. The optimized parameterization enhances model performance and supports its application in evaluating crop water use and irrigation strategies in saline environments.

5. Conclusions

Based on the response of root water uptake to soil water–salt stratification, a modified root water uptake model was developed to estimate crop water consumption and actual plant transpiration under different salinity conditions. The model incorporates depth-dependent coefficients to represent the response of root water uptake to variations in soil moisture and salinity across different soil layers. The results show that root water uptake exhibits clear stratification characteristics during crop growth. During the early growth stage, water uptake was mainly concentrated in the upper soil layer, whereas during the middle and late growth stages, contributions from both surface and deeper soil layers became more significant. The calibrated coefficients reflect this dynamic response pattern. Model validation demonstrated good agreement between simulated and measured transpiration, with mean values of R2 = 0.88, RMSE = 11.41 mm, MRE = 0.32%, NSE = 0.81, and regression coefficient b = 0.99, indicating satisfactory model performance. Overall, the proposed model effectively captures the response of root water uptake to soil water–salt stratification at the soil layer scale. This approach improves the understanding of plant water uptake responses under saline conditions and provides a useful basis for evaluating crop response to water–salt stress in agricultural systems.

Author Contributions

S.Z. and Z.Q. are responsible for the overall design of the paper’s ideas. S.Z. mainly conducts experimental work, model construction and paper writing, while X.G. assists in model construction and paper revision. D.Z. participates in the experiments. All authors have read and agreed to the published version of the manuscript.

Funding

The Water-saving and salt control technologies and ecological regulation techniques for saline–alkali land in the Yellow River Diversion Irrigation District (BR22-13-12), National Natural Science Foundation of China (U2443210), The Development Project for Young Scientific and Technological Talents in Higher Education Institutions of Inner Mongolia Autonomous Region [NJYT23083]. Special project of basic scientific research business expenses of China Academy of water resources and hydropower (MK0145B012021), The First-class Discipline Research Project of Higher Education Institutions in Inner Mongolia Autonomous Region (YLXKZX-NND-052), Long-term targeted reduction and carbon increase expansion of saline–alkali obstacles in cultivated land for water conservation research on Ground Capacity Enhancement Technology Project One: Precise Salt Control Technology for Mild Saline–alkali Land Drip Irrigation [NMKJXM202401]. Standard system for Comprehensive Utilization of saline–alkali land [NMGGzLBZTX-04].

Data Availability Statement

All the data involved in this article are provided in the article.

Conflicts of Interest

The authors declare no conflicts of interest. The funders had no role in the design of the study; in the collection, analyses, or interpretation of data; in the writing of the manuscript; or in the decision to publish the results.

References

  1. Kang, S.; Hao, X.; Du, T.; Tong, L.; Su, X.; Lu, H.; Li, X.; Huo, Z.; Li, S.; Ding, R. Improving agricultural water productivity to ensure food security in China under changing environment: From research to practice. Agric. Water Manag. 2017, 179, 5–17. [Google Scholar] [CrossRef]
  2. Hopmans, J.W.; Qureshi, A.S.; Kisekka, I.; Munns, R.; Grattan, S.R.; Rengasamy, P.; Ben-Gal, A.; Assouline, S.; Javaux, M.; Minhas, P.S.; et al. Critical knowledge gaps and research priorities in global soil salinity. Adv. Agron. 2021, 169, 1–191. [Google Scholar] [CrossRef]
  3. Mohanavelu, A.; Naganna, S.R.; Al-Ansari, N. Irrigation-induced salinity and sodicity hazards on soil and groundwater: An overview of its causes, impacts and mitigation strategies. Agriculture 2021, 11, 983. [Google Scholar] [CrossRef]
  4. Ning, S.; Zhou, B.; Shi, J.; Wang, Q. Soil water/salt balance and water productivity of typical irrigation schedules for cotton under film mulched drip irrigation in northern Xinjiang. Agric. Water Manag. 2021, 245, 106651. [Google Scholar] [CrossRef]
  5. Shani, U.; Ben-Gal, A.; Tripler, E.; Dudley, L.M. Correction to “Plant response to the soil environment”. Water Resour. Res. 2009, 45, W05701. [Google Scholar] [CrossRef]
  6. Shi, J.; Li, S.; Zuo, Q.; Ben-Gal, A. An index for plant water deficit based on root-weighted soil water content. J. Hydrol. 2015, 522, 285–294. [Google Scholar] [CrossRef]
  7. Liu, L.; Wang, T.; Wang, L.; Wu, X.; Zuo, Q.; Shi, J.; Sheng, J.; Jiang, P.; Chen, Q.; Ben-Gal, A. Plant water deficit index-based irrigation under conditions of salinity. Agric. Water Manag. 2022, 269, 107669. [Google Scholar] [CrossRef]
  8. Gardner, W.R. Dynamic aspects of water availability to plants. Soil Sci. 1960, 89, 63–73. [Google Scholar] [CrossRef]
  9. Albasha, R.; Mailhol, J.C.; Cheviron, B. Compensatory uptake functions in empirical macroscopic root water uptake models—Experimental and numerical analysis. Agric. Water Manag. 2025, 155, 22–39. [Google Scholar] [CrossRef]
  10. Homaee, M. Root Water Uptake Under Non-Uniform Transient Salinity and Water Stress. Ph.D. Thesis, Wageningen University, Wageningen, The Netherlands, 1999. [Google Scholar]
  11. Van Genuchten, M.T. A Numerical Model for Water and Solute Movement; Unpublished Research Report; United States Department of Agriculture Agricultural Research Service US Salinity Laboratory: Riverside, CA, USA, 1987.
  12. Dirksen, C.; Kool, J.B.; Koorevaar, P.; Van Genuchten, M.T. HYSWASOR—Simulation model of hysteretic water and solute transport in the root zone. In Water Flow and Solute Transport in Soils; Russo, D., Dagan, G., Eds.; Springer: Berlin/Heidelberg, Germany, 1993; pp. 99–122. [Google Scholar]
  13. Homaee, M.; Dirksen, C.; Feddes, R.A. Simulation of root water uptake: I. Non-uniform transient salinity using different macroscopic reduction functions. Agric. Water Manag. 2002, 57, 89–109. [Google Scholar] [CrossRef]
  14. Skaggs, T.H.; van Genuchten, M.T.; Shouse, P.J.; Poss, J.A. Macroscopic approaches to root water uptake as a function of water and salinity stress. Agric. Water Manag. 2006, 86, 140–149. [Google Scholar] [CrossRef]
  15. Šimůnek, J.; van Genuchten, M.T.; Šejna, M. Recent developments and applications of the HYDRUS computer software packages. Vadose Zone J. 2016, 15, vzj2016.04.0033. [Google Scholar] [CrossRef]
  16. Feddes, R.A.; Kowalik, P.J.; Zarandy, H. Water uptake by plant roots. In Simulation of Field Water Use and Crop Yield; Centre for Agricultural Publishing and Documentation: Wageningen, The Netherlands, 1978. [Google Scholar]
  17. Maas, E.V.; Hoffman, G.J. Crop salt tolerance—Current assessment. J. Irrig. Drain. Div. 1977, 103, 115–134. [Google Scholar] [CrossRef]
  18. Wang, T.; Xu, Y.; Zuo, Q.; Wu, X.; Shi, J.; Liu, L.; Ben-Gal, A. Evaluating and improving soil water and salinity response functions for root water uptake. Agric. Water Manag. 2023, 287, 108451. [Google Scholar] [CrossRef]
  19. Dudley, L.M.; Shani, U. Modeling plant response to drought and salt stress: Reformulation of the root-sink term. Vadose Zone J. 2003, 2, 751–758. [Google Scholar] [CrossRef]
  20. Wang, Q.; Huo, Z.; Feng, S.; Yuan, C.; Wang, J. Comparison of spring maize root water uptake models under water and salinity stress validated with field experiment data. Irrig. Drain. 2015, 64, 669–682. [Google Scholar] [CrossRef]
  21. Wang, L.; Ning, S.; Chen, X.; Li, Y.; Guo, W.; Ben-Gal, A. Modeling tomato root water uptake influenced by soil salinity under drip irrigation with an inverse method. Agric. Water Manag. 2021, 255, 106975. [Google Scholar] [CrossRef]
  22. Šimůnek, J.; van Genuchten, M.T.; Šejna, M. Development and applications of the HYDRUS and STANMOD software packages and related codes. Vadose Zone J. 2008, 7, 587–600. [Google Scholar] [CrossRef]
  23. Babazadeh, H.; Tabrizi, M.S.; Homaee, M. Assessing and modifying macroscopic root water extraction basil (Ocimum basilicum) models under simultaneous water and salinity stresses. Soil Sci. Soc. Am. J. 2017, 81, 10–19. [Google Scholar] [CrossRef]
  24. Vanderborght, J.; Couvreur, V.; Meunier, F.; Schnepf, A.; Vereecken, H.; Bouda, M.; Javaux, M. From hydraulic root architecture models to macroscopic representations of root hydraulics in soil water flow and land surface models. Hydrol. Earth Syst. Sci. 2021, 25, 4835–4860. [Google Scholar] [CrossRef]
  25. Hopmans, J.W.; Guttierez-Rave, E. Calibration of a root water uptake model in spatially variable soils. J. Hydrol. 1988, 103, 53–65. [Google Scholar] [CrossRef]
  26. Wang, L.; Shi, J.; Zuo, Q.; Zheng, W.; Zhu, X. Optimizing parameters of salinity stress reduction function using the relationship between root-water-uptake and root nitrogen mass. Agric. Water Manag. 2012, 104, 142–152. [Google Scholar] [CrossRef]
  27. China Meteorological Administration. China Meteorological Data Service Center [Online]. 2025. Available online: http://data.cma.cn (accessed on 3 May 2025).
  28. Kendy, E.; Gérard-Marchant, P.; Todd Walter, M.; Zhang, Y.; Liu, C.; Steenhuis, T.S. A soil-water-balance approach to quantify groundwater recharge from irrigated cropland in the North China Plain. Hydrol. Process. 2003, 17, 2011–2031. [Google Scholar] [CrossRef]
  29. Novak, V. Estimation of soil-water extraction patterns by roots. Agric. Water Manag. 1987, 12, 271–278. [Google Scholar] [CrossRef]
  30. Garrity, P.D.; Watts, D.G.; Sullivan, C.Y.; Gillery, J.R. Moisture deficits and grain sorghum performance: Evapotranspiration-yield relationships. Agron. J. 1982, 74, 815–820. [Google Scholar] [CrossRef]
  31. Allen, R.G.; Pereira, L.S.; Raes, D.; Smith, M. Crop Evapotranspiration—Guidelines for Computing Crop Water Requirements—FAO Irrigation and Drainage Paper 56; FAO: Rome, Italy, 1998. [Google Scholar]
  32. Sau, F.; Boote, K.J.; McNair Bostick, W.; Jones, J.W.; Inés Mínguez, M. Testing and improving evapotranspiration and soil water balance of the DSSAT crop models. Agron. J. 2004, 96, 1243–1257. [Google Scholar] [CrossRef]
  33. Hou, X.; Xiang, Y.; Fan, J.; Zhang, F.; Hu, W. Spatial distribution and variability of soil salinity in film-mulched cotton fields under various drip irrigation regimes in southern Xinjiang of China. Soil Tillage Res. 2022, 223, 105470. [Google Scholar] [CrossRef]
  34. Zhang, Y.; Ye, H.; Liu, R. Spatiotemporal variability of soil salinity and its driving factors in cultivated land in Xinjiang, China. Int. J. Agric. Biol. Eng. 2025, 18, 197–207. [Google Scholar] [CrossRef]
  35. Shen, Z.; Bai, Y.; Zheng, M.; Zhang, W.; Cao, B.; Ding, B.; Xiao, J.; Chai, Z. Spatial and Temporal Variations in Soil Salinity and Groundwater in the Downstream Yarkant River Irrigation District. Water 2026, 18, 11. [Google Scholar] [CrossRef]
  36. De Pascale, S.; Barbieri, G. Effects of soil salinity from long-term irrigation with saline-sodic water on yield and quality of winter vegetable crops. Sci. Hortic. 1995, 64, 145–157. [Google Scholar] [CrossRef]
  37. Chen, Y.; Lou, S.; Chen, X.; Yang, S. Effects of brackish water irrigation with different exogenous salt concentrations on the growth and rhizosphere salinity of Lycium barbarum. Sci. Rep. 2024, 14, 21554. [Google Scholar] [CrossRef]
  38. Yang, G.; Li, F.; Tian, L.; He, X.; Gao, Y.; Wang, Z.; Ren, F. Soil physicochemical properties and cotton yield under brackish water mulched drip irrigation. Soil Tillage Res. 2020, 199, 104592. [Google Scholar] [CrossRef]
  39. Ren, F.; Yang, G.; Li, W.; He, X.; Gao, Y.; Tian, L.; Li, F.; Wang, Z.; Liu, S. Yield-compatible salinity level for growing cotton (Gossypium hirsutum L.) under mulched drip irrigation using saline water. Agric. Water Manag. 2021, 250, 106859. [Google Scholar] [CrossRef]
  40. Poór, P.; Borbély, P.; Czékus, Z.; Takács, Z.; Ördög, A.; Popović, B.; Tari, I. Comparison of changes in water status and photosynthetic parameters in wild type and abscisic acid-deficient sitiens mutant of tomato (Solanum lycopersicum cv. Rheinlands Ruhm) exposed to sublethal and lethal salt stress. J. Plant Physiol. 2019, 232, 130–140. [Google Scholar] [CrossRef]
  41. Katerji, N.; Van Hoorn, J.W.; Hamdy, A.; Mastrorilli, M. Salt tolerance classification of crops according to soil salinity and to water stress day index. Agric. Water Manag. 2000, 43, 99–109. [Google Scholar] [CrossRef]
  42. Aslan, G.E.; Bastug, R.; Karaca, C.; Kurunc, A.; Buyuktas, D.; Navarro, A. Effects of saline irrigation water applications on evapotranspiration partitioning and crop coefficient of tomato grown in Mediterranean-type greenhouses. Agronomy 2024, 14, 1771. [Google Scholar] [CrossRef]
  43. Rodriguez, P.; Dell’Amico, J.; Morales, D.; Blanco, M.S.; Alarcón, J.J. Effects of salinity on growth, shoot water relations and root hydraulic conductivity in tomato plants. J. Agric. Sci. 1977, 128, 439–444. [Google Scholar] [CrossRef]
  44. Minhas, P.S.; Ramos, T.B.; Ben-Gal, A.; Pereira, L.S. Coping with salinity in irrigated agriculture: Crop evapotranspiration and water management issues. Agric. Water Manag. 2020, 227, 105832. [Google Scholar] [CrossRef]
  45. Dudley, L.M.; Ben-Gal, A.; Shani, U. Influence of plant, soil, and water on the leaching fraction. Vadose Zone J. 2008, 7, 420–425. [Google Scholar] [CrossRef]
  46. Katsoulas, N.; Stanghellini, C. Modelling crop transpiration in greenhouses: Different models for different applications. Agronomy 2019, 9, 392. [Google Scholar] [CrossRef]
  47. Jalali, V.; Kapourchal, S.A.; Homaee, M. Evaluating performance of macroscopic water uptake models at productive growth stages of durum wheat under saline conditions. Agric. Water Manag. 2017, 180, 13–21. [Google Scholar] [CrossRef]
Figure 1. Logic diagram of research methodology.
Agriculture 16 01050 g001
Figure 2. Effect drawing of pit test space layout/(cm).
Agriculture 16 01050 g002
Figure 3. Distribution of soil water in 0–100 cm soil layer under irrigation with different salinity sources in 2021 and 2022.
Agriculture 16 01050 g003
Figure 4. Distribution of soil salt in 0–100 cm under irrigation with different salinity sources in 2021 and 2022.
Agriculture 16 01050 g004
Figure 5. Distribution of soil salt in 0–100 cm soil layer under irrigation with different salinity sources in 2021 and 2022.
Agriculture 16 01050 g005
Figure 6. The potential transpiration TP at each soil depth ranging from 0 to 100 cm (with 20 cm as one layer) in 2021 and 2022.
Agriculture 16 01050 g006
Figure 7. (a) Composite water-salt stress factors (WS × SS) at various soil depths under different treatments in 2021. (b) Composite water-salt stress factors (WS × SS) at various soil depths under different treatments in 2022.
Agriculture 16 01050 g007
Figure 8. Comparison of the actual plant transpiration Ta simulated and measured at different stages of crops for CK, S1, S2 and S3.
Agriculture 16 01050 g008
Figure 9. Comparison between simulated and actual transpiration rate (Ta) for the 0–100 cm soil profile during calibration and validation periods.
Agriculture 16 01050 g009
Table 1. Soil physical properties in the experimental area.
Depth of Soil Layer (cm)Bulk Density (g·cm−3)Field Capacity (cm3·cm−3)Saturated Water Capacity (cm3·cm−3)Saturated Hydraulic Conductivity (cm·d−1)Particles Size Distribution (%)
SandSiltClay
0–201.620.260.3835.032.578.519.0
20–401.650.270.3728.141.675.023.4
40–601.680.280.3622.172.075.023.0
60–801.710.290.3518.191.574.823.7
80–1001.740.300.3415.222.676.720.7
Table 2. Differences and proportions between the actual transpiration (Ta) and potential transpiration (Tp) of sunflower throughout the growth period in 2021 and 2022.
Year20212022
TreatmentTa (mm)Tp (mm)Tp − Ta (mm)Ta/TpTa (mm)Tp (mm)Tp − Ta (mm)Ta/Tp
CK329.38487.38158.000.68297.16489.10191.940.61
S1332.03496.59164.560.67317.26517.77200.510.62
S2299.76469.53169.770.64268.62476.37207.750.56
S3253.50432.82179.320.59246.82469.95213.130.53
Table 3. Parameter results of the calibration and verification of the actual transpiration rate for each treatment.
YearGrowth StageTreatmenta (20 cm)b (40 cm)c (60 cm)d (80 cm)e (100 cm)
2021Pre-growth periodCK0.58580000
S10.68880000
S20.62580000
S30.60000000
Middle and late growth periodCK1.69220.50160.20370.302.200
S11.82220.50160.20370.301.2500
S21.92220.50160.40370.303.000
S31.91580.90160.40370.3003.000
2022Pre-growth periodCK0.67590000
S10.67580000
S20.75000000
S30.60000000
Middle and late growth periodCK1.60000.50160.20580.30001.3000
S11.60580.90160.30370.3001.1000
S21.80581.20160.90370.3001.3000
S31.84480.90160.5000.30001.2000
Note: a–e represent the layer-specific response coefficients of root water uptake to soil water and salinity conditions.
Table 4. Sensitivity analysis results of model parameters under different growth stages.
Growth StageParameterChange (%)R2RMSE (mm)NSE
Pre-growth
period
a+10%0.72 17.08 0.67
a−10%0.70 16.97 0.65
Middle and late
growth period
a+10%0.73 21.57 0.48
a−10%0.74 18.87 0.60
b+10%0.75 21.99 0.46
b−10%0.76 20.50 0.53
c+10%0.76 21.34 0.49
c−10%0.76 21.18 0.50
d+10%0.76 21.29 0.49
d−10%0.76 21.10 0.50
e+10%0.79 22.10 0.45
e−10%0.75 20.30 0.56
Note: a–e represent the layer-specific response coefficients of root water uptake to soil water and salinity conditions.
Table 5. Calibrated parameter sets obtained from the leave-one-treatment-out validation during different growth stages.
Growth StageLeft-Out
Treatment
abcde
Pre-growth periodCK0.74130000
S10.76270000
S20.79690000
S30.69940000
Middle and late growth periodCK1.85630.92220.45210.33002.100
S11.8100 0.70000.41150.25002.500
S21.82880.73160.33410.26001.600
S31.80990.80130.2000 0.28003.000
Note: a–e represent the layer-specific response coefficients of root water uptake to soil water and salinity conditions.
Table 6. Validation performance of the leave-one-treatment-out approach over the whole growth period.
Left-Out TreatmentR2RMSE (mm)NSE
CK0.9313.870.86
S10.98 17.80 0.68
S20.58 23.86 0.33
S30.97 17.78 0.75
Disclaimer/Publisher’s Note: The statements, opinions and data contained in all publications are solely those of the individual author(s) and contributor(s) and not of MDPI and/or the editor(s). MDPI and/or the editor(s) disclaim responsibility for any injury to people or property resulting from any ideas, methods, instructions or products referred to in the content.