Biofuels and the Future of Food: Competition and Complementarities

Abstract
:1. Introduction
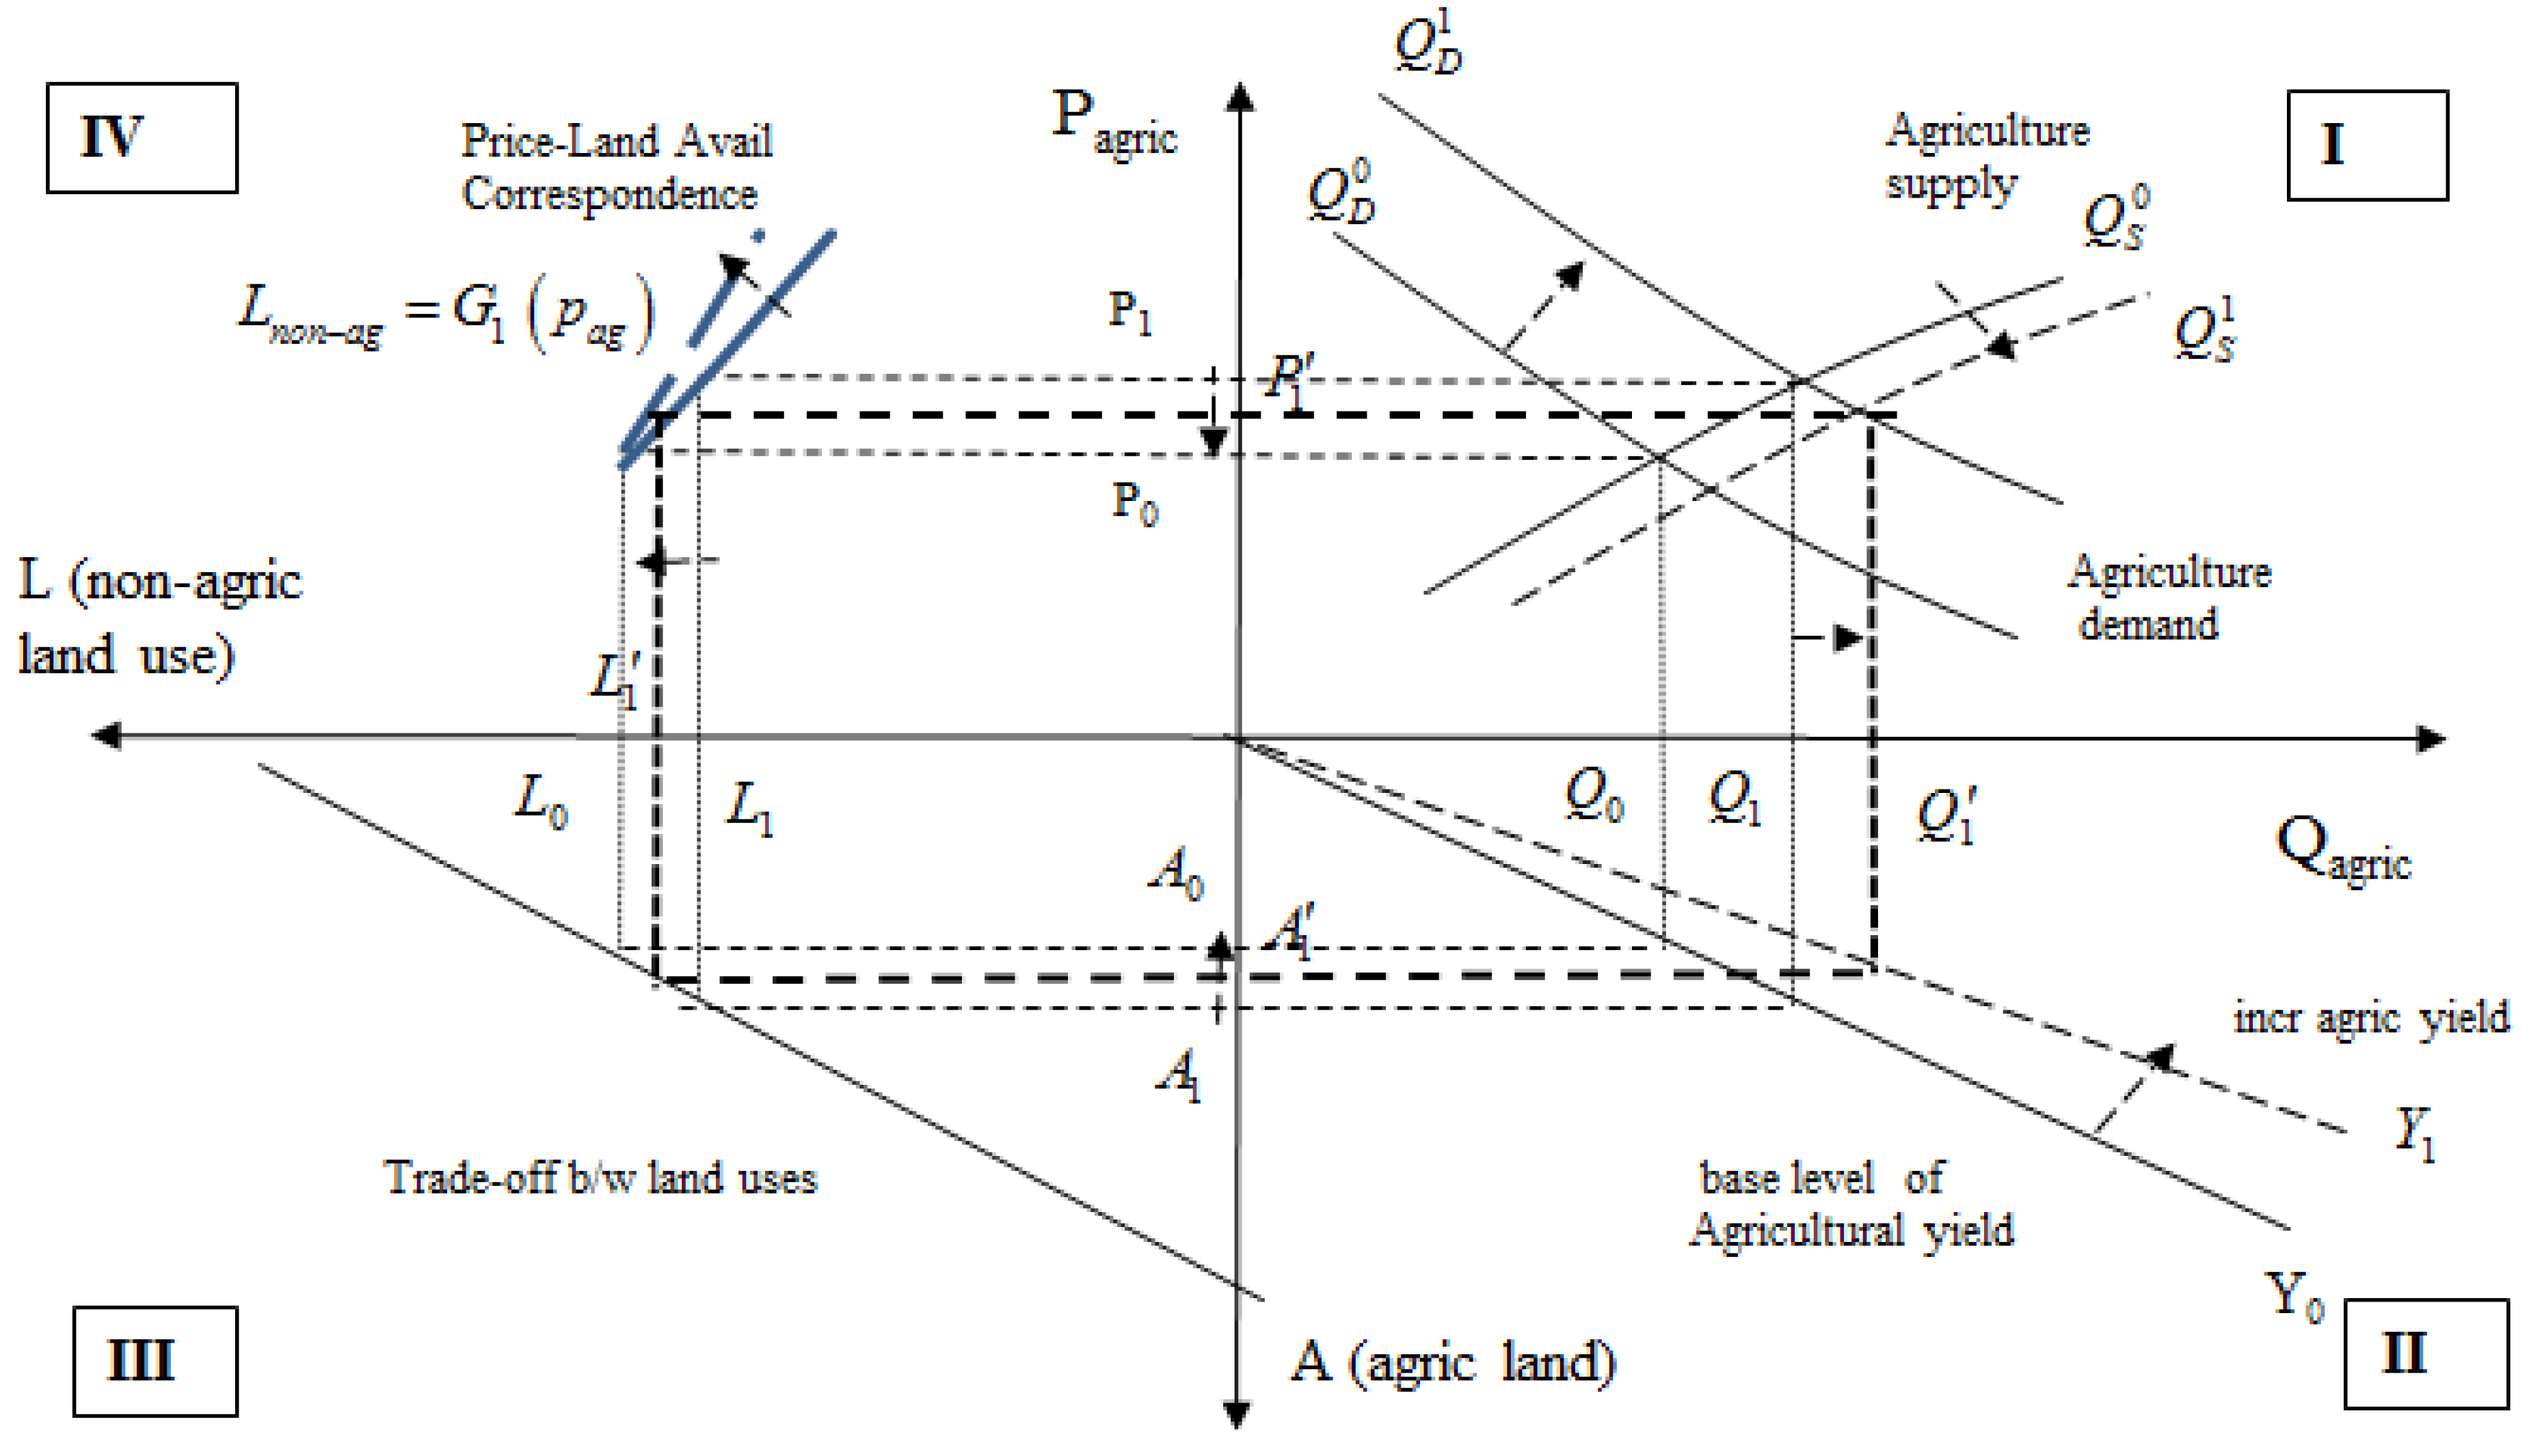
2. Conceptual Linkage of Agricultural Markets to the Environment
 to
to  —causes the price of the good to rise from P0to P1, holding the supply curve fixed (which may be the case in the short-run). The increase demand for the agricultural good, and the increased level of production needed to meet it, causes the agricultural land usage to expand from A0 to A1, for a given level of yield (i.e., productivity per unit area) at y0. This increase in agricultural land usage decreases the area available for other land uses, and shifts that quantity from L0 to L1. Therefore, we can draw a correspondence between the price of the agricultural good and the availability of land for non-agricultural uses as the line
  , which depicts a functional relationship such as Lnon-ag = G0(pag).
 to
to  and the price levels would be reduced from P1 to
  . This resulting shift in yield and production, would lead to a new level of agricultural land usage at
  , which is lower than before (A1), and which entails a higher level of land availability for non-agricultural uses (
  ). By following the correspondence between prices and non-agricultural land availability in this updated case, we would obtain a new correspondence
  , whose slope suggests that the decrease in the availability of land for non-agricultural uses is less for the same increase in prices, compared to the previous case with .
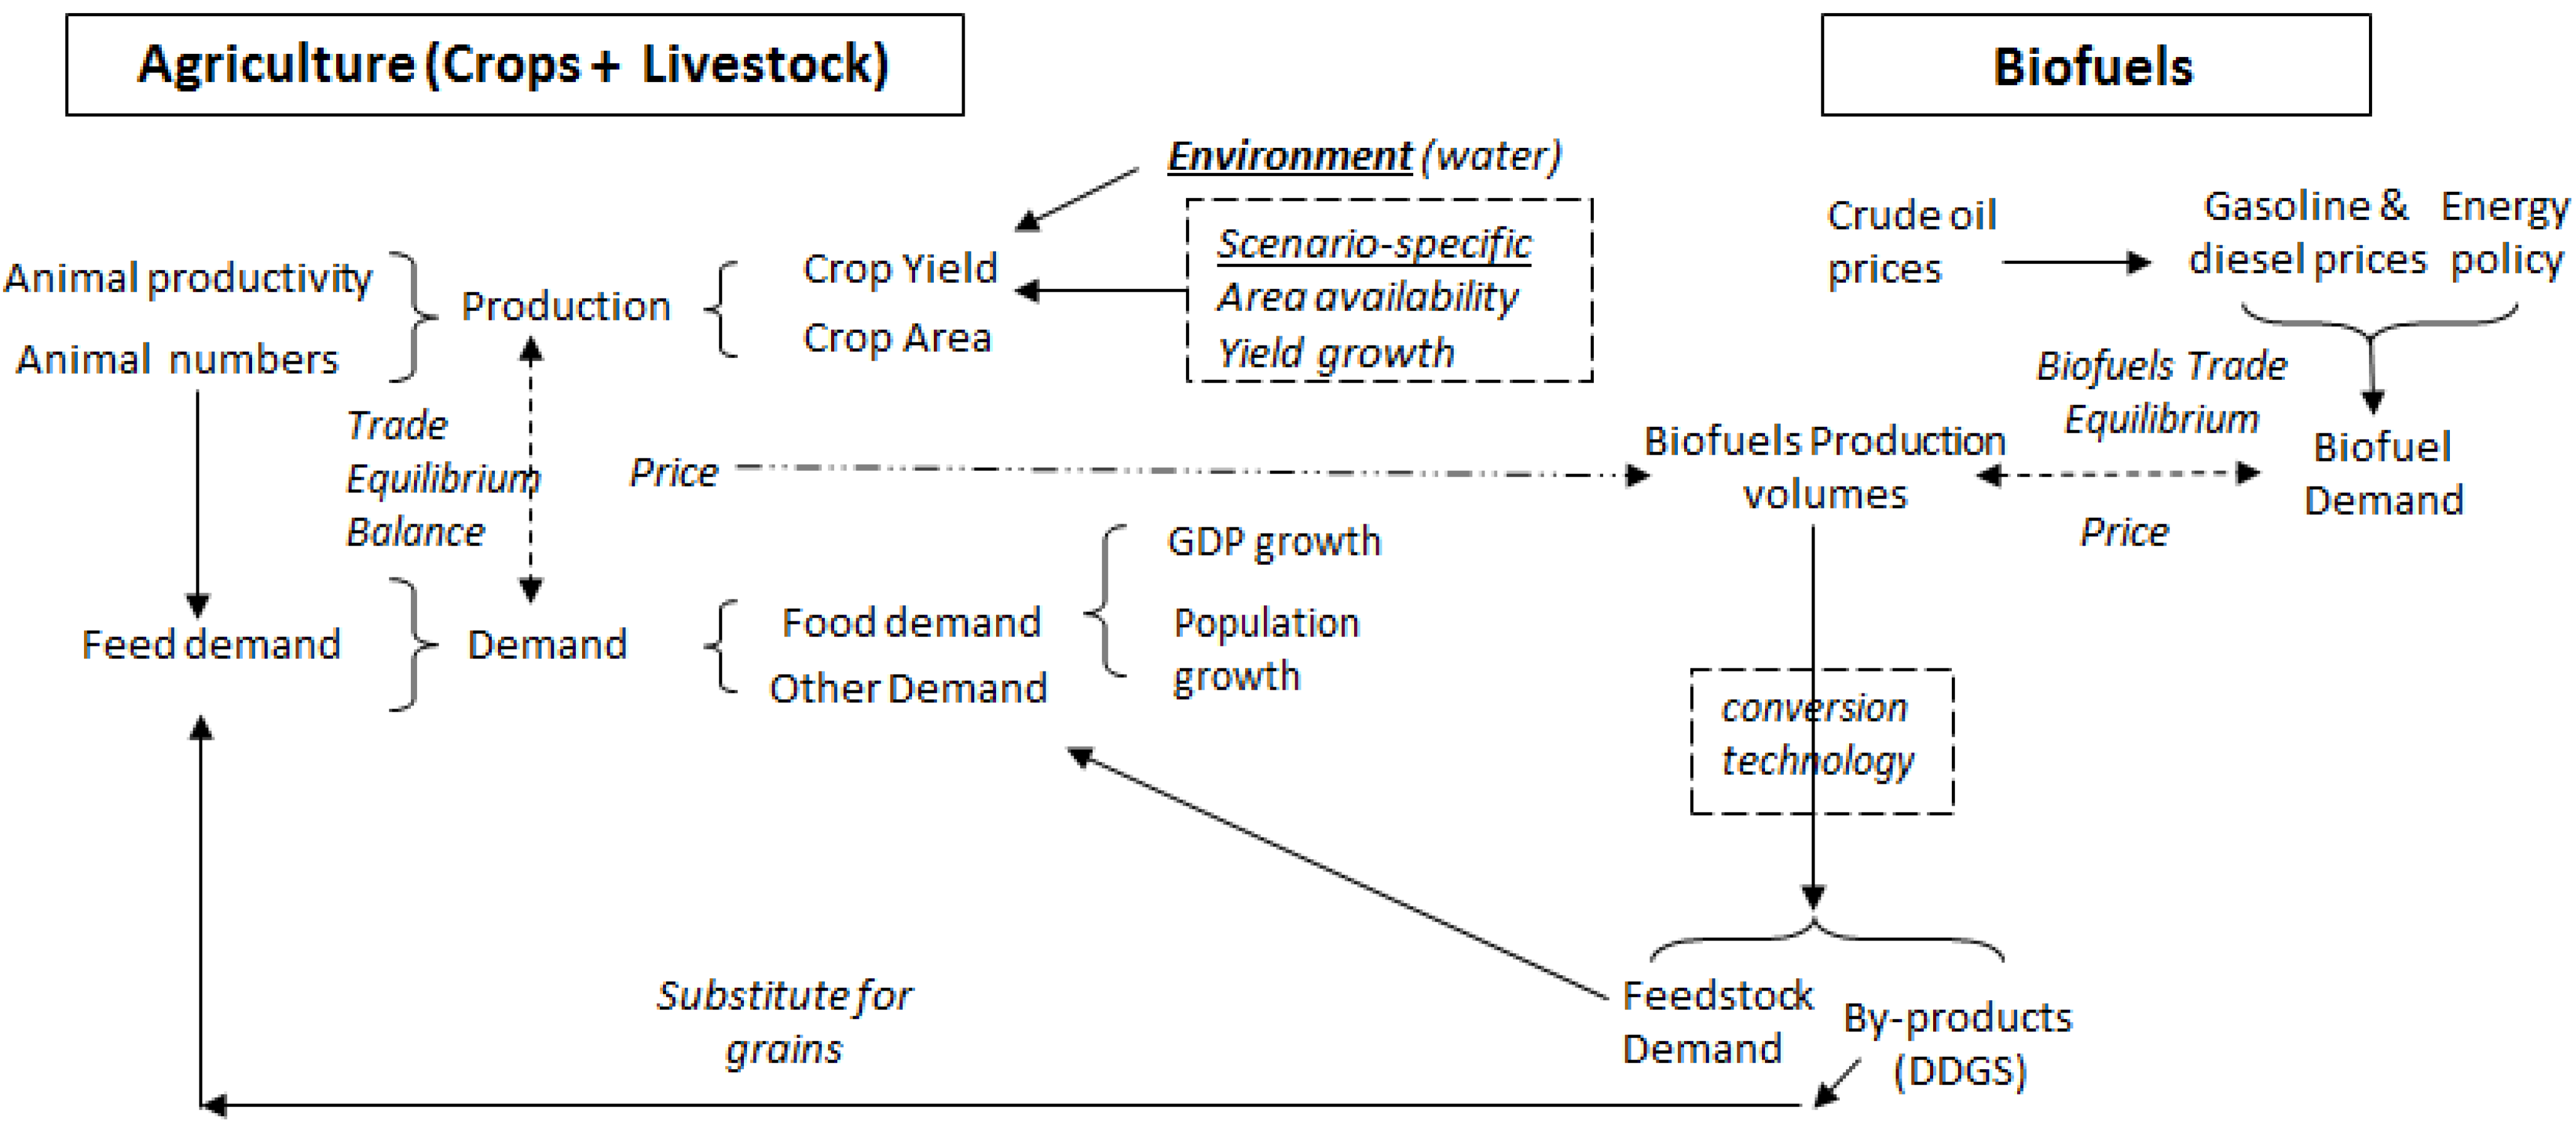
3. Modeling Biofuels-Agriculture Linkages
3.1. The Basic IMPACT Model
3.2. Modeling Biofuels Markets and Their Linkage to Agriculture
 ) in the conceptual model discussed earlier, and is also influenced by the price of the agricultural feedstock crop as well as of the biofuel product itself. In the model both area and yield respond to higher prices, which gives the adjustment along the extensive and intensive margins of production that was discussed within the conceptual framework.
4. Baseline and Key Scenarios for Biofuels
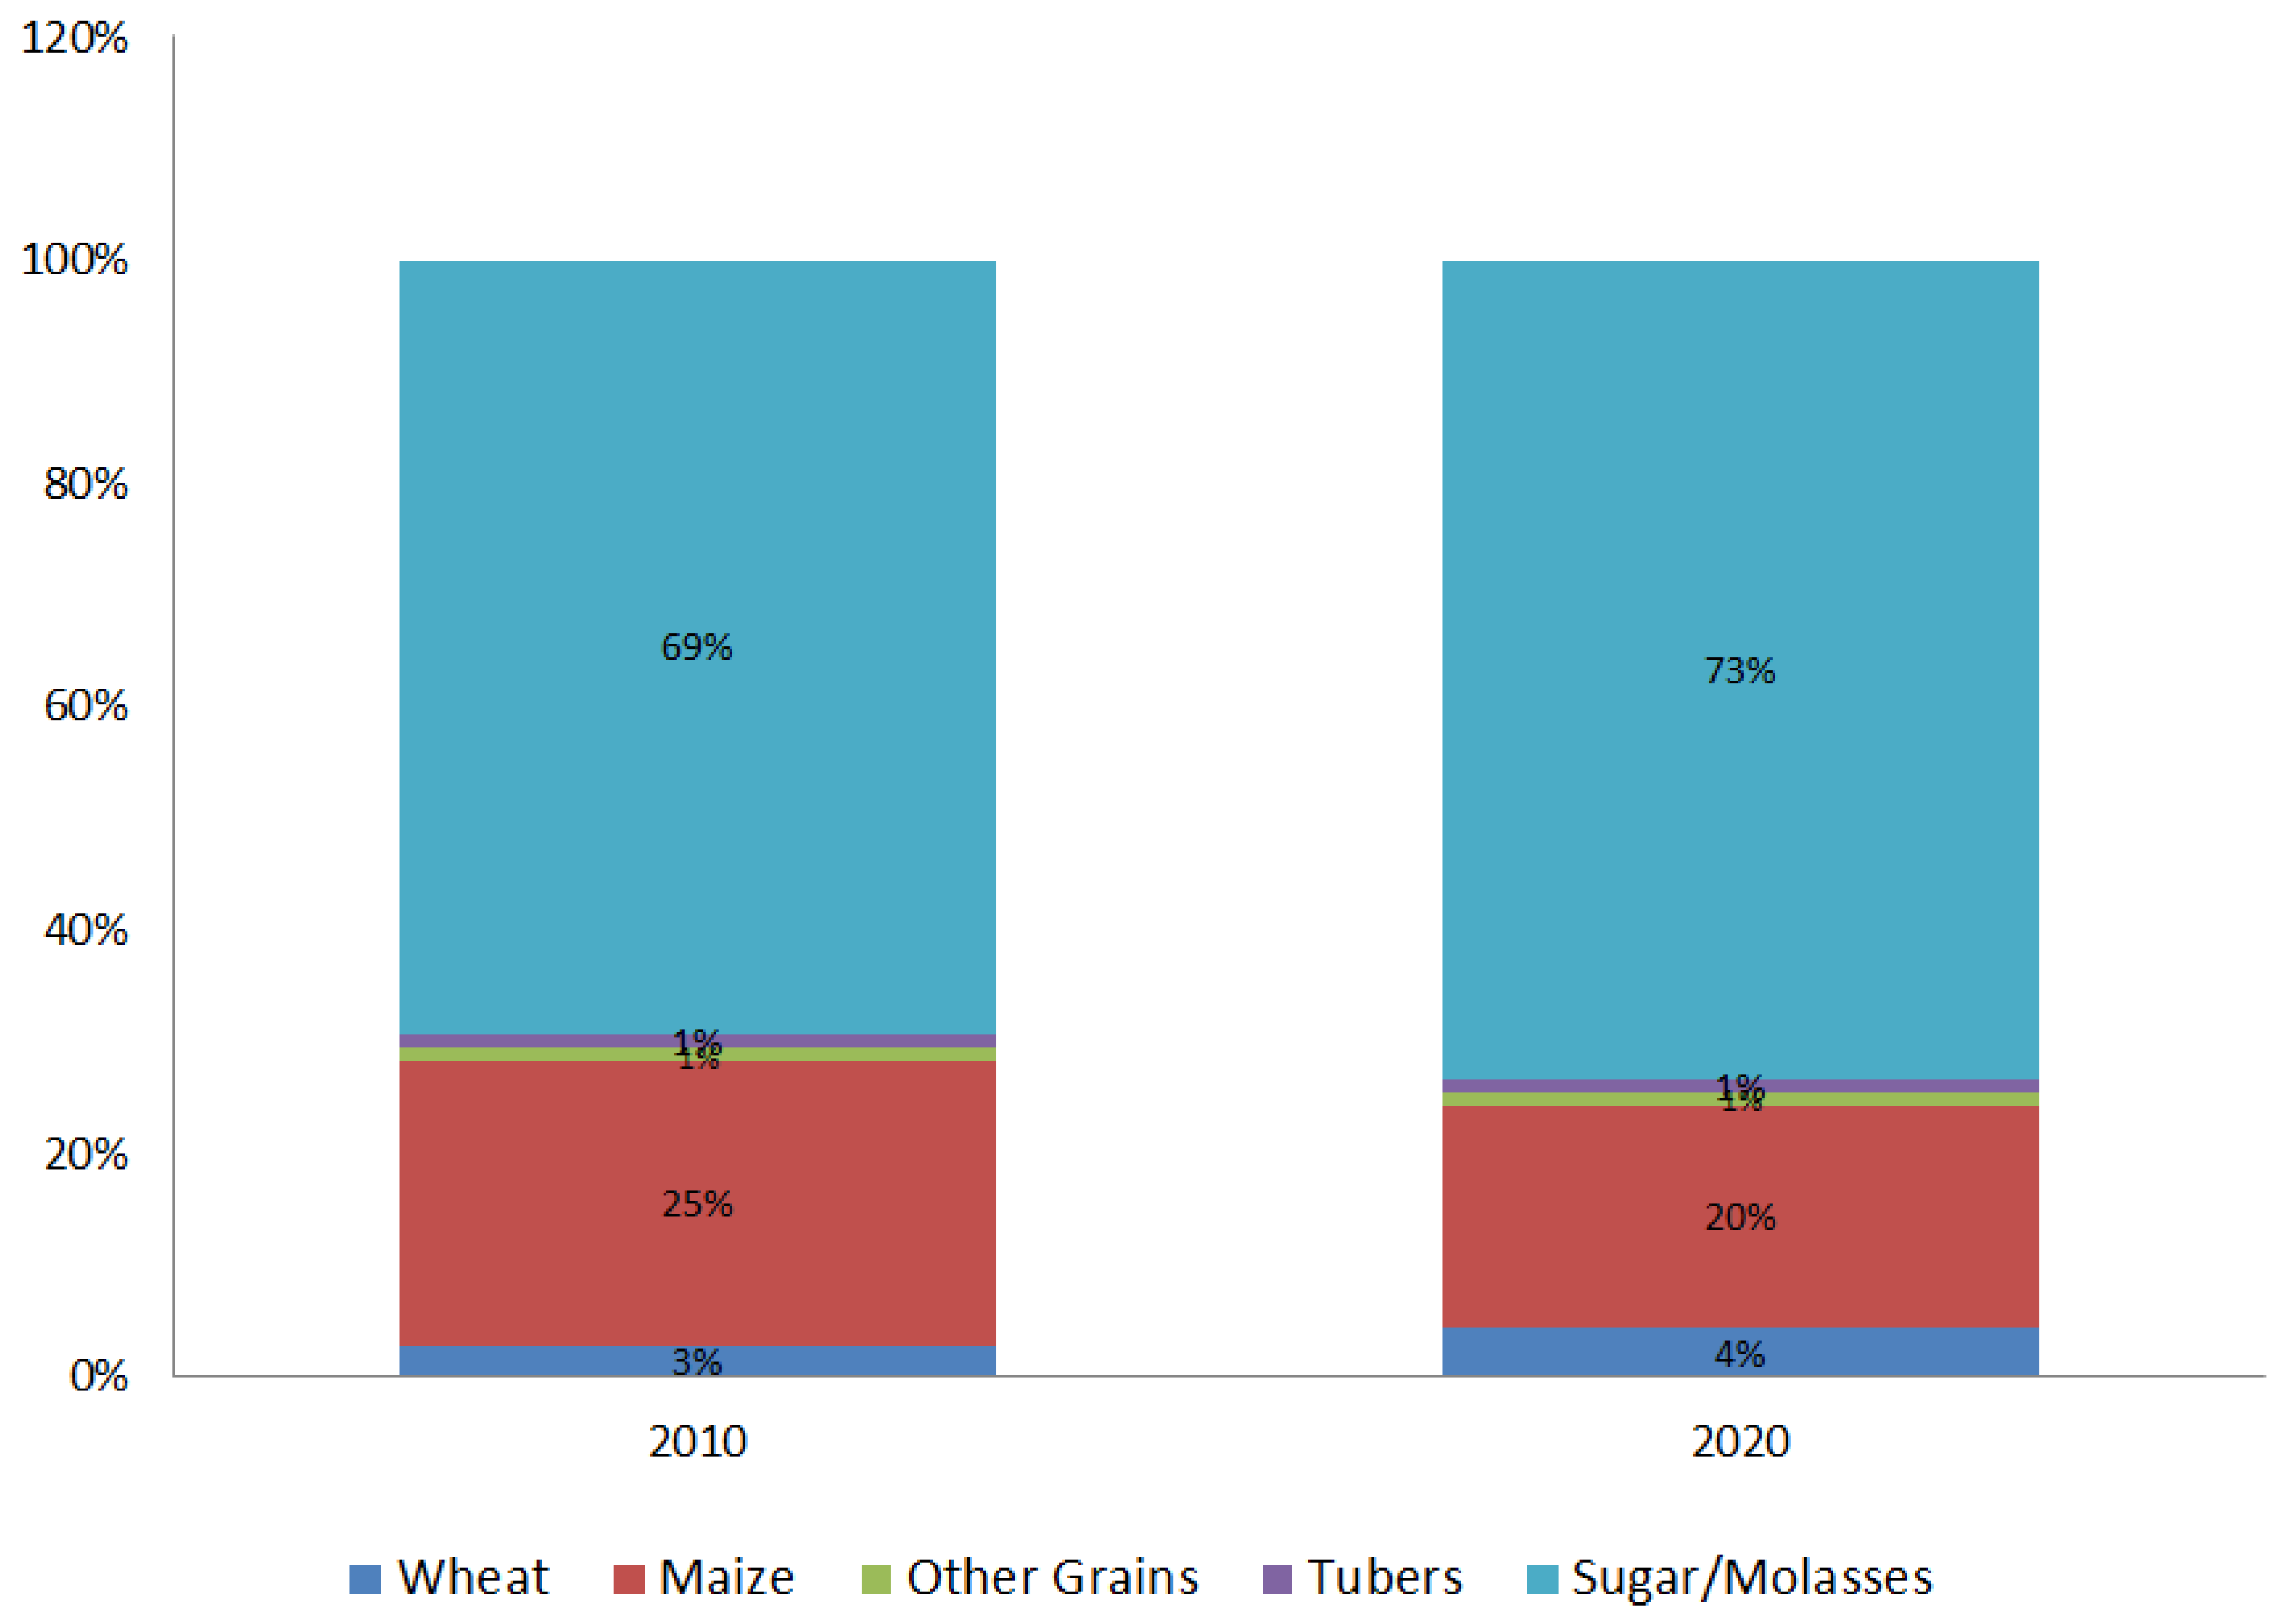
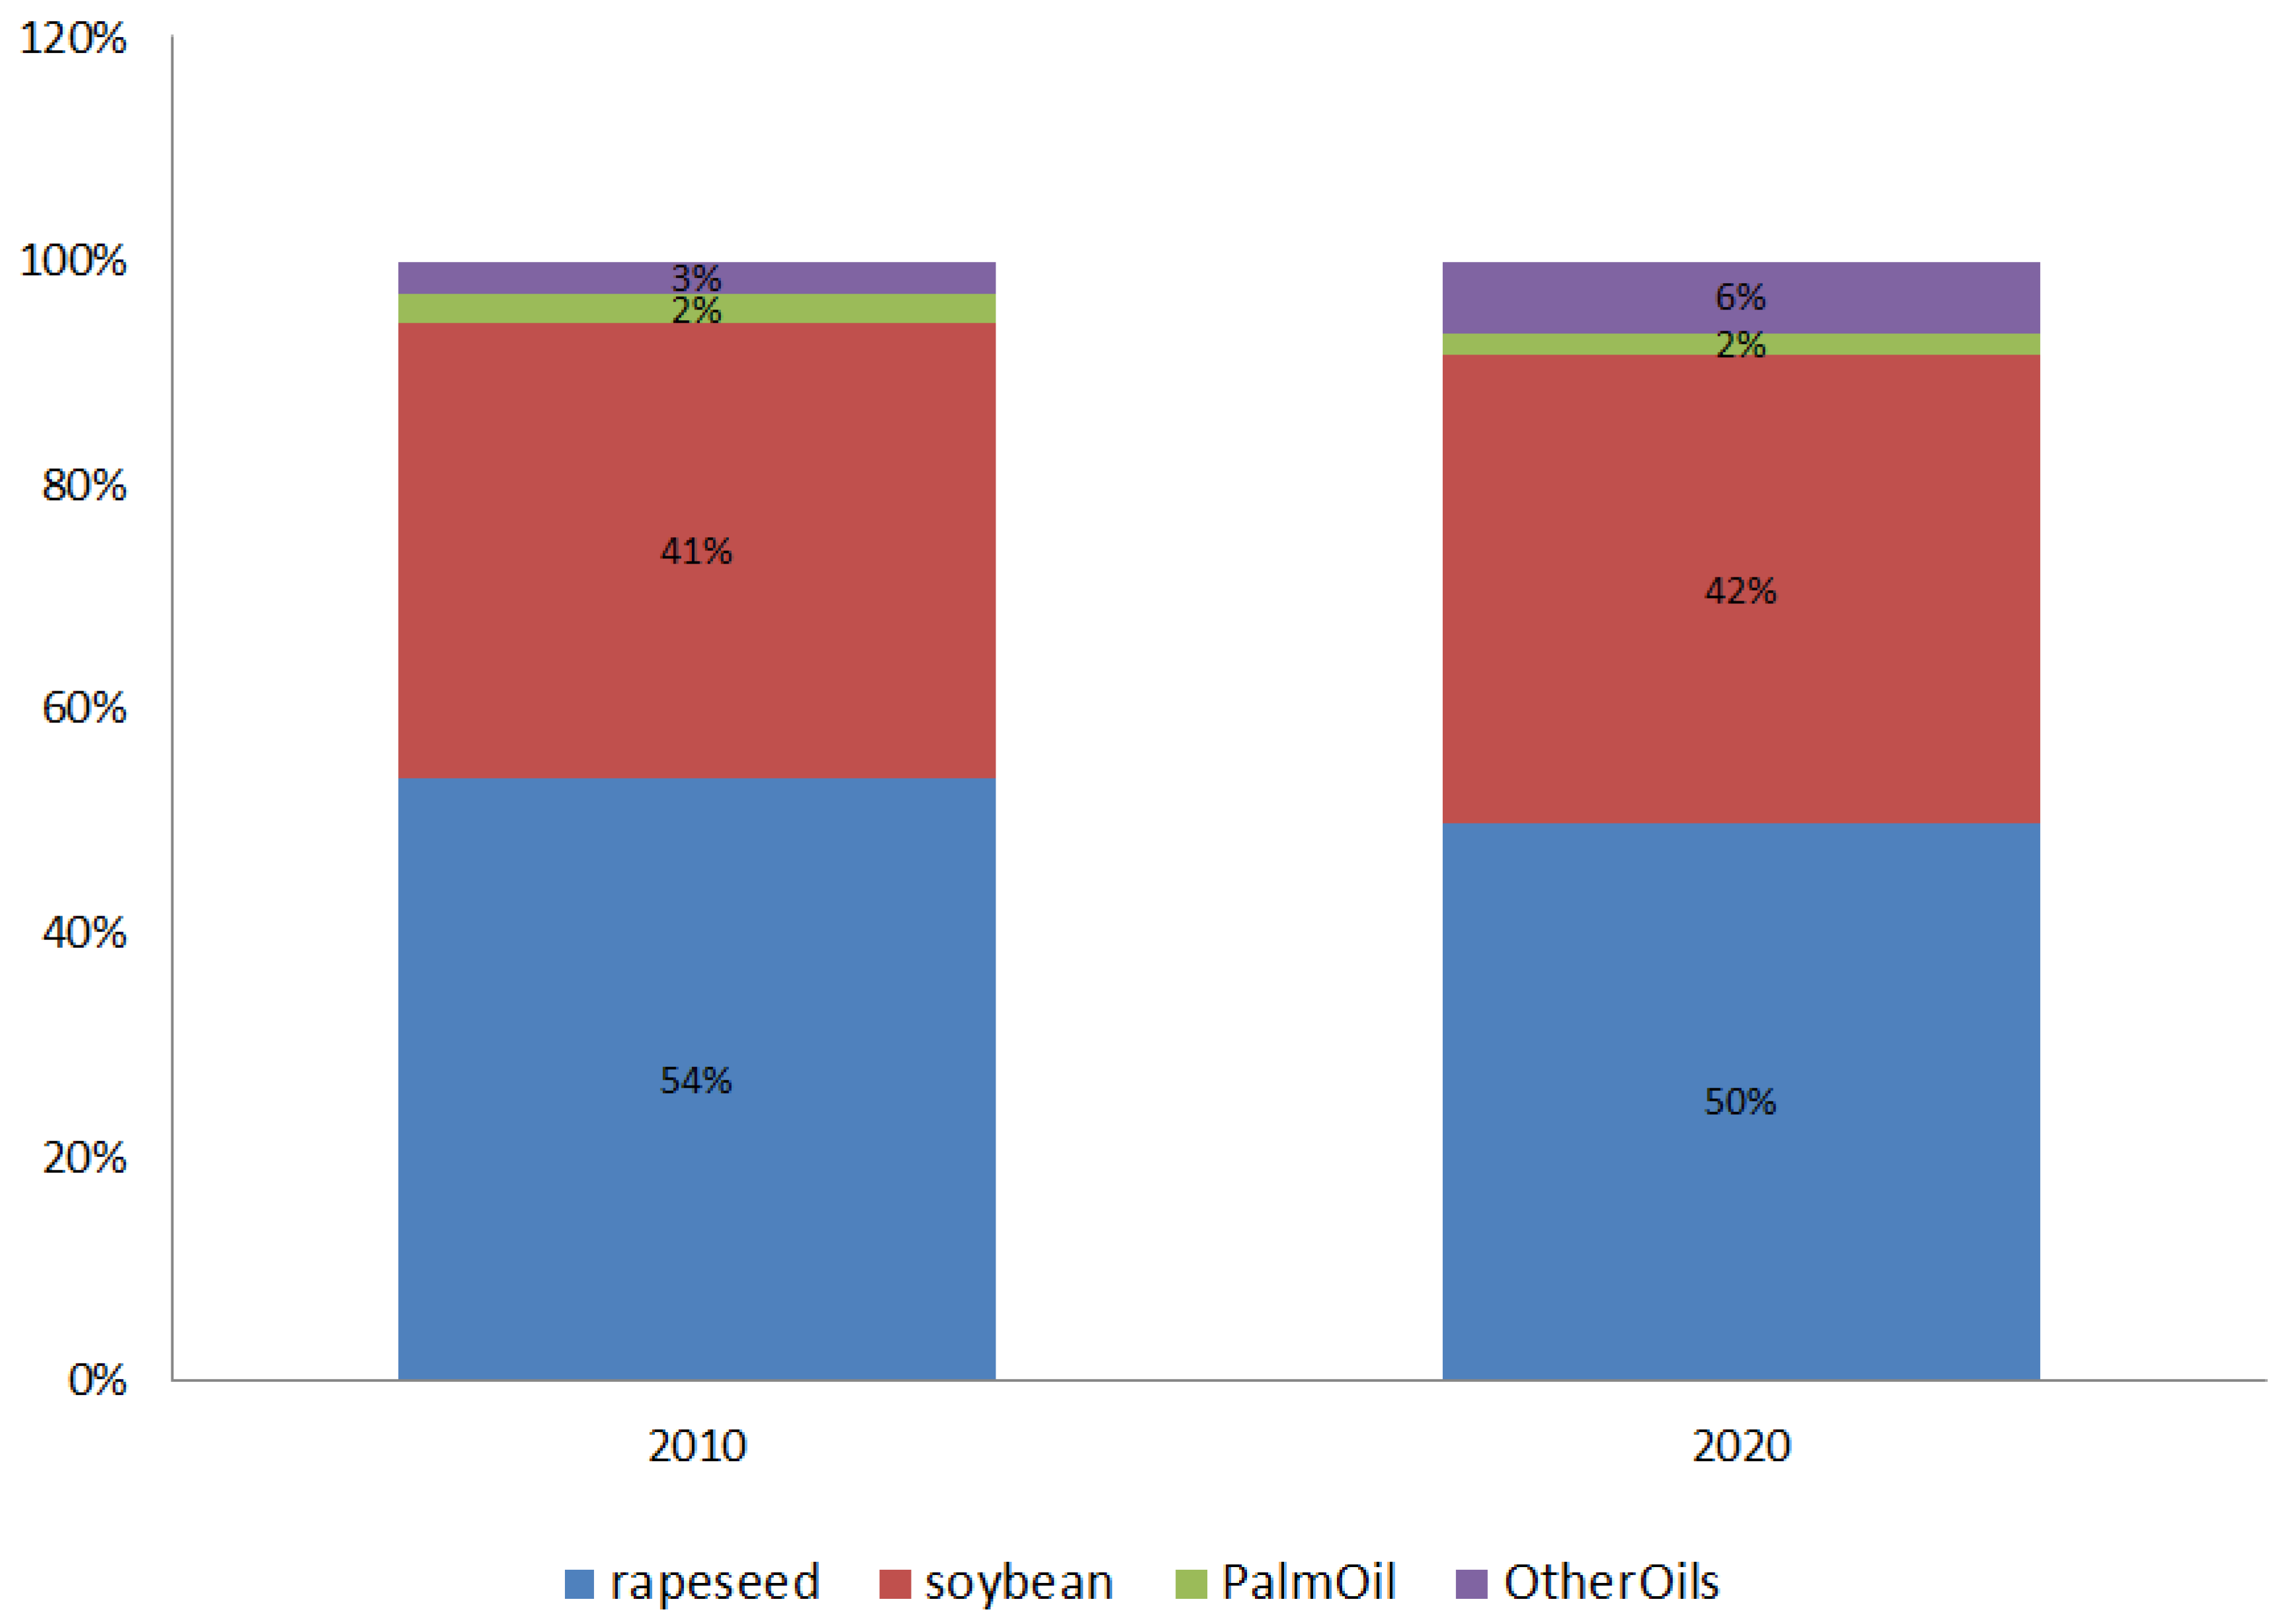
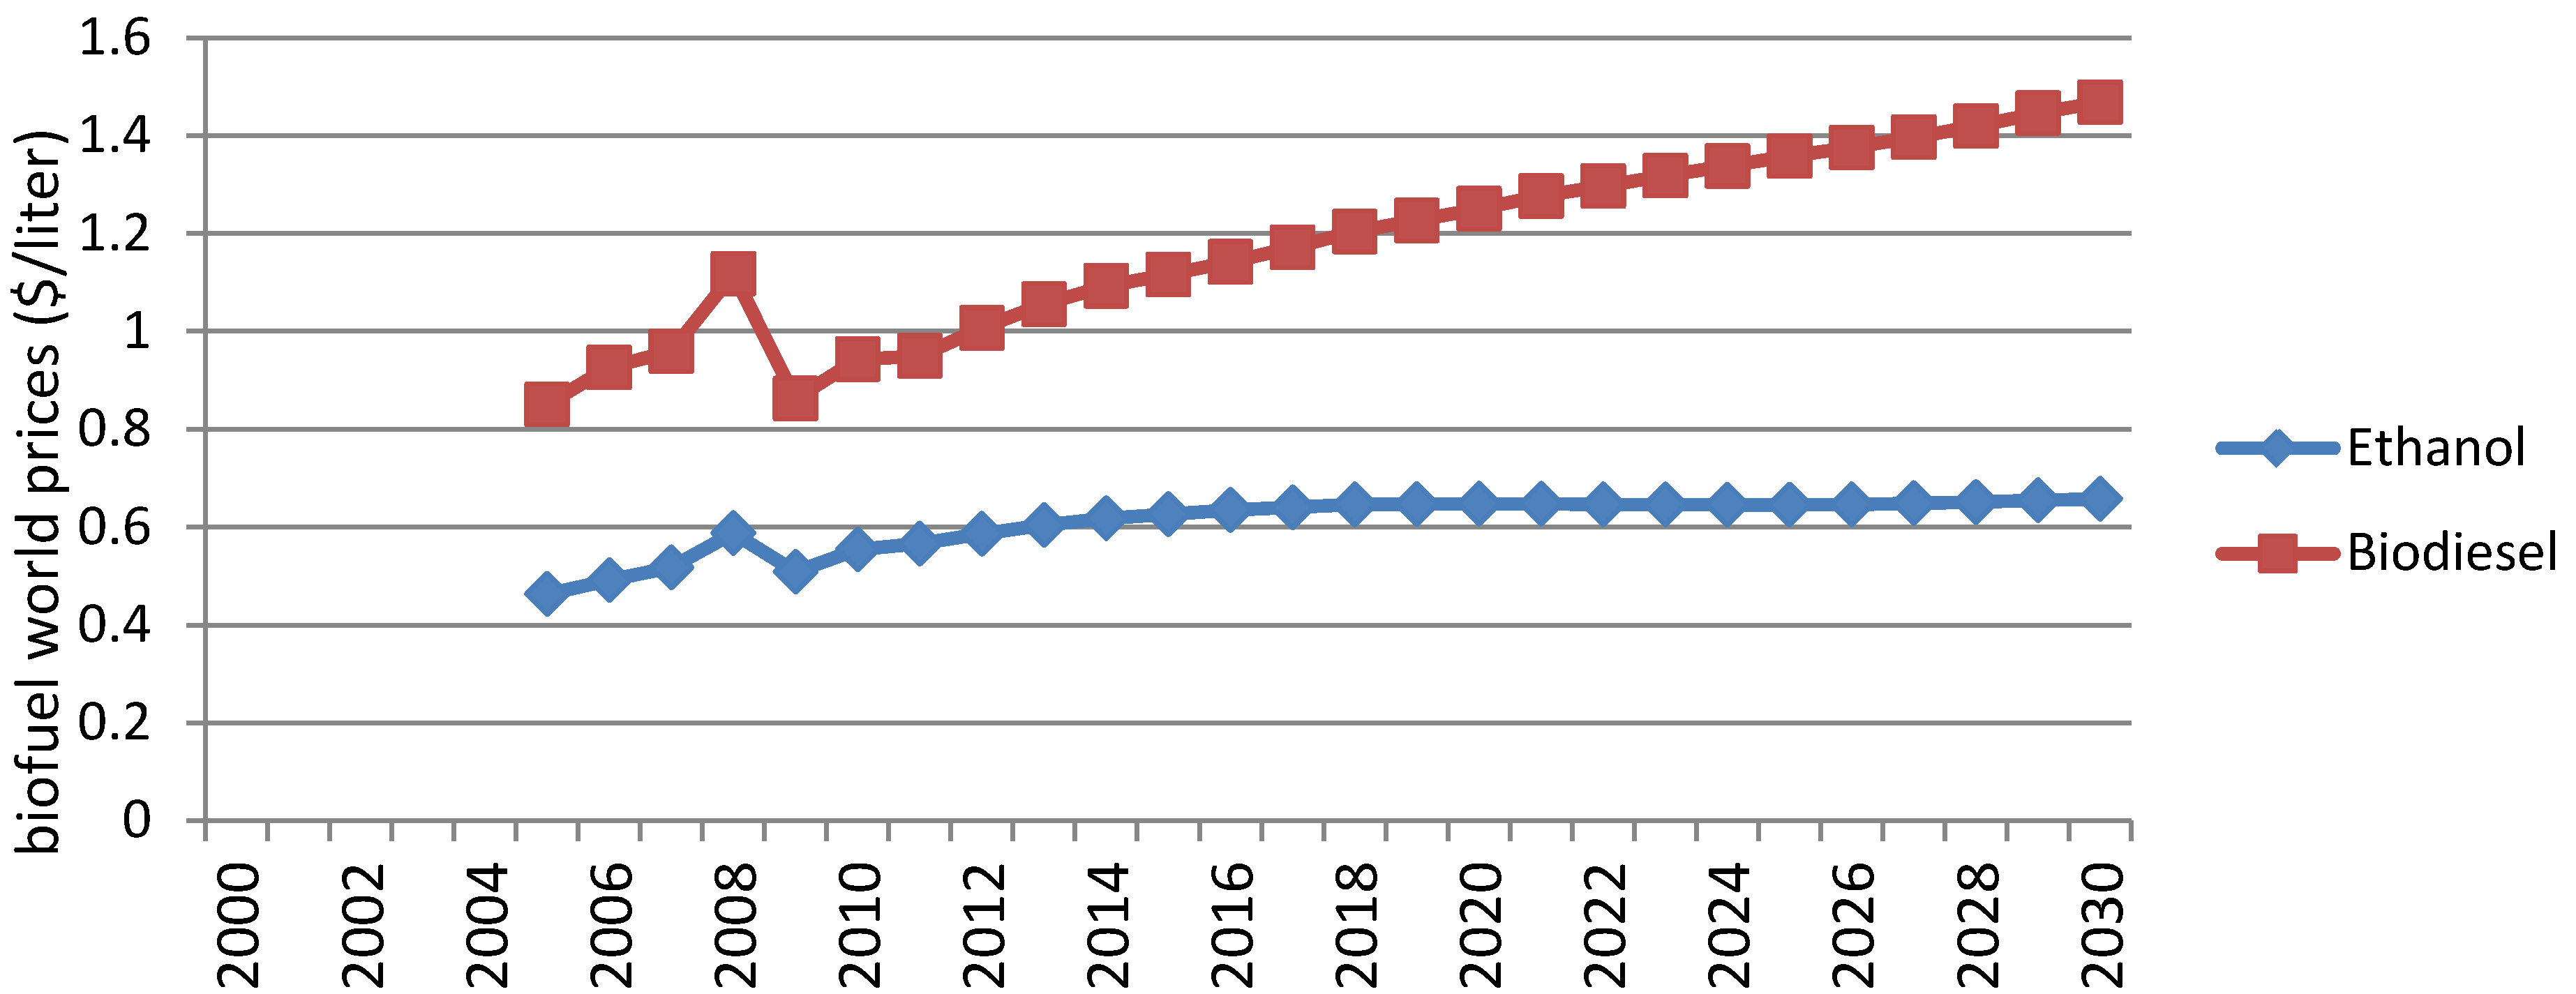
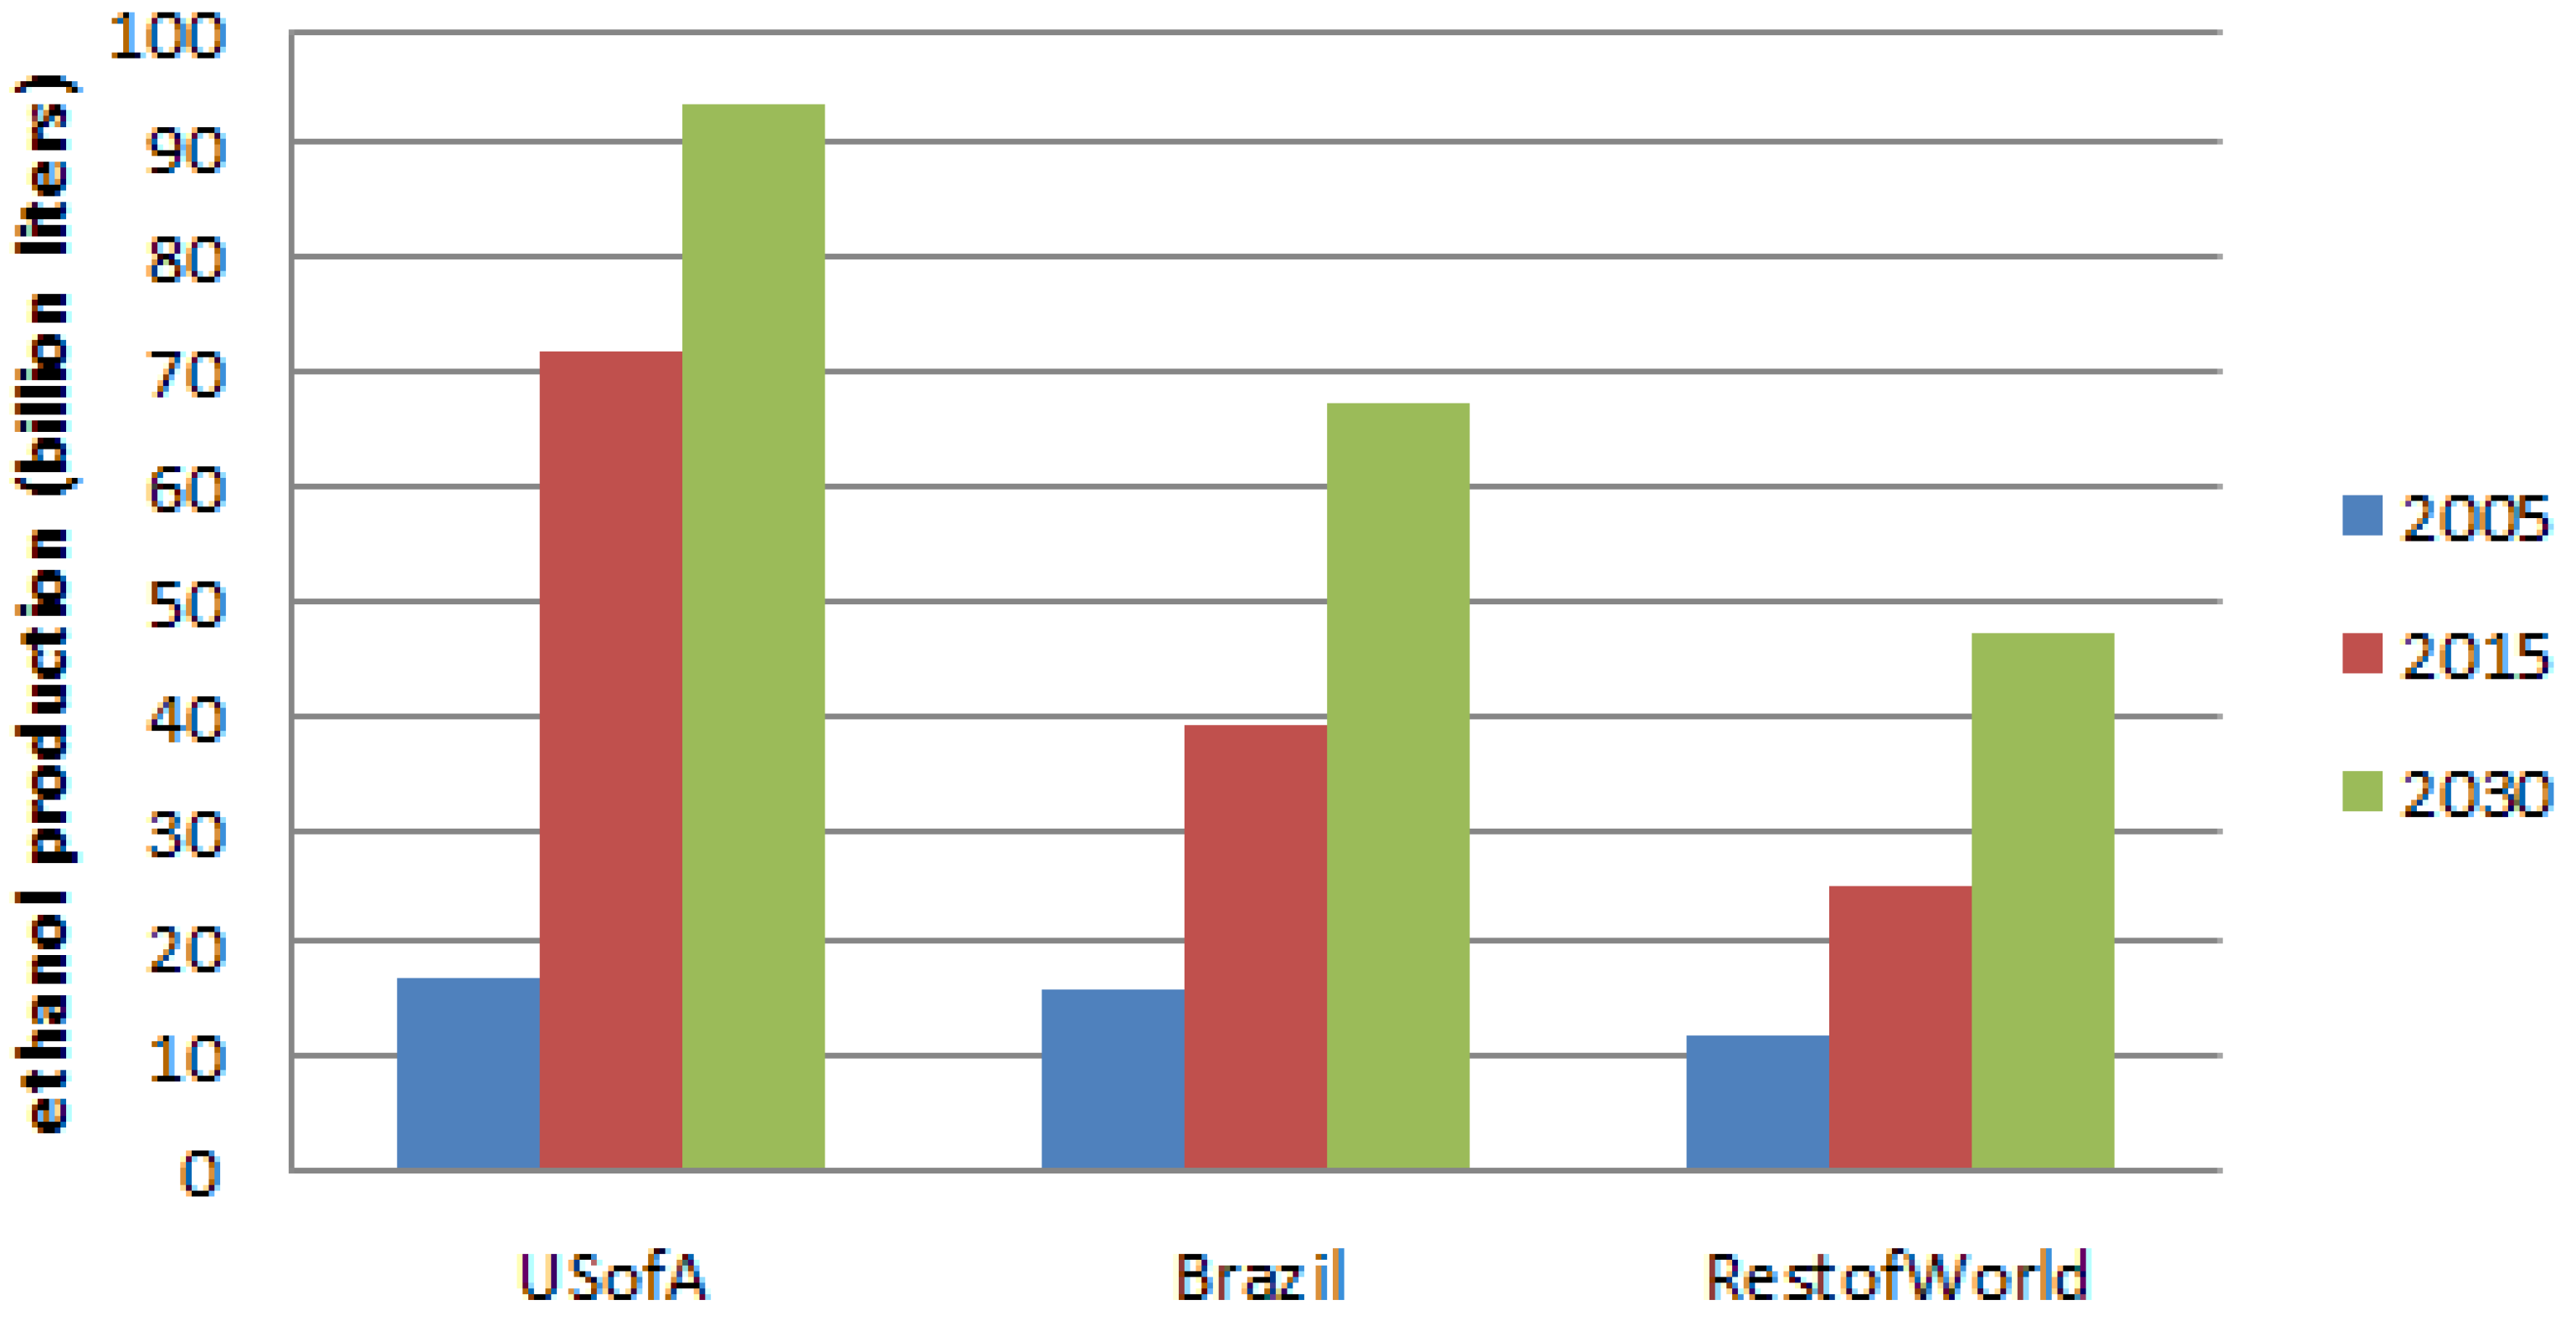
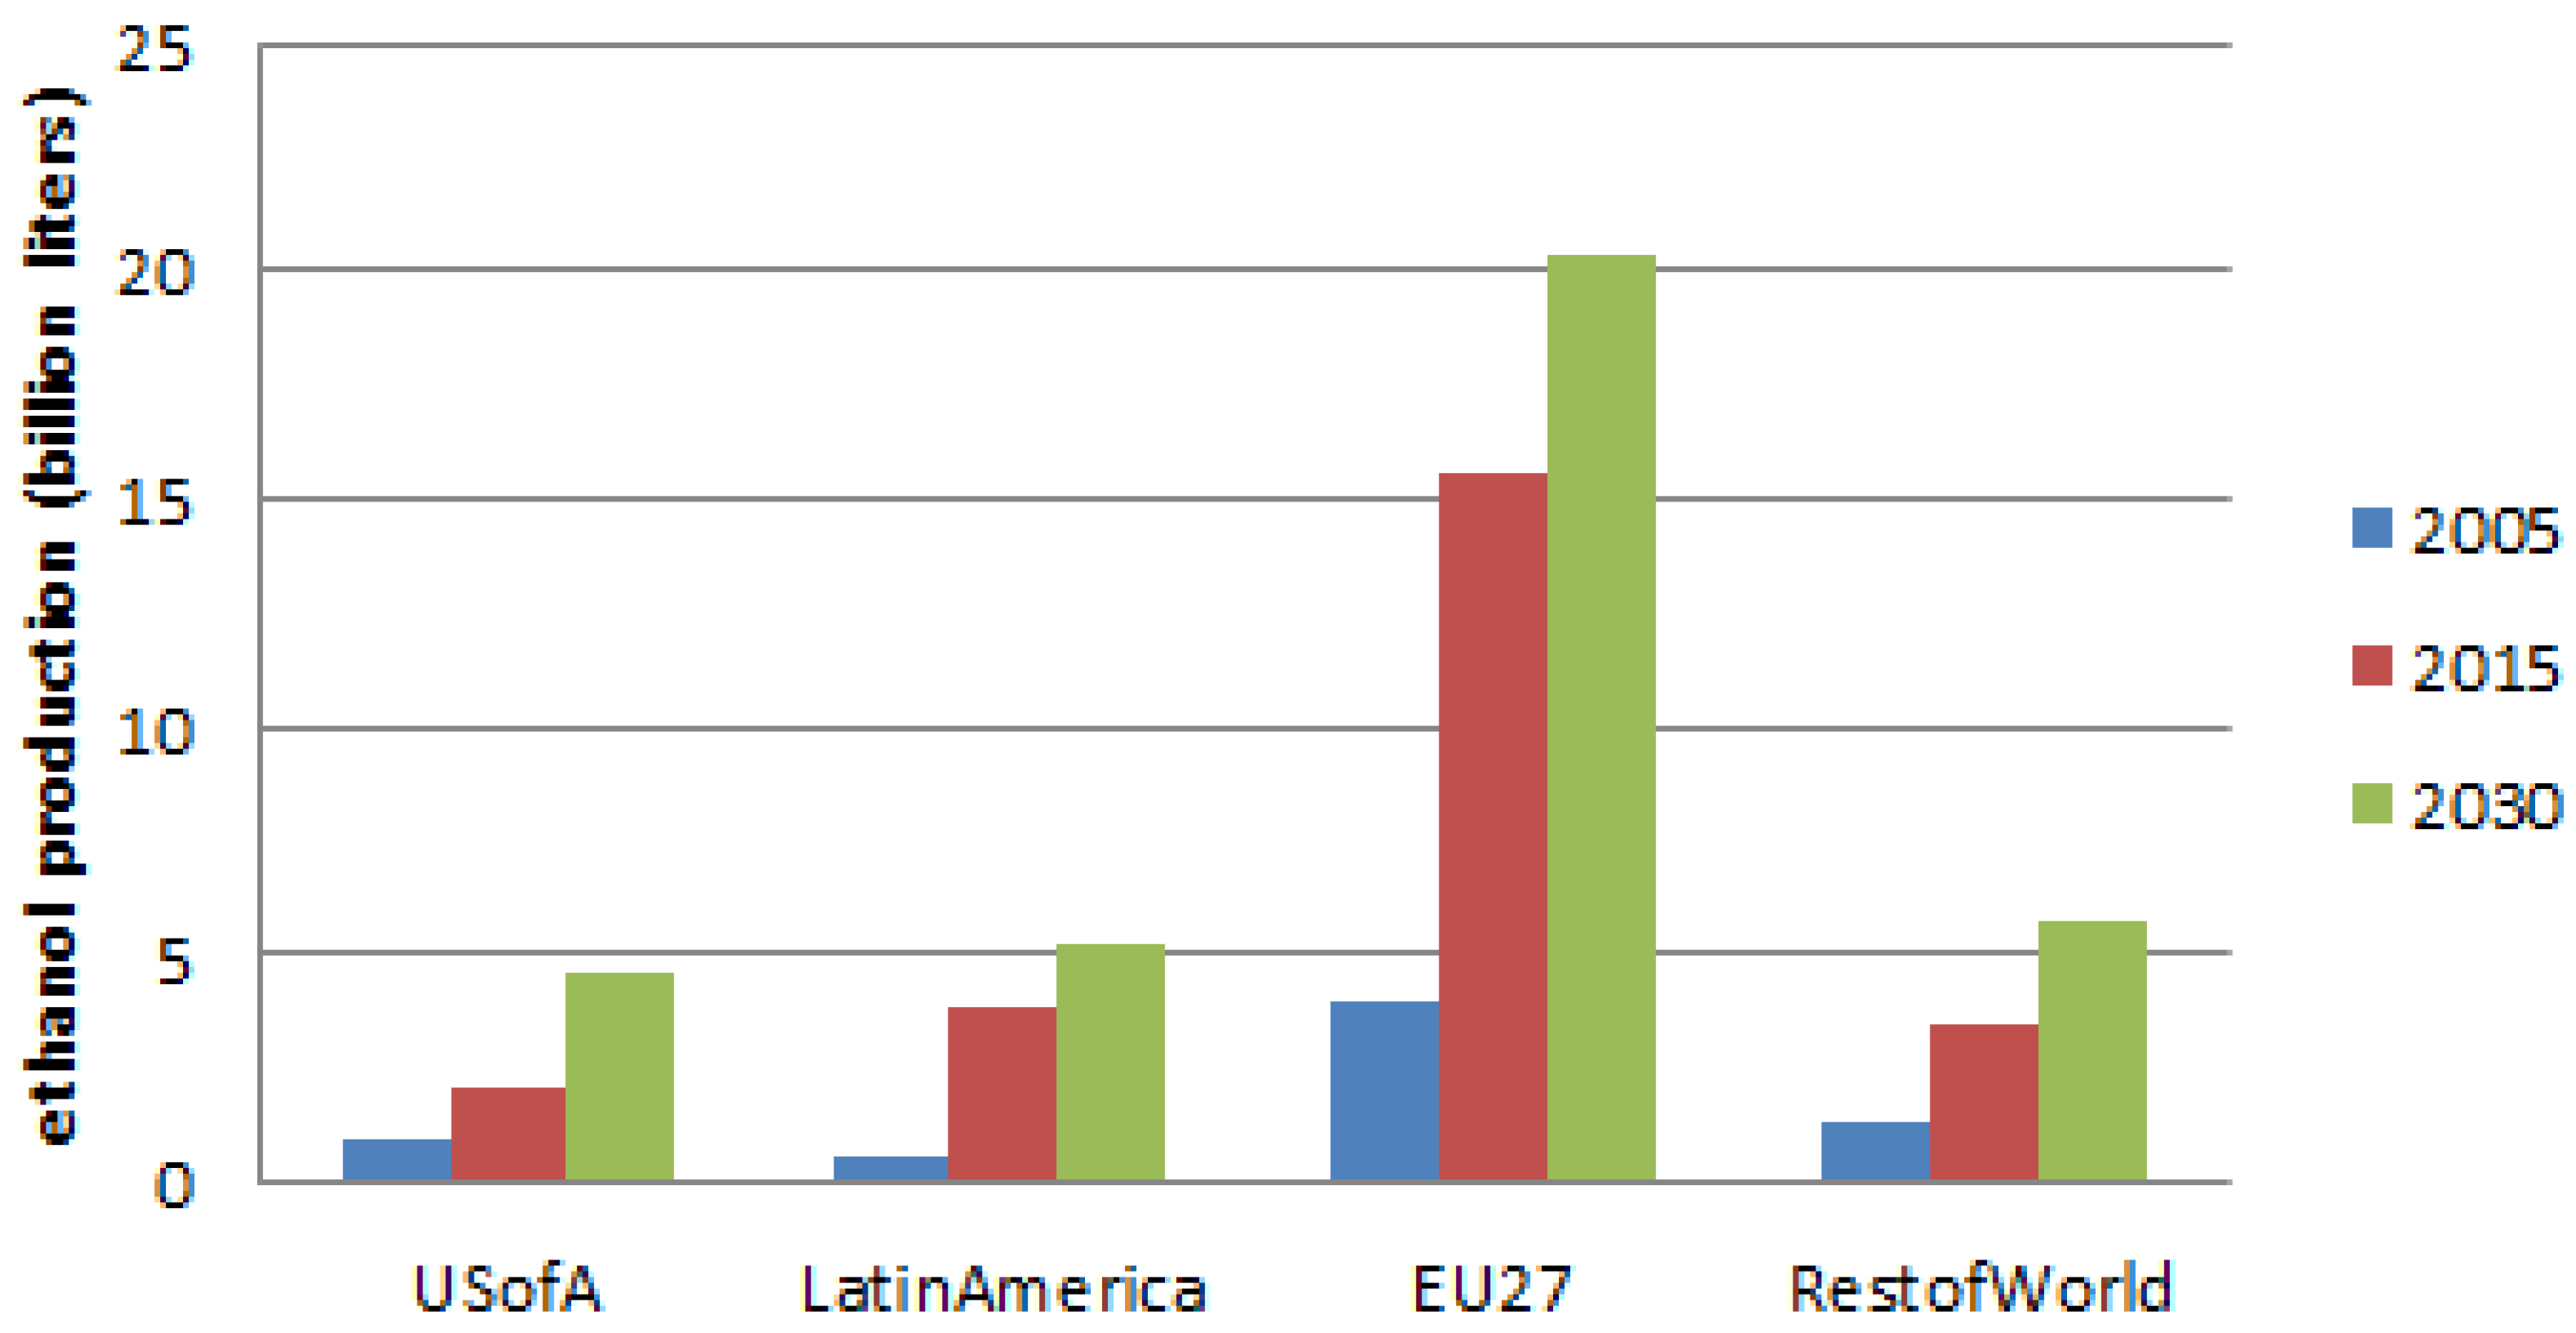
4.1. Baseline Projections with Biofuels


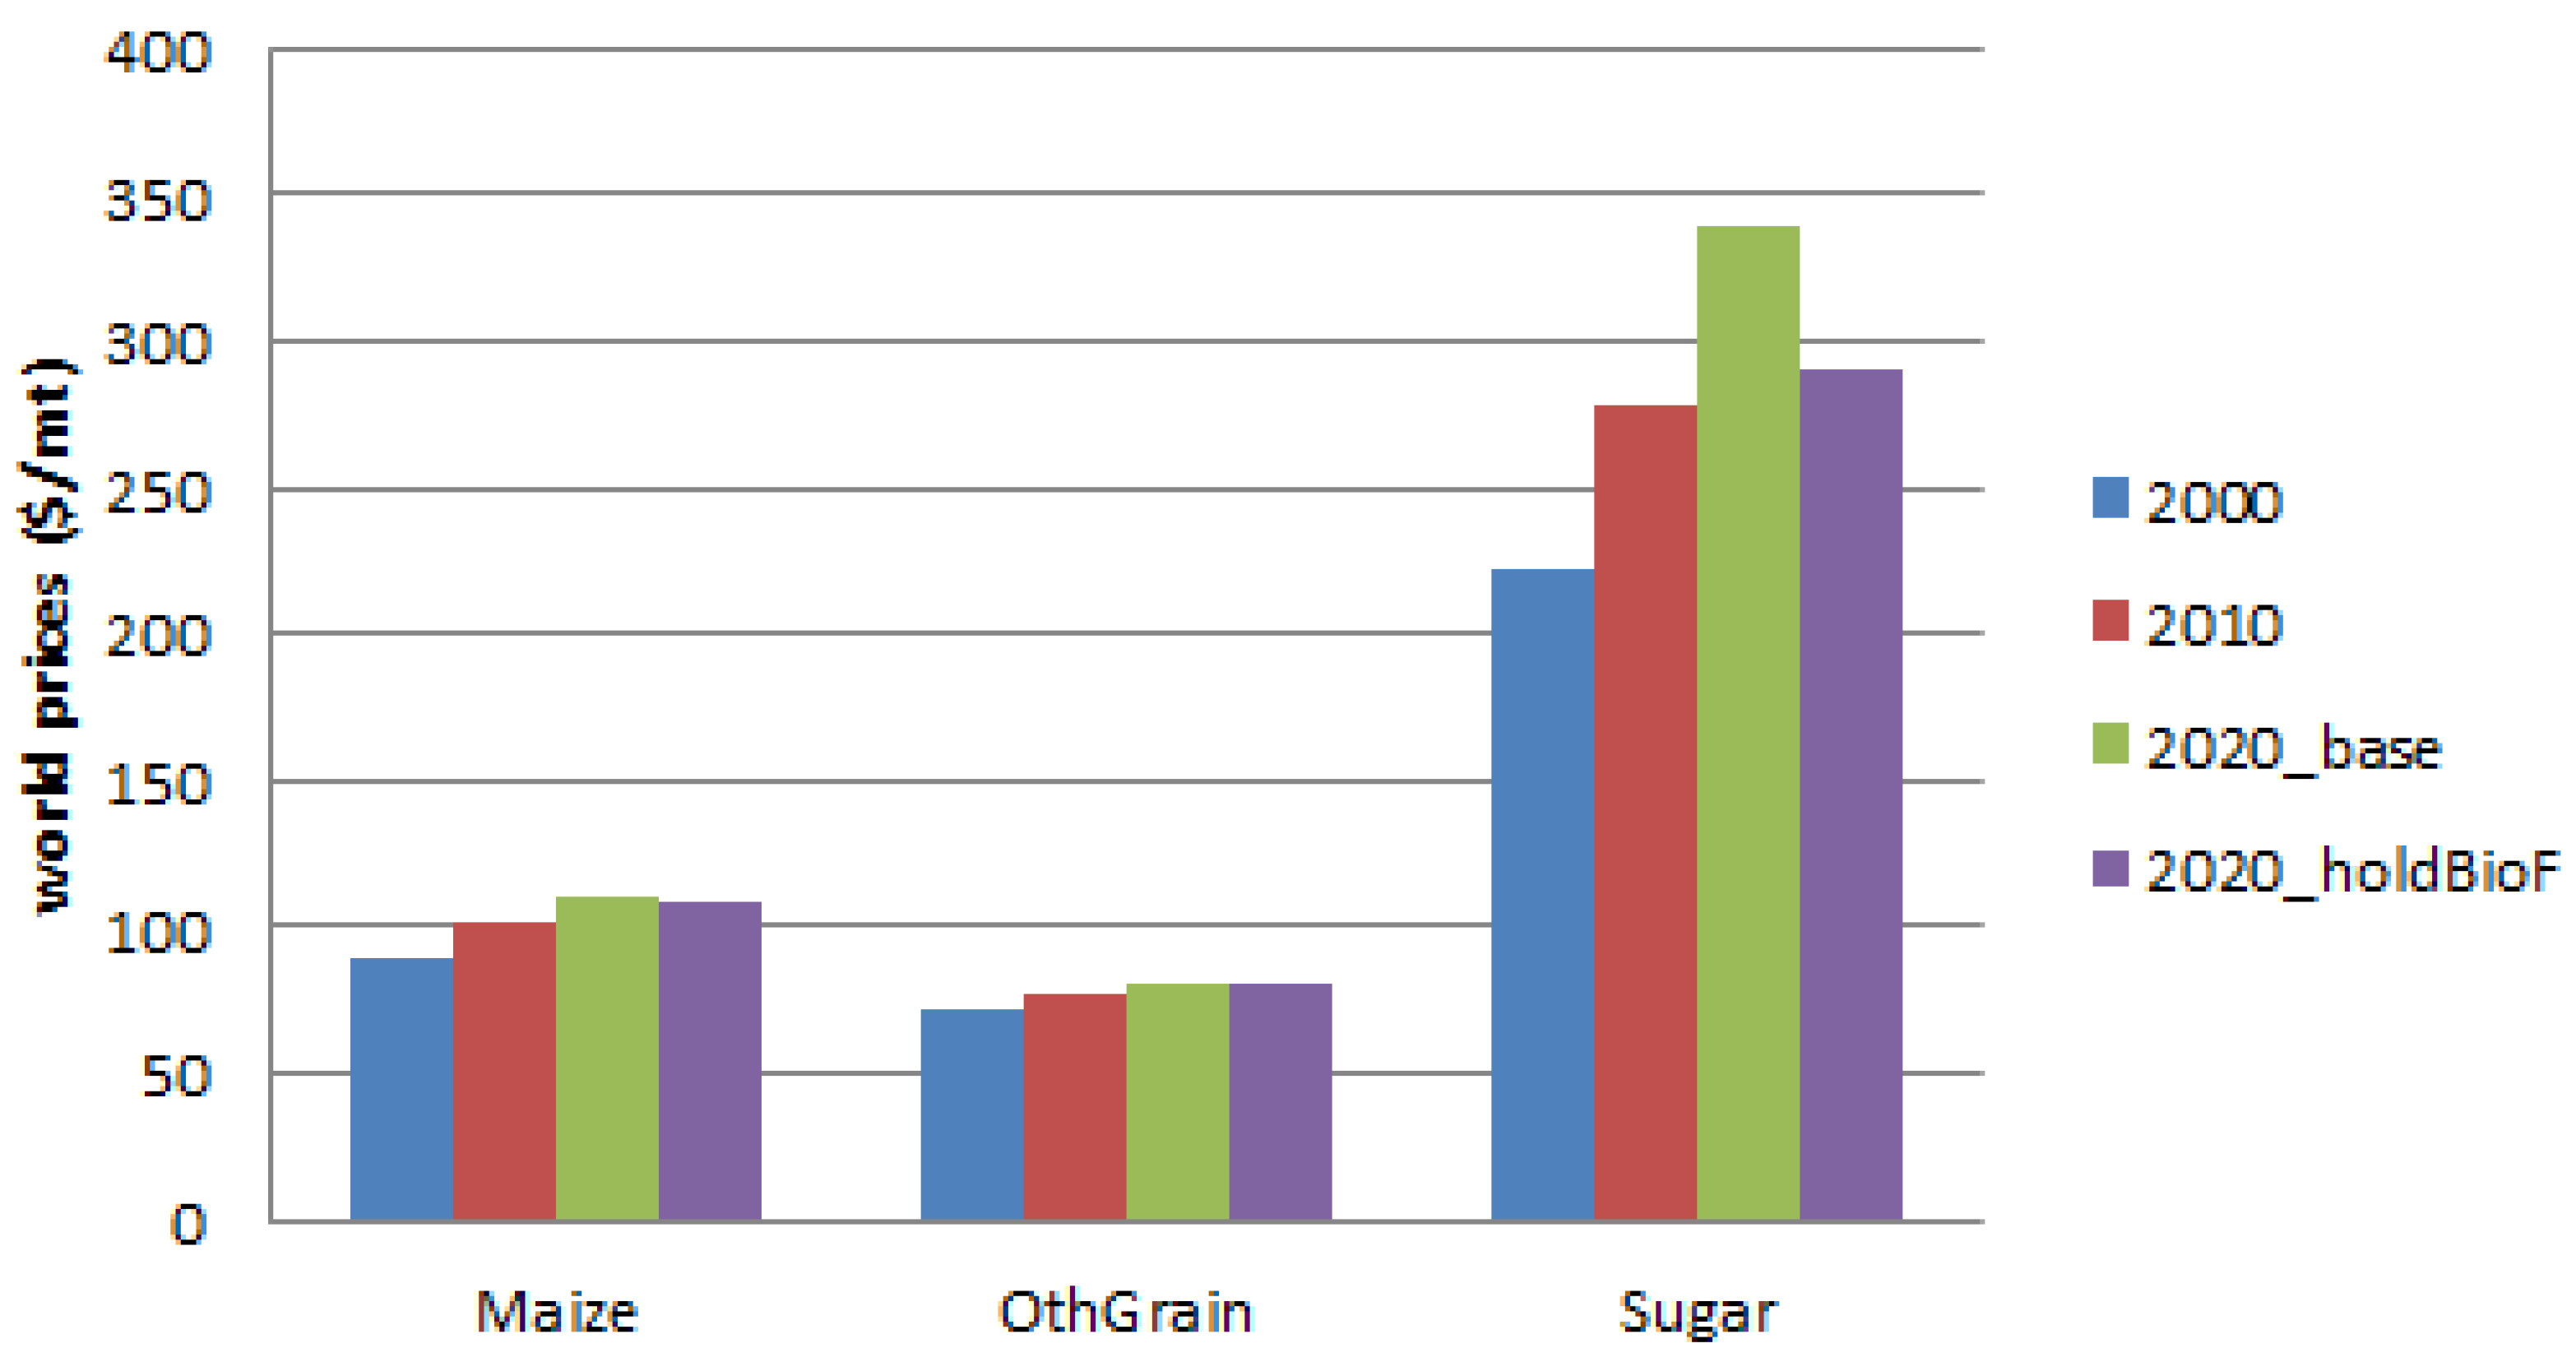
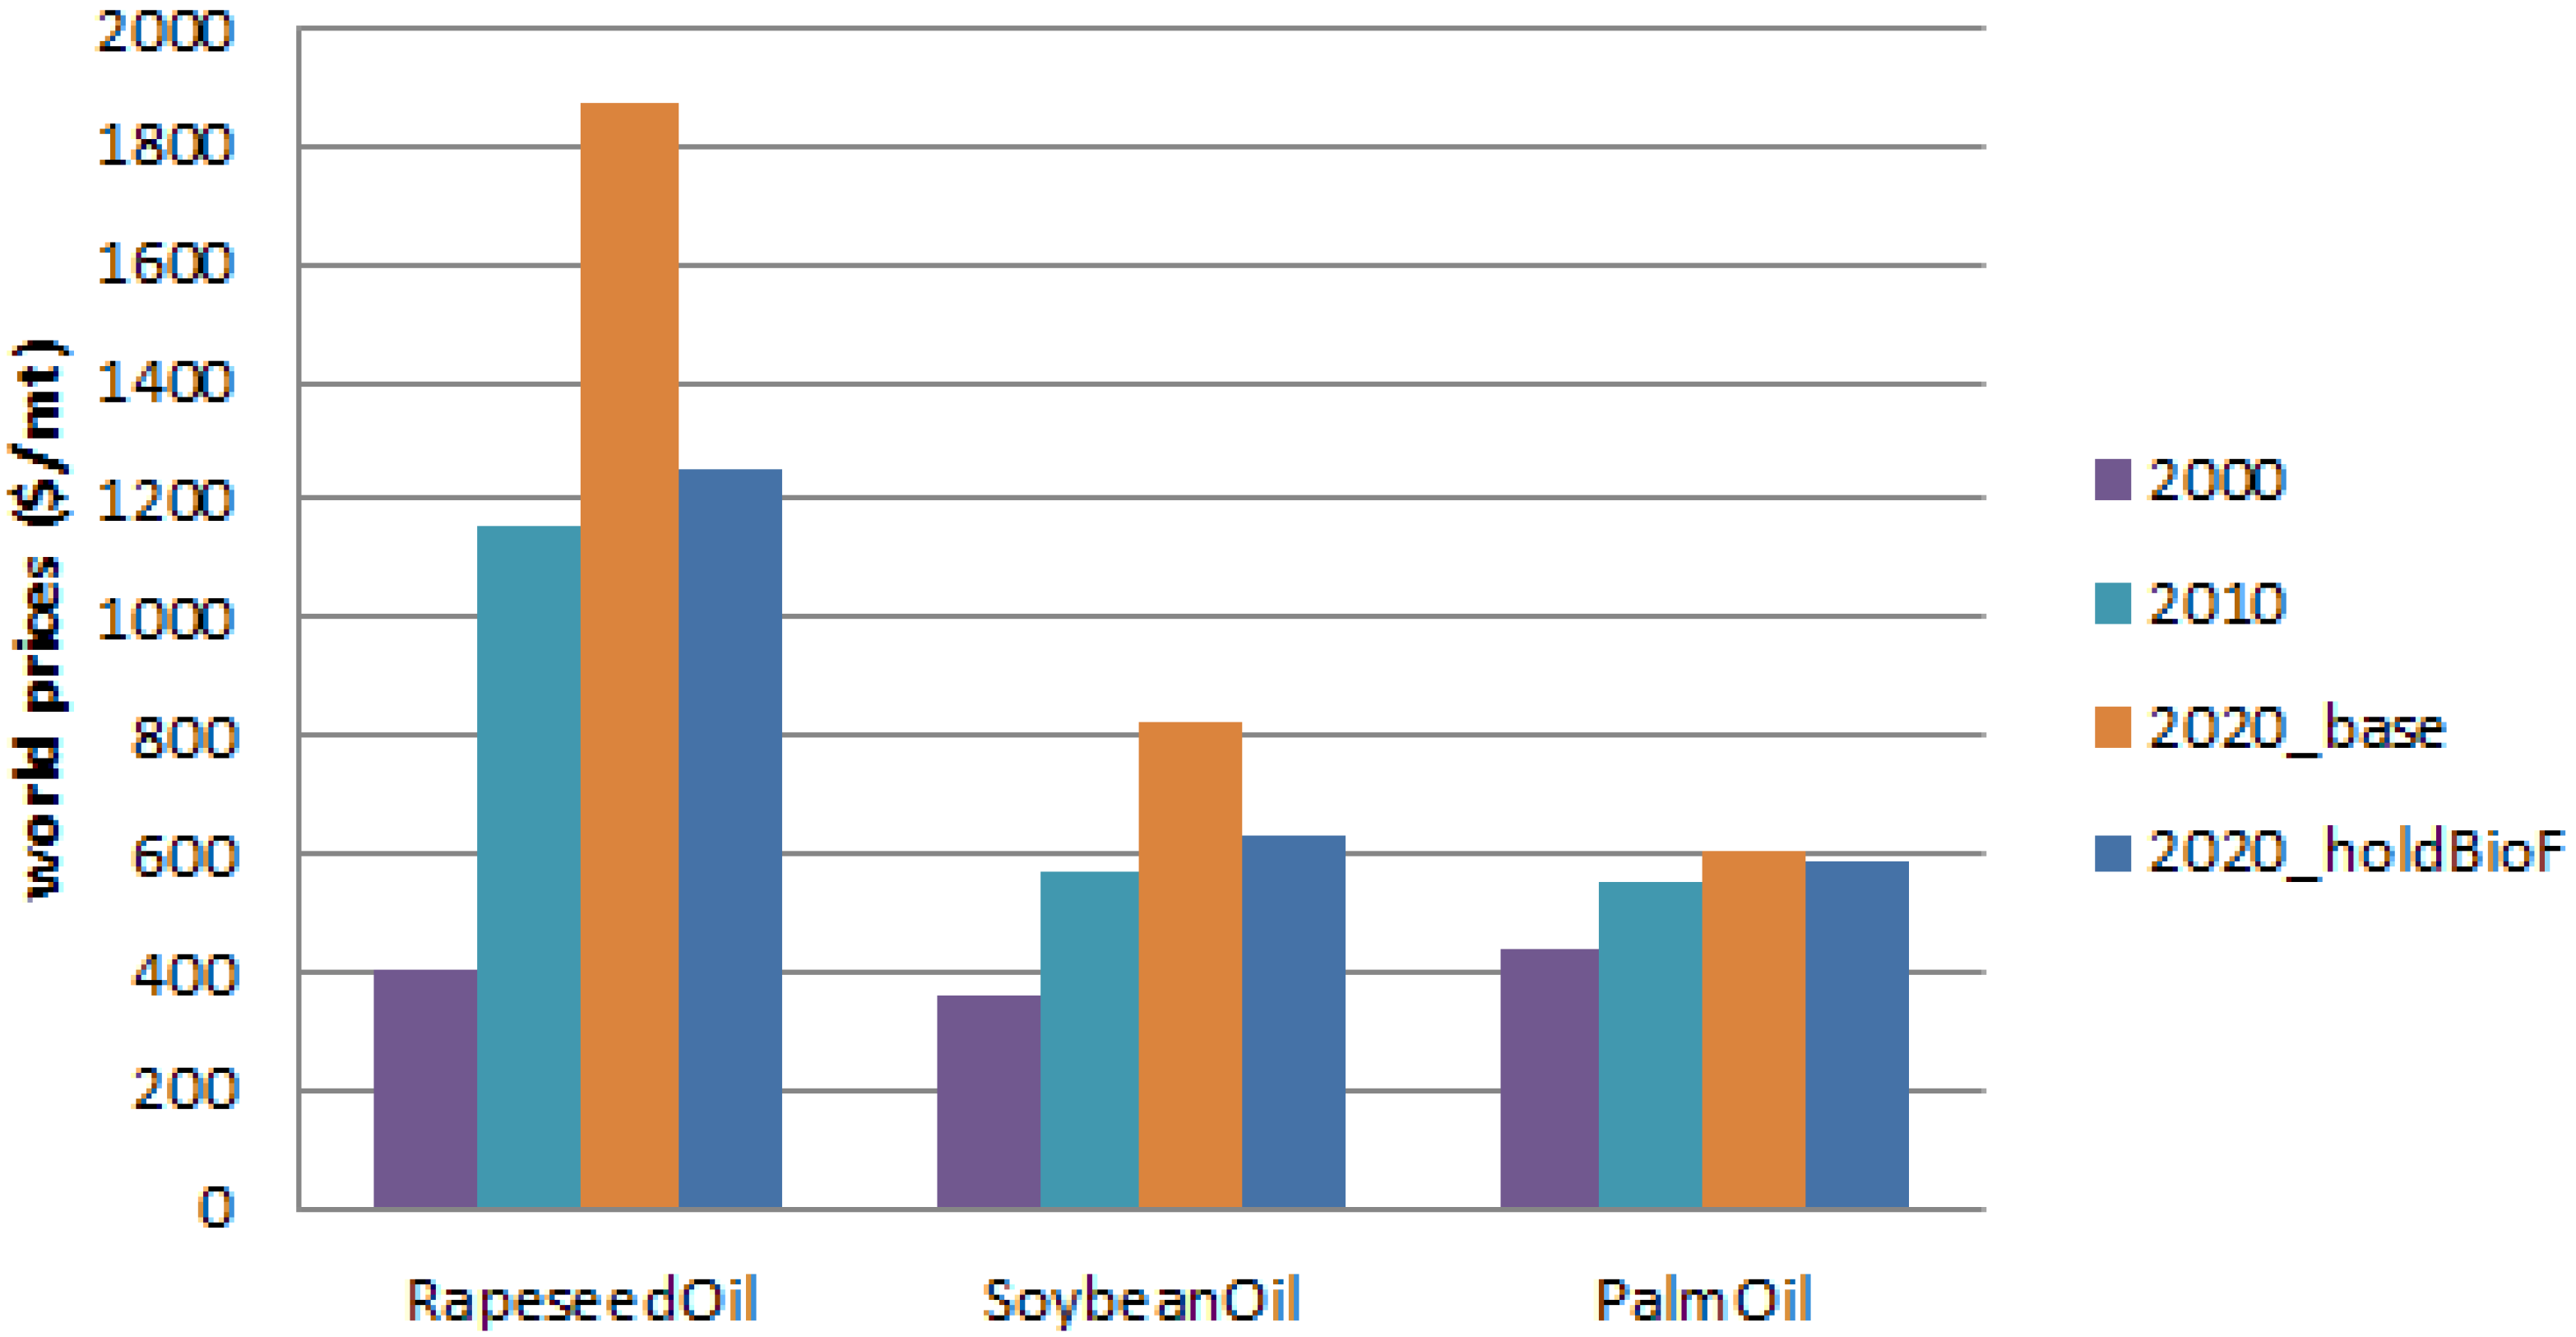
4.2. Impact of Biofuels: Scenario Analysis


5. Food Security Implications of Biofuels

| Region | 2000 | 2010 | 2020 | ||
|---|---|---|---|---|---|
| Baseline | Biofuels held at 2010 levels | Difference | |||
| South Asia | 2333 | 2348 | 2412 | 2449 | 37 |
| All Asia | 2638 | 2705 | 2801 | 2835 | 34 |
| All SS Africa | 2174 | 2150 | 2245 | 2268 | 23 |
| Latin America | 2850 | 2769 | 2796 | 2859 | 63 |
| WANA | 3129 | 3075 | 3112 | 3163 | 51 |
| All Developing | 2639 | 2661 | 2734 | 2771 | 37 |
| Region | 2000 | 2010 | 2020 | ||
|---|---|---|---|---|---|
| Baseline | Biofuels held at 2010 levels | Difference | |||
| South Asia | 77.5 | 74.6 | 69.5 | 68.9 | −0.7 |
| All Asia | 101.9 | 94.8 | 85.5 | 84.5 | −1.0 |
| All SS Africa | 32.0 | 39.9 | 43.0 | 42.6 | −0.4 |
| Latin America | 7.7 | 7.9 | 7.3 | 7.0 | −0.3 |
| WANA | 6.0 | 6.6 | 5.9 | 5.7 | −0.2 |
| All Developing | 148.1 | 149.7 | 142.1 | 140.2 | −1.9 |
6. Land Use Implications of Biofuels
| Region | 2010 | 2020 | ||
|---|---|---|---|---|
| Baseline | Biofuels held at 2010 levels | Difference | ||
| North America | 74.1 | 80.2 | 79.8 | −0.4 |
| Europe | 75.0 | 78.2 | 77.5 | −0.7 |
| Latin America | 27.9 | 30.8 | 30.4 | −0.4 |
| China | 252.3 | 268.1 | 266.7 | −1.4 |
| S Asia | 269.7 | 295.5 | 293.7 | −1.8 |
| SE Asia | 44.7 | 46.6 | 46.4 | −0.1 |
| Other E Asia & Pacific | 17.7 | 17.9 | 17.8 | −0.1 |
| SS Africa | 18.2 | 21.8 | 21.7 | −0.1 |
| Crop | North America | Europe | Latin America | China | South Asia | SE Asia | Other E Asia & Pacific | SS Africa |
|---|---|---|---|---|---|---|---|---|
| rice | −6.2 | −3.1 | −5.9 | −149.6 | −27.3 | 0.8 | −17.5 | −11.4 |
| wheat | −87.5 | −507.3 | −12.0 | −776.3 | −1155.6 | −10.9 | −53.2 | −28.6 |
| maize | −40.5 | −53.7 | −13.2 | −159.8 | −57.2 | −3.9 | −9.0 | |
| other coarse grains | −15.8 | 12.9 | −7.2 | −2.8 | −15.5 | 0.1 | −16.3 | |
| soybean | −170.0 | −2.0 | −0.6 | −221.9 | −100.3 | −2.9 | −6.6 | −1.0 |
| roots & tubers | 0.3 | −0.9 | −0.1 | −2.6 | 0.0 | 0.1 | −0.2 | |
| sugarcane & beet | −60.6 | −104.0 | −307.2 | −38.0 | −240.0 | −124.7 | −23.5 | −72.2 |
| vegetables & fruits | 8.5 | 5.1 | 3.5 | 15.3 | 2.4 | 2.6 | 1.3 | 2.4 |
| pulses | −3.6 | −0.1 | ||||||
| rapeseed | −54.7 | −58.1 | −1.2 | −88.5 | −166.0 | |||
| Other oil crops | 17.4 | −19.0 | −29.1 | −3.9 | −37.7 | −1.1 | −11.8 | |
| other crops | 29.9 | 14.9 | −2.8 | −21.2 | −2.2 | −2.2 | −0.3 |
7. Implications of Food-Energy Interactions for Policy
| (land use change in hectares per toe of biofuels) | US ethanol | EU ethanol | ||||
|---|---|---|---|---|---|---|
| maize | wheat | coarse grains | wheat | |||
| IMPACT model | 0.12 | 0.22 | 0.29 | 0.22 | ||
| AgLink model | 0.51 | 0.57 | ||||
| FAPRI model | 0.39 | |||||
| GTAP model | 0.16 | 0.79 | ||||
| LEITAP model | 0.86 | |||||
8. Conclusions
Acknowledgments
References and Notes
- Worldwatch, Biofuels for Transportation: Global Potential and Implications for Sustainable Agriculture and Energy in the 21st Century; Extended Summary of Report for the German Federal Ministry of Food Agriculture and Consumer Protection (BMELV), Worldwatch Institute: Washington, DC, USA, 2006.
- Sperling, D.; Yeh, S. Low carbon fuel standards: The most direct and effective policy for transitioning to low-carbon alternative transportation fuels is to spur innovation with a comprehensive performance standard for upstream fuel producers. Issues Sci. Technol. 2009, 25, 57–66. [Google Scholar]
- Sperling, D.; Yeh, S. Toward a global low carbon fuel standard. Transp. Policy 2010, 17, 47–49. [Google Scholar] [CrossRef]
- Abbot, P.C.; Hurt, C.; Tyner, W.E. What’s Driving Food Prices? Technical Report for Farm Foundation: Oak Brook, IL, USA, 2008. [Google Scholar]
- Evans, A. Rising Food Prices: Drivers and Implications for Development; Chatham House: London, UK, 2008. [Google Scholar]
- Runge, C.F.; Senauer, B. How biofuels could starve the poor. Foreign Aff. 2007, 8, 41–53. [Google Scholar]
- Runge, C.F.; Senauer, B. How ethanol fuels the food crisis. Foreign Affairs, May 2008. Available online: http://www.foreignaffairs.com/articles/64915/c-ford-runge-and-benjamin-senauer/how-ethanol-fuels-the-food-crisis (accessed on 30 July 2012).
- Von Braun, J. The World Food Situation: New Driving Forces and Required Actions; Food Policy Report for International Food Policy Research Institute: Washington, DC, USA, 2008. [Google Scholar]
- Von Braun, J. Food and Financial Crises: Implications for Agriculture and the Poor; Food Policy Report for International Food Policy Research Institute: Washington, DC, USA, 2008. [Google Scholar]
- Gilbert, C.L. How to understand high food prices. J. Agric. Econ. 2010, 61, 398–425. [Google Scholar] [CrossRef]
- Babcock, B. The Impact of US Biofuel Policies on Agricultural Price Levels and Volatility; ICTSD Issue Paper No. 35 for International Center for Trade and Sustainable Development: Geneva, Switzerland, 2011. [Google Scholar]
- Rosegrant, M.W.; Msangi, S.; Ringler, C.; Sulser, T.B.; Zhu, T.; Cline, S.A. International Model for Policy Analysis of Agricultural Commodities and Trade (IMPACT): Model Description; International Food Policy Research Institute: Washington, DC, USA, 2008. [Google Scholar]
- Energy Information Administration, Annual Energy Outlook 2010: With Projections to 2035; Technical Report No. DOE/EIA-0383 2010 for US Energy Information Administration, Office of Integrated Analysis and Forecasting; US Department of Energy: Washington, DC, USA, 2010.
- Smith, L.; Haddad, L. Explaining Childe Malnutrition in Developing Countries: A Cross-Country Analysis; IFPRI Research Report for International Food Policy Research Institute: Washington, DC, USA, 2000. [Google Scholar]
- Searchinger, T.; Heimlich, R.; Houghton, R.A.; Dong, F.; Elobeid, A.; Fabiosa, J.; Tokgoz, S.; Hayes, D.; Yu, T.H. Use of US croplands for biofuels increases greenhouse gases through emissions from land-use change. Sci. Express 2008, 319, 1238–1240. [Google Scholar] [CrossRef]
- Witzke, P.; Fabiosa, J.; Gay, H.; Golub, A.A.; Havlik, P.; Msangi, S.; Tokgoz, S.; Searchinger, T. A Decomposition Approach to Assess iLUC Results from Global Modeling Efforts. In Proceedings of International Agricultural Trade Research Consortium Symposium, Stuttgart-Hohenheim, Germany, 26–29 June 2010.
- Edwards, R.; Mulligan, D.; Marelli, L. Indirect Land Use Change from Increased Biofuels Demand: Comparison of Models and Results for Marginal Biofuels Production from Different Feedstocks; JRC Scientific and Technical Report for Joint Research Center of the European Commission: Ispra, Italy, 2010. [Google Scholar]
- Nassar, A.M.; Harfuch, L.; Bachion, L.C.; Moreira, M.R. Biofuels and land-use changes: Searching for the top model. Interface Focus 2011, 1, 224–232. [Google Scholar] [CrossRef]
- GAIN Reports, various issues. U.S. Department of Agriculture Foreign Agricultural Service Web site. Available online: http://gain.fas.usda.gov/Pages/Default.aspx (accessed on 17 November 2012).
Technical Annex
Biofuels demand equations:


Ethanol supply equations:
- Feedstock-based ethanol production, which applies to feed grains, sugar cane and sugar beet:where
![Agriculture 02 00414 i025]()
![Agriculture 02 00414 i026]() is the production of ethanol,
is the production of ethanol, ![Agriculture 02 00414 i027]() is the ethanol production intercept,
is the ethanol production intercept, ![Agriculture 02 00414 i028]() is the production elasticity with respect to the ethanol price (Peth),
is the production elasticity with respect to the ethanol price (Peth), ![Agriculture 02 00414 i029]() is the feedstock cost for ethanol, and θeth is the ethanol production cost elasticity.The feedstock costs are the region-specific costs of ethanol production that affect the region-specific levels of ethanol production. To derive these costs, we start from the cost of ethanol production from feedstock crop j, which is a function of crop producer prices converted into US$ per liter using technical conversion rates for each feedstock. The cost of ethanol production from feedstock crop j is then summed over all feedstock crops used in a given region and weighted by the share of ethanol produced from each feedstock crop.
is the feedstock cost for ethanol, and θeth is the ethanol production cost elasticity.The feedstock costs are the region-specific costs of ethanol production that affect the region-specific levels of ethanol production. To derive these costs, we start from the cost of ethanol production from feedstock crop j, which is a function of crop producer prices converted into US$ per liter using technical conversion rates for each feedstock. The cost of ethanol production from feedstock crop j is then summed over all feedstock crops used in a given region and weighted by the share of ethanol produced from each feedstock crop. - Molasses-based ethanol production is a by-product of sugar production. Ethanol production quantity is calculated by converting the sugar production quantity to ethanol production using technical conversion factors estimated from historical data for 2005.
- Non-feedstock-based technologies include ethanol produced as a by-product of crude oil production and ethanol produced from cheese whey.where
![Agriculture 02 00414 i030]()
![Agriculture 02 00414 i031]() is the production of ethanol from non-feedstock-based technologies, and
is the production of ethanol from non-feedstock-based technologies, and ![Agriculture 02 00414 i032]() is the corresponding production intercept,
is the corresponding production intercept, ![Agriculture 02 00414 i033]() is the production elasticity with respect to the ethanol price (Peth),
is the production elasticity with respect to the ethanol price (Peth), - Total ethanol production in each region is the sum of feedstock-based ethanol production, molasses-based ethanol production, and non-feedstock-based ethanol production.


Biodiesel supply equation:

Feedstock demand equations:
Total commodity demand:
Biofuel net trade equation:
Key data sources and assumptions
© 2012 by the authors; licensee MDPI, Basel, Switzerland. This article is an open-access article distributed under the terms and conditions of the Creative Commons Attribution license (http://creativecommons.org/licenses/by/3.0/).
Share and Cite
Tokgoz, S.; Zhang, W.; Msangi, S.; Bhandary, P. Biofuels and the Future of Food: Competition and Complementarities. Agriculture 2012, 2, 414-435. https://doi.org/10.3390/agriculture2040414
Tokgoz S, Zhang W, Msangi S, Bhandary P. Biofuels and the Future of Food: Competition and Complementarities. Agriculture. 2012; 2(4):414-435. https://doi.org/10.3390/agriculture2040414
Chicago/Turabian StyleTokgoz, Simla, Wei Zhang, Siwa Msangi, and Prapti Bhandary. 2012. "Biofuels and the Future of Food: Competition and Complementarities" Agriculture 2, no. 4: 414-435. https://doi.org/10.3390/agriculture2040414
APA StyleTokgoz, S., Zhang, W., Msangi, S., & Bhandary, P. (2012). Biofuels and the Future of Food: Competition and Complementarities. Agriculture, 2(4), 414-435. https://doi.org/10.3390/agriculture2040414