Article

Carbon and Nitrogen Contents Driven by Organic Matter Source within Pichavaram Wetland Sediments

by
Sathy A. Naidu
1,
Kandasamy Kathiresan
2,
Jeffrey H. Simonson
3,
Arny L. Blanchard
1,
Christian J. Sanders
4,*,
Alexander Pérez
5,6,*,
Ruth M. Post
1,
Thanumalaya Subramoniam
7,
Raj A. Naidu
8 and
Rajendran Narender
2
1
Institute of Marine Science, University of Alaska Fairbanks, Fairbanks, AK 99775, USA
2
Centre of Advanced Study in Marine Biology, Annamalai University, Parangipettai 608502, India
3
School of Fisheries and Ocean Sciences, University of Alaska Fairbanks, Fairbanks, AK 99775, USA
4
National Marine Science Centre, Southern Cross University, Coffs Harbor, NSW 2450, Australia
5
Centro de Investigación Para el Desarrollo Integral y Sostenible (CIDIS), Laboratorios de Investigación y Desarrollo (LID), Facultad de Ciencias y Filosofía (FACIEN), Universidad Peruana Cayetano Heredia, Lima 15102, Peru
6
Departamento de Ingeniería, Facultad de Ciencias y Filosofía (FACIEN), Universidad Peruana Cayetano Heredia, Lima 15102, Peru
7
Sathyabama University, Jeppiaar Nagar, Chennai 600110, India
8
25302 Lockspur Dr., Richmond, VA 77406, USA
*
Authors to whom correspondence should be addressed.
J. Mar. Sci. Eng. 2022, 10(1), 53; https://doi.org/10.3390/jmse10010053
Submission received: 3 November 2021 / Revised: 29 December 2021 / Accepted: 30 December 2021 / Published: 4 January 2022
(This article belongs to the Section Chemical Oceanography)

Abstract

:
Differences in grain size, total organic carbon (OC), total nitrogen (TN), OC/TN ratios, and stable isotope (δ13C and δ15N) were assessed in sediments from areas covered by mangrove and saltmarsh vegetation within Pichavaram estuary (Southeast India). The mean percentage contents of silt and clays (70 vs. 19%), OC (5.7 vs. 2.0%), and TN (0.39 vs. 0.14%) were consistently higher in the mangrove as compared to those observed in the saltmarsh tidal zone. These differences may obey the higher deposition and retention of fine particles in the presence of a mangrove root system that may facilitate the accumulation and preservation of organic matter within these sedimentary systems. Further, higher OC and TN contents were associated to higher terrestrial or mangrove-derived organic matter contribution with lighter δ13C signatures (−26.0‰) in both sedimentary tidal zones, whereas lower OC and TN contents were associated to heavier δ13C signatures. This study is in agreement with previous studies which indicate that the presence of wetland vegetation may increase the carbon and nutrient storage capacity within estuarine ecosystems, highly relevant information for the establishment of further conservation strategies for blue carbon ecosystems at global scales.

1. Introduction

There is growing global interest in vegetated coastal wetlands zones, as they are known for their significant role in providing invaluable ecosystem services including supporting high biological diversity [1,2]. These ecosystems also protect coastal regions against environmental impacts (e.g., storms, tsunamis and hydrological) [3,4] as well as anthropogenic pressures (e.g., sewage effluents and eutrophication) [5,6]. In particular, mangroves, saltmarsh and seagrasses ecosystems play a key role in regulating the carbon accumulation along with biogeochemical processes related to the global carbon cycle, because they are able to accumulate marine, terrestrial and atmospheric carbon within their sedimentary environments [7,8,9]. For example, mangroves cover is less than 1% of global coastal areas; however, these ecosystems represent up to 15% of the organic carbon accumulation rates of marine sediments, which is almost four-fold higher carbon than tropical rain forests [8,10,11]. However, many studies have shown that the contents of organic carbon and nutrients within wetland sediments may also respond to environmental and anthropogenic pressures [8,12], being related to the primary production rates and nutrient consumption of wetland vegetation [9,13]. Those factors may produce changes in the sedimentary organic matter sources and blue carbon accumulation capacity within these ecosystems, which are typically assessed using isotopic and elemental compositions, e.g., organic carbon (OC), total nitrogen (TN) and carbon isotopic signatures (δ13C, of sedimentary organic matter [6,14].
The Indian mangrove forest extends 4740 km2, which represents approximately 3% of the world’s mangrove cover area and 30% of the mangrove vegetation production [15]. Along the eastern coastline, the Pichavaram estuary is located within the Cauvery Delta and dominated by mangrove and saltmarsh vegetation [1,16]. Due to its ecological relevance (e.g., fisheries, forest resources, coastal protection and carbon sink), the Pichavaram estuary is the most intensely investigated coastal biome of India, in which several studies have been developed including those related to metal, nutrient and organic matter dynamics, hydrological impacts on estuarine geomorphology and the impact of tsunamis [17,18]. However, it is important to determine natural baselines in terms of organic carbon contents to better understand the role of these wetland areas as a blue carbon ecosystem within the global warming context. This study aims to determine differences in grain size, total organic carbon (OC), total nitrogen (TN), OC/TN ratios, and stable isotope (δ13C and δ15N) within mangrove and saltmarsh sediments of Pichavaram estuary, to gain a better understanding of the blue carbon dynamics along intertidal vegetated ecotones. In addition, this study is based on the premise that the presence of coastal wetland vegetation, mangroves and saltmarsh, represents specific carbon and nutrient storage capacity along these ecosystems [19,20,21], which may be relevant for the establishment of further conservation strategies for these blue carbon ecosystems at global scales.

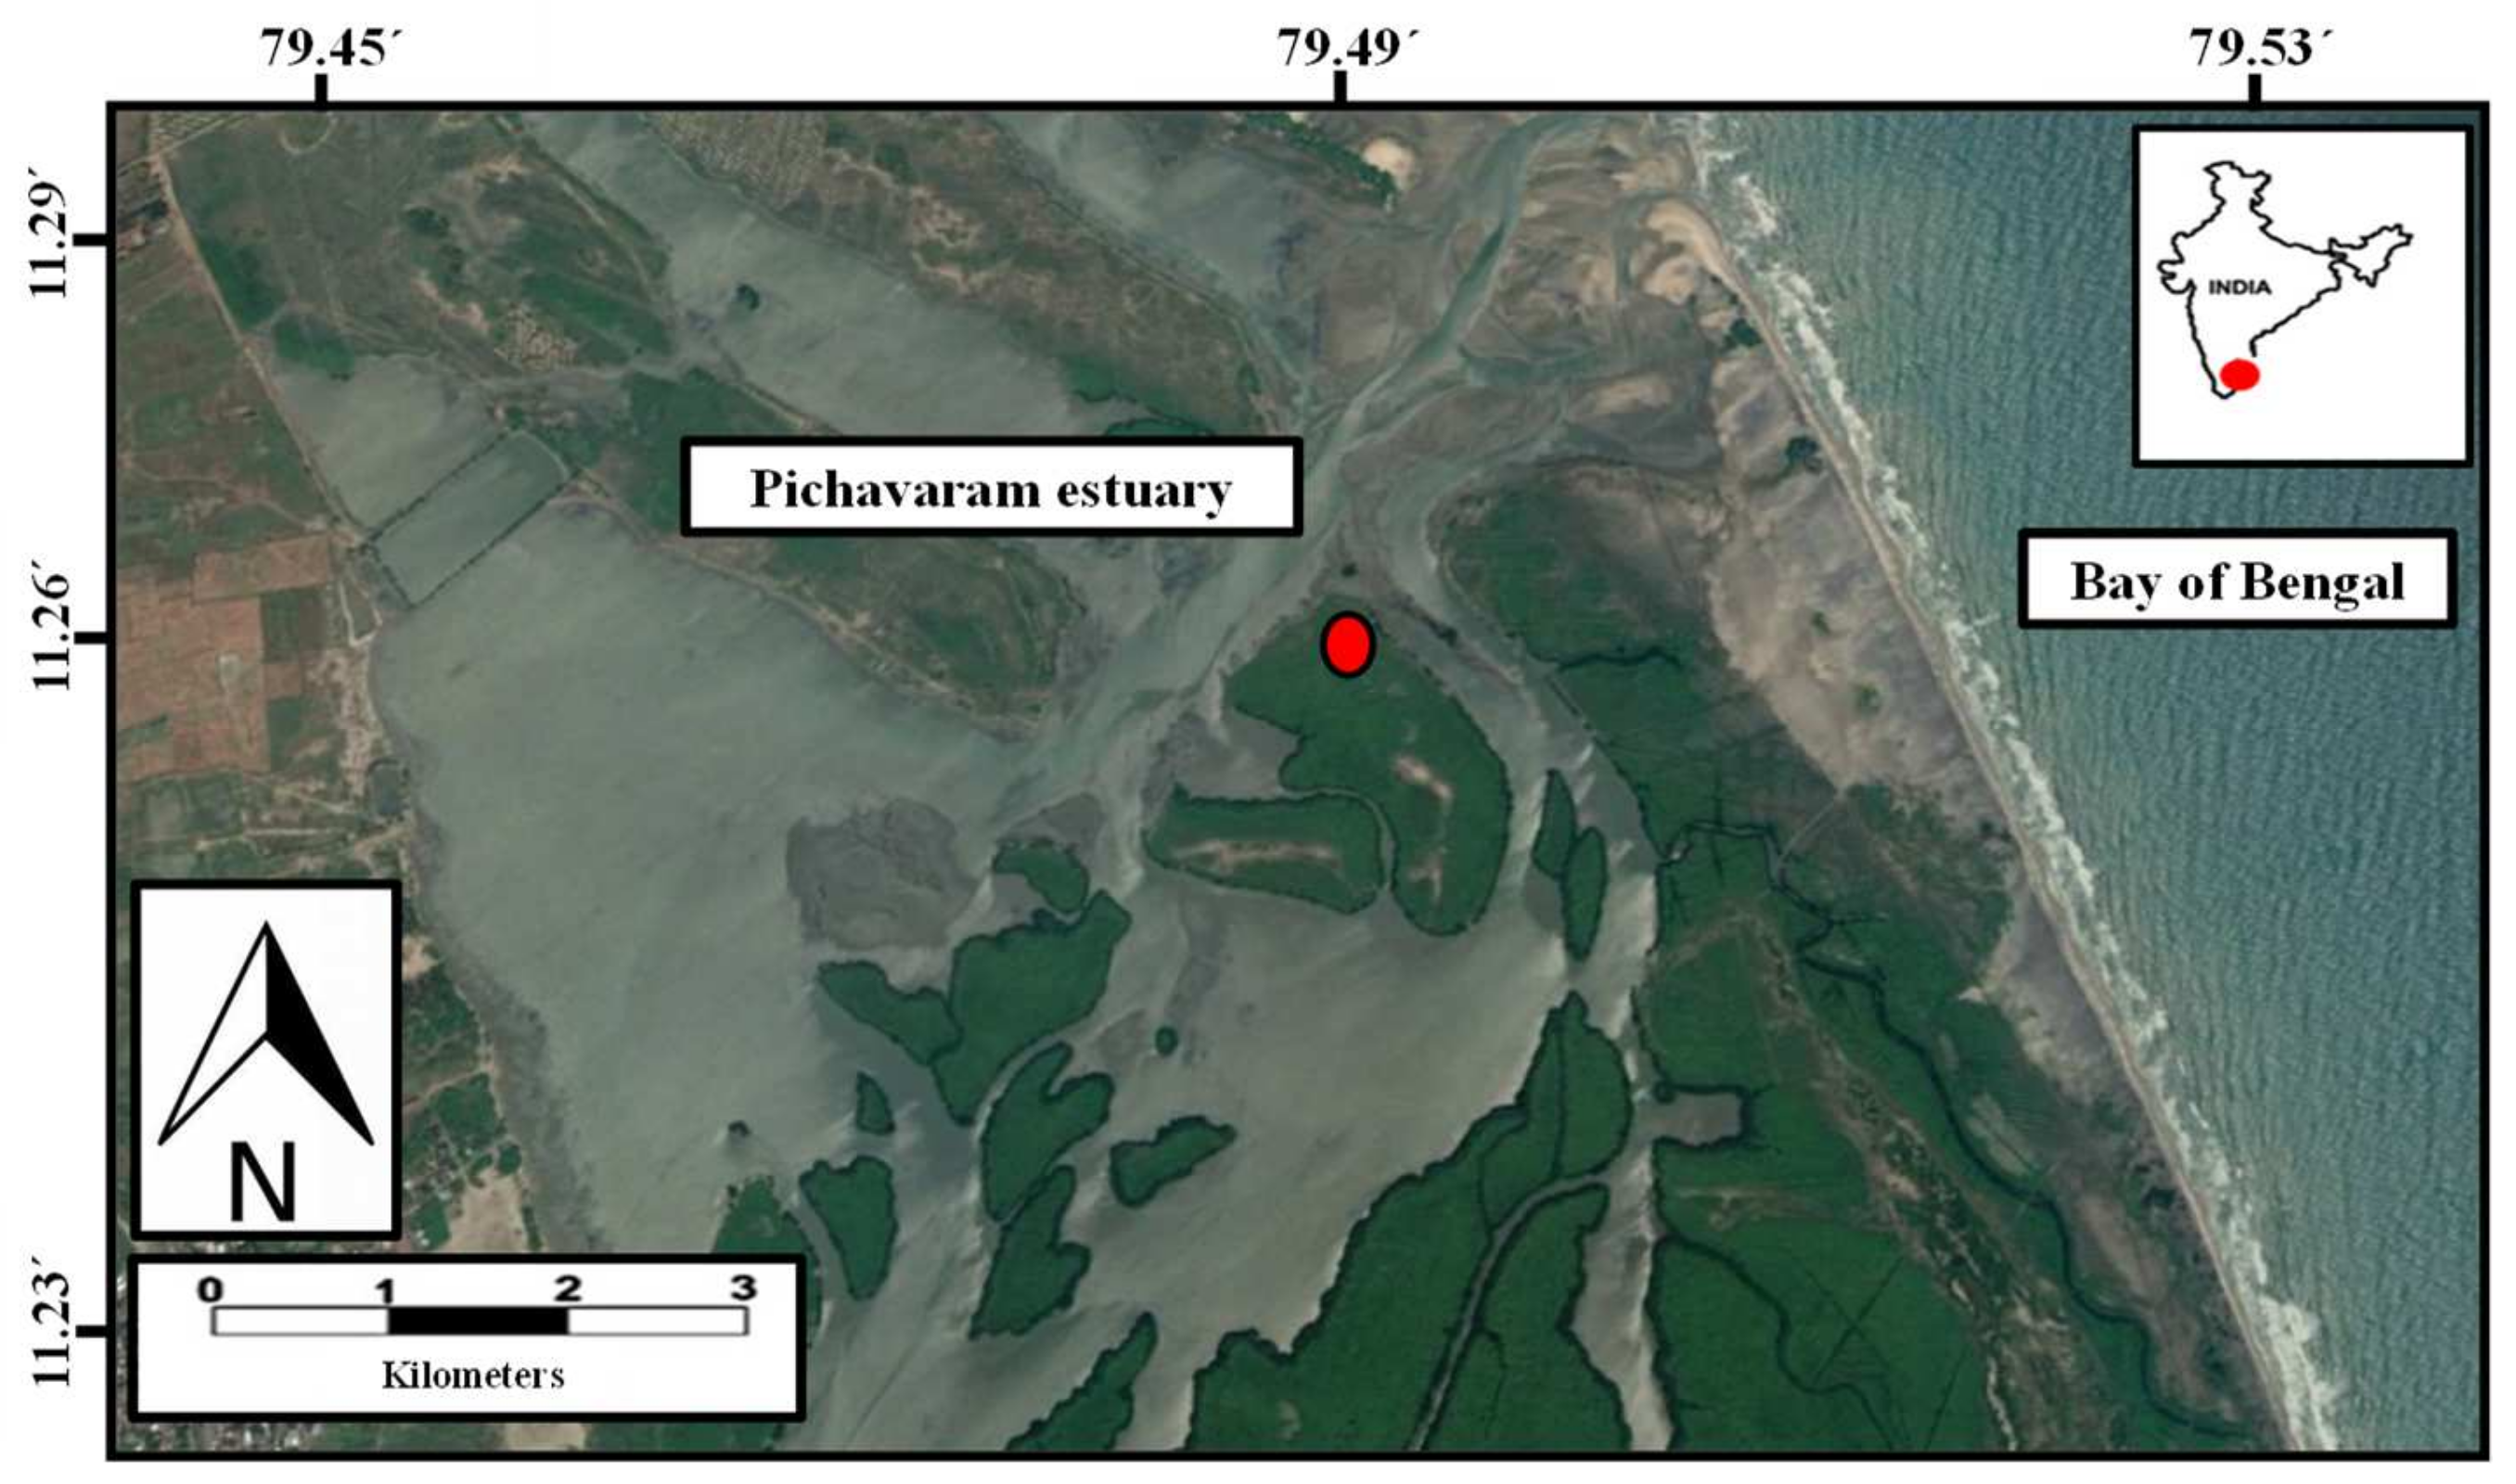
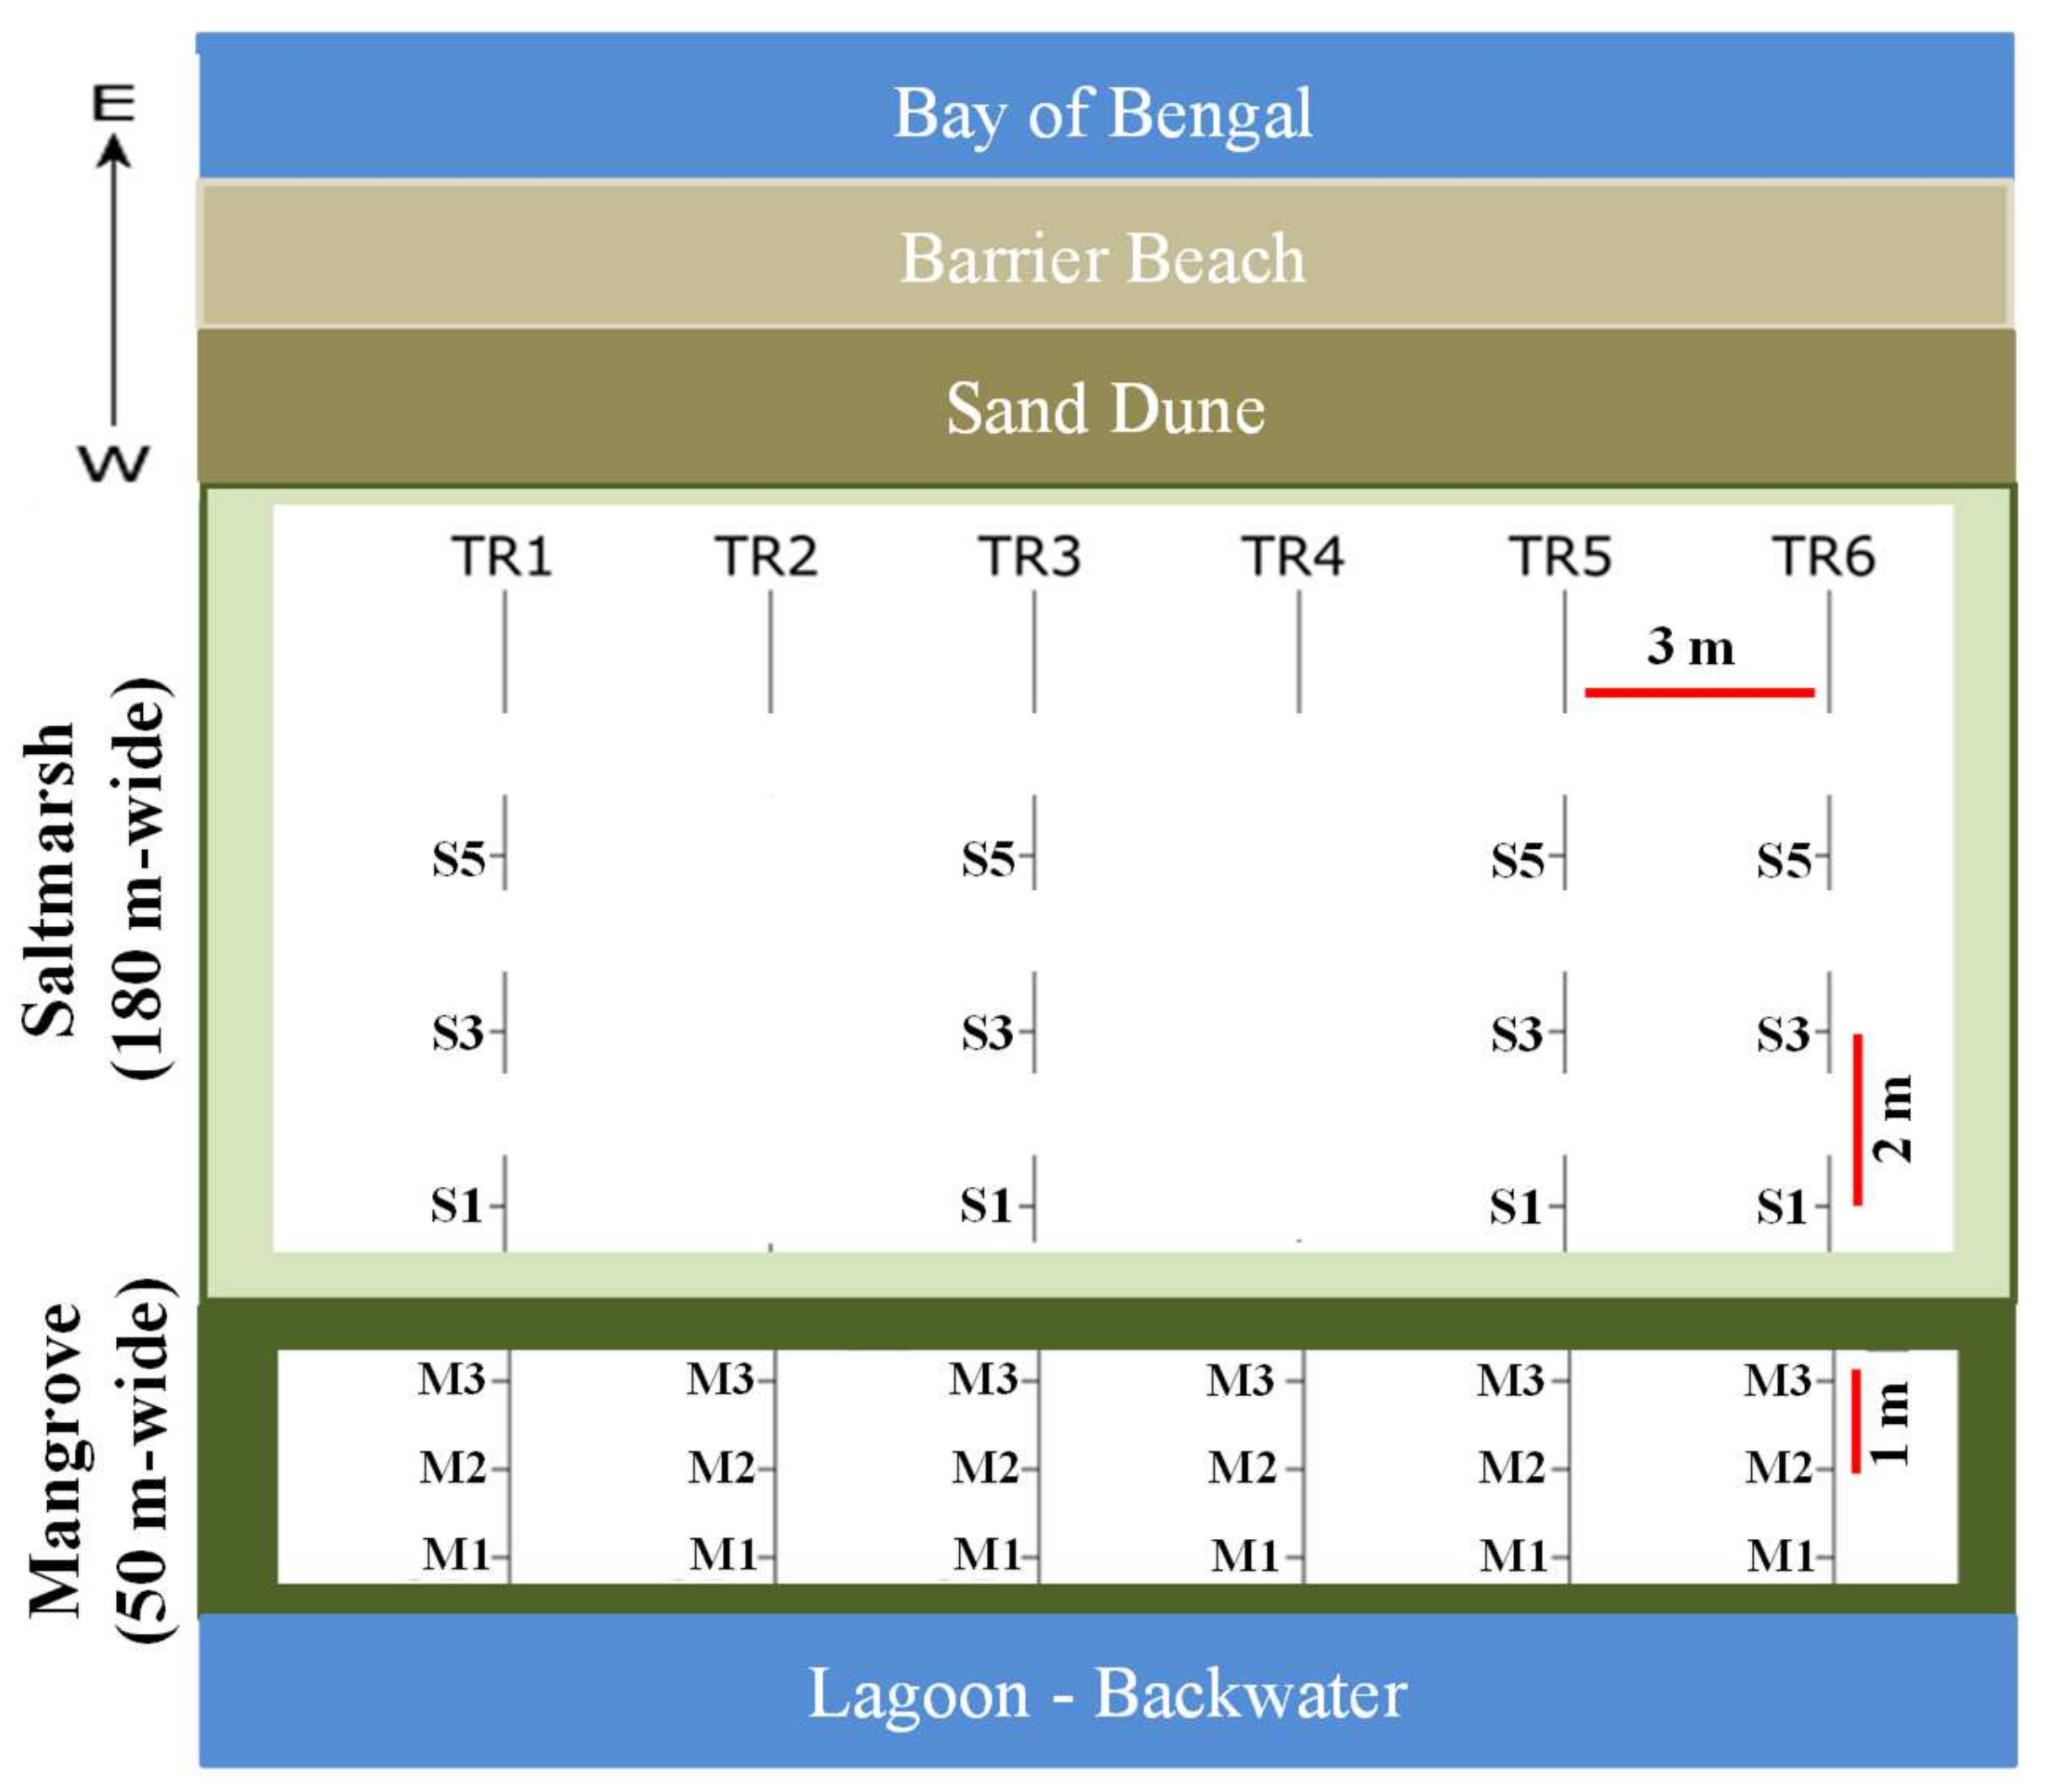
2. Materials and Methods

The study was conducted in a mangrove forest and contiguous saltmarsh ecosystem located within Pichavaram estuary in the Southeast India (Figure 1). The sampling stations were located to the west of the backshore of a coastal barrier beach facing the Bay of Bengal (Figure 1). Here, approximately 180 m-wide saltmarsh zones extend landward from the backshore of the sandy beach and dune into 50 m-wide of mangrove zones fringe (Figure 2). This area contains an air temperature of between 34 °C and 28 °C, subjected to occasional NE monsoon rains [15,22], and is continuously impacted by the hydrological regime (e.g., tidal regime, waves and currents), presenting a semi-diurnal tidal regime (15 to 100 cm amplitude), which influences the tidal creeks water flow [16,22]. The mangrove sediments contain anoxic conditions, as suggested by the pervasive presence of sulfide [23]. The dense mangrove zone is predominantly composed of black mangroves (Avicennia marina) and red mangroves (Rhizophora sp.) presenting up to 15 m tall trees [15,22], whereas the saltmarsh zone is composed of Suaeda sp., Sesuvium sp. and Salicornia sp., where Salicornia sp. is the dominant species [22].
The sampling campaigns were carried out in December 2014, under low tide conditions, in which surficial sediment (5-cm depth) were collected using a 10cm-diameter PVC tube from 54 sites within a sampling grid. The sampling grid consisted of vertical transects placed at 3-m intervals, whereas each sampling station in each transect was placed at 1-m apart (Figure 2). In these transects, eighteen surficial sediment samples were collected within the mangrove zone, whereas twelve samples were collected within the saltmarsh zone (Figure 2). After collection, each sediment sample was placed in plastic bags, put on ice and returned to the laboratory. Subsequently, samples were sent to the University of Alaska, Fairbanks (USA) for further geochemical analyses. The samples were dried at 50 °C, and a portion of the dried sediment were made into slurry using distilled water and analyzed for grain size contents following wet-sieving through a 62 µm sieve [24,25].
In order to avoid analysis biases, a second portion of non-decarbonated sediment of each sample was separated, dried, and ground to powder to measure TN and δ15N [26,27]. A third portion of each sediment sample was dried, ground to powder and treated with 10% HCl to remove carbonates [14]. These carbonate-free samples were analyzed for total organic carbon (OC) and, stable isotopes (δ13C) using continuous-flow isotope ratio mass spectrometry (CFIRMS), which utilized a Costech ESC 4010 elemental analyzer and Thermo Scientific Conflo IV interfaced with a Thermo Scientific DeltaVPlus Mass Spectrometer [28]. The OC and TN isotopes are referenced to the international standards V-PDB and Air, respectively. Analytical precision was as follows: C = 0.1%, N = 0.1%, δ13C = 0.1‰, and δ15N = 0.15‰. The OC/TN is expressed as the molar ratios of the elements [6,14]. The statistical differences were evaluated using Kruskal−Wallis Analysis of Variance (α = 0.05) grouping variables according to vegetation type (mangrove and saltmarsh) (Table S1), transects (Table S2) and stations (Table S3). The Spearman correlations including all variables were obtained separately for the mangrove and the saltmarsh zones (Table S4). In addition, linear regression analyses were conducted to test the significance of the relationship between percentage contents of OC and δ13C in surficial sediments. Finally, the relative contribution of mangrove-derived organic matter source was calculated using a two-source mixing model [29,30] following the equation:
fmangrove (%) = [(δ13Cnon-mangrove − δ13Cmeasured)/(δ13Cnon-mangrove − δ13Cmangrove)] × 100

3. Results and Discussions

3.1. Factors Driving Carbon and Nutrient Contents in Sediments

The organic matter content and fine particles found in mangrove sediments as compared to the adjacent saltmarsh sediments may obey the differences in the transport and deposition processes between the two sedimentary environments [10,30]. In the presence of mangrove and saltmarsh vegetation, the deposition of sedimentary organic matter is favored due to the prevalence of a relatively low-energy hydrodynamic condition [5,25]. This is because the dense and intricate mesh of roots and pneumatophores of mangrove trees and saltmarsh meadows reduces the intensity of tidal influence and fluvial currents [31,32]. The results we found for this study region indicate that the higher proportions of fine size particles were associated to mangrove zone (Table 1), suggesting that the saltmarsh in this region are less protected against hydrological and aeolian impacts, where a higher influx of aeolian sand derived from the adjacent coastal beaches and dunes may be occurring [30,33]. This statement is congruent with the presence of onshore winds of between 5 and 15 km h−1, which may affect the well-sorted fine size sand transport from the coastal dunes into the saltmarsh zone [18].
Moreover, the higher average OC and TN contents in sediments within the mangrove zone in comparison to that in the saltmarsh zone here (Table S1) may be influenced by a vertical input of particulate OC and TN derived from mangrove litterfall, which may result in higher organic matter and nutrient contents than that from the more sparsely vegetated saltmarsh zone along the Pichavaram estuary [13,32]. Although no data are available for the saltmarsh zone, studies have described that the annual mangrove litterfall in Pichavaram estuary may be up to 1456 g m−2 [22]. Additionally, studies have shown that the sediment accumulation rates within the mangrove zone may be up to 4.5 mm y−1, whereas in the saltmarsh zone are closer to 1.6 mm y−1, as previously found in our study area [34]. These differences may result in lower carbon and nutrient accumulation capacity within saltmarsh zones in comparison with adjacent mangrove zones [10,30]. Another factor driving the OC and TN contents is the difference in sediment grain size, as previous studies have demonstrated a positive correlation between fine sediments and organic matter contents in estuarine systems [25,31] due to the dense roots system of mangroves that favor the formation of clay−organic ligand complexes [35,36]. In addition, the significant higher silt and clay contents within mangrove zones (Table S1) may favor the establishment of more anoxic conditions in sediments [23,32], resulting in a better organic matter preservation and consequently higher carbon and nutrient contents within this zone. These trends were found in our results as the transects associated to mangrove vegetation exhibited higher OC and TN contents in comparison to that associated to saltmarsh vegetation (Table S2), where more than 50% of the saltmarsh stations contained significantly lower OC and TN contents in comparison to mangrove stations (Table S3).
It is worth noting that climate change studies have provided strong evidence linking increasing emissions of anthropogenic greenhouse gases to global warming, which would have direct implications on eustatic sea level rise at rates of 1–3 mm yr−1, resulting in inundation of low-lying coastline worldwide [37,38]. In this context, if the relatively lower-level of saltmarsh zone is inundated earlier than the adjacent mangrove zone, an eventual mangrove expansion due to increment of local sediment accretions rates may occur [3,30]. Nevertheless, this expansion may depend on many other factors, such as local sea level rise, sediment transport, and geomorphology [39,40]. The occurrence of this scenario may produce an increase in carbon and nutrient storage capacity of Pichavaram estuary, since higher average OC and TN contents associated to the mangrove zone are noted (Table S1). The hypothetical scenario based on our findings may be extending to all saltmarsh−mangrove vegetated coastlines that present similar settings, which would imply the increase in regional carbon budgets [5,10].

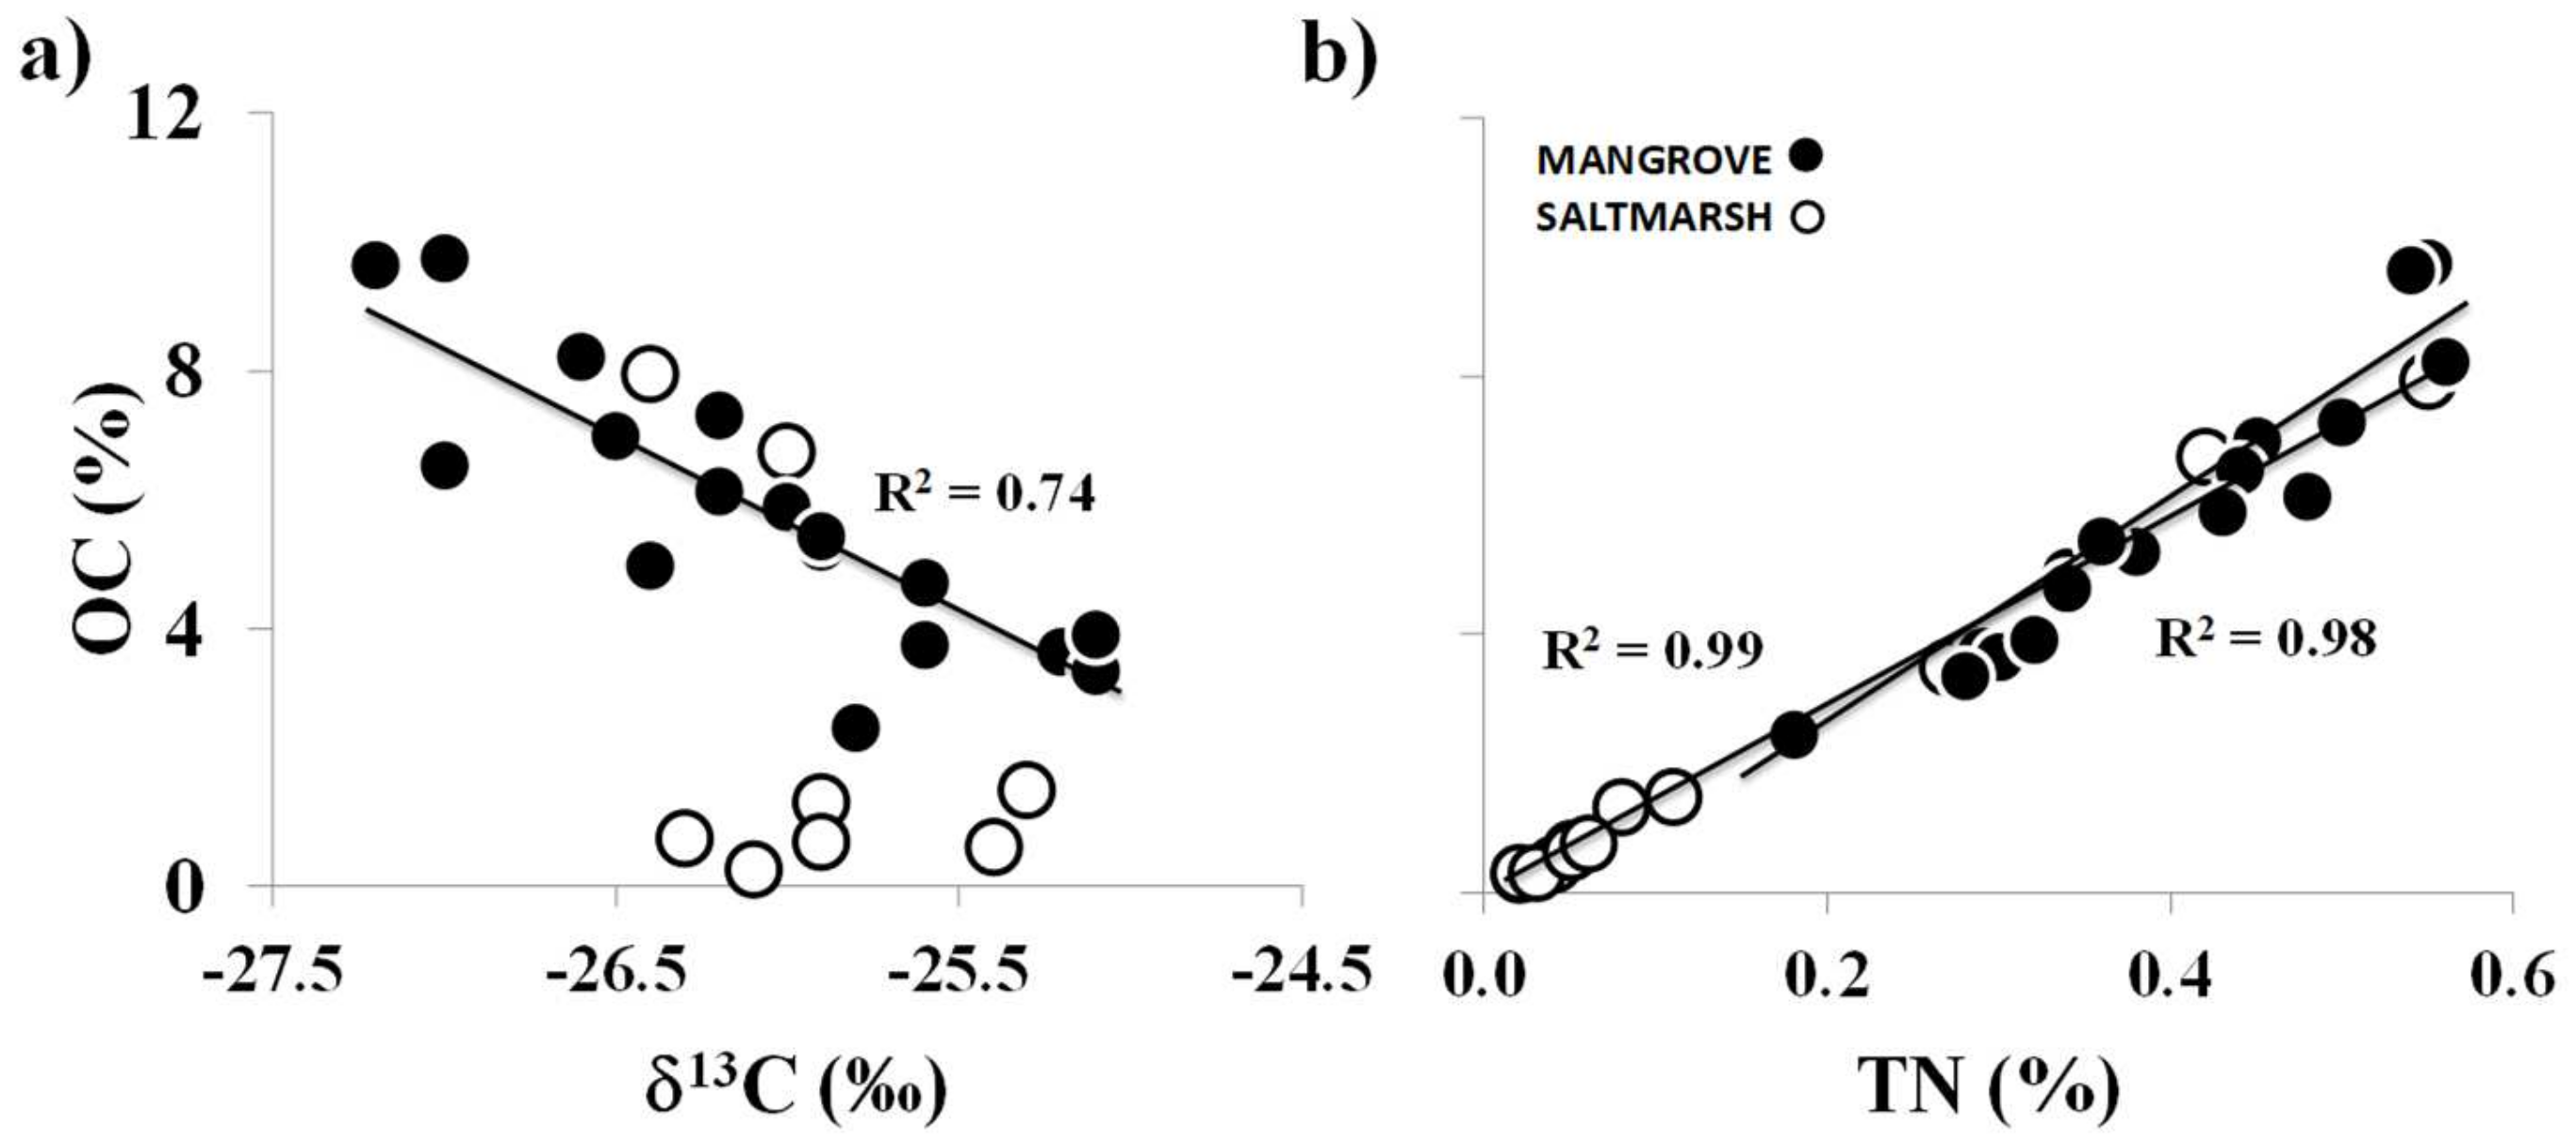
3.2. Sedimentary Organic Matter Sources in Sediments

It is well known that the sedimentary organic matter in mangrove vegetated coastal areas is typically composed of litterfall which may represent up to 30% of the mangrove and saltmarsh vegetation net production [13,41]. Since our study area is dominated by two types of vegetation (i.e., mangrove and saltmarsh), the occurrence of organic matter mixing in surficial sediments is also probable [42,43]. In this study, we applied a two-source mixing model (fmangrove) using stable isotopes [29,30]. This model estimates the relative contribution of mangrove-derived organic matter (Avicennia marina and Rhizophora sp.), compared with the dominant saltmarsh species (Suaeda sp. and Salicornia sp.) which occupy the same ecological niche. It is worth noting that due to the model limitation (C3 and C4 plant differentiation) [44,45], the contribution of Sesuvium sp. may be undistinguishable from the isotopic signature of mangrove plants. The application of this model requires assumptions on the δ13C values for each component [30,46]; this assumption considers the post depositional alteration of isotopic values for sedimentary organic matter [47]. It should be noted that sources derived from terrestrial, planktonic and benthic microalgae organic matter were not accounted for this model.
Here, the lightest isotopic value measured (−27.2‰) was used to represent the mangrove vegetation end-member (Table 1). Conversely, the heaviest isotopic value was used to represent the non-mangrove vegetation end-member (−21.6‰) (Table 1). These mangrove and non-mangrove end-members values are within the range for mangrove-derived and non-mangrove derived organic matter, respectively [48,49]. In addition, studies have described that the average δ13C value for mangrove-derived organic matter in Pichavaram estuary is approximately −28‰ whereas the values for non-mangrove organic matter is approximately −19‰ [34]. The two-source mixing model (fmangrove) exhibited a higher relative mangrove-derived contribution (at least > 50%) in all the mangrove stations, whereas 50% of the saltmarsh stations exhibited the lowest relative mangrove-derived contribution (50% to 10%) (Figure 3). These results indicate the dominance of mangrove-derived organic matter within both sedimentary zones [6,30]. These results are congruent with the correlation between OC contents and δ13C (Figure 4a), confirming the higher dominance of mangrove-derived organic matter in the mangrove zone, whereas the absence of correlation in the saltmarsh zone indicates the higher deposition of allochthonous derived organic matter [50,51,52].
The δ15N values (+2.7 to +3.4‰) observed in this study (Table 1) were comparable with previous studies in Indian estuaries with values near +3.2‰ [34,53], suggesting that the nitrogen deposited in this study is similar to what was found in other C3 wetland vegetation organic matter [14,54]. In addition, the observed linear correlation between OC and TN runs through the origin (Figure 4b), which indicates that the inorganic nitrogen in sediments is negligible in comparison to the total nitrogen deposition [14,55,56]. It is important to mention that studies have described that δ15N values may vary between −10 and +10‰ under anthropogenic fertilization effects [57]; however, this high δ15N variability was not observed along our sampling stations (Table 1). However, the OC/TN ratios in this study exhibited non-significant differences within both sedimentary zones with slightly higher values within the mangrove zones (Table S1). These results suggest that OC/TN ratios are not a good proxy of organic matter source here, though it does indicate the continuous deposition of fresh organic matter deposition [14].
It is worth noting that studies in Godavari estuary, located 300 km north of our study area, have described that the proportions of non-mangrove organic matter (e.g., phytoplankton, seagrasses, etc.) are up to five-fold higher than the mangrove-derived organic matter [58]. These differences may be attributed to regional disparities in geomorphology and carbon sequestration dynamics between relatively ‘flow-through systems’ (e.g., Godavari estuary) and ‘more enclosed systems’ (e.g., Pichavaram) [25,58]. As described here, the type of vegetation and geomorphology may be regulating factors that determine the organic matter source and carbon contents within coastal vegetated areas [52,59,60].

4. Conclusions

This research demonstrated the importance of wetland vegetation in promoting the deposition of organic carbon along intertidal saltmarsh and mangrove sediments. In this study area, up to three-fold higher carbon contents were observed in mangrove zones in comparison to what was found within saltmarsh zones. These differences are likely due to the higher deposition and accumulation of fine particles in the presence of mangrove vegetation in this region. Furthermore, the δ13C values and the mixing model of sedimentary organic matter suggest that the mangrove-derived organic matter is an important source within both sedimentary ecotones. Overall, the results in this research suggest that the increasing presence of wetland vegetation along intertidal zones may increase the carbon retention capacity of estuarine systems in Southeast India, which is important information to conserve coastal wetlands in this region of the world.

Supplementary Materials

The following supporting information can be downloaded at: https://www.mdpi.com/article/10.3390/jmse10010053/s1. Table S1. Kruskal−Wallis Analysis of Variance for contents of OC (%), TN (%), OC/TN (molar ratios), δ13C (‰), δ15N (‰) and silt and clay (%) in sediments within mangroves and saltmarsh zones. Vegetation type: (M) mangrove; (S) saltmarsh. Underlined acronyms represent factors with non-statistical differences among them. Analysis significance: * (p < 0.05). Table S2. Kruskal−Wallis Analysis of Variance for contents of OC (%), TN (%), OC/TN (molar ratios), δ13C (‰), δ15N (‰) and silt and clay (%) in sediments within mangroves and saltmarsh zones. Transects (T). Mangrove (T1M - T6M); Saltmarsh (T1S - T6S). Underlined acronyms represent factors with non-statistical differences among them. Analysis significance: * (p < 0.05). Table S3. Kruskal−Wallis Analysis of Variance for contents of OC (%), TN (%), OC/TN (molar ratios), δ13C (‰), δ15N (‰) and silt and clay (%) in sediments within mangroves and saltmarsh zones. Mangrove stations (M1-M3); Saltmarsh stations (T1S-T6S). Underlined acronyms represent factors with non-statistical differences among them. Analysis significance: * (p < 0.05). Table S4. Spearman correlations for geochemical variables within mangrove and saltmarsh zones. Only significant correlations (p < 0.05) were presented.

Author Contributions

S.A.N.: Conceptualization, writing—original draft preparation. K.K.; J.H.S. and A.L.B.: Methodology & validation. C.J.S.: Methodology, review & editing. A.P.: Review, writing & editing. R.M.P.; T.S.; R.A.N. and R.N.: Conceptualization, review & editing. All authors have read and agreed to the published version of the manuscript.

Funding

This research received no external funding.

Institutional Review Board Statement

Not applicable.

Informed Consent Statement

Not applicable.

Data Availability Statement

Data from this study are available from the corresponding author upon request.

Acknowledgments

This study was part of collaborative research developed in a MOU between the University of Alaska Fairbanks (UAF) and Sathyabama University (SU, Chennai). The study was coordinated by Dean Sashiprabha (SU), Mike Castellini (former Dean, UAF/SFOS), Donna Anger (Director, UAF International Program) and R. V. Rama Rao. At SU, board, lodge, and transport were supported by Chancellor Jeppiaar and arranged by Dean Sashiprabha. The field logistics were provided by CASMB, Annamalai University, Parangipettai. Isotope analysis was by Tim Howe and Norma Haubenstock at the UAF/INE Isotope Laboratory and funded by (UAF/SFOS). C.J.S. is supported by the Australian Research Council (DE160100443, DP150103286 and LE140100083). A.P. was supported by the “Fondo Nacional de Desarrollo Científico Tecnológico y de Innovación Tecnológica” (FONDECYT-PERU) thought the Magnet program (Grant n° 007-2017-FONDECYT) and the “Incorporación de Investigadores” program (Grant n° E038-2019-02-FONDECYT-BM).

Conflicts of Interest

The authors declare no conflict of interest.

References

  1. Kathiresan, K.; Alikunhi, N.M. Tropical coastal ecosystems: Rarely explored for their interaction. Ecologia 2011, 1, 1–22. [Google Scholar] [CrossRef]
  2. Lee, S.Y.; Primavera, J.H.; Dahdouh-Guebas, F.; McKee, K.; Bosire, J.O.; Cannicci, E.; Diele, K.; Fromard, F.; Koedam, N.; Marchand, C.; et al. Ecological role and services of tropical mangrove systems: An assessment. Global Ecol. Biogeogr. 2014, 23, 726–743. [Google Scholar] [CrossRef]
  3. Alongi, D.M. Mangrove forests: Resilience, protection from tsunamis, and response to global climate change. Est. Coast. Shelf Sci. 2008, 76, 339–349. [Google Scholar] [CrossRef]
  4. Marois, D.E.; Mitsch, W.J. Coastal protection from tsunamis and cyclones by mangrove wetlands: A review. Int. J. Biodivers. Sci. Ecosyst. Serv. Mgt. 2015, 11, 71–83. [Google Scholar] [CrossRef]
  5. Alongi, D.M. Carbon Cycling and Storage in Mangrove Forests. Annu. Rev. Mar. Sci. 2014, 6, 195–219. [Google Scholar] [CrossRef]
  6. Sanders, C.J.; Eyre, B.D.; Santos, I.R.; Machado, W.; Luiz-Silva, W.; Smoak, J.M.; Breithaupt, J.L.; Ketterer, M.E.; Sanders, L.; Marotta, H.; et al. Elevated rates of organic carbon, nitrogen, and phosphorus accumulation in a highly impacted mangrove wetland. Geophys. Res. Lett. 2014, 41, 2475–2480. [Google Scholar] [CrossRef]
  7. Donato, D.C.; Kauffman, J.B.; Murdiyarso, D.; Kurnianto, S.; Stidham, M.; Kanninen, M. Mangroves among the most carbon-rich forests in the tropics. Nat. Geosci. 2011, 4, 293–297. [Google Scholar] [CrossRef]
  8. Breithaupt, J.L.; Smoak, J.M.; Smith, T.J.; Sanders, C.J.; Hoare, A. Organic carbon burial rates in mangrove sediments: Strengthening the global budget. Global Biogeochem. Cycles 2012, 26, GB3011. [Google Scholar] [CrossRef]
  9. McLeod, E.; Chmura, G.L.; Bouillon, S.; Salm, R.; Björk, M.; Duarte, C.M.; Lovelock, C.E.; Schlesinger, W.H.; Silliman, B.R. A blueprint for blue carbon: Toward an improved understanding of the role of vegetated coastal habitats in sequestering CO2. Front. Ecol. Environ. 2011, 9, 552–560. [Google Scholar] [CrossRef] [Green Version]
  10. Chmura, G.L.; Anisfeld, S.C.; Cahoon, D.R.; Lynch, J.C. Global carbon sequestration in tidal, saline wetland soils. Glob. Biogeochem. Cycles 2003, 17. [Google Scholar] [CrossRef]
  11. Chen, G.; Azkab, M.H.; Chmura, G.L.; Chen, S.; Sastrosuwondo, P.; Ma, Z.; Dharmawan, I.W.E.; Yin, X.; Chen, B. Mangroves as a major source of soil carbon storage in adjacent seagrass meadows. Sci. Rep. 2017, 7, srep42406. [Google Scholar] [CrossRef] [PubMed]
  12. Pérez, A.; Libardoni, B.G.; Sanders, C.J. Factors influencing organic carbon accumulation in mangrove ecosystems. Biol. Lett. 2018, 14, 20180237. [Google Scholar] [CrossRef] [Green Version]
  13. Kristensen, E.; Bouillon, S.; Dittmar, T.; Marchand, C. Organic carbon dynamics in mangrove ecosystems: A review. Aquat. Bot. 2008, 89, 201–219. [Google Scholar] [CrossRef] [Green Version]
  14. Pérez, A.; Machado, W.; Gutierrez, D.; Smoak, J.M.; Breithaupt, J.L.; Saldarriaga, M.S.; Sanders, L.; Marotta, H.; Sanders, C.J. Carbon and nutrient accumulation in mangrove sediments affected by multiple environmental changes. J. Soils Sediments 2020, 20, 2504–2509. [Google Scholar] [CrossRef]
  15. SFR. Mangroves cover: India State of Forest Report; Forest Survey of India: Dehradun, India, 2015; pp. 63–67. [Google Scholar]
  16. Naidu, A.S. Some aspects of texture, mineralogy and geochemistry of modern deltaic sediments of the Godavari River, India. Ph.D. Thesis, Andhra University, Visakhapatnam, India, 1968; p. 150. [Google Scholar]
  17. Ranjan, R.K.; Ramanathan, A.L.; Singh, G.; Chidambaram, S. Heavy metal enrichments due to tsunami in Pichavaram mangrove sediments. Environ. Mont. Assess. 2008, 147, 389–411. [Google Scholar] [CrossRef] [PubMed]
  18. Jeyabal, G.; Ramasamy, S. Down core variation in sediment characteristics and trace element geochemistry of a core sample in Pichavaram mangrove area, Tamil Nadu southeast coast of India. EnviroGeoChimica. Acta 2014, 1, 206–214. [Google Scholar]
  19. Hemminga, M.A.; Slim, F.J.; Kazungu, J.; Ganssen, G.M.; Nieuwenhuize, J.; Kruyt, N.M. Carbon outwelling from a mangrove forest with adjacent seagrass beds and coral reefs (Gazi Bay, Kenya). Mar. Ecol. Prog. Ser. 1994, 106, 291–302. [Google Scholar] [CrossRef]
  20. Chmura, G.L. What do we need to assess the sustainability of the tidal salt marsh carbon sink? Ocean Coast. Manag. 2013, 83, 25–31. [Google Scholar] [CrossRef]
  21. Duarte, C.M. Reviews and syntheses: Hidden forests, the role of vegetated coastal habitats in the ocean carbon budget. Biogeosciences 2017, 14, 301–310. [Google Scholar] [CrossRef] [Green Version]
  22. Kathiresan, K. A review of studies on Pichavaram mangrove, southeast India. Hydrobiology 2000, 430, 185–205. [Google Scholar] [CrossRef]
  23. Ranjan, R.K.; Routh, J.; Ramanathan, A.L. Bulk organic matter characteristics in the Pichavaram mangrove—Estuarine complex, south-eastern India. Appl. Geochem. 2010, 25, 1176–1186. [Google Scholar] [CrossRef]
  24. Naidu, A.S.; Mowatt, T.C.; Somayajulu, B.L.K.; Rao, K.S. Characteristics of clay minerals in the bed loads of major rivers of India. In SCOPE/UNEP Sonderband Heft 58; University of Hamburg: Hamburg, Germany, 1985; pp. 559–568. [Google Scholar]
  25. Pérez, A.; Gutiérrez, D.; Saldarriaga, M.; Sanders, C.J. Hydrological controls on the biogeochemical dynamics of a Peruvian mangrove system. Hydrobiologia 2017, 803, 69–86. [Google Scholar] [CrossRef]
  26. Kennedy, P.; Kennedy, H.; Papadimitriou, S. The effect of acidification on the determination of organic carbon, total nitrogen and their stable isotopic composition in algae and marine sediment. Rapid Commun. Mass Spectrom. 2005, 19, 1063–1068. [Google Scholar] [CrossRef] [PubMed]
  27. Schlacher, T.A.; Connolly, R.M.; Kurle, C. Effects of acid treatment on carbon and nitrogen stable isotope ratios in ecological samples: A review and synthesis. Methods Ecol. Evol. 2014, 5, 541–550. [Google Scholar] [CrossRef] [Green Version]
  28. Naidu, A.S.; Cooper, L.W.; Grebmeier, J.M.; Whitledge, T.E.; Hameedi, M.J. The continental margin of the North Bering-Chukchi Sea: Distribution, sources, fluxes, and burial rates of organic carbon. In The Arctic Ocean Carbon Cycle: Present and Past; Stein, R., Macdonald, R.W., Eds.; Springer: Berlin/Heidelberg, Germany, 2004; pp. 193–203. [Google Scholar]
  29. Machado, W.; Sanders, C.J.; Santos, I.; Sanders, L.; Silva-Filho, E.; Luiz-Silva, W. Mercury dilution by autochthonous organic matter in a fertilized mangrove wetland. Environ. Pollut. 2016, 213, 30–35. [Google Scholar] [CrossRef]
  30. Pérez, A.; Machado, W.; Gutierrez, D.; Stokes, D.; Sanders, L.; Smoak, J.M.; Santos, I.; Sanders, C.J. Changes in organic carbon accumulation driven by mangrove expansion and deforestation in a New Zealand estuary. Estuar. Coast. Shelf Sci. 2017, 192, 108–116. [Google Scholar] [CrossRef]
  31. Mazda, Y.; Wolanski, E.; King, B.; Sase, A.; Ohtsuka, D.; Magi, M. Drag force due to vegetation in mangrove swamps and saltmarsh. Mangrove Salt Marsh. 1997, 1, 193–199. [Google Scholar] [CrossRef]
  32. Kathiresan, K.; Bingham, B.L. Biology of mangroves and mangrove ecosystems. Adv. Mar. Biol. 2001, 40, 84–254. [Google Scholar]
  33. Ramanathan, A.L. Sediment characteristics of the Pichavaram mangrove environment. Indian J. Mar. Sci. 1997, 26, 319–322. [Google Scholar]
  34. Ranjan, R.K.; Routh, J.; Ramanathan, A.L.; Klump, J.V. Elemental and stable isotope records of organic matter input and its fate in the Pichavaram mangrove-estuarine sediments (Tamil Nadu, India). Mar. Chem. 2011, 126, 163–172. [Google Scholar] [CrossRef]
  35. Bianchi, T.S. Biogeochemistry of Estuaries; OXFORD University Press: Oxford, UK, 2007; p. 706. [Google Scholar]
  36. Keil, G.R.; Mayer, L.M. Mineral matrices and organic matter. In Treatise on Geochemistry, 2nd ed.; Falkowski, P.G., Freeman, K.H., Eds.; Elsevier Ltd.: New York, NY, USA, 2014; Volume 12, pp. 337–359. [Google Scholar]
  37. IPCC. Climate Change 2020, The Physical Scientific Basis: Summary for Policymakers. Available online: http://www.ipcc.ch (accessed on 29 December 2021).
  38. Holland, D. On the rocks: The challenges of predicting sea level rise. EOS 2015, 96, 9–12. [Google Scholar] [CrossRef]
  39. Kirwan, M.L.; Temmerman, S.; Skeehan, E.E.; Guntenspergen, G.R.; Fagherazzi, S. Overestimation of marsh vulnerability to sea level rise Matthew. Nat. Clim. Chang. 2016, 6, 253–260. [Google Scholar] [CrossRef]
  40. Peck, E.K.; Wheatcroft, R.A.; Brophy, L.S. Controls on Sediment Accretion and Blue Carbon Burial in Tidal Saline Wetlands: Insights From the Oregon Coast, USA. J. Geophys. Res. Biogeosci. 2020, 125, e2019JG005464. [Google Scholar] [CrossRef]
  41. Jennerjahn, T.C.; Ittekot, V. Relevance of mangroves for the production and depositionof organic matter along tropical continental margins. Naturwissenschaften 2002, 89, 21–30. [Google Scholar] [CrossRef]
  42. Fry, B.; Sherr, E.B. δ13C measurements as indicators of carbon flow in marine and freshwater ecosystems. Contrib. Mar. Sci. 1984, 27, 13–47. [Google Scholar]
  43. Boutton, T.W. Stable carbon isotope ratios of natural materials, II: Atmospheric, terrestrial, marine, and freshwater environments. In Carbon Isotope Techniques; Coleman, D.C., Fry, B., Eds.; Academic Press Inc.: San Diego, CA, USA, 1991; pp. 177–185. [Google Scholar]
  44. Middelburg, J.J. Stable isotopes dissect aquatic food webs from the top to the bottom. Biogeosciences 2014, 11, 2357–2371. [Google Scholar] [CrossRef] [Green Version]
  45. Rullkötter, J. Organic Matter: The Driving Force for Early Diagenesis. In Marine Geochemistry; Shulz, H.D., Zabel, M., Eds.; Springer: Berlin/Heidelberg, Germany, 2006; pp. 125–168. [Google Scholar]
  46. Schultz, D.; Calder, J.A. Organic carbon 13C/12C variations in estuarine sediments. Geochim. Cosmochim. Acta 1976, 40, 381–385. [Google Scholar] [CrossRef]
  47. Jiménez-Arias, J.L.; Morris, E.; Rubio-de-Inglés, M.J.; Peralta, G.; García-Robledo, E.; Corzo, A.; Papaspyrou, S. Tidal elevation is the key factor modulating burial rates and composition of organic matter in a coastal wetland with multiple habitats. Sci. Total Environ. 2020, 724, 138205. [Google Scholar] [CrossRef]
  48. Maher, D.T.; Santos, I.R.; Golsby-Smith, L.; Gleeson, J.; Eyre, B.D. Ground water derived dissolved inorganic and organic carbon exports from a mangrove tidal creek: The missing mangrove carbon sink? Limnol. Oceanogr. 2013, 58, 475–488. [Google Scholar] [CrossRef]
  49. Rezende, E.C.; Lacerda, D.L.; Ovalle, A.R.C.; Silva, R.C.A.; Martinelli, A.L. Nature of POC transport in a mangrove ecosystem: A carbon isotopic study. Estuar. Coast. Shelf Sci. 1990, 30, 641–645. [Google Scholar] [CrossRef]
  50. Middelburg, J.J.; Nieuwenhuize, J.; Lubberts, R.K.; van de Plassche, O. Organic carbon isotope systematics of coastal marshes. Estuar. Coast. Shelf Sci. 1997, 45, 681–687. [Google Scholar] [CrossRef]
  51. Watanabe, K.; Kuwae, T. How organic carbon derived from multiple sources contributes to carbon sequestration processes in a shallow coastal system? Glob. Chang. Biol. 2015, 21, 2612–2623. [Google Scholar] [CrossRef]
  52. Santos, R.; Duque-Núñez, N.; de los Santos, C.B.; Martins, M.; Carrasco, A.R.; Veiga-Pires, C. Superficial sedimentary stocks and sources of carbon and nitrogen in coastal vegetated assemblages along a flow gradient. Sci. Rep. 2019, 9, 610. [Google Scholar] [CrossRef]
  53. Muzuka, A.N.N.; Shunula, J.P. Stable isotope composition of organic carbon and nitrogen of two mangrove stands along the Tanzanian coastal zone. Est. Coast. Shelf Sci. 2006, 66, 447–458. [Google Scholar] [CrossRef]
  54. McKee, K.; Feller, I.C.; Popp, M. Mangrove isotopic (δ15N and δ13C) fractionation across a nitrogen vs. phosphorus limitation gradient. Ecology 2002, 83, 1065–1075. [Google Scholar] [CrossRef]
  55. Müller, A.; Mathesius, U. The palaeoenvironments of coastal lagoons in the southern Baltic Sea, I. The application of sedimentary C org/N ratios as source indicators of organic matter. Palaeogeogr. Palaeoclimatol. Palaeoecol 1999, 145, 17–32. [Google Scholar] [CrossRef]
  56. Andrews, J.E.; Greenaway, A.M.; Dennis, P.F. Combined carbon isotope and C/N ratios as indicators of source and fate of organic matter in a poorly flushed, tropical estuary: Hunts Bay, Kingston Harbour, Jamaica. Estuar Coast Shelf Sci. 1998, 46, 743–756. [Google Scholar] [CrossRef]
  57. Kendall, C.; Elliott, E.M.; Wankel, S.D. Tracing anthropogenic inputs of nitrogen to ecosystems. In Stable Isotopes in Ecology and Environmental Science; Michener, R.H., Lajtha, K., Eds.; Blackwell Publishing: Hoboken, NJ, USA, 2007; pp. 375–449. [Google Scholar]
  58. Bouillon, S.; Frankignoulle, M.; Velimirov, B.; Eiler, A.; Abril, G.; Etcheber, H.; Borges, A. Inorganic and organic biogeochemistry in the Gautami Godavari estuary (Andhra Pradesh, India) during pre-monsoon: The local impact of extensive mangrove forests. Glob. Biogeochem. Cycles 2003, 17, 1114–1127. [Google Scholar] [CrossRef] [Green Version]
  59. Ricart, A.M.; Pérez, M.; Romero, J. Landscape configuration modulates carbon storage in seagrass sediments. Estuar. Coast. Shelf Sci. 2017, 185, 69–76. [Google Scholar] [CrossRef]
  60. Ricart, A.M.; York, P.H.; Bryant, C.V.; Rasheed, M.A.; Ierodiaconou, D.; Macreadie, P.I. High variability of Blue Carbon storage in seagrass meadows at the estuary scale. Sci. Rep. 2020, 10, 5865. [Google Scholar] [CrossRef] [PubMed] [Green Version]
Figure 1. Map of the study area within Pichavaram estuary. Red circle indicates the sampling site.
Jmse 10 00053 g001
Figure 2. Schematic illustration of sampling stations. TR: transects (1–6). M: mangrove stations. S: saltmarsh stations.
Jmse 10 00053 g002
Figure 3. Percent contribution of mangrove-derived organic matter (fmangrove) within sampling stations. TR: transects (1–6). M: mangrove stations. S: saltmarsh stations. Red squares: 95% to >80%; Yellow squares: 80% to >50%; Blue squares: 50% to 10%.
Jmse 10 00053 g003
Figure 4. (a) Relation between organic carbon (OC) vs. δ13C. (b) Relation between organic carbon (OC) vs. total nitrogen (TN) for mangrove and saltmarsh zones.
Jmse 10 00053 g004
Table 1. Distribution of OC (%), TN (%), OC/TN (molar ratio, δ13C (‰), δ15N (‰), silt and clay (%) in surficial sediments of mangroves and the adjacent saltmarsh zone.
StationsOC
(%)
TN
(%)
OC/TNδ13C
(‰)
δ15N
(‰)
Silt and Clay
(%)
Mangrove zoneTR1-M16.10.511.0−26.2+3.675.0
TR1-M27.00.513.0−26.5+2.981.8
TR1-M33.70.311.0−25.6+2.661.9
TR2-M17.30.513.0−26.2+3.563.6
TR2-M29.70.615.0−27.0+3.663.6
TR2-M39.60.515.0−27.2+3.472.2
TR3-M18.20.613.0−26.6+2.984.2
TR3-M25.00.313.0−26.4+3.557.7
TR3-M34.70.312.0−25.6+3.572.9
TR4-M16.50.413.0−27.0+3.772.7
TR4-M25.30.412.0−25.9+3.570.0
TR4-M33.60.311.0−25.2+3.777.1
TR5-M12.50.212.0−25.8+3.957.1
TR5-M23.30.310.0−25.1+4.470.5
TR5-M33.90.310.0−25.1+4.036.4
TR6-M15.90.412.0−26.0+3.295.5
TR6-M25.40.413.0−25.9+3.481.2
TR6-M33.90.310.0−25.1+4.07.4
Saltmarsh zoneTR1-S11.30.114.0−25.9+3.615.5
TR1-S30.70.112.0−25.9+3.49.8
TR1-S53.50.311.0−23.2+3.726.9
TR3-S10.30.012.0−26.1+2.54.0
TR3-S30.30.012.0−23.9+3.63.7
TR3-S51.50.112.0−25.3+2.412.5
TR5-S10.50.010.0−23.0+3.18.1
TR5-S30.30.010.0−21.6+3.83.9
TR5-S57.90.612.0−26.4+3.145.0
TR6-S10.60.111.0−25.4+3.611.8
TR6-S30.80.111.0−26.3+3.510.4
TR6-S56.80.414.0−26.0+3.371.4
Publisher’s Note: MDPI stays neutral with regard to jurisdictional claims in published maps and institutional affiliations.

