Article

Estimation of Phytoplankton Size Classes in the Littoral Sea of Korea Using a New Algorithm Based on Deep Learning

1
National Institute of Fisheries and Sciences, Gijan Haean-ro, Gijang Gun, Busan 15807, Korea
2
Geosystem Research Corporation, Department of Marine Forecast, 306, 172 LS-ro, Gunpo-si 15807, Korea
*
Authors to whom correspondence should be addressed.
J. Mar. Sci. Eng. 2022, 10(10), 1450; https://doi.org/10.3390/jmse10101450
Submission received: 30 August 2022 / Revised: 1 October 2022 / Accepted: 5 October 2022 / Published: 7 October 2022

Abstract

:
The size of phytoplankton (a key primary producer in marine ecosystems) is known to influence the contribution of primary productivity and the upper trophic level of the food web. Therefore, it is essential to identify the dominant sizes of phytoplankton while inferring the responses of marine ecosystems to change in the marine environment. However, there are few studies on the spatio-temporal variations in the dominant sizes of phytoplankton in the littoral sea of Korea. This study utilized a deep learning model as a classification algorithm to identify the dominance of different phytoplankton sizes. To train the deep learning model, we used field measurements of turbidity, water temperature, and phytoplankton size composition (chlorophyll-a) in the littoral sea of Korea, from 2018 to 2020. The new classification algorithm from the deep learning model yielded an accuracy of 70%, indicating an improvement compared with the existing classification algorithms. The developed classification algorithm could be substituted in satellite ocean color data. This enabled us to identify spatio-temporal variation in phytoplankton size composition in the littoral sea of Korea. We consider this to be highly effective as fundamental data for identifying the spatio-temporal variation in marine ecosystems in the littoral sea of Korea.

1. Introduction

Environmental condition (temperature, salinity, nutrients, and light availability) change impacts on the structure and functions of marine ecosystems, especially phytoplankton, which play a critical role as primary producers in the biogeochemical cycles of marine ecosystems [1,2,3]. Physical and chemical variations in the ocean are known to influence the primary production, photosynthetic properties, and size of phytoplankton [2]. The West, South, and East Seas comprise the littoral sea of Korea. Their surface water temperatures are increasing two to four times faster than global temperatures [4]. Previous studies have continuously reported variations in biological properties, such as the blooming cycle of phytoplankton, community fluctuations, and effects on the upper trophic level [5,6,7,8]. In particular, several recent papers have reported that the proportion of small phytoplankton is increasing, owing to warming water temperatures [9,10,11,12]. The dominant size distribution of phytoplankton plays a critical role in variations in energy efficiency and primary productivity for upper trophic marine organisms [13,14,15,16,17]. The physiological characteristics of phytoplankton are also highly related to its size; therefore, it plays a crucial role in the identification of the impacts of environmental change on marine ecosystems [17]. Nevertheless, there is inadequate long-term information on the community fluctuations and spatio-temporal distributions of phytoplankton according to size. A method to identify these long-term spatio-temporal distributions involves chlorophyll-a, using satellite ocean color [18]. However, previous studies have focused on investigations related to the total amount of phytoplankton. Recently, it has been considered more important to identify the impacts of change on variations in the environment and phytoplankton structure [19]. Although studies related to the contributions of the dominant phytoplankton size in the littoral sea of Korea have been reported, research on the long-term spatio-temporal distributions in the littoral sea is inadequate. Therefore, a method to identify the long-term spatio-temporal distributions of dominant phytoplankton size is essential.
The dominant size of phytoplankton is generally divided into three sizes (referred to as phytoplankton size classes (PSCs)): micro-size phytoplankton (>20 µM), nano-size phytoplankton (2–20 µM), and pico-size phytoplankton (<2 µM). Researchers are attempting to perform studies on PSCs using various methods (microscopy, flow-cytometry, filters, pigment analysis). However, it is difficult to identify the long-term spatio-temporal characteristics of variations in PSCs owing to the limitations of data observed in the field [17]. Researchers recently developed a method to identify the spatio-temporal distributions of phytoplankton size compositions using ocean color data [20,21,22]. There are two commonly used types of PSCs algorithms: spectral-based and abundance-based algorithms [21,23]. Spectral-based algorithms perform estimation using correlations with the properties of PSCs that vary with optical characteristics [24,25,26,27]. This method is highly sensitive to optical characteristics and is difficult use in ocean waters with high turbidity [28,29]. Abundance-based algorithms perform estimation using the statistical correlation between total chlorophyll-a concentration and composition according to phytoplankton size [30,31]. This method has difficulty reflecting both regional characteristics and characteristics in ocean waters with a complex environment [17]. To enhance the estimation accuracy of PSCs, an algorithm needs to be developed that can reflect the variations in phytoplankton communities according to time and environmental transitions by using an abundance-based algorithm that considers physical factors [18,32,33]. Deep learning techniques, distinct from existing methods, are drawing attention as tools to develop the algorithm. Furthermore, the distribution of PSCs in oceans worldwide can be determined by applying physical characteristics and spatiotemporal variations in PSCs and PFTs (Phytoplankton Functional Types) by using actual machine learning techniques [34].
The objective of this study is to develop a PSCs algorithm, which includes environmental factors, using deep learning techniques and lays a foundation for identifying the spatio-temporal distributions of PSCs. We develop a new algorithm to estimate PSCs from satellite ocean color data, which enables spatio-temporal analysis that is missing in observations and may contribute to understanding the variations in marine ecosystems caused by environmental changes.

2. Data and Methods

2.1. Field Observation Data

This study used observation data (2018–2020) from the National Institute of Fisheries Science (NIFS) to develop a new PSCs algorithm applicable to the East, West, South Seas (which comprise the littoral sea of Korea), and the East China Sea. Using the ocean observation data from the main institute and regional research centers of the NIFS, we developed the new algorithm based on data observed at the sea surface at 60 stations (Figure 1) in spring (April–May), summer (August), fall (October–November), and winter (February). Details of the survey stations are shown in Supplementary Table S1.
The parameters used to develop the new algorithm were total chlorophyll-a, size-fractionated chlorophyll-a (micro, nano, and pico size), total suspended solids (TSS), and sea surface water temperature (SST). The data were collected and observed using a rosette sampler and CTD (SBE-911, Seabird Electronics Inc., Bellevue, WA, United States) installed on the vessel. To measure the total chlorophyll-a in the collected seawater, it was filtered with a 25 mm GF/F (Whatman) and stored in a freezer (−70 °C). To measure size-fractionated chlorophyll-a (micro, nano, and pico size), the seawater was sequentially filtered on 20 and 2 μm Nuclepore membrane filters (47 mm) and then 47 mm GF/F (pore size: 0.7 µm), and stored in a freezer (−70 °C). Then, chlorophyll-a was extracted in a laboratory with 90% acetone over 24 h using the method specified by Parson et al. [35] and was analyzed using the 10-AU device. The weight before and after filtering was measured using a precombusted 47 mm GF/F to analyze TSS.

2.2. Training and Model Structure

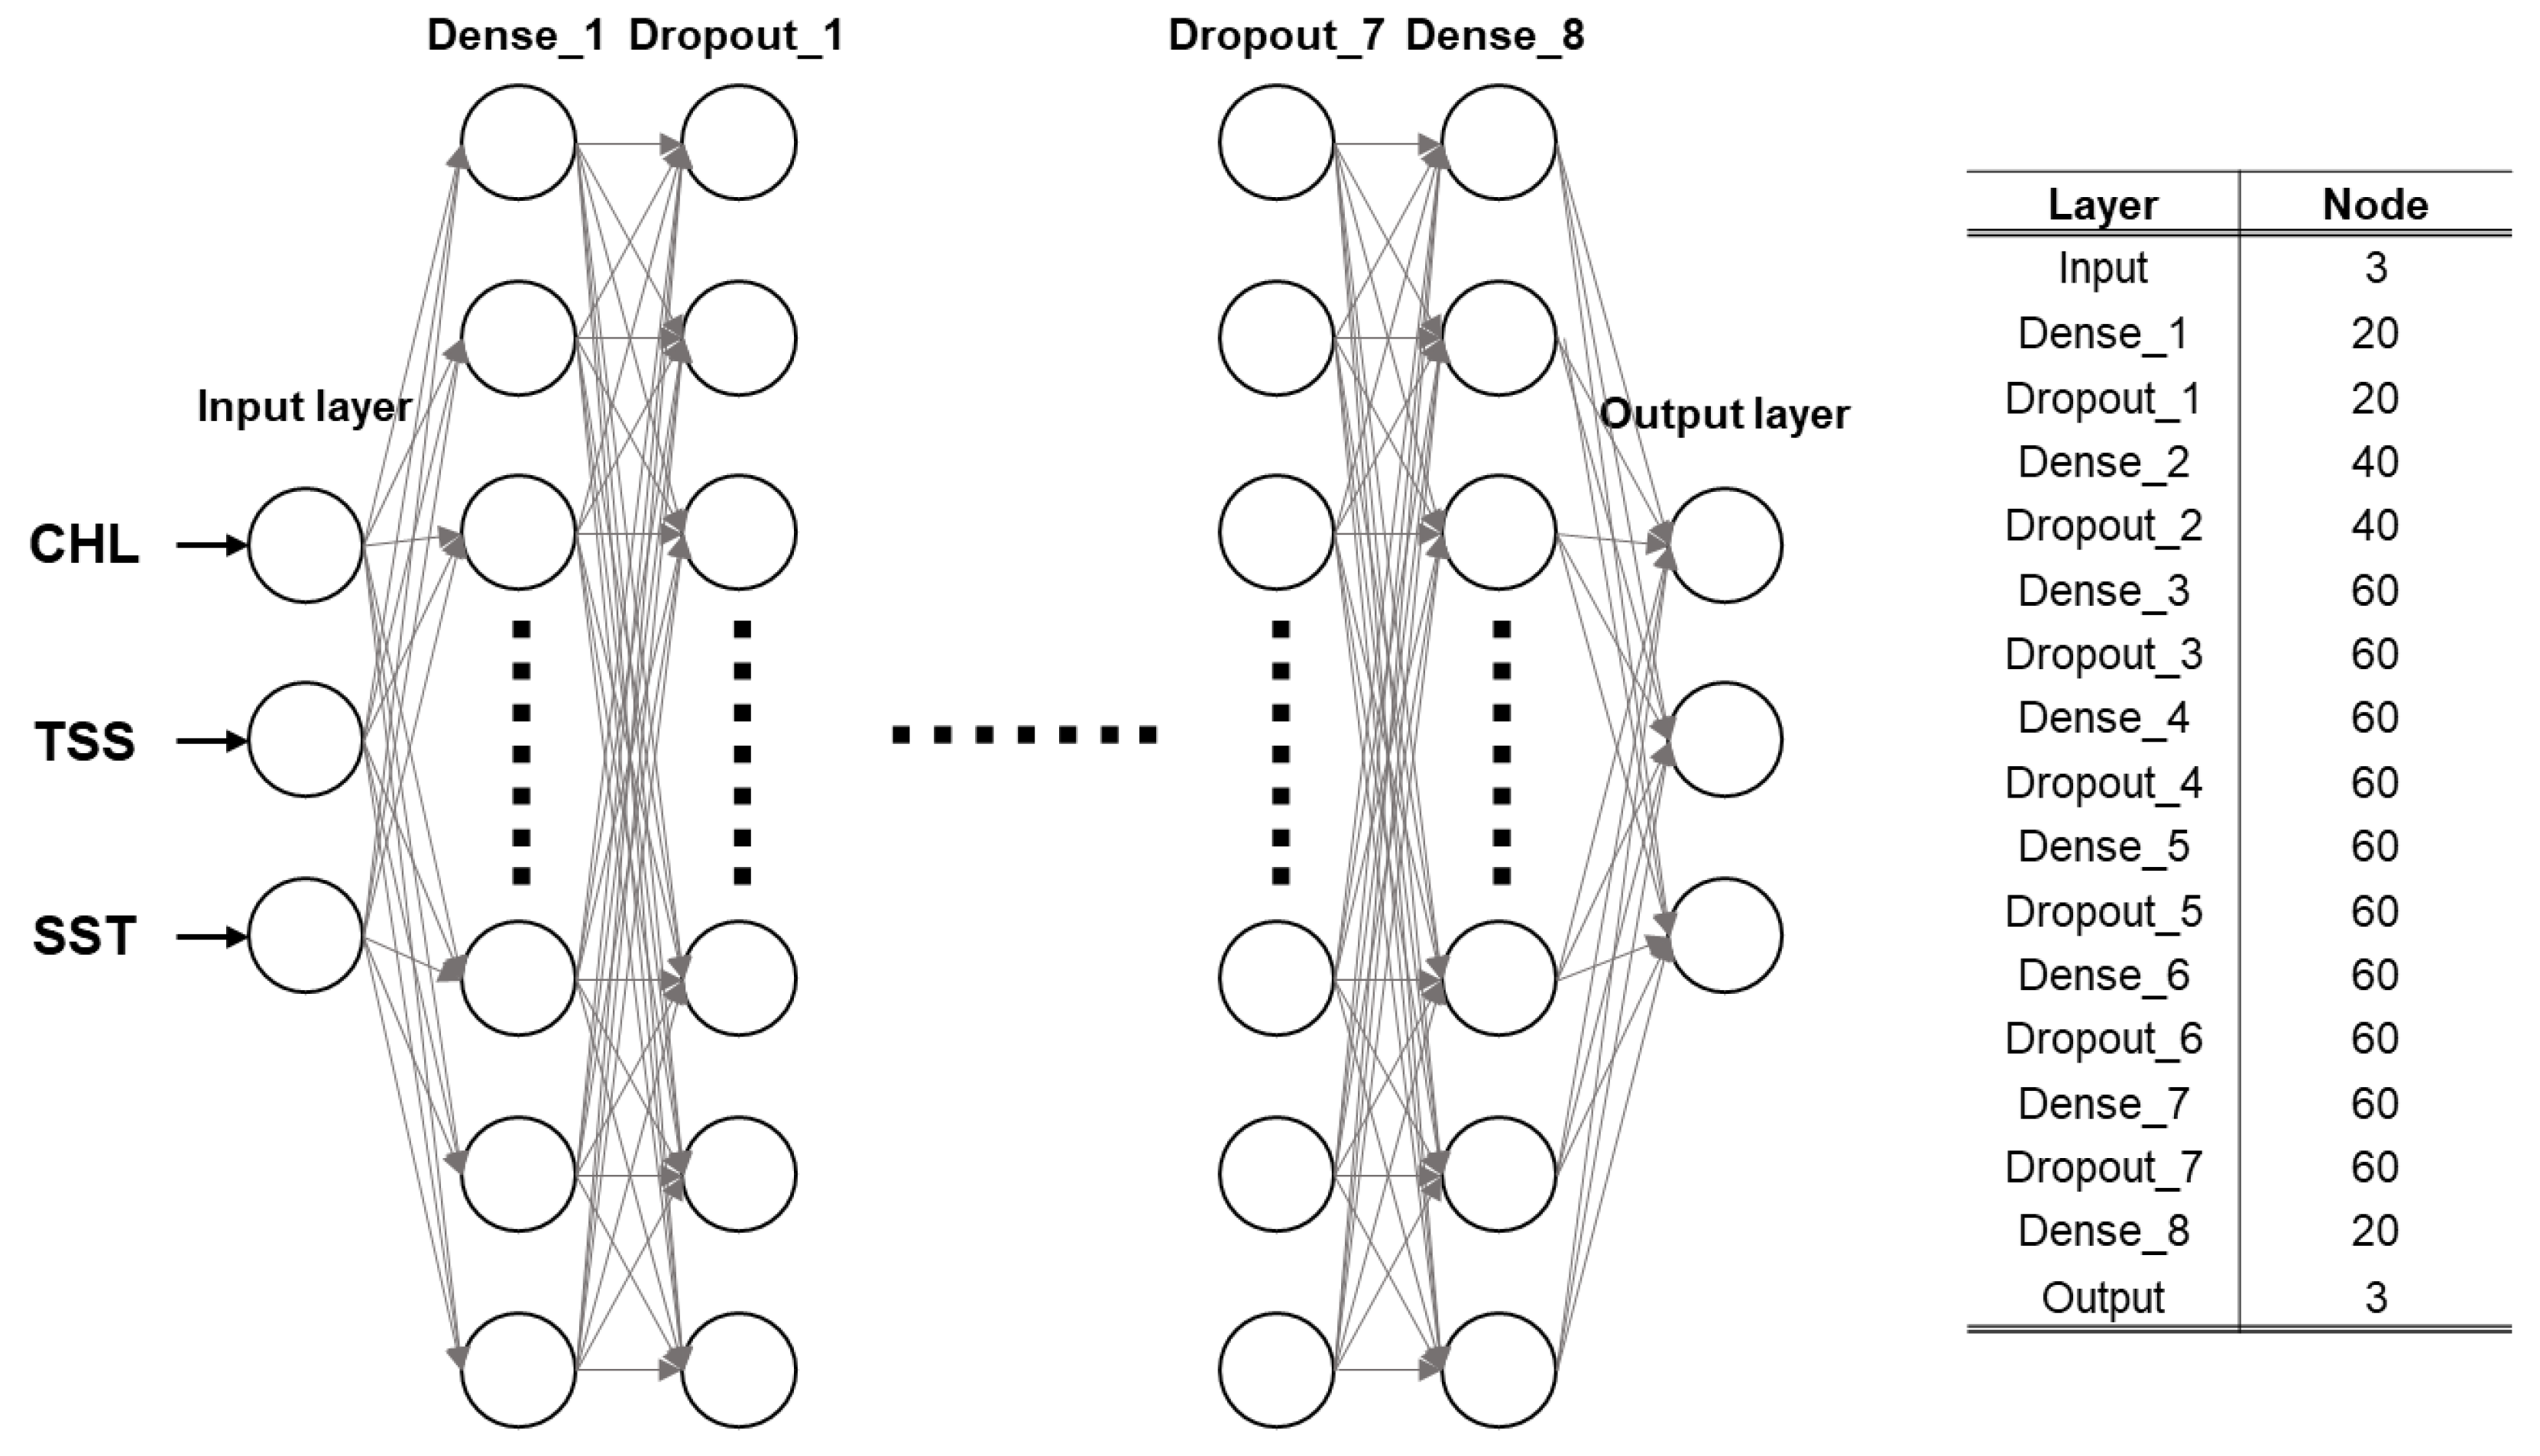
In this study, a deep neural network (DNN) based model was used to construct the new algorithm for phytoplankton size classification, which was station-based. As training data, the above-mentioned parameters (Section 2.1) were used to train the model, which were obtained by field observation. The total chlorophyll-a (total phytoplankton biomass; unit: μg L−1, n = 531), TSS (determination factor of turbidity in study areas; unit: μg L−1, n = 531), and SST (controlling factor of phytoplankton size; unit: °C, n = 531) were used as input variables, whereas the size fractionated chlorophyll-a, obtained in a laboratory using the Parson method [35], was used as ground truth data classifying the three categorical types (micro-size phytoplankton, n = 126; nano-size phytoplankton, n = 99; pico-size phytoplankton, n = 306; Table 1) corresponding with the dominant size. In other words, the ground truth data (dominant size of phytoplankton in each area; unit: character types) were used to train and validate the output layer of the DNN-based model for each input variable to develop the new algorithm for phytoplankton size classification (Figure 2). Of the total 531 pieces of station dataset input variables: total chlorophyll-a (n = 531), TSS (n = 531), and SST (n = 531); ground truth data: size fractionated chlorophyll-a (n = 531)], 210 pieces were used for the training dataset, and 30 pieces were used for validation dataset in the model training process. The training and validation datasets were composed of 70 and 10 pieces of each class, respectively, in order to prevent over-fitting to a specific class in the training process. The remaining 291 pieces were used as the test dataset, validating the final trained model.
Figure 2 shows the DNN-based model structure of this study. In an input layer, the three input variables (total chlorophyll-a, TSS, and SST) were used and a sigmoid function was used as an activation function (Equation (1)). The sigmoid function has a characteristic of a curve shape, so it prevents a divergence of each value. The hidden layers were comprised as eight dense layers, and a hyperbolic tangent function was used for the activation function of each layer (Equation (2)). In terms of shape, the hyperbolic tangent function is similar to the sigmoid function as used in the input layer. However, it is faster than the sigmoid function in terms of optimization. Therefore, it is possible to train the model by densely stacking each layer and solving a non-linearity problem efficiently. Each hidden layer consisted of 20–60 nodes per dense layer. Between the dense layers, the dropout layers were combined to prevent the model over-fitting to a specific class during training. The last layer, the output layer, used the soft-max function to classify the dominant phytoplankton size classes (Equation (3)). In the processing of training, an Adam and a categorical cross-entropy were applied for the model training optimizer and the loss function, respectively. The training epochs and batch size were set to 2000 and 10, respectively, so the weights were configured to update 21 times per epoch. In addition, training was configured to stop early if the loss function value for the validation dataset did not improve within 80 epochs, in order to reduce the over-fitting and the model execution time.
σ ( x ) = 1 1 + e x p x
tanh ( x ) = e x p x e x p x e x p x + e x p x  
y k = e x p ( a k ) i = 1 n e x p ( a i )

2.3. Satellite Data

Using the new algorithm based on the final trained model, this study used satellite ocean color data to identify the spatio-temporal distribution of dominant phytoplankton size classes. The collected satellite data was a VIIRS-SNPP (Visible and Infrared Imager/Radiometer Suite-Suomi National Polar-orbiting Partnership) by the OBPG (Ocean Biology Processing Group) at NASA Goddard Space Flight Center accessed on 9 May 2022 (https://oceandata.sci.gsfc.nasa.gov/VIIRS-SNPP/), and consisted of monthly level-3 data on reflectance of remote sensing at 551 nm (Rrs551), total chlorophyll-a, and SST from 2018 to 2020. TSS, which needs a trained model as an input variable, was estimated using a previously developed algorithm [36] with Rrs551. By assumption, and due to no significant difference between the satellite ocean color data and in-situ data, this study used the satellite data to identify the spatio-temporal distribution of dominant phytoplankton size classes.

3. Results and Discussion

3.1. Results of DNN-Based Model for PSCs

We verified the accuracy of the trained DNN-based model results using classification performance evaluation indicators. Then, the model was analyzed using Equations (4)–(7) with the classification of the confusion matrix in Table 2. According to the confusion matrix, a result is considered true positive (TP) if both prediction and measurement are correct, false positive (FP) if the actual incorrect answer is predicted as correct, false negative (FN) if the actual correct answer is predicted as incorrect, and true negative (TN) if the actual incorrect answer is predicted as incorrect.
We used four parameters to verify the model performance: precision (Equation (4)), recall (Equation (5)), accuracy (Equation (6)), and F1-score (Equation (7)). Table 2 lists the results obtained using the equations.
Precision = T P T P + F P
Recall = T P T P + F N
Accuracy = T P + T N T P + F N + F P + T N
F 1 score = 2 × P r e c i s i o n × R e c a l l P r e c i s i o n + r e c a l l
We used 291 pieces of data excluding the training and validation data (46 micro-size phytoplankton (16%), 19 nano-size phytoplankton (6%), and 226 pico-size phytoplankton (78%)) to verify the accuracy of the developed classification model. The precision, recall, and F1-score for micro-size phytoplankton, nano-size phytoplankton, and pico-size phytoplankton are 34.8%, 45.7%, and 39.5; 42.1%, 17.8%, and 25%; and 80.9%, 85.8%, and 82.8%, respectively. The model yielded an overall accuracy of 70.5% (Table 3). An examination of the test dataset results of the trained DNN-based model revealed that the accuracy of 70% exceeds that of the existing methods for the waters surrounding the Korean Peninsula. However, the accuracy of the training data, validation data, and test data of the DNN-based model differ moderately. With regard to the accuracy of the training set, the precision for pico-size phytoplankton is high. The high accuracy is attributed partially to the large proportion of pico-size phytoplankton in the test dataset at 78%. This is because the model mainly estimates pico-size phytoplankton, which is the dominant phytoplankton size observed in the littoral sea of Korea. Regular acquisition of observations to increase the data would help improve the accuracy of the DNN-based model.

3.2. Estimation of Phytoplankton Size Classes in the Littoral Sea of South Korea Using Satellite

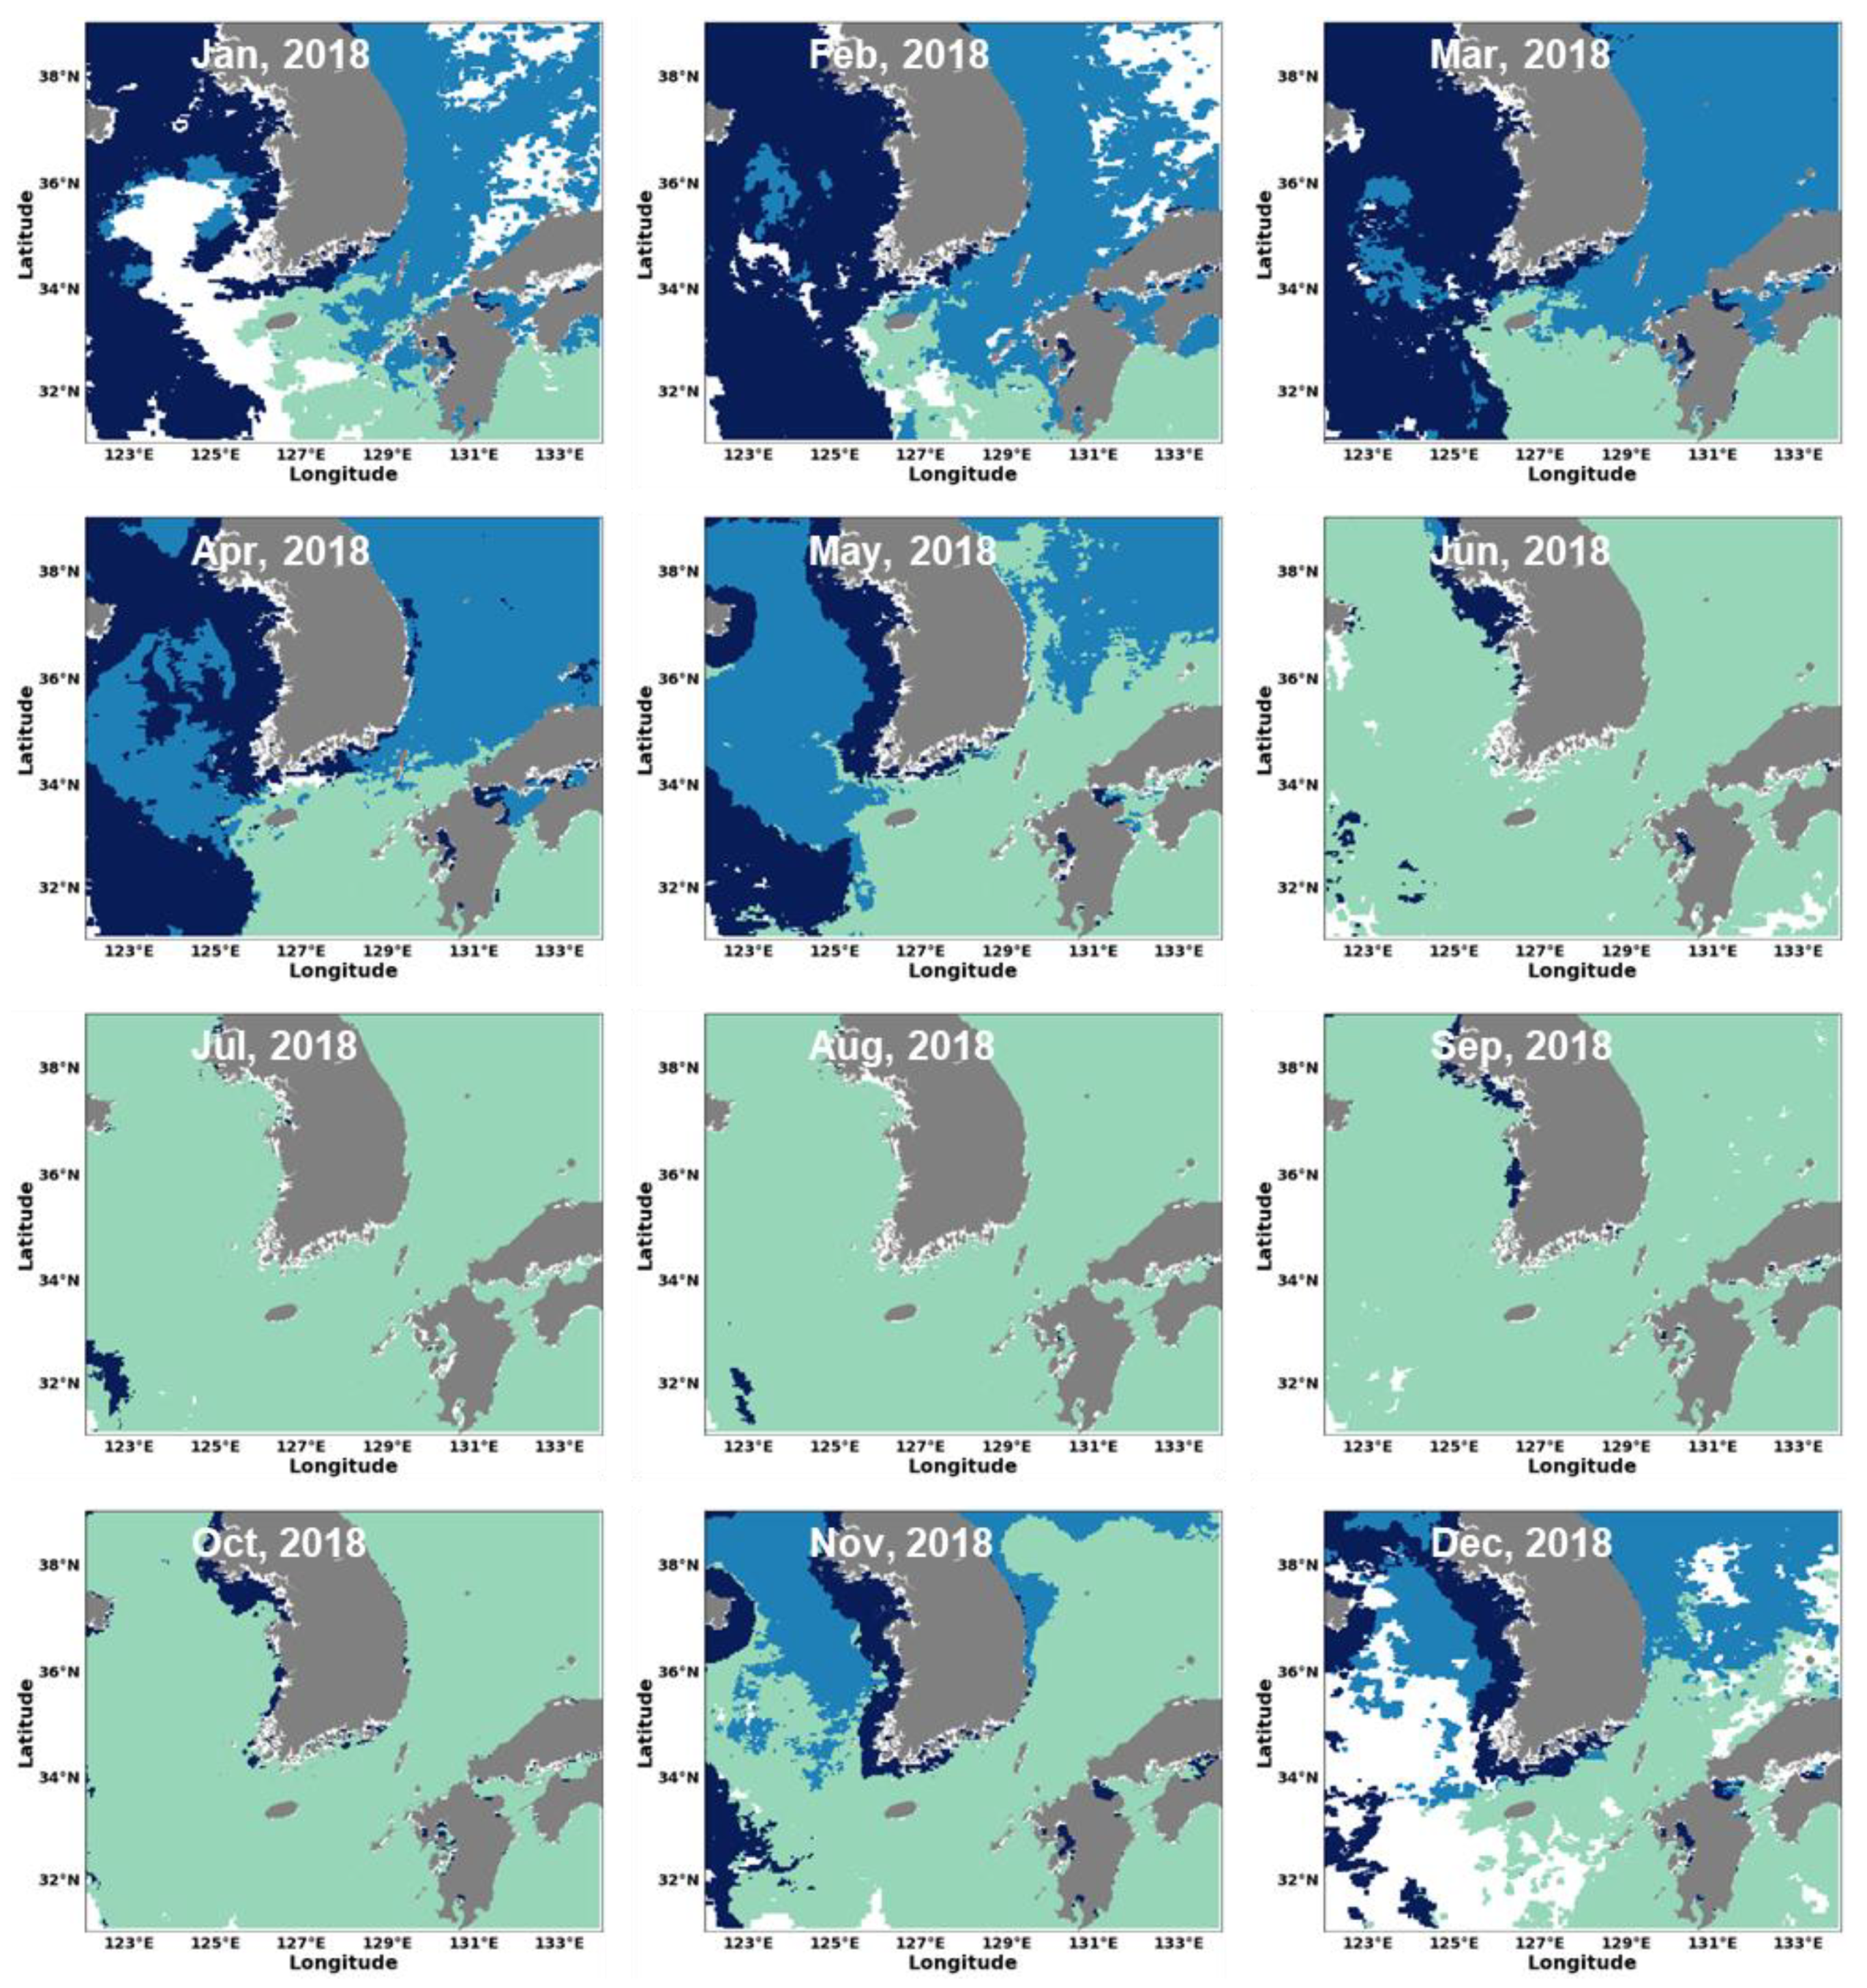
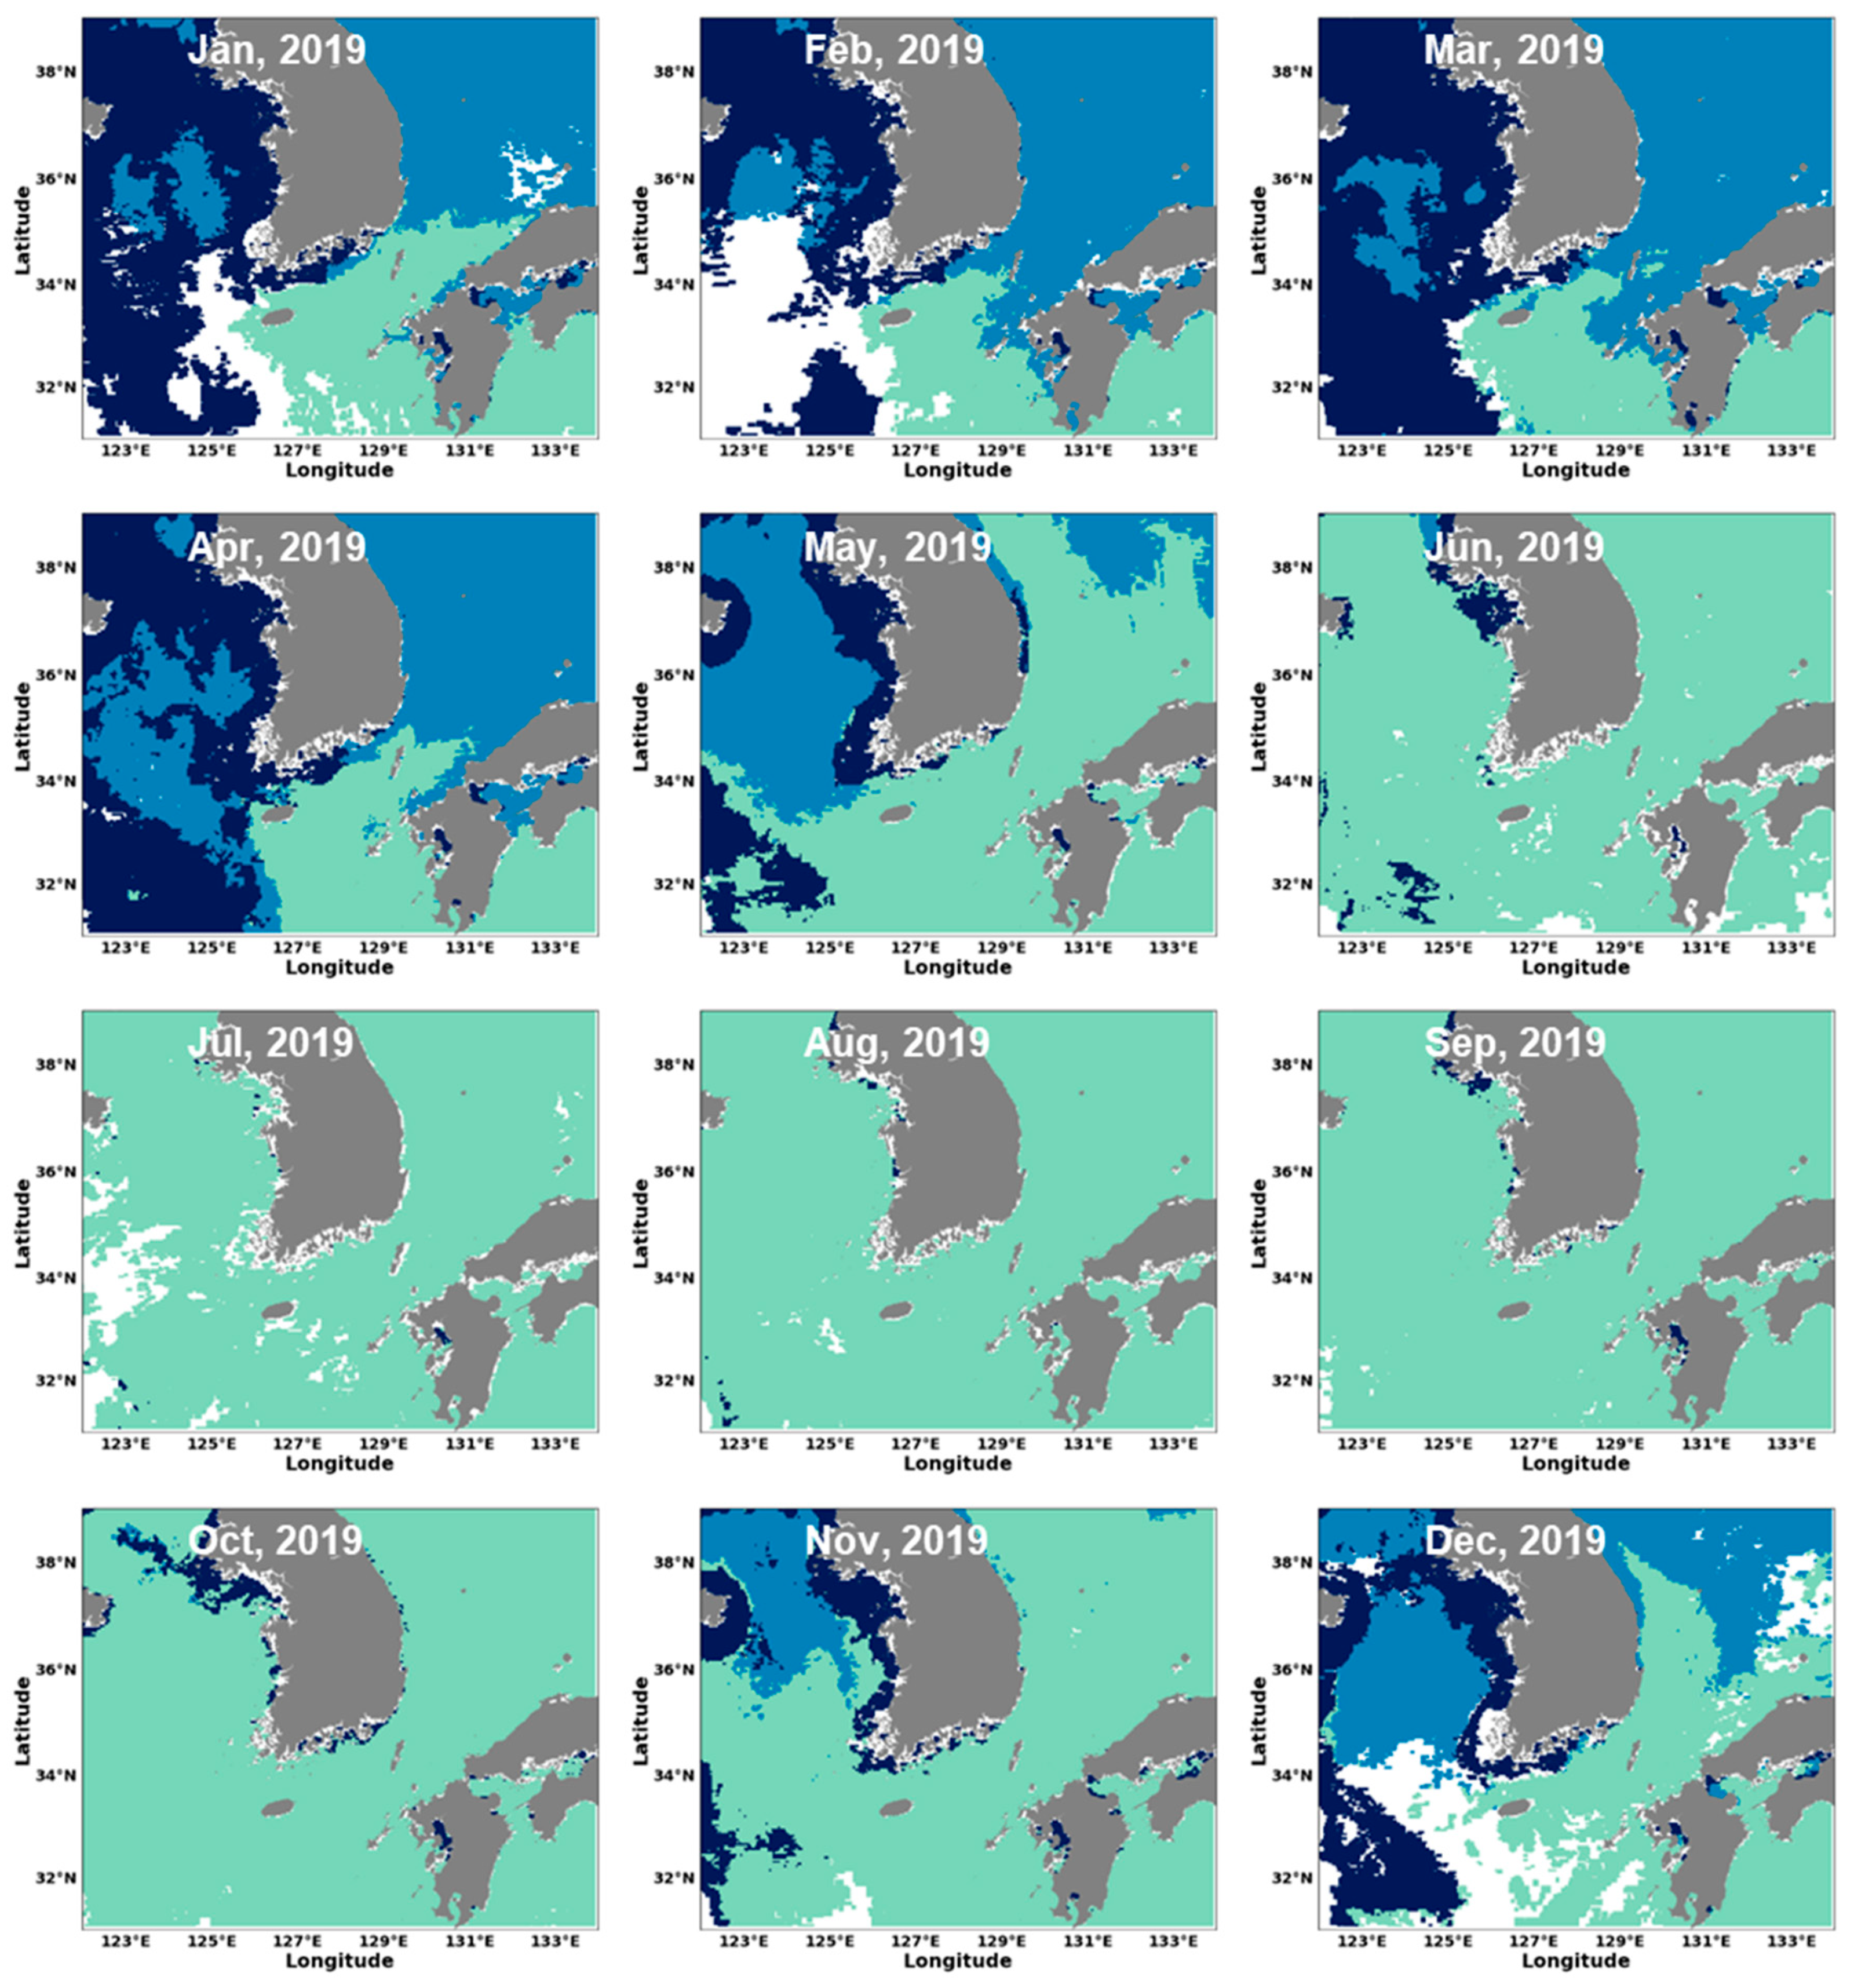
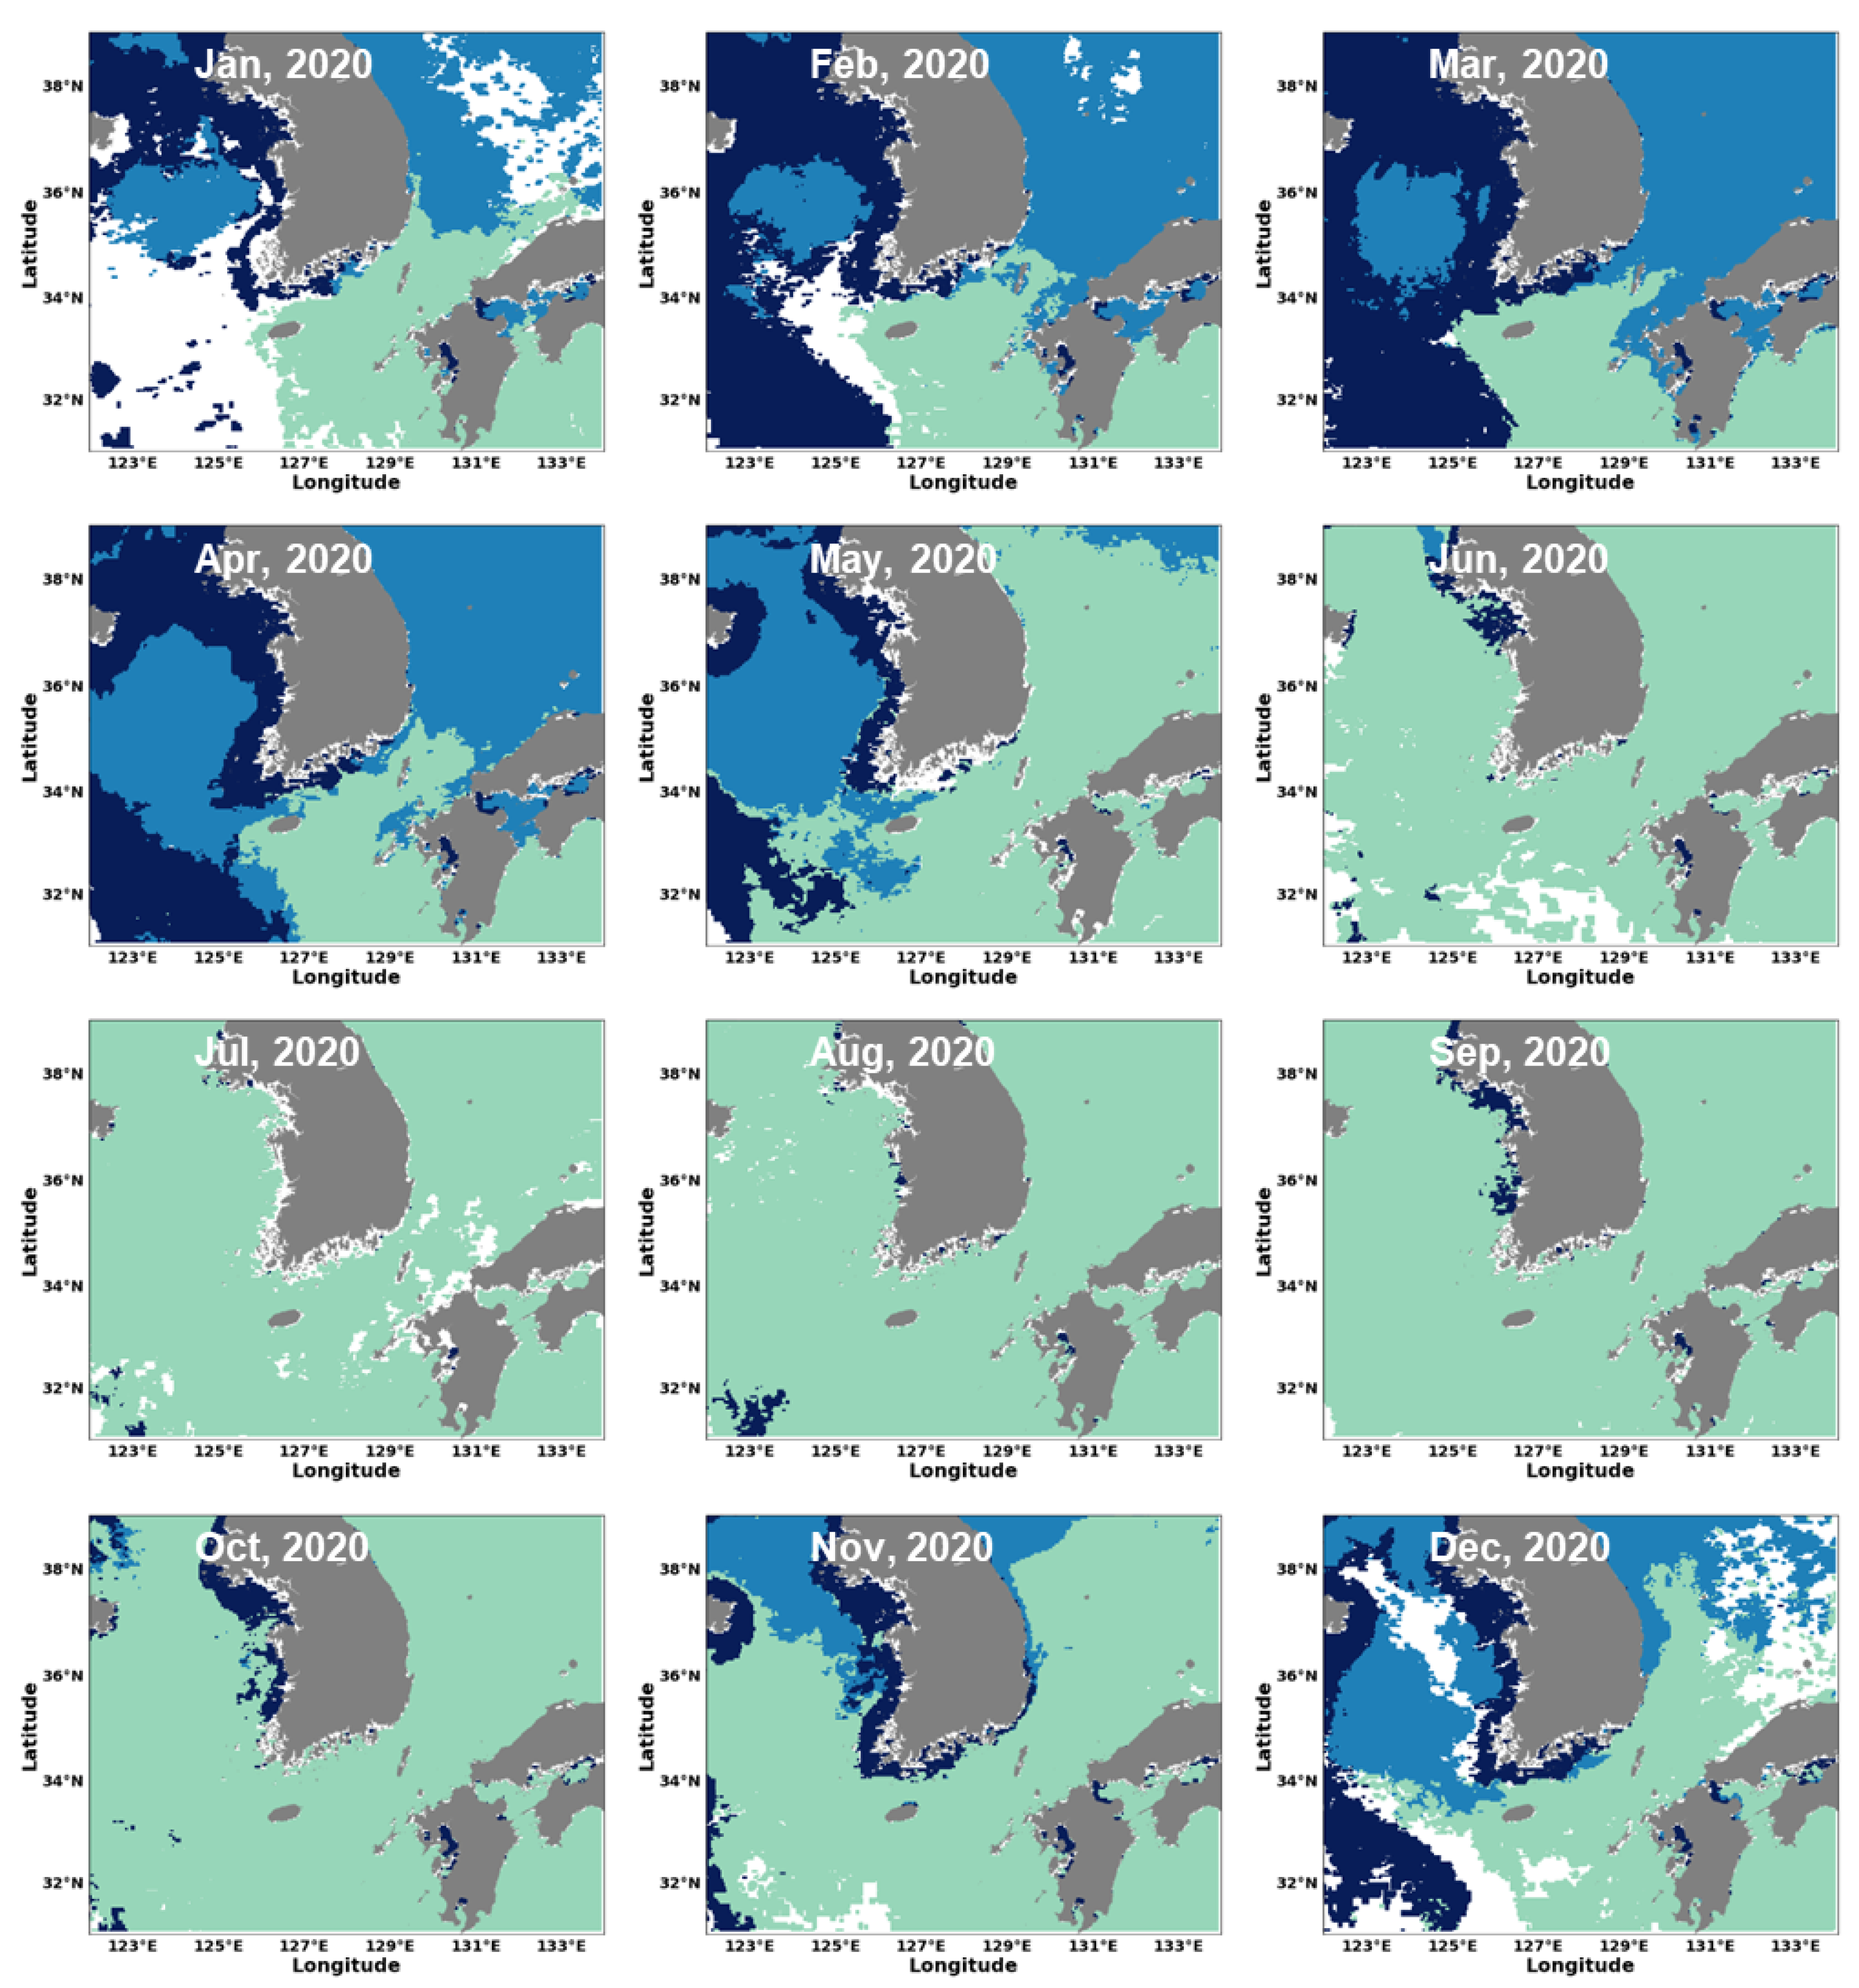
To identify the spatio-temporal distributions of the dominant phytoplankton size in the littoral sea (the purpose of this study), we applied the developed algorithm using a DNN-based model to the satellite ocean color data, and obtained monthly distributions of dominant phytoplankton size from 2018 to 2020. These are shown in Figure 3, Figure 4 and Figure 5. Although there are marginal spatial differences in the dominant sea areas from 2018 to 2020, the distribution trends of the dominant size are similar. An examination of the distributions of dominant phytoplankton size by sea area revealed that micro-size phytoplankton are dominant in the West Sea from January to March, whereas nano-size phytoplankton are dominant in April and May. In contrast, according to a seasonal survey of the West Sea (2018) by Jang et al. [37], nano-size phytoplankton are dominant in both February (approximately 50%; micro-size: approximately 22%) and April (approximately 42%; micro-size: approximately 37%) during the research period. This was because the contributions of chlorophyll-a according to size, reported by Jang et al. [37], reflected the chlorophyll-a concentrations in the depth of the photic zone, which includes the surface layer. With regard to the phytoplankton community structure in the East Sea, identified using the algorithm developed in this study, nano-size phytoplankton are dominant from January to April. From May, the dominant sea area of pico-size phytoplankton expands gradually. According to prior research, the key dominant size of phytoplankton communities in spring (March–April) in the East Sea are micro-size diatoms [38,39,40]. However, previous studies on phytoplankton communities in the East Sea reported differences in the dominant communities depending on the study period and survey station [41,42,43,44,45]. An observation shared among most of these studies is that the size of the key dominant size of the phytoplankton communities tends to decrease as the water temperature increases after spring [41,43,44,45]. According to the observations of phytoplankton communities in the South Sea and East China Sea from January to May, micro-size phytoplankton are dominant in the west, whereas pico-size phytoplankton are dominant in the central region. Although this spatio-temporal distribution pattern in the East China Sea is similar to those observed in previous studies [46,47], there is insufficient comparable prior research data on variations in phytoplankton communities in the South Sea during this period. From June to September, pico-size phytoplankton showed high distributions in all the sea areas (Figure 3, Figure 4 and Figure 5). In summer (June–August) when strong stratification develops, pico-size phytoplankton are the dominant size in the littoral sea at surface depths (East, West, South, and East China Seas) [37,44,45,47,48,49]. However, certain studies conducted in the South Sea observed that the contribution of nano-size phytoplankton or micro-size phytoplankton were high [19,50]. This is likely because the sea area where the studies were conducted is a bay with a high inflow of nutrients from the outside through precipitation [50,51]. From November, sea areas dominant with nano-size phytoplankton gradually begin to appear in the central West Sea and East Sea littoral seas. The dominant sea areas increased until December (Figure 3, Figure 4 and Figure 5). For the West Sea, comparable prior research results on the spatio-temporal variations in phytoplankton communities during this period are insufficient. In contrast, as mentioned above, the East Sea shows different distribution characteristics depending on the study period and station. However, according to Jo et al. [44], nano-size was the dominant size during September and October after summer, whereas micro-size was dominant in November, followed by nano-size. By substituting the developed PSCs algorithm for all the sea areas of South Korea, the most dominant size in the East, West, South, and East China Seas was observed to be pico-size phytoplankton. Meanwhile, nano-size phytoplankton was dominant in the northern waters of the West Sea, and micro-size phytoplankton in the littoral seas of the West Sea.
To determine the accuracy and usability of the developed algorithm applied to ocean color, we compared the dominant size estimated via satellite using new PSCs algorithm and the dominant size by sea area (East, West, South, and East China Seas) in the field data, as well as previously developed dominant size estimation algorithms (Table 4). The accuracy was approximately 69.5% according to comparisons of the most dominant phytoplankton size by sea area observed in the field and the most dominant size analyzed through ocean color (the algorithm developed in this study) (Table 4). The dominant distribution of pico-size phytoplankton showed high accuracy in the developed algorithm. One of the main causes of this result is because pico-size phytoplankton are the most dominant size in Korean waters, and were the most prevalent in the sample. With regard to accuracy by sea area, the accuracies for the East, West, South, and East China Seas were 50%, 66.6%, 90%, and 67%, respectively. The lowest was for the East Sea, and the highest was for the East China Sea. To compare the accuracy of the results applied to ocean color using the new algorithm with existing models, we performed a comparison using a dominant size estimation method applying an absorption model (Aph) [25] and dominant size estimation results using the three components model [52] (Table 4). According to the dominant size results, the Aph model yielded an accuracy of approximately 54% in the littoral sea. Meanwhile, the three-component model showed an accuracy of 13%. The previous field observations indicated that pico-size phytoplankton were dominant in most of the sea areas, whereas the three-component model estimated that micro- and nano-size phytoplankton were dominant in most of the sea areas. In particular, all the cases were incorrect in the South Sea. The algorithm developed in this study showed a higher accuracy than the existing algorithms in identifying variations in the dominant size in the littoral sea of South Korea. We consider that real AI learning-based algorithms could attain even higher performance if they were continuously trained with new data.

4. Summary and Conclusions

It is crucial to identify the spatio-temporal distributions of dominant phytoplankton size to understand the variations in coastal marine ecosystems occurring alongside environmental change. The PSCs classification models in prior studies have limited usability owing to their low accuracy in sea areas surrounding the Korean Peninsula. Accordingly, this study attempted to develop a DNN-based PSCs classification algorithm suitable for sea areas around the Korean Peninsula by utilizing data collected from continuous observations as training data for the DNN model.
For this purpose, we collected data observed at the sea surface at 60 stations in spring (April–May), summer (August), fall (October–November), and winter (February) over three years (2018–2020), from the ocean observation data obtained from the NIFS main institute and regional research centers. Data on total chlorophyll-a, size-fractionated chlorophyll-a, TSS, and SST were collected and observed using a rosette sampler and CTD (SBE-911) installed on the vessel. The collected data were used as training data for the DNN-based model.
The available data was collected at different times and locations, and is not continuous. Therefore, the DNN-based model was used for development of new PSCs algorithm. To prevent biased learning owing to imbalanced data, we acquired 70 samples of each class from the data by plankton size for the training process. In addition, we selected four sea areas (the West, South, East, and East China Seas) according to the characteristics of waters around the Korean Peninsula, and configured the ratios of data identically for each sea area. The developed DNN-based PSCs algorithm achieved an accuracy of 70%, which exceeds that of the existing algorithms. However, the high accuracy is partially attributed to the large proportion of pico-size phytoplankton in the test dataset, at 78%. This aspect of the model must be improved by securing additional data in the future.
To examine the distribution characteristics of PSCs in the sea areas surrounding the Korean Peninsula through the developed DNN-based PSCs algorithm, we input satellite data to express spatio-temporal distribution characteristics. Monthly averages and three-year averages of the satellite water temperature, turbidity (i.e., TSS), and total chlorophyll were applied as input values to the new algorithm. The results verified that micro-size phytoplankton were dominant on the West Sea coast, nano-size phytoplankton in the northern East Sea, and pico-size phytoplankton in the South and East China Seas (Figure 6). By season, micro-size phytoplankton and nano-size phytoplankton are dominant in winter and spring in the East, West, and South Seas. From summer, pico-size phytoplankton are dominant throughout the littoral sea of Korea (Figure 3, Figure 4 and Figure 5).
This study developed a DNN-based PSCs algorithm that classifies the phytoplankton in the littoral sea of Korea into three size levels for the first time. In addition, it presented results on the spatio-temporal distribution of the dominant size based on satellite data. Based on these results, we consider that it can be made capable of producing important data for understanding the variations in coastal marine ecosystems occurring alongside environmental change. However, continuous improvement of the DNN-based PSCs algorithm accuracy through comparison with in situ data is necessary for more precise satellite observations.

Supplementary Materials

The following supporting information can be downloaded at: https://www.mdpi.com/article/10.3390/jmse10101450/s1, Table S1: Marine ecosystem survey stations of NIFS; Table S2: Dominant phytoplankton size (micro: M, nano: N, and pico: P) in the littoral water of Korea from field measurements, new algorithm (this study), Aph algorithm, and three-component model.

Author Contributions

Conceptualization, H.T.J. and Y.P.; methodology, H.T.J. and E.K.; validation, Y.P. and J.D.H. formal analysis, J.J.K. and H.J.O.; investigation, H.T.J., H.J.O., J.J.K., E.K. and J.D.H.; data curation, H.T.J.; writing-original draft preparation, H.T.J. and J.J.K.; writing-review and editing, J.J.K.; S.-H.Y.; E.K.; visualization, H.T.J. and E.K.; supervision, J.D.H.; project administration, J.D.H. and H.J.O.; funding acquisition, S.-H.Y. and H.J.O. All authors have read and agreed to the published version of the manuscript.

Funding

This research was funded by the National Institute of Fisheries and Science (‘Development of marine ecological forecasting system for Korean waters’; R2022075).

Institutional Review Board Statement

Not applicable.

Informed Consent Statement

Not applicable.

Data Availability Statement

Not applicable.

Acknowledgments

This work was supported by the National Institute of Fisheries Science (NIFS) grant (‘Development of marine ecological forecasting system for Korean waters’; R2022075) funded by the ministry of oceans and fisheries, republic of Korea.

Conflicts of Interest

The authors declare no conflict of interest.

References

  1. D’Alelio, D.; Libralato, S.; d’Alcalà, M.R. Ecological-network models link diversity, structure and function in the plankton food-web. Sci. Rep. 2016, 6, 21806. [Google Scholar] [CrossRef] [Green Version]
  2. D’Alelio, D.; Rampone, S.; Cusano, L.M.; Morfino, V.; Russo, L.; Saneverino, N.; Cloern, J.E.; Lomas, M.W. Machine learning identifies a strong association between warming and reduced primary productivity in an oligotrophic ocean gyre. Sci. Rep. 2020, 10, 3287. [Google Scholar] [CrossRef] [Green Version]
  3. Harris, G. Phytoplankton Ecology: Structure, Function and Fluctuation; Chapman and Hall: London, UK, 1986. [Google Scholar]
  4. Belkin, I.M. Rapid warming of Large Marine Ecosystems. Prog. Oceanogr. 2009, 81, 207–213. [Google Scholar] [CrossRef]
  5. Kang, J.J.; Jang, H.K.; Lim, J.-H.; Lee, D.; Lee, J.-H.; Bae, H.; Lee, C.H.; Kang, C.-K.; Lee, S.H. Characteristics of different size phytoplankton for primary production and biochemical compositions in the western East/Japan Sea. Front. Microbiol. 2020, 11, 560102. [Google Scholar] [CrossRef] [PubMed]
  6. Chiba, S.; Batten, S.; Sasaoka, K.; Sasai, Y.; Sugisaki, H. Influence of the Pacific Decadal Oscillation on phytoplankton phenology and community structure in the western North Pacific. Geophys. Res. Lett. 2012, 39, 2–7. [Google Scholar] [CrossRef]
  7. Doney, S.C.; Ruckelshaus, M.; Duffy, J.E.; Barry, J.P.; Chan, F.; English, C.A.; Galindo, H.M.; Grebmeier, J.M.; Hollowed, A.B.; Knowlton, N.; et al. Climate change impacts on marine ecosystems. Ann. Rev. Mar. Sci. 2012, 4, 11–37. [Google Scholar] [CrossRef] [Green Version]
  8. Lee, S.H.; Joo, H.T.; Lee, J.H.; Lee, J.H.; Kang, J.J.; Lee, H.W.; Lee, D.; Kang, C.K. Seasonal carbon uptake rates of phytoplankton 494 in the northern East/Japan Sea. Deep. Res. Part II Top. Stud. Oceanogr. 2017, 143, 45–53. [Google Scholar] [CrossRef]
  9. Agawin, N.; Duarte, C.; Agustí, S. Nutrient and temperature control of the contribution of picoplankton to phytoplankton biomass and production. Limnol. Oceanogr. 2000, 45, 591–600. [Google Scholar] [CrossRef]
  10. Morán, X.A.G.; López-urrutia, Á.; Calvo-díaz, A.; Li, W.K. Increasing importance of small phytoplankton in a warmer ocean. Glob. Change Biol. 2010, 16, 1137–1144. [Google Scholar] [CrossRef]
  11. Hilligsøe, K.M.; Richardson, K.; Bendtsen, J.; Sørensen, L.L.; Nielsen, T.G.; Lyngsgaard, M.M. Linking phytoplankton community size composition with temperature, plankton food web structure and sea–air CO2 flux. Deep Sea Res. Part I Oceanogr. Res. Pap. 2011, 58, 826–838. [Google Scholar] [CrossRef]
  12. Mousing, E.A.; Ellegaard, M.; Richardson, K. Global patterns in phytoplankton community size structure—Evidence for a direct temperature effect. Mar. Ecol. Prog. Ser. 2014, 497, 25–38. [Google Scholar] [CrossRef] [Green Version]
  13. Legendre, L.; Rassoulzadegan, F. Food-web mediated export of biogenic carbon in oceans: Hydrodynamic control. Mar. Ecol. Prog. Ser. 1996, 145, 179–193. [Google Scholar] [CrossRef] [Green Version]
  14. Falkowski, P.G.; Oliver, M.J. Mix and match: How climate selects phytoplankton. Nat. Rev. Microbiol. 2007, 5, 813–819. [Google Scholar] [CrossRef] [PubMed]
  15. Finkel, Z.V.; Beardall, J.; Flynn, K.J.; Quigg, A.; Rees, T.A.V.; Raven, J.A. Phytoplankton in a changing world: Cell size and elemental stoichiometry. J. Plankton Res. 2010, 32, 119–137. [Google Scholar] [CrossRef] [Green Version]
  16. Marañón, E.; Cermeño, P.; Latasa, M.; Tadonléké, R.D. Temperature, resources, and phytoplankton community size structure in the ocean. Limnol. Oceanogr. 2012, 57, 1266–1278. [Google Scholar] [CrossRef]
  17. Liu, H.; Liu, X.; Xiao, W.; Laws, E.A.; Huang, B. Spatial and temporal variations of satellite-derived phytoplankton size classes using a three-component model bridged with temperature in marginal seas of the western pacific ocean. Prog. Oceanogr. 2021, 191, 102511. [Google Scholar] [CrossRef]
  18. Brewin, R.J.W.; Sathyendranath, S.; Jackson, T.; Barlow, R.; Brotas, V.; Airs, R.; Lamont, T. Influence of light in the mixed-layer on the parameters of a threecomponent model of phytoplankton size class. Remote Sens. Environ. 2015, 168, 437–450. [Google Scholar] [CrossRef]
  19. Lee, J.H.; Lee, W.C.; Kim, H.C.; Jo, N.; Kim, K.; Lee, D.; Kang, J.J.; Sim, B.-R.; Kwon, J.-I.; Lee, S.H. Temporal and Spatial Variations of the Biochemical Composition of Phytoplankton and Potential Food Material (FM) in Jaran Bay, South Korea. Water 2020, 12, 3093. [Google Scholar] [CrossRef]
  20. Alvain, S.; Moulin, C.; Dandonneau, Y.; Breon, F.M. Remote sensing of phytoplankton groups in case 1 waters from global SeaWiFS imagery. Deep-Sea Res. I 2005, 52, 1989–2004. [Google Scholar] [CrossRef] [Green Version]
  21. IOCCG. Phytoplankton Functional Types from Space; Sathyendranath, S., Ed.; Reports of the International Ocean-Colour Coordinating Group, No. 15; IOCCG: Dartmouth, Canada, 2014. [Google Scholar]
  22. Zhang, H.; Wang, S.; Qiu, Z.; Sun, D.; Ishizaka, J.; Sun, S.; He, Y. Phytoplankton size class in the East China Sea derived from MODIS satellite data. Biogeosciences 2018, 15, 4271–4289. [Google Scholar] [CrossRef]
  23. Mouw, C.; Hardman-Mountford, N.J.; Alvain, S.; Bracher, A.; Brewin, R.; Bricaud, A.; Ciotti, A.M.; Devred, E.; Fujiwara, A.; Hirata, T.; et al. A consumer’s guide to satellite remote sensing of multiple phytoplankton groups in the global ocean. Front. Mar. Sci. 2017, 4, 41. [Google Scholar] [CrossRef] [Green Version]
  24. Ciotti, A.M.; Lewis, M.R.; Cullen, J.J. Assessment of the relationships between dominant cell size in natural phytoplankton communities and the spectral shape of the absorption coefficient. Limnol. Oceanogr. 2002, 47, 404–417. [Google Scholar] [CrossRef] [Green Version]
  25. Hirata, T.; Aiken, J.; Hardman-Mountford, N.; Smyth, T.; Barlow, R. An absorption model to determine phytoplankton size classes from satellite ocean colour. Remote Sens. Environ. 2008, 112, 3153–3159. [Google Scholar] [CrossRef]
  26. Kostadinov, T.S.; Siegel, D.A.; Maritorena, S. Retrieval of the particle size distribution from satellite ocean color observations. J. Geophys. Res. Ocean. 2009, 114, C09015. [Google Scholar] [CrossRef]
  27. Roy, S.; Sathyendranath, S.; Bouman, H.; Platt, T. The global distribution of phytoplankton size spectrum and size classes from their light-absorption spectra derived from satellite data. Remote Sens. Environ. 2013, 139, 185–197. [Google Scholar] [CrossRef]
  28. Garver, S.A.; Siegel, D.A.; Greg, M.B. Variability in near-surface particulate absorption spectra: What can a satellite ocean color imager see? Limnol. Oceanogr. 1994, 39, 1349–1367. [Google Scholar] [CrossRef]
  29. Sun, D.; Huan, Y.; Wang, S.; Qiu, Z.; Ling, Z.; Mao, Z.; He, Y. Remote sensing of spatial and temporal patterns of phytoplankton assemblages in the Bohai Sea, Yellow Sea, and east China sea. Water Res. 2019, 157, 119–133. [Google Scholar] [CrossRef]
  30. Brewin, R.J.W.; Sathyendranath, S.; Hirata, T.; Lavender, S.J.; Barciela, R.M.; Hardman-Mountford, N.J. A three-component model of phytoplankton size class for the Atlantic Ocean. Ecol. Model 2010, 221, 1472–1483. [Google Scholar] [CrossRef]
  31. Hirata, T.; Hardman-Mountford, N.J.; Brewin, R.J.W.; Aiken, J.; Barlow, R.; Suzuki, K.; Isada, T.; Howell, E.; Hashioka, T.; Noguchi-Aita, M.; et al. Synoptic relationships between surface Chlorophyll-a and diagnostic pigments specific to phytoplankton functional types. Biogeosciences 2011, 8, 311–327. [Google Scholar] [CrossRef] [Green Version]
  32. Brewin, R.J.W.; Ciavatta, S.; Sathyendranath, S.; Jackson, T.; Tilstone, G.; Curran, K.; Airs, R.L.; Cummings, D.; Brotas, V.; Organelli, E.; et al. Uncertainty in ocean-color estimates of chlorophyll for phytoplankton groups. Front. Mar. Sci. 2017, 4, 104. [Google Scholar] [CrossRef]
  33. Ward, B.A. Temperature-correlated changes in phytoplankton community structure are restricted to polar waters. PLoS ONE 2015, 10, e0135581. [Google Scholar] [CrossRef] [PubMed] [Green Version]
  34. Hu, S.; Liu, H.; Zhao, W.; Shi, T.; Hu, Z.; Li, Q.; Wu, G. Comparison of machine learning techniques in inferring phytoplankton size classes. Remote Sens. 2018, 10, 191. [Google Scholar] [CrossRef] [Green Version]
  35. Parsons, T.R.; Maita, Y.; Lalli, C.M. A Manual of Biological and Chemical Methods for Seawater Analysis; Pergamon Press: Oxford, UK, 1984. [Google Scholar]
  36. Moon, J.-E.; Ahn, Y.-H.; Ryu, J.-H.; Palanisamy, S. Development of Ocean environmental algorithms for Geostationary ocean color imager. Korea J. Remote Sens. 2010, 26, 198–207. [Google Scholar]
  37. Jang, H.K.; Youn, S.H.; Joo, H.; Kim, Y.; Kang, J.J.; Lee, D.; Jo, N.; Kim, K.; Kim, M.-J.; Kim, S.; et al. First Concurrent Measurement of Primary Production in the Yellow Sea, the South Sea of Korea, and the East/Japan Sea, 2018. J. Mar. Sci. Eng. 2021, 9, 1237. [Google Scholar] [CrossRef]
  38. Yamada, K.; Ishizaka, J.; Yoo, S.; Kim, H.-C.; Chiba, S. Seasonal and interannual variability of sea surface chlorophyll a concentration in the Japan/East Sea (JES). Prog. Oceanogr. 2004, 61, 193–211. [Google Scholar] [CrossRef]
  39. Kim, T.-H.; Lee, Y.-W.; Kim, G. Hydrographically mediated patterns of photosynthetic pigments in the East/Japan Sea: Low N:P ratios and cyanobacterial dominance. J. Mar. Syst. 2010, 82, 72–79. [Google Scholar] [CrossRef]
  40. Kwak, J.H.; Hwang, J.; Choy, E.J.; Park, H.J.; Kang, D.-J.; Lee, T.; Chang, K.-I.; Kim, K.-R.; Kang, C.-K. Monthly measured primary and new productivities in the Ulleung Basin as a biological “hot spot” in the East/Japan Sea. Biogeosciences 2013, 10, 4405–4417. [Google Scholar] [CrossRef] [Green Version]
  41. Kwak, J.H.; Lee, S.H.; Hwang, J.; Suh, Y.S.; Park, H.J.; Chang, K.I.; Kim, K.-R.; Kang, C.K. Summer primary productivity and phytoplankton community composition driven by different hydrographic structures in the East/Japan Sea and the Western Subarctic Pacific. J. Geophys. Res. Ocean. 2014, 119, 4505–4519. [Google Scholar] [CrossRef]
  42. Kang, J.J.; Joo, H.; Lee, J.H.; Lee, J.H.; Lee, H.W.; Lee, D.; Kang, C.K.; Yun, M.S.; Lee, S.H. Comparison of biochemical compositions of phytoplankton during spring and fall seasons in the northern East/Japan Sea. Deep Sea Res. Part II Top. Stud. Oceanogr. 2017, 143, 73–81. [Google Scholar] [CrossRef]
  43. Kwak, J.H.; Han, E.; Lee, S.H.; Park, H.J.; Kim, K.R.; Kang, C.K. A consistent structure of phytoplankton communities across the warm–cold regions of the water mass on a meridional transect in the East/Japan Sea. Deep Sea Res. Part II Top. Stud. Oceanogr. 2017, 143, 36–44. [Google Scholar] [CrossRef]
  44. Jo, N.; Kang, J.J.; Park, W.G.; Lee, B.R.; Yun, M.S.; Lee, J.H.; Kim, S.M.; Lee, D.; Joo, H.; Lee, J.H.; et al. Seasonal variation in the biochemical compositions of phytoplankton and zooplankton communities in the southwestern East/Japan Sea. Deep Sea Res. Part II Top. Stud. Oceanogr. 2017, 143, 82–90. [Google Scholar] [CrossRef]
  45. Lee, M.; Kim, Y.B.; Park, C.H.; Baek, S.H. Characterization of Seasonal Phytoplankton Pigments and Functional Types around Offshore Island in the East/Japan Sea, Based on HPLC Pigment Analysis. Sustainability 2022, 14, 5306. [Google Scholar] [CrossRef]
  46. Sun, X.; Shen, F.; Liu, D.; Bellerby, R.G.; Liu, Y.; Tang, R. In situ and satellite observations of phytoplankton size classes in the entire continental shelf sea, China. J. Geophys. Res. Ocean. 2018, 123, 3523–3544. [Google Scholar] [CrossRef] [Green Version]
  47. Kim, Y.; Youn, S.H.; Oh, H.J.; Kang, J.J.; Lee, J.H.; Lee, D.; Kim, K.; Jang, H.K.; Lee, J.; Lee, S.H. Spatiotemporal variation in phytoplankton community driven by environmental factors in the northern East China Sea. Water 2020, 12, 2695. [Google Scholar] [CrossRef]
  48. Fu, M.; Wang, Z.; Li, Y.; Li, R.; Sun, P.; Wei, X.; Lin, X.; Guo, J. Phytoplankton biomass size structure and its regulation in the Southern Yellow Sea (China): Seasonal variability. Cont. Shelf Res. 2009, 29, 2178–2194. [Google Scholar] [CrossRef]
  49. Kang, J.J.; Min, J.O.; Kim, Y.; Lee, C.H.; Yoo, H.; Jang, H.K.; Kim, M.-J.; Oh, H.-J. Lee, S.H. Vertical Distribution of Phytoplankton Community and Pigment Production in the Yellow Sea and the East China Sea during the Late Summer Season. Water 2021, 13, 3321. [Google Scholar] [CrossRef]
  50. Kim, Y.; Lee, J.H.; Kang, J.J.; Lee, J.H.; Lee, H.W.; Kang, C.K.; Lee, S.H. River discharge effects on the contribution of small-sized phytoplankton to the total biochemical composition of POM in the Gwangyang Bay, Korea. Estuar. Coast. Shelf Sci. 2019, 226, 106293. [Google Scholar] [CrossRef]
  51. Shaha, D.C.; Cho, Y.-K. Comparison of empirical models with intensively observed data for prediction of salt intrusion in the Sumjin River estuary, Korea. Hydrol. Earth Syst. Sci. 2009, 13, 923–933. [Google Scholar] [CrossRef]
  52. Ye, H.; Tang, D. A three component model of phytoplankton size classes for the south china sea. Malays. J. Sc. 2013, 32, 325–332. [Google Scholar]
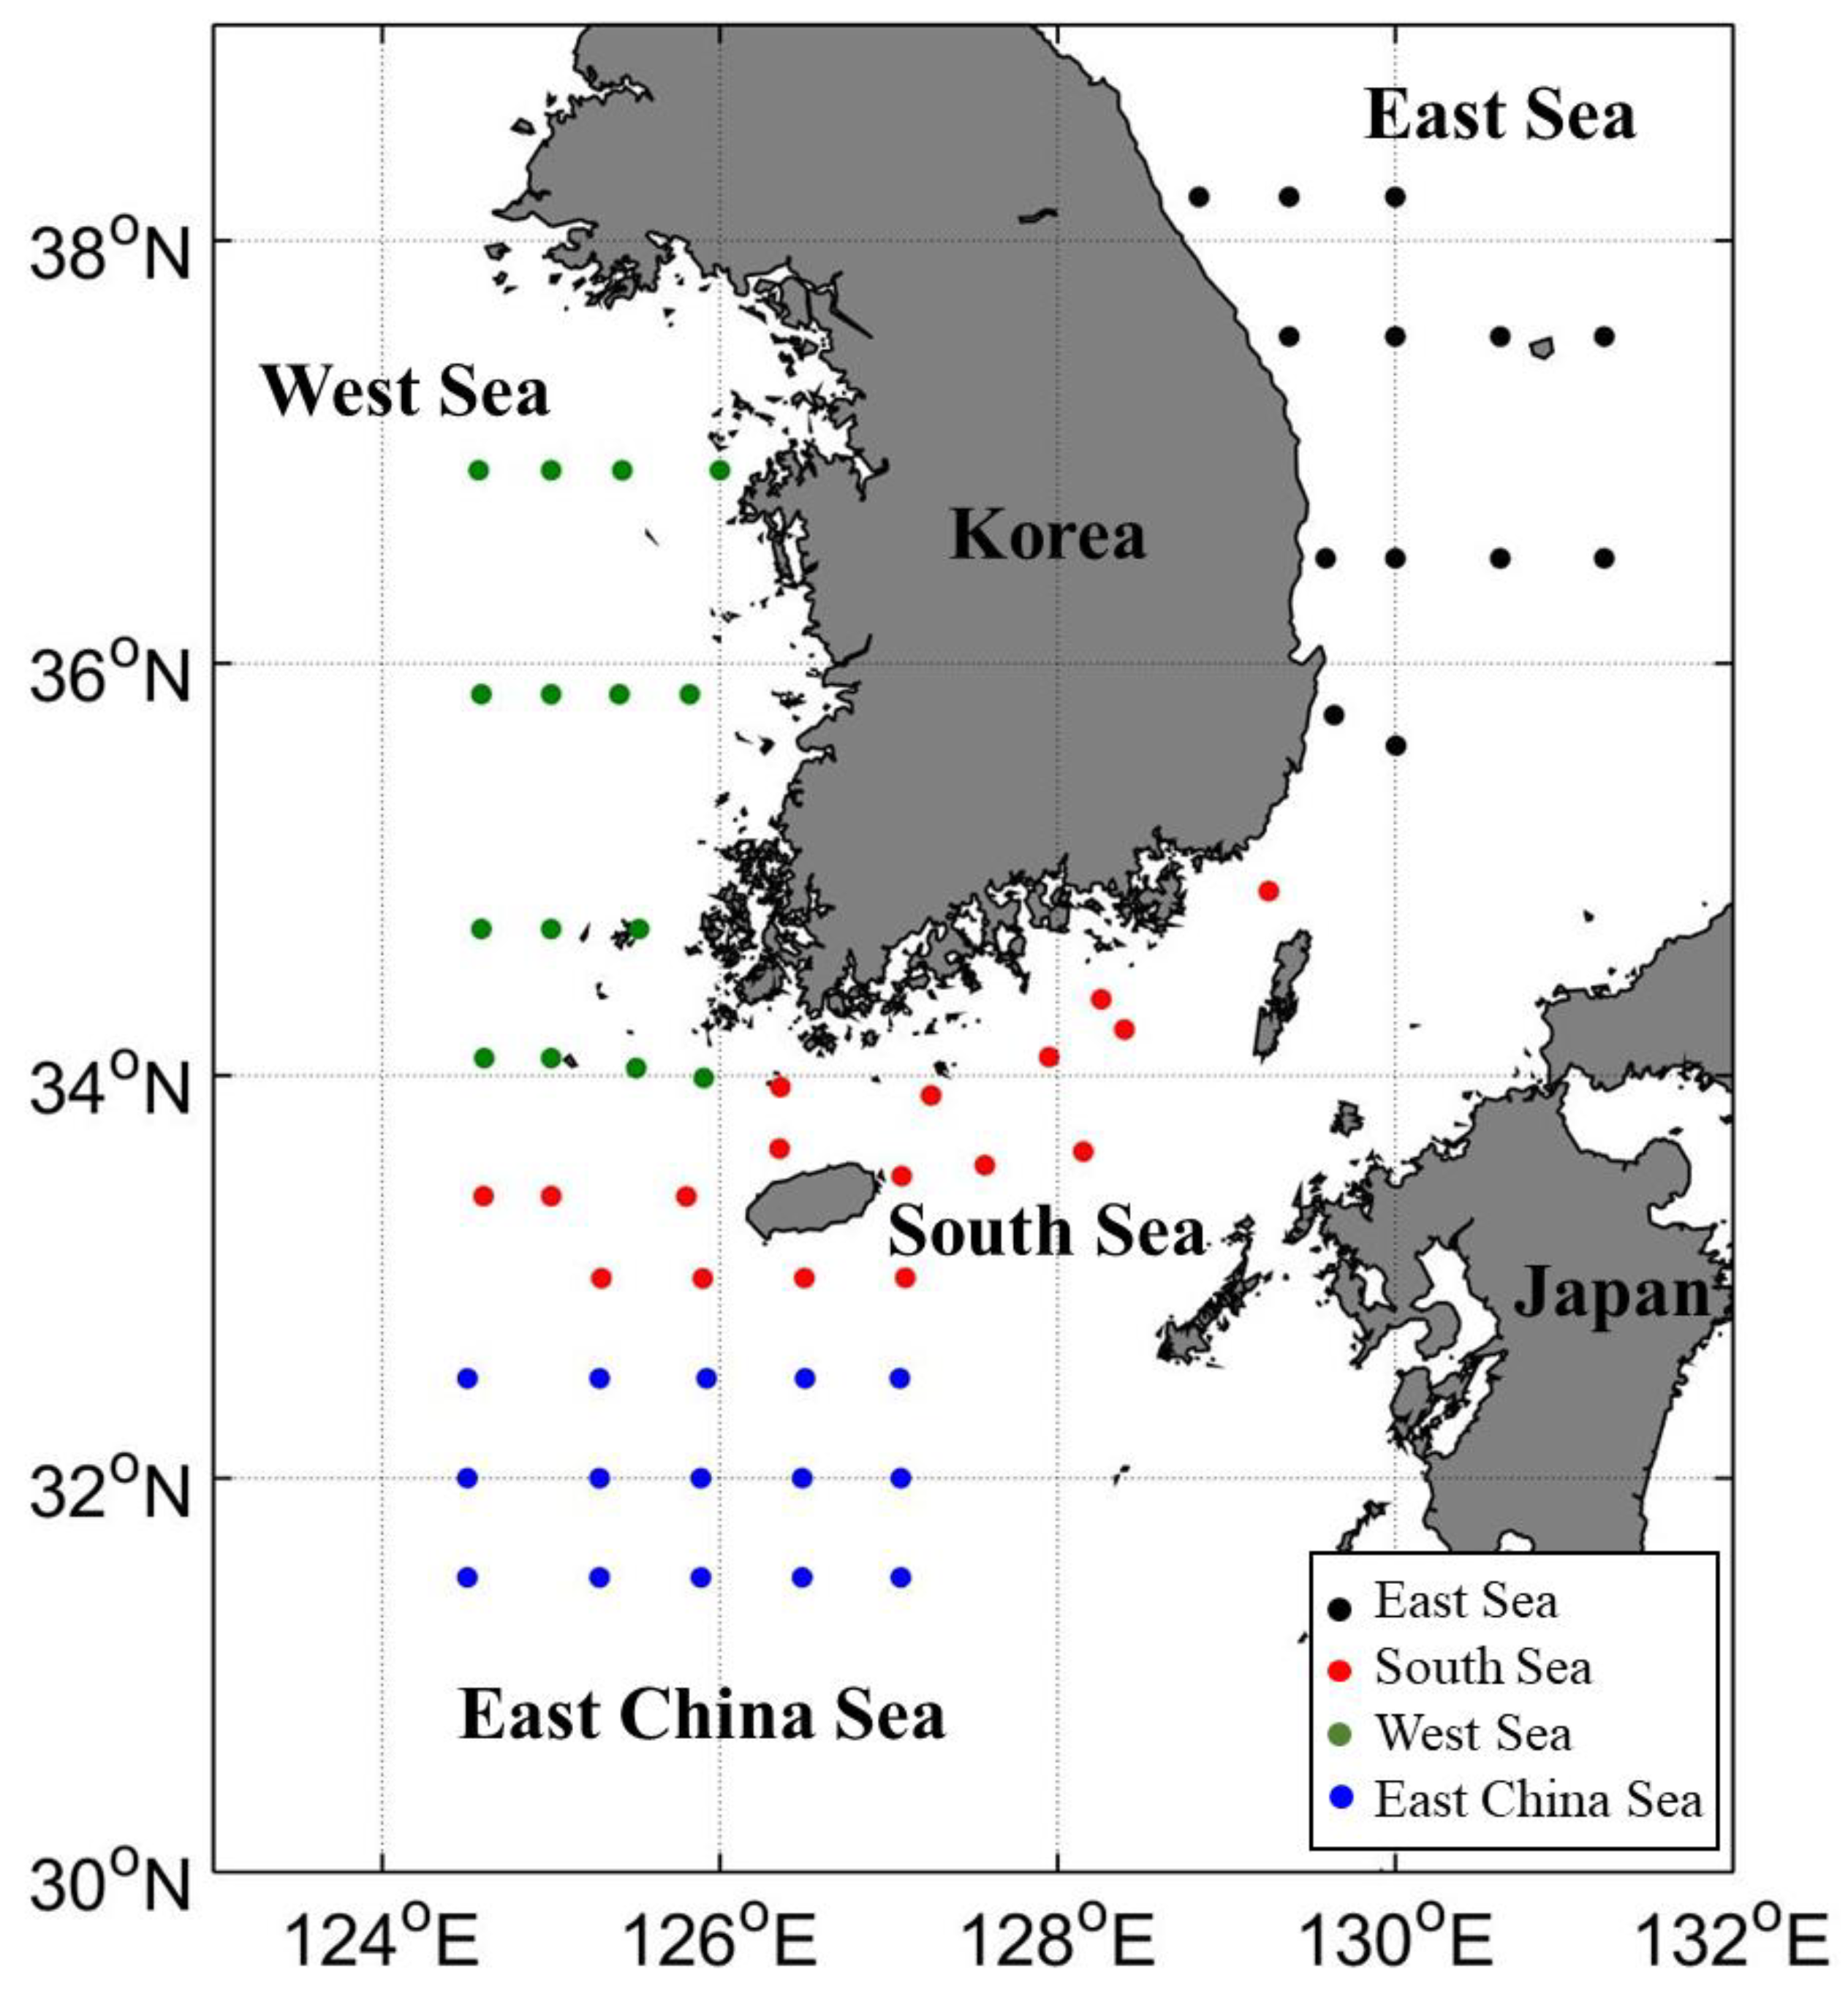
Figure 1. Locations of field observation stations.
Jmse 10 01450 g001
Figure 2. Deep learning framework of this study model. As training data, the total chlorophyll-a (CHL), total suspended solids (TSS), and sea surface temperature (SST), obtained by field observation, were used as input variables in this model.
Jmse 10 01450 g002
Figure 3. Classification based monthly PSCs distribution using L3 mapped VIIRS data in 2018. White color indicates missing area by cloud. Indigo, blue, and green colors indicate micro-size phytoplankton, nano-size phytoplankton, and pico-size phytoplankton, respectively.
Jmse 10 01450 g003
Figure 4. Classification based monthly PSCs distribution using L3 mapped VIIRS data in 2019. White color indicates missing area by cloud. Indigo, blue, and green colors indicate micro-size phytoplankton, nano-size phytoplankton, and pico-size phytoplankton, respectively.
Jmse 10 01450 g004
Figure 5. Classification based monthly PSCs distribution using L3 mapped VIIRS data in 2020. White color indicates a missing area by the cloud. Indigo, blue, and green colors indicate micro-size phytoplankton, nano-size phytoplankton, and pico-size phytoplankton, respectively.
Jmse 10 01450 g005
Figure 6. Dominant area of each class. Indigo, blue, and green colors indicate micro-size phytoplankton, nano-size phytoplankton, and pico-size phytoplankton, respectively.
Jmse 10 01450 g006
Table 1. The number of dominant-sized phytoplankton (ground truth data for training DNN-based model) which appeared at field observation stations in each sea area (East, West, South, and East China Seas) during the study period (2018–2020).
East SeaWest SeaSouth SeaEast China Sea Sum
Microsize phytoplankton (>20 µM)39132153126
Nanosize phytoplankton (2–20 µM)423981099
Picosize phytoplankton (0.7–2 µM)541158651306
Total135167115114531
Table 2. Confusion matrix.
In Situ Results
TrueFalse
Model resultsTrueTrue Positive (TP)False Positive (FP)
FalseFalse Negative (FN)True Negative (TN)
Table 3. Precision, recall, F1-score, and accuracy of training, validation, and test datasets for classification model.
DataPrecision
(%)
Recall
(%)
F1_ScoreAccuracy
(%)
Training data (210)Micro-size phytoplankton (70)37.165.047.355.7
Nano-size phytoplankton (70)44.367.453.5
Pico-size phytoplankton (70)85.748.461.9
Validation data (30)Micro-size phytoplankton (10)20.066.730.846.7
Nano-size phytoplankton (10)30.060.040.0
Pico-size phytoplankton (10)90.040.956.3
Test data (291)Micro-size phytoplankton (46)34.845.739.570.5
Nano-size phytoplankton (19)42.117.825.0
Pico-size phytoplankton (226)80.185.882.8
Table 4. Matched percent between field measurement Chl-a size fractionated with New AI algorithm (this study), Aph algorithm, and three-component model derived from satellite data.
Field MeasurmentsNew AI Algorithm (This Study)Aph AlgorithmThree-Component Model
Study area67.3%54.3%13.4%
East Sea50.0%41.7%16.7%
West Sea66.7%41.7%33.3%
South Sea90%90%0%
East China sea66.7%50%0%
Publisher’s Note: MDPI stays neutral with regard to jurisdictional claims in published maps and institutional affiliations.