Abstract
Little information on the phytoplankton community in the Yellow Sea (YS)—especially size-fractionated phytoplankton—is currently available, in comparison to the various physicochemical studies in the literature. Using high-performance liquid chromatography (HPLC), size-fractionated phytoplankton communities were seasonally investigated in the YS in 2019. In the study period, diatoms (55.0 ± 10.2%) and cryptophytes (16.9 ± 9.3%) were the dominant groups. Due to the recent alteration in inorganic nutrient conditions reported in the YS, the contribution of diatoms was lower than in previous studies. The large-sized phytoplankton group (>20 µm) was dominated mostly by diatoms (89.0 ± 10.6%), while the small-sized phytoplankton group (<20 µm) was also dominated by diatoms (41.9 ± 9.1%), followed by cryptophytes (19.2 ± 9.8%). The contributions of small-sized diatoms (<20 µm) have been overlooked in the past, as they are difficult to detect, but this study confirms significant amounts of small-sized diatoms, accounting for 62.3% of the total diatoms in the YS. This study provides an important background for assessing the seasonal variations in different-sized diatom groups in the YS. Further detailed studies on their potential ecological roles should be conducted, in order to better understand marine ecosystems under future warming scenarios.
1. Introduction
Phytoplankton, as primary producers, contribute half of global primary production and play a central role in marine ecosystems [1,2]. In the ocean, the size and the community structure of phytoplankton are affected by light intensity, water temperature, nutrients, and other physicochemical properties [3,4]. Generally, the dominance of micro-sized phytoplankton (>20 μm) has been associated with nutrient-rich environments, while the dominance of pico-sized phytoplankton (<2 μm) has been associated with stratified and oligotrophic waters [5,6,7]. Recently increasing temperatures and stratification due to global warming have caused a shift in phytoplankton size structures towards smaller phytoplankton [8,9]. The increase in small phytoplankton could result in lower total primary production [10]. Moreover, the efficiency of the biological pump [4] and the food web structure [11] may be altered. Therefore, phytoplankton community size structure variation can serve as an indicator for the response of phytoplankton to environmental changes [12,13].
The Yellow Sea (YS) is a temperate semi-enclosed marginal sea in the West Pacific Ocean, surrounded by Korea to the east and China to the west. The YS is a highly productive ecosystem and is recognized as an important global fishery resource region [14]. The YS is significantly influenced by its unique topography, hydrological and biochemical characteristics, nonlinear tidal effect, and frequent human activity [15,16]. The spatial-temporal distribution of the phytoplankton community in the YS is affected by this complex environment [17]. Studies on the composition of phytoplankton communities have traditionally been carried out using optical microscopy, but this method has limited ability to detect pico- and nano-sized phytoplankton [18,19]. To address this issue, new approaches based on pigment analysis using High-Performance Liquid Chromatography (HPLC) have been developed. HPLC provides an opportunity to estimate small-sized phytoplankton, which can be difficult to identify when conducting microscopic analysis [20]. Moreover, HPLC pigment analysis can produce reliable and consistent data in a short period of time.
Previous studies on the phytoplankton community in the YS have mainly focused on the morphological classification of large-sized phytoplankton [17,21,22]. Several studies have investigated the relationship between phytoplankton communities and environmental factors, but they have been limited to fragmentary seasons [23,24]. In addition, some studies assessing the size-fractionated phytoplankton biomass in the YS have been undertaken [25,26], but no study has considered size-fractionated phytoplankton communities in this area. The main objectives of this study are to (1) identify major environmental factors controlling the seasonal variations in the phytoplankton communities and (2) classify the seasonal pattern of different-sized phytoplankton groups in the YS.
2. Materials and Methods
2.1. Water Sampling and Study Area
Seasonal sampling was conducted in the Yellow Sea on an R/V Tamgu 8 during 4 seasons in 2019 (22 February to 5 March, 3–12 April, 14–25 August, and 6–16 October, representing winter, spring, summer, and autumn, respectively; see Figure 1 and Table 1). At the surface, water samples were collected using Niskin bottles to examine dissolved inorganic nutrients (NO3 + NO2, NH4, SiO2, and PO4 (n = 29)), chlorophyll-a (total (n = 29) and size-fractionated (n = 87)) concentrations, and pigment (total (n = 29) and size-fractionated (n = 58)) concentrations on a conductivity–temperature–depth (CTD)/rosette sampler (SBE 911 plus, Seabird Electronics Inc., Bellevue, WA, USA). Physical properties (temperature and salinity) were also measured using the CTD/rosette sampler. The stability index (SI) for the euphotic zone was calculated by dividing the difference in density (sigma-t) between the surface and the bottom of the euphotic zone by the depth of the euphotic zone [27].
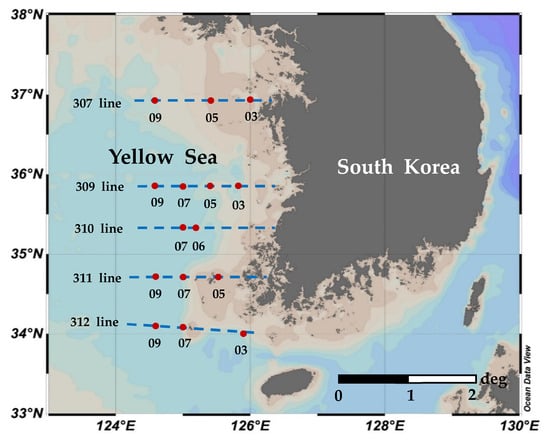
Figure 1.
Sampling locations in the YS, 2019. The blue dotted lines are managed by the serial oceanographic observation project of the National Institute of Fisheries Science (NIFS) in Korea.

Table 1.
Sampling locations and environmental parameters of the study sites in the YS, 2019.
2.2. Dissolved Inorganic Nutrients
To determine the dissolved inorganic nutrients (NO3 + NO2, NH4, SiO2, and PO4), 100 mL of seawater was filtered through GF/F filters (07 μm; Whatman, Maidstone, UK) and the filtrate was immediately frozen at −20 °C. Concentrations of nutrients were analyzed using an automatic analyzer (Quattro, Seal Analytical, Norderstedt, Germany) at the National Institute of Fisheries Science (NIFS), Korea. Dissolved inorganic phosphate (DIP) was assessed on the basis of PO4 and dissolved inorganic nitrogen (DIN) concentrations were calculated as the sum of NH4, NO2, and NO3.
2.3. Chlorophyll-a Concentration
For total chlorophyll-a concentration, 300 mL of seawater was filtered through a 25 mm glass fiber filter (GF/F; Whatman). For the size-fractionated chlorophyll-a concentration, 500 mL of seawater was filtered through membrane filters with pore sizes of 20 and 2 μm and 47 mm GF/F, in sequence. After filtration, the filtered samples were wrapped with aluminum foil to prevent photolysis and stored at −80 °C in a freezer until further analysis. Chlorophyll-a was extracted with 90% acetone for 20–24 h in the dark at 4 °C, and the concentration was measured using a fluorometer (Turner Designs 10AU) [28].
2.4. High-Performance Liquid Chromatography Analysis
Water samples (1 L) were filtered through 47 mm GF/F for total pigment analysis, and 4–10 L of seawater was filtered through membrane filters with a pore size of 20 μm and 47 mm GF/F, in sequence, in order to perform size-fractionated pigment analysis. The samples for HPLC analysis were wrapped in aluminum foil to avoid degradation and stored at −80 °C in a freezer until analysis. In the laboratory, the frozen filters were extracted using 5 mL of 100% acetone at 4 °C over 20–24 h, and canthaxanthin was used as an internal standard [29]. After extraction, the extract was passed through a syringe filter (Polytetrafluoroethylene, PTFE; 0.2 μm, Hydrophobic, Advantec, Japan) and centrifuged (3500 rpm) for 10 min. Then, 1 mL of the extract was mixed with 300 μL of distilled water and analyzed using high-performance liquid chromatography (HPLC; Agilent Infinite 1260, Santa Clara, CA, USA) for qualitative and quantitative evaluation of pigments. Pigment concentrations were calculated using the equation suggested in [30]. The relative contributions of the total and size-fractionated phytoplankton community composition were estimated through the CHEMTAX program, as described in [31]. To separate the eight phytoplankton communities (i.e., diatoms, dinoflagellates, chrysophytes, cryptophytes, chlorophytes, prasinophytes, cyanobacteria) in the CHEMTAX program, we used the initial pigment ratios derived from [32].
To estimate the relative contributions of three pigment-based size classes (pico-, nano-, and micro-sized phytoplankton), diagnostic pigment analyses (DPAs) were carried out [33,34,35,36]. DPA was calculated based on the concentration of the seven diagnostic pigments—fucoxanthin (Fuco), peridinin (Peri), 19′-hexanoyloxyfucoxanthin (19Hexfuco), 19′-butanoyloxy-fucoxanthin (19Butfuco), alloxanthin (Allo), chlorophyll-b (Chlb), and zeaxanthin (Zea)—and the relative contributions of the three pigment-based size classes were calculated according to [37].
2.5. Statistical Analysis
Statistical analysis was performed using SPSS (version 24.0, SPSS Inc., Chicago, IL, USA) for Spearman’s correlation, t-test, one-way ANOVA, and Kruskal–Wallis nonparametric one-way analysis of variance (ANOVA). Spearman rank-order correlation analysis was used to identify the environmental factors in relation to the concentrations of size-fractionated diatoms. The t-test was performed to identify the significant differences between the relative proportions of size-fractionated chlorophyll-a concentrations, as measured by fluorometer and pigment analysis. One-way ANOVA and Kruskal–Wallis (at an alpha value of <0.05) were applied to identify significant differences in physical properties for each season. Canonical correspondence analysis (CCA) was performed using CANOCO for Windows 4.5 (Biometris, Wageningen, The Netherlands), in order to investigate the relationships between the total phytoplankton community and environmental factors (i.e., temperature, salinity, stability index, and dissolved inorganic nutrients (NO3 + NO2, NH4, SiO2, and DIP)).
3. Results and Discussion
3.1. Physicochemical Characteristics in the Environment
The hydrographic conditions are presented in Table 1. The average surface temperature ranged from 6.91 ± 1.23 °C to 26.16 ± 2.06 °C, with a significant increase from spring to summer. On the other hand, the seasonal average salinity ranged from 31.83 ± 0.18 psu to 32.25 ± 0.41 psu, and significant seasonal changes were not observed (Kruskal–Wallis test, p > 0.05). The stratification intensity estimated from the stability index was significantly higher in summer than in other seasons (Kruskal–Wallis test, p < 0.05). The ranges of NO3 + NO2, NH4, SiO2, and DIP concentrations during the study period were 0.51–11.95, 0.17–1.06, 2.18–9.96, and 0.04–0.73 μM, respectively. The inorganic nutrient conditions in this study were within the range reported previously in the YS [25,38]. The average inorganic nutrient concentrations showed seasonal differences (Kruskal–Wallis test, p < 0.05), except for NH4 (Kruskal–Wallis test, p > 0.05). The mean concentration of NH4 showed no significant seasonal differences (0.46 ± 0.17 µM, 0.51 ± 0.29 µM, 0.38 ± 0.12 µM, and 0.42 ± 0.11 µM for winter, spring, summer, and autumn, respectively). The mean concentrations of inorganic nutrients, except for NH4, were highest in winter (6.60 ± 1.69 µM, 0.5 ± 0.10 µM, and 7.55 ± 0.91 µM for NO3 + NO2, SiO2, and DIP, respectively), whereas they were significantly lower in summer (1.60 ± 1.87 µM, 0.08 ± 0.03 µM, and 3.03 ± 0.79 µM for NO3 + NO2, SiO2, and DIP, respectively) than in winter and spring (Kruskal–Wallis test, p < 0.05). This is because the strong water column stratification during summer prevents nutrient transfer from deep to surface water [25,39,40]. The depletion of surface water nutrients may be due to thermal stratification, as this study also showed a high summer SI (Kruskal–Wallis test, p < 0.01). In contrast, the water column was homogeneously mixed, supplying nutrients from the depths to the surface in the winter.
3.2. Total Chlorophyll-a Concentrations and Total Phytoplankton Community
The highest total HPLC chlorophyll-a concentration was detected in spring (2.76 ± 1.82 μg/L), followed by autumn (0.98 ± 0.40 μg/L), winter (0.55 ± 0.18 μg/L), and summer (0.29 ± 0.18 μg/L), respectively (Figure 2). Warmer temperatures, increased sunlight, and weak stratification triggers the spring phytoplankton bloom in the YS, resulting in higher chlorophyll-a concentrations in spring compared with winter and summer (Kruskal–Wallis test; p < 0.05) [25,41], whereas lower chlorophyll concentration was observed in summer compared with spring and autumn (Kruskal–Wallis test; p < 0.05) due to nutrient restriction caused by strong stratification [25].
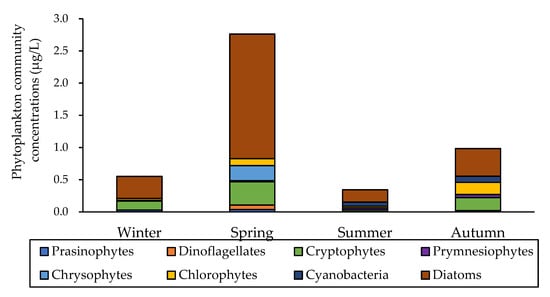
Figure 2.
Phytoplankton community concentrations (μg/L) in the YS during the study period in 2019.
The total phytoplankton community results, calculated by the CHEXTAX program, are presented in Figure 2. During the study period, the major communities of total phytoplankton were diatoms (55.0 ± 10.2%), cryptophytes (16.9 ± 9.3%), cyanobacteria (9.5 ± 12.9%), and chlorophytes (8.4 ± 6.1%). Diatoms were predominant in all seasons (one-way ANOVA, p > 0.05), whereas the relative proportions of other phytoplankton communities changed seasonally except prasinophytes and chrysophytes (Kruskal–Wallis test; p < 0.05). The relative proportions of diatoms accounted for more than half of the total phytoplankton community in spring (65.3 ± 14.6%) and winter (61.9 ± 17.4%); meanwhile, in summer and autumn, the relative proportions of diatoms accounted for 48.9 ± 26.7%, and 43.9 ± 13.5%, respectively. The relative proportions of cryptophytes were high in winter (26.1 ± 12.0%), followed by autumn (20.4 ± 8.05%) and spring (16.8 ± 7.9%), whereas cryptophytes were rarely observed in summer (Kruskal–Wallis test; p < 0.05). In Bohai bay of the Bohai Sea, diatom dominates more than 80%, and the contribution of other communities are less than 6% in spring [42]. The relative proportions of cyanobacteria and prymnesiophytes were high in summer (27.3 ± 26.0% and 12.0 ± 7.6%, respectively) and autumn (10.5 ± 9.4% and 5.1 ± 3.2%, respectively), whereas they were rarely observed in winter and spring (Kruskal–Wallis test; p < 0.05). In Daya Bay, which is located in the west of the YS, dinoflagellates were dominant in spring and observed throughout the four seasons [43]. In contrast, dinoflagellates were hardly observed in this study except in spring (Kruskal–Wallis test; p < 0.05). The relationships between the total phytoplankton communities and environmental variables are presented in Figure 3. Taken together, axis 1 and axis 2 in the CCA explained 78.3% of the correlation between the total phytoplankton communities and environmental variables in the YS in 2019. Diatoms were situated adjacent to the center of the CCA ordinates and close to the arrows including salinity, DIP, and NH4. Cyanobacteria and Prymnesiophytes were near the SI, N/P ratio, and temperature arrows, while Cryptophytes and Prasionophytes were closely related to the SiO2 arrow.
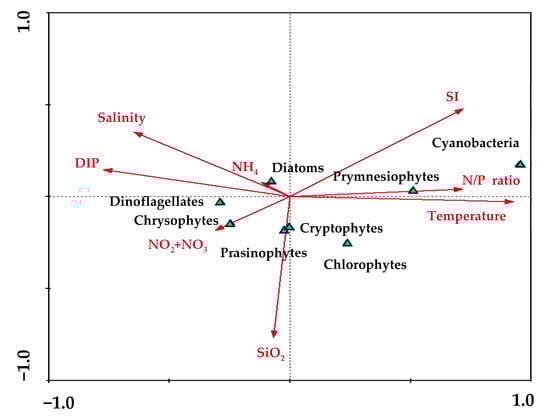
Figure 3.
Canonical component analysis (CCA) to determine relationships among the environmental factors and phytoplankton communities.
The diatoms formed a dominant community in the YS, but the diatom composition in this study (55%) was distinctly lower than those reported previously in 1985 (80.3%) and 2000 (67.5%) [21]. According to [44,45], the positive trend of DIN concentration and the negative trend of DIP and SiO2 concentrations have gradually increased the N/P ratio in the YS, gradually shifting to a P-limited environment. Although the P-limited environment was observed only in summer and autumn in this study, the gradually increasing N/P ratio and limited P might have caused the transition from a diatom-dominant environment to a small-sized flagellate-dominant environment [10,38,46], as DIP is a more important limiting factor for the growth of diatoms than other flagellates [47]. Indeed, the proportion of cryptophytes—a type of flagellate—was higher (16.9%) in this study than in previous studies in the YS [17,32]. Cryptophytes are known to be adaptable to a variety of environmental conditions, from stratified and well-lit environments to cool, well-mixed and light-limited environments [48]. Consequently, diatoms negatively respond to declining DIP and P-limitation, whereas cryptophytes are resistant to these conditions [49]. Therefore, the cryptophyte community could flourish, whereas the diatom community decreased under the current nutrient environment in the YS. Cyanobacteria are considered to be an important group in phytoplankton communities during summer in this study. Cyanobacteria have previously been reported to dominate at the surface layer in the YS during summer [24,50]. At the surface, low nutrient concentrations limit the growth of phytoplankton [51,52]. However, these conditions are favorable for the growth of small-sized cyanobacteria, in comparison to other phytoplankton communities [53,54]. In addition, many cyanobacteria have a competitive advantage under high temperatures [55,56]. Therefore, cyanobacteria were observed more under the high temperature and low nutrient conditions in summer, compared to other seasons. Unlike other phytoplankton communities, chlorophytes did not show a clear correlation with environmental factors such as water temperature, salinity, nutrients, and SI during this study (Figure 3). Therefore, the chlorophytes may have been more affected by other factors, such as competition with other phytoplankton groups and predation pressure, rather than physical and chemical environmental factors.
3.3. Size-Fractionated Chlorophyll-a Concentration and Phytoplankton Community Structure
Unlike the Southern Central YS dominated by pico-sized phytoplankton throughout the four seasons [25], the phytoplankton size structure in study area varied seasonally (p < 0.05; Kruskal–Wallis test) (see Figure 4). Based on the fluorometric size-fractionated chlorophyll-a concentrations in this study, pico-sized phytoplankton (0.7–2 μm) mainly dominated in summer (42.5 ± 14.1%) and autumn (51.0 ± 22.6%). The contribution of micro-sized phytoplankton (>20 μm) to the total chlorophyll-a was comparatively highest in spring (47.6 ± 27.1%), whereas the nano-sized phytoplankton (2–20 μm) contribution was comparatively dominant in winter (46.4 ± 9.9%). The relatively high contribution of micro-sized phytoplankton in spring compared to other seasons is similar to those of previous studies [38].
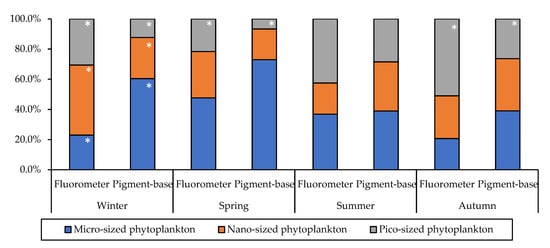
Figure 4.
The relative contributions of size-fractionated chlorophyll-a concentrations, as determined by two methods. The white star (*) implies a significant difference at the level of p < 0.05.
Previously, Choi [57] found that micro-sized phytoplankton were dominant (approximately 50%) during the winter and spring seasons. In contrast, the nano-sized phytoplankton were dominant, instead of micro-sized phytoplankton, during winter in this study. Furthermore, the proportions of nano- and pico-sized phytoplankton during autumn were distinctly higher in this study (79.3%) than in 1992 (64.4%) [58]. Higher contributions of small-sized phytoplankton (<2 μm) to the chlorophyll-a concentration and primary production have consistently been observed in the YS recently [10]. However, the size-fractionated phytoplankton proportions vary largely seasonally, spatially, and inter-annually [30]. Further research should be carried out to verify the increasing contribution of small-sized phytoplankton in the YS.
In comparison to the fluorometric results for the relative contributions of size-fractionated chlorophyll-a concentrations, pigment-based size chlorophyll-a concentrations were obtained based on DPA, as presented in Figure 4. Micro-sized phytoplankton were dominant during the study period, especially winter and spring (60.3 ± 16.6% and 73.0 ± 13.8%, respectively). In summer and autumn, the contributions of micro- and nano-sized phytoplankton were collectively dominant, but the contribution of micro-sized phytoplankton (summer 38.9 ± 28.3%; autumn 39.0 ± 20.4%) was somewhat higher than that of nano-sized phytoplankton (summer 32.6 ± 20.5%; autumn 34.6 ± 15.2%). Comparing the two different methods, the relative contributions of phytoplankton size classes were significantly different in winter and autumn (t-test, p < 0.05). While micro-sized phytoplankton were the predominant community in the DPA results in winter, nano-sized phytoplankton were found to be dominant, based on the fluorometer analysis results. In addition, pico-sized phytoplankton were a predominant community in a fluorometer results, whereas their composition was lowest in the DPA results in autumn. These discrepancies may have been caused by the pigment-based size fractionation of DPA, which could lead to over-estimation of micro-sized phytoplankton and under-estimation of the contribution of nano-sized phytoplankton, as further discussed below.
The results for the size-fractionated phytoplankton communities calculated by the CHEXTAX program are presented in Figure 5. The large-sized phytoplankton group (>20 μm) was dominated by diatoms (89.0 ± 10.6%) during the study period. In particular, large-sized diatoms accounted for the majority (99.4 ± 1.0%) in winter, while the proportion decreased from winter to fall. Among the large-sized phytoplankton group, cyanobacteria were first detected in summer (14.4 ± 27.5%), but their relative proportion increased in autumn (20.9 ± 29.7%). In comparison, other phytoplankton communities were rarely observed in the large-sized phytoplankton group, with contribution rates of less than 1%. Compared to the large-sized phytoplankton group, various phytoplankton communities were observed in the small-sized phytoplankton group (<20 μm). Diatoms were also the dominant phytoplankton community (41.9 ± 9.1%) in the small-sized phytoplankton group. The relative proportion of small-sized diatoms was highest in winter (54.7 ± 16.0%), followed by spring (42.1 ± 10.8%), summer (36.2 ± 12.4%), and autumn (34.6 ± 16.7%). The relative proportion of small-sized cryptophytes was high in winter (28.6 ± 10.8%) and low in summer (5.8 ± 9.2%). The proportion of small-sized chlorophytes was low in winter (8.0 ± 5.1%) and increased along the seasons. The small-sized cyanobacteria were first observed in summer (25.2 ± 18.1%) and decreased to 9.4 ± 7.6% in autumn.
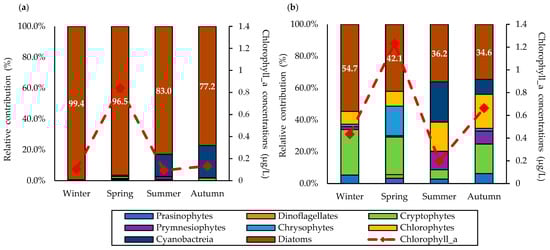
Figure 5.
Relative contributions of the size-fractionated phytoplankton community in the YS during the study period in 2019: (a) large-sized group; and (b) small-sized group.
In contrast to the assumption for the DPA that diatoms mainly make up the micro-sized phytoplankton [35,43,59], a significant presence of diatoms (41.9 ± 9.1%) was found in the small-sized phytoplankton group based on the results from the size-fractionated pigment analysis in this study. In particular, the over-estimated contribution of micro-sized phytoplankton was conspicuous in winter, where the small-sized diatoms accounted for more than half of the total diatom community (72.4 ± 12.1%). In [60], it was reported that many diatoms belong to the nano-sized phytoplankton group, and a few species even overlapped with the pico-sized phytoplankton class. According to [21], the most dominant diatom species in the YS are Chaetoceros sp., Cylindrocystis sp., Proboscia, and Skeletonema costatum. In particular, Proboscia and Skeletonema costatum are nano-sized diatoms with a diameter of less than 20 μm [33]. Therefore, the existence of these nano-sized diatoms should be considered when conducting DPA, as DPA requires a careful interpretation of the size-fractionated phytoplankton biomass.
3.4. Seasonal Variation in the Size Structure of Diatoms
During the study period, the concentrations of large-sized diatoms (0.82 ± 0.65 μg/L) and small-sized diatoms (0.54 ± 0.35 μg/L) were significantly higher in spring than other seasons (t-test, p < 0.05). In contrast, similar concentrations of large- and small-sized diatoms were observed in other seasons (Figure 6).
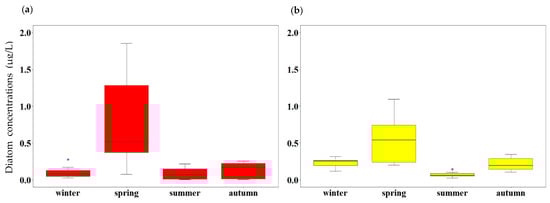
Figure 6.
The concentrations of size-fractionated diatoms: (a) large-sized diatoms; and (b) small-sized diatoms. An asterisk (*) indicates an outlier.
In the YS, diatom blooming is observed during spring [32,41,61]. The proportion of small-sized diatoms in the total diatoms during the study period varied between 14.8% and 97.9% (Figure 7). The seasonally averaged proportion of small-sized diatoms was highest in winter (72.4 ± 12.1%), followed by autumn (70.9 ± 23.0%), summer (61.6 ± 27.4%), and spring (44.4 ± 23.7%). Overall, small-sized diatoms were dominant in the YS (62.3 ± 12.9%) during our study period.
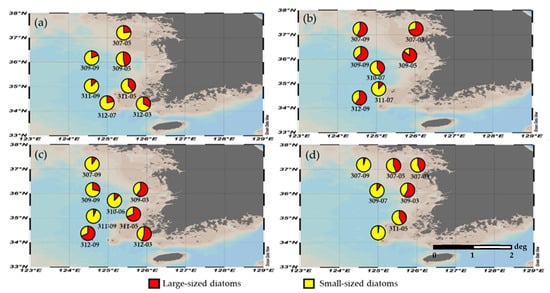
Figure 7.
Relative contributions of size-fractionated diatoms during the study period in 2019: (a) winter; (b) spring; (c) summer; and (d) autumn.
In [62], it was reported that environmental changes (e.g., global warming and human impacts) decrease the cell size structure of phytoplankton, especially centric diatoms. In agreement with this, [63,64] reported that the size of the diatoms decreases as the water temperature increases. The annual SST in the YS has gradually increased over the past few decades (from 10.5 °C in 1976 to 13.5 °C in 2000) [44], and an increasing trend of 0.0135 °C/yr was observed from 1982 to 2017 [65]. Therefore, the increasing SST could affect the transition in the phytoplankton size structure. Furthermore, subsequent increasing stratification and nutrient limitations could affect cell size reductions in phytoplankton communities [66]. Therefore, if the water temperature continues to increase and stratification is strengthened in the YS, the proportion of small-sized diatoms may gradually increase. In small-sized phytoplankton-dominated ecosystems, the total primary production and energy transfer efficiency could be altered [38,67]. A further monitoring programs for phytoplankton communities, especially considering small-sized phytoplankton groups, should be conducted in the YS with respect to ongoing environmental changes.
4. Summary and Conclusions
This study is the first to report seasonal variations in the size-fractionated phytoplankton community structure in the YS. Overall, diatoms were dominant (55%) in the YS, with the community size being strongly associated with salinity and the concentrations of DIP and NH4, based on CCA analysis. Compared to previous studies, the contribution of diatoms was lower and the contribution of cryptophytes was higher in this study, which may be due to the recent shift in inorganic nutrient conditions in the YS [44,45]. The size-fractionated phytoplankton community results demonstrated that the large-sized phytoplankton group was largely dominated by diatoms (89.0 ± 10.6%), whereas the small-sized phytoplankton group was dominated by small-sized diatoms (41.9 ± 9.1%) and cryptophytes (19.2 ± 9.8%). Until recently, the importance of small-sized diatoms has been overlooked, as it is difficult to detect and identify them. However, this study showed that small-sized diatoms contributed greatly to the total diatoms in the YS, accounting for 62.3%. Environmental changes due to continuous climate warming are expected to decrease the cell size of phytoplankton—especially centric diatoms—which could largely affect the quantity and quality of food sources in marine ecosystems. This study provides an important baseline for understanding the seasonal variations in different size groups of the phytoplankton community, especially different sizes of diatoms. However, this study was conducted only at the surface layer, and specific identification of diatom species was lacking. Therefore, further detailed studies should be conducted in order to better understand the potential ecological roles of small-sized diatoms.
Author Contributions
Conceptualization, Y.K. and S.-H.L.; methodology, Y.K. and J.-J.K.; formal analysis, Y.K.; investigation, Y.K., H.-K.J., J.-J.K., D.L., N.J., K.K., S.P. and J.K.; data curation, Y.K.; writing—original draft preparation, Y.K.; writing—review and editing, S.-H.L.; visualization, Y.K.; supervision, S.-H.L.; project administration, S.-H.Y. and S.-H.L.; funding acquisition, S.-H.Y., H.-J.O., H.J. and S.-H.L. All authors have read and agreed to the published version of the manuscript.
Funding
This research was supported by the “Development of assessment technology on the structure variations in marine ecosystem (R2022073)” funded by the National Institute of Fisheries Science (NIFS), Korea.
Institutional Review Board Statement
Not applicable.
Informed Consent Statement
Not applicable.
Data Availability Statement
Not applicable.
Acknowledgments
We appreciate the captains and crew of R/V Tamgu 8 for their assistance in collecting our samples. We would also like to thank the researchers in the NIFS for their assistance with sample analysis. We thank the anonymous reviewers who greatly improved an earlier version of manuscript.
Conflicts of Interest
The authors declare no conflict of interest.
References
- Falkowski, P.G.; Barber, R.T.; Smetacek, V. Biogeochemical controls and feedbacks on ocean primary production. Science 1998, 281, 200–206. [Google Scholar] [CrossRef] [PubMed]
- Behrenfeld, M.J.; Randerson, J.T.; McClain, C.R.; Feldman, G.C.; Los, S.O.; Tucker, C.J.; Falkowski, P.G.; Field, C.B.; Frouin, R.; Esaias, W.E. Biospheric primary production during an enso transition. Science 2001, 291, 2594–2597. [Google Scholar] [CrossRef] [PubMed]
- Winder, M.; Sommer, U. Phytoplankton response to a changing climate. Hydrobiologia 2012, 698, 5–16. [Google Scholar] [CrossRef]
- Froneman, P.; Pakhomov, E.; Balarin, M.G. Size-fractionated phytoplankton biomass, production and biogenic carbon flux in the eastern Atlantic sector of the Southern Ocean in late austral summer 1997–1998. Deep-Sea Res. II: Top. Stud. Oceanogr. 2004, 51, 2715–2729. [Google Scholar] [CrossRef][Green Version]
- Chisholm, S.W. Phytoplankton Size. In Primary Productivity and Biogeochemical Cycles in the Sea; Falkowski, P.G., Woodhead, A.D., Eds.; Springer: New York, NY, USA, 1992. [Google Scholar]
- Agustí, S.; González-Gordillo, J.I.; Vaqué, D.; Estrada, M.; Cerezo, M.I.; Salazar, G.; Gasol, J.M.; Duarte, C.M. Ubiquitous healthy diatoms in the deep sea confirm deep carbon injection by the biological pump. Nat. Commun. 2015, 6, 1–8. [Google Scholar] [CrossRef]
- Falkowski, P.G.; Laws, E.A.; Barber, R.T.; Murray, J.W. Phytoplankton and Their Role in Primary, New, and Export Production. In Ocean Biogeochemistry; Fasham, M.J.R., Ed.; Springer: Berlin/Heidelberg, Germany, 2003; pp. 99–121. [Google Scholar]
- Peter, K.H.; Sommer, U.J.P.o. Phytoplankton cell size reduction in response to warming mediated by nutrient limitation. PLoS ONE 2013, 8, e71528K. [Google Scholar] [CrossRef]
- Morán, X.A.G.; López-Urrutia, Á.; Calvo-Díaz, A.; LI, W.K.W. Increasing importance of small phytoplankton in a warmer ocean. Glob. Chang. Biol. 2010, 16, 1137–1144. [Google Scholar] [CrossRef]
- Jang, H.K.; Kang, J.J.; Lee, J.H.; Kim, M.; Ahn, S.H.; Jeong, J.Y.; Yun, M.S.; Han, I.S.; Lee, S.H. Recent Primary Production and Small Phytoplankton Contribution in the Yellow Sea during the Summer in 2016. Ocean Sci. J. 2018, 53, 509–519. [Google Scholar] [CrossRef]
- Finkel, Z.V. Does phytoplankton cell size matter? The evolution of modern marine food webs. In Evolution of Primary Producers in the Sea; Falkowski, P.G., Knoll, A.H., Eds.; Academic Press: New York, NY, USA, 2007; pp. 333–350. [Google Scholar]
- F Finkel, Z.V.; Beardall, J.; Flynn, K.J.; Quigg, A.; Rees, T.A.V.; Raven, J.A. Phytoplankton in a changing world: Cell size and elemental stoichiometry. J. Plankton Res. 2010, 32, 119–137. [Google Scholar] [CrossRef]
- G Gin, K.Y.-H.; Lin, X.; Zhang, S. Dynamics and size structure of phytoplankton in the coastal waters of Singapore. J. Plankton Res. 2000, 22, 1465–1484. [Google Scholar] [CrossRef]
- Yoo, S.; An, Y.-R.; Bae, S.; Choi, S.; Ishizaka, J.; Kang, Y.-S.; Kim, Z.G.; Lee, C.; Lee, J.B.; Li, R.; et al. Status and trends in the Yellow Sea and East China Sea region. In Marine Ecosystems of the North Pacific Ocean, 2003–2008; McKinnell, S.M., Dagg, M.J., Eds.; PICES Special Publication: Sidney, BC, Canada, 2010; Volume 4, pp. 360–393. [Google Scholar]
- B Belkin, I.M.; Cornillon, P.C.; Sherman, K. Fronts in Large Marine Ecosystems. Prog. Oceanogr. 2009, 81, 223–236. [Google Scholar] [CrossRef]
- Bian, C.W.; Jiang, W.S.; Greatbatch, R.J. An exploratory model study of sediment transport sources and deposits in the Bohai Sea, Yellow Sea, and East China Sea. J. Geophys. Res. Ocean. 2013, 118, 5908–5923. [Google Scholar] [CrossRef]
- Jiang, Z.; Gao, Y.; Zhai, H.; Jin, H.; Zhou, F.; Shou, L.; Yan, X.; Chen, Q. Regulation of spatial changes in phytoplankton community by water column stability and nutrients in the southern Yellow Sea. J. Geophys. Res. Biogeosci. 2019, 124, 2610–2627. [Google Scholar] [CrossRef]
- Wright, S.; Jeffrey, S.; Mantoura, R. Phytoplankton Pigments in Oceanography: Guidelines to Modern Methods; Jeffrey, S., Mantoura, R., Wright, S., Eds.; Unesco Pub.: Paris, France, 2005. [Google Scholar]
- Agirbas, E.; Feyzioglu, A.M.; Kopuz, U.; Llewellyn, C.A. Phytoplankton community composition in the south-eastern Black Sea determined with pigments measured by HPLC-CHEMTAX analyses and microscopy cell counts. J. Mar. Biol. Assoc. UK 2015, 95, 35–52. [Google Scholar] [CrossRef]
- Schlüter, L.; Lauridsen, T.; Krogh, G.; Jørgensen, T. Identification and quantification of phytoplankton groups in lakes using new pigment ratios—A comparison between pigment analysis by HPLC and microscopy. Freshw. Biol. 2006, 51, 1474–1485. [Google Scholar] [CrossRef]
- Luan, Q.; Kang, Y.; Wang, J. Long-term changes within the phytoplankton community in the Yellow Sea (1985–2015). J. Fish. Sci. China 2020, 27, 1–11. [Google Scholar]
- Gao, Y.; Jiang, Z.; Liu, J.; Chen, Q.; Zeng, J.; Huang, W. Seasonal variations of net-phytoplankton community structure in the southern Yellow Sea. J. Ocean Univ. China 2013, 12, 557–567. [Google Scholar] [CrossRef]
- Liu, H.J.; Huang, Y.J.; Zhai, W.D.; Jin, H.; Sun, J. Phytoplankton communities and its controlling factors in summer and autumn in the southern Yellow Sea, China. Acta Oceanol. Sin. 2015, 34, 114–123. (In Chinese) [Google Scholar] [CrossRef]
- Kang, J.-J.; Min, J.-O.; Kim, Y.; Lee, C.-H.; Yoo, H.; Jang, H.-K.; Kim, M.-J.; Oh, H.-J.; Lee, S.-H. Vertical Distribution of Phytoplankton Community and Pigment Production in the Yellow Sea and the East China Sea during the Late Summer Season. Water 2021, 13, 3321. [Google Scholar] [CrossRef]
- Fu, M.Z.; Wang, Z.L.; Li, Y.; Li, R.X.; Sun, P.; Wei, X.H.; Lin, X.Z.; Guo, J.S. Phytoplankton biomass size structure and its regulation in the Southern Yellow Sea (China): Seasonal variability. Cont. Shelf Res. 2009, 29, 2178–2194. [Google Scholar] [CrossRef]
- Ming, F.; Ping, S.; Zong, W.; Yan, L.; Rui, L. Seasonal variations of phytoplankton community size structures in the Huanghai (Yellow) Sea Cold Water Mass area. Haiyang Xuebao 2010, 32, 120–129. [Google Scholar]
- Cho, B.C.; Park, M.G.; Shim, J.H.; Choi, D.H. Sea-surface temperature and f-ratio explain large variability in the ratio of bacterial production to primary production in the Yellow Sea. Mar. Ecol. Prog. Ser. 2001, 216, 31–41. [Google Scholar] [CrossRef]
- Parsons, T.R.; Maita, Y.; Lalli, C.M. A Manual of Biological and Chemical Methods for Seawater Analysis; Pergamon Press: Oxford, UK, 1984. [Google Scholar]
- Kang, J.J.; Lee, J.H.; Kim, H.C.; Lee, W.C.; Lee, D.; Jo, N.; Min, J.-O.; Lee, S.H. Monthly Variations of Phytoplankton Community in Geoje-Hansan Bay of the Southern Part of Korea Based on HPLC Pigment Analysis. J. Coast. Res. 2018, 85, 356–360. [Google Scholar] [CrossRef]
- Lee, Y.-W.; Park, M.-O.; Im, Y.-S.; Kim, S.-S.; Kang, C.-K. Application of photosynthetic pigment analysis using a HPLC and CHEMTAX program to studies of phytoplankton community composition. Sea 2011, 16, 117–124. [Google Scholar] [CrossRef]
- Mackey, M.D.; Mackey, D.J.; Higgins, H.W.; Wright, S.W. CHEMTAX—A program for estimating class abundances from chemical markers: Application to HPLC measurements of phytoplankton. Mar. Ecol. Prog. Ser. 1996, 144, 265–283. [Google Scholar] [CrossRef]
- Liu, X.; Huang, B.Q.; Huang, Q.; Wang, L.; Ni, X.B.; Tang, Q.S.; Sun, S.; Wei, H.; Liu, S.M.; Li, C.L.; et al. Seasonal phytoplankton response to physical processes in the southern Yellow Sea. J. Sea Res. 2015, 95, 45–55. [Google Scholar] [CrossRef]
- Claustre, H. The trophic status of various oceanic provinces as revealed by phytoplankton pigment signatures. Limnol. Oceanogr. 1994, 39, 1206–1210. [Google Scholar] [CrossRef]
- Vidussi, F.; Claustre, H.; Manca, B.B.; Luchetta, A.; Marty, J.-C. Phytoplankton Pigment Distribution in Relation to Upper Thermocline Circulation in the Eastern Mediterranean Sea during Winter. J. Geophys. Res. 2001, 106, 19939–19956. [Google Scholar] [CrossRef]
- Uitz, J.; Claustre, H.; Morel, A.; Hooker, S.B. Vertical Distribution of Phytoplankton Communities in Open Ocean: An Assessment Based on Surface Chlorophyll. J. Geophys. Res. 2006, 111, C08005. [Google Scholar] [CrossRef]
- Sun, X.; Shen, F.; Brewin, R.J.; Liu, D.; Tang, R. Twenty-year variations in satellite-derived chlorophyll-a and phytoplankton size in the Bohai Sea and Yellow Sea. J. Geophys. Res. Ocean. 2019, 124, 8887–8912. [Google Scholar] [CrossRef]
- Sun, D.; Huan, Y.; Wang, S.; Qiu, Z.; Ling, Z.; Mao, Z.; He, Y. Remote sensing of spatial and temporal patterns of phytoplankton assemblages in the Bohai Sea, Yellow Sea, and east China sea. Water Res. 2019, 157, 119–133. [Google Scholar] [CrossRef] [PubMed]
- Jang, H.K.; Youn, S.H.; Joo, H.; Kim, Y.; Kang, J.J.; Lee, D.; Jo, N.; Kim, K.; Kim, M.-J.; Kim, S.; et al. First Concurrent Measurement of Primary Production in the Yellow Sea, the South Sea of Korea, and the East/Japan Sea, 2018. J. Mar. Sci. Eng. 2021, 9, 1237. [Google Scholar] [CrossRef]
- Tian, T.; Hao, W.; Jian, S.; Changsoo, C.; Wenxin, S. Study on cycle and budgets of nutrients in the Yellow Sea. Adv. Mar. Biol. 2003, 21, 1–11. [Google Scholar]
- Goldman, C.R.; Elser, J.J.; Richards, R.C.; Reuter, J.E.; Priscu, J.C.; Levin, A.L. Thermal stratification, nutrient dynamics and phytoplankton productivity during the onset of spring phytoplankton growth in Lake Baikal, Russia. Hydrobiologia 1996, 331, 9–24. [Google Scholar] [CrossRef]
- Tang, Q.; Su, J.; Zhang, J.; Tong, L. Spring blooms and the ecosystem processes: The case study of the Yellow Sea. Deep-Sea Res. II Top. Stud. Oceanogr. 2013, 97, 1–3. [Google Scholar] [CrossRef]
- Lu, L.; Jiang, T.; Xu, Y.; Zheng, Y.; Chen, B.; Cui, Z.; Qu, K. Succession of phytoplankton functional groups from spring to early summer in the central Bohai Sea using HPLC–CHEMTAX approaches. J. Oceanogr. 2018, 74, 381–392. [Google Scholar] [CrossRef]
- Wang, L.; Ou, L.; Huang, K.; Chai, C.; Wang, Z.; Wang, X.; Jiang, T. Determination of the spatial and temporal variability of phytoplankton community structure in Daya Bay via HPLC-CHEMTAX pigment analysis. Chin. J. Oceanol. Limnol. 2018, 36, 750–760. [Google Scholar] [CrossRef]
- Lin, C.; Ning, X.; Su, J.; Lin, Y.; Xu, B. Environmental changes and the responses of the ecosystems of the Yellow Sea during 1976–2000. J. Mar. Syst. 2005, 55, 223–234. [Google Scholar] [CrossRef]
- Wei, Q.; Yao, Q.; Wang, B.; Wang, H.; Yu, Z. Long-term variation of nutrients in the southern Yellow Sea. Cont. Shelf Res. 2015, 111, 184–196. [Google Scholar] [CrossRef]
- Jin, J.; Liu, S.M.; Ren, J.L.; Liu, C.G.; Zhang, J.; Zhang, G.L.; Huang, D.J. Nutrient dynamics and coupling with phytoplankton species composition during the spring blooms in the Yellow Sea. Deep. Res. Part II Top. Stud. Oceanogr. 2013, 97, 16–32. [Google Scholar] [CrossRef]
- Egge, J.K. Are diatoms poor competitors at low phosphate concentrations? J. Mar. Syst. 1998, 16, 191–198. [Google Scholar] [CrossRef]
- Cerino, F.; Zingone, A. A survey of cryptomonad diversity and seasonality at a coastal Mediterranean site. Eur. J. Phycol. 2006, 41, 363–378. [Google Scholar] [CrossRef]
- Kang, Y.; Moon, C.-H.; Kim, H.-J.; Yoon, Y.H.; Kang, C.-K. Water Quality Improvement Shifts the Dominant Phytoplankton Group From Cryptophytes to Diatoms in a Coastal Ecosystem. Front. Mar. Sci. 2021, 1125. [Google Scholar] [CrossRef]
- Liu, X.; Huang, B.; Liu, Z.; Wang, L.; Wei, H.; Li, C.; Huang, Q. High-resolution phytoplankton diel variations in the summer stratified central Yellow Sea. J. Oceanogr. 2012, 68, 913–927. [Google Scholar] [CrossRef]
- Tilman, D. Resource Competition and Community Structure; Princeton University Press: Princeton, NJ, USA, 1982. [Google Scholar]
- Tilman, D. Resource competition between plankton algae: An experimental and theoretical approach. Ecology 1977, 58, 338–348. [Google Scholar] [CrossRef]
- Smith, R.E.; Kalff, J. Size dependence of growth rate, respiratory electron transport system activity and chemical composition in marine diatoms in the laboratory. J. Phycol. 1982, 18, 275–284. [Google Scholar] [CrossRef]
- Raven, J. The twelfth Tansley Lecture. Small is beautiful: The picophytoplankton. Funct. Ecol. 1998, 12, 503–513. [Google Scholar] [CrossRef]
- Mur, R.; Skulberg, O.; Utkilen, H. Cyanobacteria in the environment. In Toxic Cyanobacteria in Water; Chorus, I., Batram, J., Eds.; E&FN Spon: London, UK, 1999; pp. 15–40. [Google Scholar]
- Peperzak, L. Climate change and harmful algal blooms in the North Sea. Acta Oecol. 2003, 24, S139–S144. [Google Scholar] [CrossRef]
- Choi, J. Phytoplankton Ecology in the Yellow Sea; Bumwoo Publishing Company: Seoul, Korea, 2002; pp. 311–330. [Google Scholar]
- Choi, J.K.; Noh, J.H.; Shin, K.S.; Hong, K.H. The early autumn distribution of chlorophyll-a and primary productivity in the Yellow Sea, 1992. Yellow Sea 1995, 1, 68–80. [Google Scholar]
- Lee, M.; Kim, Y.-B.; Park, C.-H.; Baek, S.-H. Characterization of Seasonal Phytoplankton Pigments and Functional Types around Offshore Island in the East/Japan Sea, Based on HPLC Pigment Analysis. Sustainability 2022, 14, 5306. [Google Scholar] [CrossRef]
- Leblanc, K.; Queguiner, B.; Diaz, F.; Cornet, V.; Michel-Rodriguez, M.; de Madron, X.; Bowler, C.; Malviya, S.; Thyssen, M.; Gregori, G.; et al. Nanoplanktonic diatoms are globally overlooked but play a role in spring blooms and carbon export. Nat. Commun. 2018, 9, 953. [Google Scholar] [CrossRef]
- December, P. Uncoupling of bacteria and phytoplankton during a spring diatom bloom in the mouth of the Yellow Sea. Mar. Ecol. Prog Ser. 1994, 115, 181–190. [Google Scholar]
- Abonyi, A.; Kiss, K.T.; Hidas, A.; Borics, G.; Várbíró, G.; Ács, É. Cell Size Decrease and Altered Size Structure of Phytoplankton Constrain Ecosystem Functioning in the Middle Danube River Over Multiple Decades. Ecosystems 2020, 23, 1254–1264. [Google Scholar] [CrossRef]
- Montagnes, D.J.S.; Franklin, D.J. Effect of temperature on diatom volume, growth rate, and carbon and nitrogen content: Reconsidering some paradigms. Limnol. Oceanogr. 2001, 46, 2008–2018. [Google Scholar] [CrossRef]
- Jørgensen, E.G. The adaptation of plankton algae:II. Aspects of the temperature adaptation of Skeletonema costatum. Physiol. Plant 1968, 21, 423–427. [Google Scholar] [CrossRef]
- Sun, W.; Zhang, J.; Meng, J.; Liu, Y. Sea surface temperature characteristics and trends in China offshore seas from 1982 to 2017. J. Coast. Res. 2019, 90, 27–34. [Google Scholar] [CrossRef]
- Finkel, Z.V.; Vaillancourt, C.J.; Irwin, A.J.; Reavie, E.D.; Smol, J.P. Environmental control of diatom community size structure varies across aquatic ecosystems. Proc. R. Soc. B: Biol. Sci. 2009, 276, 1627–16344. [Google Scholar] [CrossRef]
- Lee, S.H.; Yun, M.S.; Kim, B.K.; Saitoh, S.I.; Kang, C.K.; Kang, S.H.; Whitledge, T. Latitudinal carbon productivity in the Bering and Chukchi Seas during the summer in 2007. Cont. Shelf Res. 2013, 59, 28–36. [Google Scholar]


Publisher’s Note: MDPI stays neutral with regard to jurisdictional claims in published maps and institutional affiliations. |
© 2022 by the authors. Licensee MDPI, Basel, Switzerland. This article is an open access article distributed under the terms and conditions of the Creative Commons Attribution (CC BY) license (https://creativecommons.org/licenses/by/4.0/).