Article

Numerical Simulation on Dynamic Characteristics of Longitudinal Launching of Large Container Ships

1
State Key Laboratory of Structural Analysis for Industrial Equipment, School of Naval Architecture Engineering, Dalian University of Technology, Dalian 116024, China
2
COSCO Shipping Heavy Industry (Dalian) Co., Ltd., Dalian 116113, China
3
Maritime Production Research Pte. Ltd., Singapore 915806, Singapore
*
Author to whom correspondence should be addressed.
J. Mar. Sci. Eng. 2022, 10(11), 1583; https://doi.org/10.3390/jmse10111583
Submission received: 12 September 2022 / Revised: 11 October 2022 / Accepted: 13 October 2022 / Published: 26 October 2022
(This article belongs to the Special Issue Maritime and Ship Design)

Abstract

:
The upsizing and rapid development of container ships has resulted in many large ships launching in small slipways due to the lagging of advanced equipment. In particular, the dynamic characteristics of these large ships in the longitudinal launching operation under restricted water are yet to be studied in detail. In this study, a ship model to simulate the longitudinal launching process of an 8500 TEU container ship was created based on the URANS method. The ship resistance in calm water was determined and validated against the experimental data. The influence of the stern appendage on the ship’s resistance and the flow field around the hull, with and without the aft poppet, under various water-depth-to-draught ratios was analyzed. A comparison of the ship’s resistance between the numerical and the experimental data shows that the difference is minimal, within 1.5%. The numerical results revealed that the aft poppets change the flow pattern and effectively reduce the pressure drag in the drifting stage. The shallow water causes a restraining effect on the ship. The proposed analytical approach in the numerical analysis, considering the aft poppet and the water depth, could provide a better simulation for a large ship’s longitudinal launching operation.

1. Introductions

The improvement of shipbuilding technology and increasing import and export volume of international trade have resulted in modern container ships gradually developing toward upsizing and rapidness. The orders for the construction of large container ships are increasing, but the enhancement of the launching slipway equipment is still lagging.
The launch of large ships on small slipways is limited to water depth and slippage, which can easily lead to accidents, such as stranding and collisions. The main engine and superstructure in the stern of the ships to intensify squatting can be affected significantly by water depth during the process of launching. Therefore, a study on the dynamic characteristics of a container ship on launching in its longitudinal direction is required to ensure a safe launch operation.
Currently, there are no relevant international standards and requirements on the construction approach and ship hull for ship launching. There are also no clear standards, and there are usually no actual arrangements of the shipyard (dock, slipway, etc.) and the shipbuilding cycle to define the launch operational procedure.
The ship’s longitudinal launching is a complex process that can be divided into four (4) stages [1], as shown in Figure 1. The first and the second stages involve the ship sliding down until the stern contacts the water and floats. In the third stage, the stern floats until the bow fulcrum leaves the slipway. In the final phase, the ship moves completely in water until it stops. The ship’s parameters in the launch operational procedure constantly change with time in each stage of the draught, speed, force, and moments.
There are traditional statics and dynamics methods for ship-launching calculation. The static method considers the launched ship at a specific position in a transient state, which involves a force analysis on the use of launching and Bonjean curves to calculate reaction forces at supports during slippage and displacement volume, indicated as Stage 3 in Figure 1. The dynamics method discretizes the displacement during the launching process to predict the velocity and acceleration in additional to reaction forces at supports during slippage and the displacement volume at each displacement point.
The dynamic method calculates the ship’s launch parameters, with slippage and initial launch velocity, and such as method is more accurate than the statics method but is more complicated. Most shipyards still employ the static method for ship-launching calculation. The process of longitudinal launching by Žgomba et al. [2] was carried out based on the numerical prediction of ship stability, stress, and fore and aft draughts through statics methods.
As computational technology advances, the finite element method (FEM) based on elastic body theory to obtain a more accurate result becomes popular in ship-launching calculation. The analysis provides a more reliable prediction of shear force, bending moment, and deformation with launch velocity and slips before leaving the slideway. Some examples of the research work performed on ship launching included the estimation of the coupling effect between ship hull and airbags based on FEM by Liu et al. [3] and Li et al. [4]; the prediction of forces, deformation, and slippage based on elastic beam calculation method, using ANSYS software, by Zhong et al. [5]; and the simulation of Wigley ship and 46,000 DWT oil tanker based on the direct calculation method for longitudinal ship launching by Lin [6]. However, Lin [6] proposed a more flexible calculation process to directly determine the curves for ship launching with complex hull-shape configurations.
The abovementioned research works also obtained parameters through the theoretical method, or FEM, including velocity, acceleration, and slippage during the ship-launching process.
Computational Fluid Dynamics (CFD), an effective numerical method, is widely used in ship-launching analysis. The predictive CFD methods are validated and calibrated against the towing tank experimental results [7,8]. It could accurately determine the flow field and the phenomenon of mechanisms and thus provide a reference to select a damped system for the ship model in the launching procedure [9]. The numerical and experimental assessment of a full-scale ship model by Farkas et al. [10] was based on the CFD method to determine the ship’s resistance. The resistance of intact and damaged ship models by Bašić et al. [11] was determined by using the RANS method.
Senjanovic et al. [12] used the overlapping-mesh method to simulate the ship motion and surface waves of large oil tankers in lateral launching. It provided a more precise pre-diction of the amplitude and phase of the first wave. However, Fitriadhy et al. [13] used the CFD analytical approach to predict the ship’s performance of side launching. The study considered several parameters, including the angle and length of the launch platform. Güzel et al. [14] used the same method to examine the effect of hydrophobicity in reducing the impact loads acting on marine structures. A theoretical calculation in restricted waters by Li et al. [15] was to study the effect of external forces due to wave-making and viscous resistance. The flow field and the ship hydrodynamics on RANS equations derived by Wang and Wang [16] showed that the ship motion parameters in lateral launching agreed well with experimental values.
Most of the past research works focused on ship lateral launching. For a relatively large ship’s longitudinal launching, the cause of the flow phenomenon before the ship hull leaves the slipway and on the drifting stage is yet to be studied, particularly so on the effect and mechanism of the stern appendages of large container ships at a large trim angle.
In this paper, a CFD model of an 8500 TEU container ship is established based on the RANS equation to evaluate the dynamics characteristics of a large container ship in the drifting stage under the limited water depth and large trim angle. Firstly, the ship resistance in calm water is simulated and compared with the experimental data, followed by the development of the ship speed-resistance curves and the flow fields of the hull with and without the aft poppet at deep waters. The study includes the flow mechanism of the hull with the aft poppet in the drifting stage to examine the influence of the aft poppet under various H/T ratios. One of the objectives is to select a suitable longitudinal launching scheme for a large container ship in the numerical analysis.

2. Numerical Modeling

Figure 2 illustrates the research methodology for numerical simulation of longitudinal ship launching in two parts. The first part of the methodology is to input the parameters in the dynamic equations by using MATLAB software to obtain the initial velocity and draughts fore and aft in the drifting stage. The parameters include the main particulars of the ship, slipway, and environment. In the second part, the results obtained served as an initial condition of numerical simulation to predict the velocity, resistance, and flow field of the hull interacting with water based on the CFD method.

2.1. Theoretical Calculation of Ship Launching

The theoretical calculation includes the dynamic equations and the empirical formula proposed by Semyonov et al. [17] to determine the initial velocity and ship fore and aft draughts (refer to Phase 4 in Figure 1). Figure 3 shows the forces generated in the process of sliding down the ship.
In the first phase (refer to Figure 1), the ship is in uniformly accelerated motion, with an initial velocity of 0. The functional relationship of the ship motion between velocity, v , and slippage, s , is as follows:
v = 2 g s ( tan β f d ) ,
where β is the inclination angle of slipway, and fd is the coefficient of sliding friction.
The motion equations for the second and third phases (Refer to Figure 1) are in the following expressions:
v = e n ( E + v 1 2 ) ,
E = 2 ( tan β f d ) m ( 1 + k ) S 0 S F N e n d S ,
n = ρ C S m ( 1 + k ) S 0 S W 2 / 3 d S ,
where FN is the reaction of supports of slideway, W is the volume of displacement, S0 is the initial displacement, CS is the fluid resistance, and k is the additional mass coefficient. W is measured by importing the model into SolidWorks and is taken as 0.35.
The equations of motion are solved iteratively by using MATLAB programming; our results are shown in Table 1. The step length is 0.1 m.

2.2. Numerical Simulation of Flow Field

2.2.1. Governing Equations

The current research adopted the Unsteady Reynolds Averaged Navier–Stokes (URANS) method to provide the governing equations with a closed relationship. The averaged continuity and momentum equations are expressed in tensors and Cartesian coordinates for incompressible flow, as follows [18]:
( ρ u ¯ i ) x i = 0 ,
( ρ u ¯ i ) t + x i ( ρ u ¯ i u ¯ j + u ¯ i u ¯ j ) = p ¯ x i + τ ¯ i j x i ,
τ ¯ i j = μ ( u ¯ i x j + u ¯ j x i ) ,
where ρ is the fluid density, ρ u ¯ i u ¯ j is the Reynolds stresses, ui is the averaged velocity vector, and p ¯ and τ ¯ ij are the mean pressure and the mean viscous stress tensor components, respectively.
The computational domain in the flow field is divided into a finite number of control volumes by the Finite Volume (FV) method. The mathematical model is transformed into algebraic equations after discretization and solution of governing equations, which are the integral of transport equations defined in Equation (8):
d d t V   ρ ϕ d V + A   ρ v ϕ d a = A   Γ ϕ d a + V   S ϕ d V ,
The equation is in terms of transient, convective flux, diffusive flux, and source. The discretized convective flux in the equation is determined by using a central difference and second-order upwind method, while the transient is on the implicit time-integration scheme. The mass and momentum integral conservation equation is solved by using a separated flow solver. A SIMPLE algorithm calculates the discrete-pressure–velocity coupling equations. The derived algorithm is suitable for the solution and is still stable at a large time-step, with the local Courant number exceeding 10.

2.2.2. Physics Modeling

The Shear Stress Transport (SST), k-ω, turbulence model by Menter [19] used a mixed function and added a cross-diffusion term to effectively combine the far-field k-ε model with the near-wall k-ω model [20,21]. The combined model solved the shortcomings of the k-ω turbulence model in simulating the flow. The transport equations for kinetic energy, k, and unit dissipation rate, ω, are as follows:
t ( ρ k ) + [ ( ρ k v ¯ ) ] = [ ( μ + σ k μ t ) k ] + P k ρ β * f β * ( ω k ω 0 k 0 ) + S k ,
t ( ρ ω ) + [ ( ρ ω v ¯ ) ] = [ ( μ + σ ω μ t ) ω ] + P ω ρ β f β ( ω 2 ω 0 2 ) + S ω ,
where μ is the dynamic viscosity, σω is the model coefficients, and fβ* and fβ are the free shear and eddy current correction coefficients, respectively. The capture of the position and shape of the free water surface was performed by using the Volume of Fluid (VOF) method developed by Berberović et al. [22], with a sufficient mesh revolution between the two phases of air and water in Equation (11):
t V α i d V + A α i v d a = V ( S α i α i ρ i D ρ i D t ) V 1 ρ i ( α i ρ i v d , j ) d V ,
where a is the area vector, V is the mixed velocity, vd,j is the diffusion velocity, and Sai is the custom source term of phase i.

3. Ship Geometry and Mesh Generation

The numerical study presented in this paper involves the simulation of an 8500 TEU container ship model. The principal parameters for this model are in Table 2. The analysis covers the resistance and velocity of the ship with and without the hull’s aft poppet under deep- and shallow-water conditions based on the relevant numerical results generated from CFD in the drifting stage and the influence of the ship’s aft poppet under various water-depth-to-draught ratios.
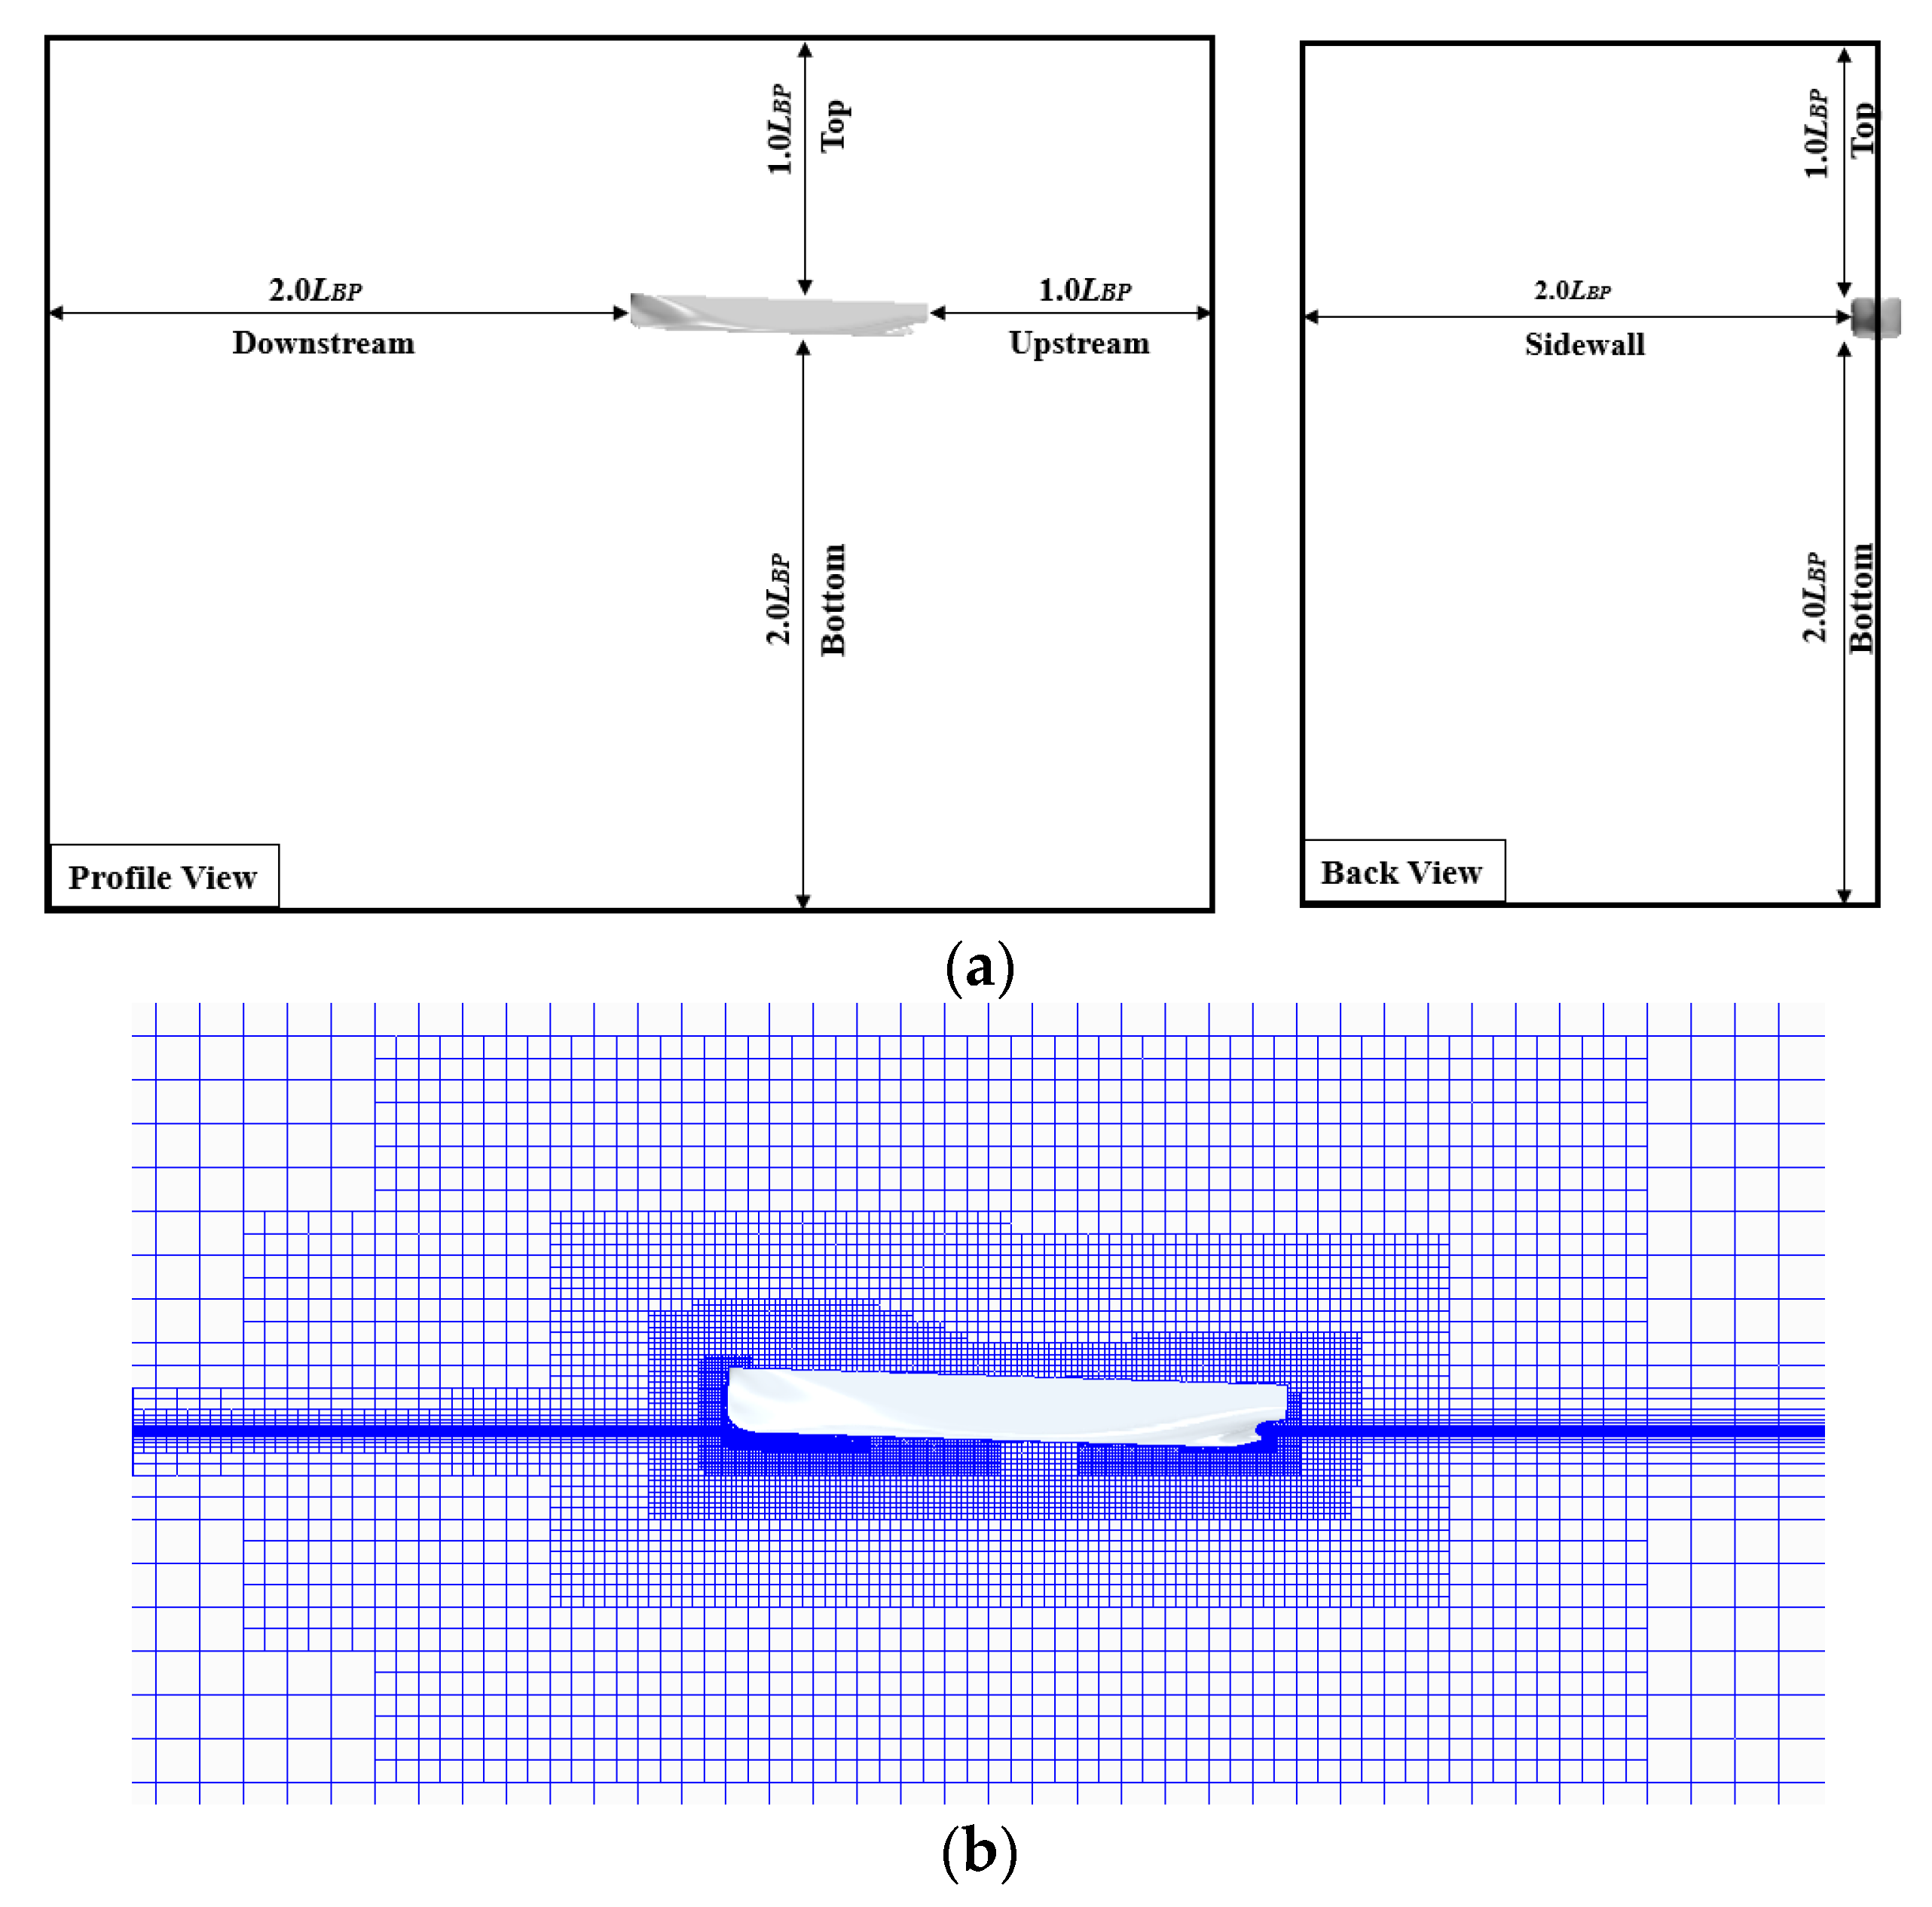
Five types of computational domains were created, including one (1) for deep water and four (4) for shallow water with different boundary conditions. The bottom of the computational domain is modeled as the velocity inlet in deep water, while it is modeled as the wall in shallow water.
The calculation domain range was 2 L B P X 2 L B P , 0 Y 2 L B P , and 2 L B P Z L B P , and the ship stern was in the positive x direction, consistent with the actual end launching. The automatic meshing module generates the computation domain, surface, and volume mesh suitable for the FV method. The flow-separation phenomenon influences the resistance and pressure drop on the hull’s surface. The trimmed and prism meshes in the computational domain to solve the flow characteristics near the wall. The grid cells’ prism layer meshes on the near-wall surface, orthogonal to the wall boundary, and the y+ value was about 60. An automatic surface facility repair and improvement of the mesh quality of the surface mesh was performed to ensure the geometry surface was enclosed.
Meanwhile, to capture the flow accurately, appropriate mesh refinement was conducted in critical regions, such as the bow, stern, and free surface. The total grid number applied to resistance validation is 3.74 million, with the computational domain and grid near the hull shown in Figure 4.

4. Results and Discussion

The following section presents the detailed results and the flow field of the ship-launching process to compare with the existing experimental data. The results from the numerical simulation include the mechanism affecting the dynamic characteristics of the large container ship in the fourth stage (refer to Figure 1).

4.1. Validation Study

Before carrying out the longitudinal-launching simulation, the ship resistance in calm water developed by Yang et al. [23] and Park et al. [24] is simulated and compared with the towing-tank test results to verify and validate the numerical method adopted by Islam et al. [25]. The resistance test was carried out in the towing tank of the Dalian University of Technology. The scale ratio, λ , of the ship model was 37.525 to measure the ship resistance at different speeds. The ship speed   ( 1.008   m / s ) and the fore and aft draught ( 0.3198   m ) are used for the verification and validation studies, which are the ship parameters equivalent to 12 knots and 12 m in full scale.
Table 3 shows the relevant environmental parameters. The object of the validation study is the dimensionless resistance coefficient, Ct, expressed as follows:
C t = R T 1 2 ρ U 0 2 S w ,
where RT is the total resistance of the model, U0 is the speed of the model, and SW is the wetted surface.
The grid resolutions in fine, medium, and coarse mesh density are denoted as, N 1 , N 2 , and N 3 , respectively, to assess the reliability of the ship model. The refinement factor of the mesh density is defined as follows:
r 21 = N 1 N 2 2 ,
The apparent order of the method is as follows:
p = 1 ln ( r 21 ) ln ε 32 ε 21 + q ( p ) ,
q ( p ) = ln ( r 21 p s r 32 p s ) ,
s = 1 sgn ( ε 32 ε 21 ) ,
where ε 32 = ϕ 3 ϕ 2 and ε 21 = ϕ 2 ϕ 1 are the solution differences between coarse–medium and medium–fine and correspond to the solution of the i-th input parameters.
The extrapolated solution is defined as follows
ϕ e x t 21 = r 21 p ϕ 1 ϕ 2 r 21 p 1 ,
The definition of approximate and extrapolated relative errors is described as follows:
e a 21 = ϕ 2 ϕ 1 ϕ 1 ,
e e x t 21 = ϕ e x t 12 ϕ 1 ϕ e x t 12 ,
The fine-grid convergence index is obtained from the following formulation:
G C I f i n e 21 = 1.25 e a 21 r 21 p 1 ,
Subsequently, the resistance of the ship model simulating the full-scale container ship in the drifting stage is verified. The experimental results are based on the conversion of the resistance of the existing ship model according to the three-dimensional method proposed by Hughes and the ITTC (1957) formula. Table 4 shows the required parameters to calculate the spatial and temporal discretization errors. The resistance coefficient of the ship is the key variable in the numerical analysis.
As can be seen in Table 4, the numerical uncertainty for the spatial and temporal convergence studies is 3.00% and 0.90%, respectively. Table 5 summarizes the comparison of the results between the experimental and the numerical data.
The numerical results agree well with the experimental data, with errors for the grids N 1 and N 2 of not more than 1.5%. Note the numerical methods adopted in the current study effectively predict the ship resistance in full scale. Considering the accuracy and the computation time, the ship model would be on the grid N 2 for the numerical simulation.
The force condition in the fourth phase (refer to Figure 1) is relatively simple and is affected only by the buoyancy force of water, ship resistance, and ship gravity. For launching large container ships on a small slipway, it is necessary to understand the influencing factors of launching in restricted waters, especially the influence of the ship’s aft poppet and water depth on the flow field and variation.

4.2. Influence of Ship Aft Poppet

In this paper, the numerical study is used to simulate the process of the launch of the ship model in the drifting stage. The initial conditions are the forward and aft draughts and the launching velocity determined from the dynamic method. The attitude of the ship model is fixed before the analysis. The resistance and the flow field of the ship model were at eight speeds in the range of 0.5 to 4.0 m/s. The numerical analysis of the full-scale ship model conducted by using the CFD. The results showed no inconsistency in ship resistance and flow field caused by various scaled ratios. In the process of longitudinal launching, steel-wire ropes were fixed to the six ship aft poppets, indicated as No. 1 to No. 6, and the hull (Figure 5).
For launching operations in restricted waters, a plank, or a steel plate, perpendicular to the launching direction at the rudder position is to reduce slippage after entering the water. The study analyzed the variation of ship resistance with velocity and the flow field under the conditions of ship hull both with and without the aft poppet to examine the influence and mechanism of stern appendage on the slippage in the drifting stage.

4.2.1. Ship Resistance Curve

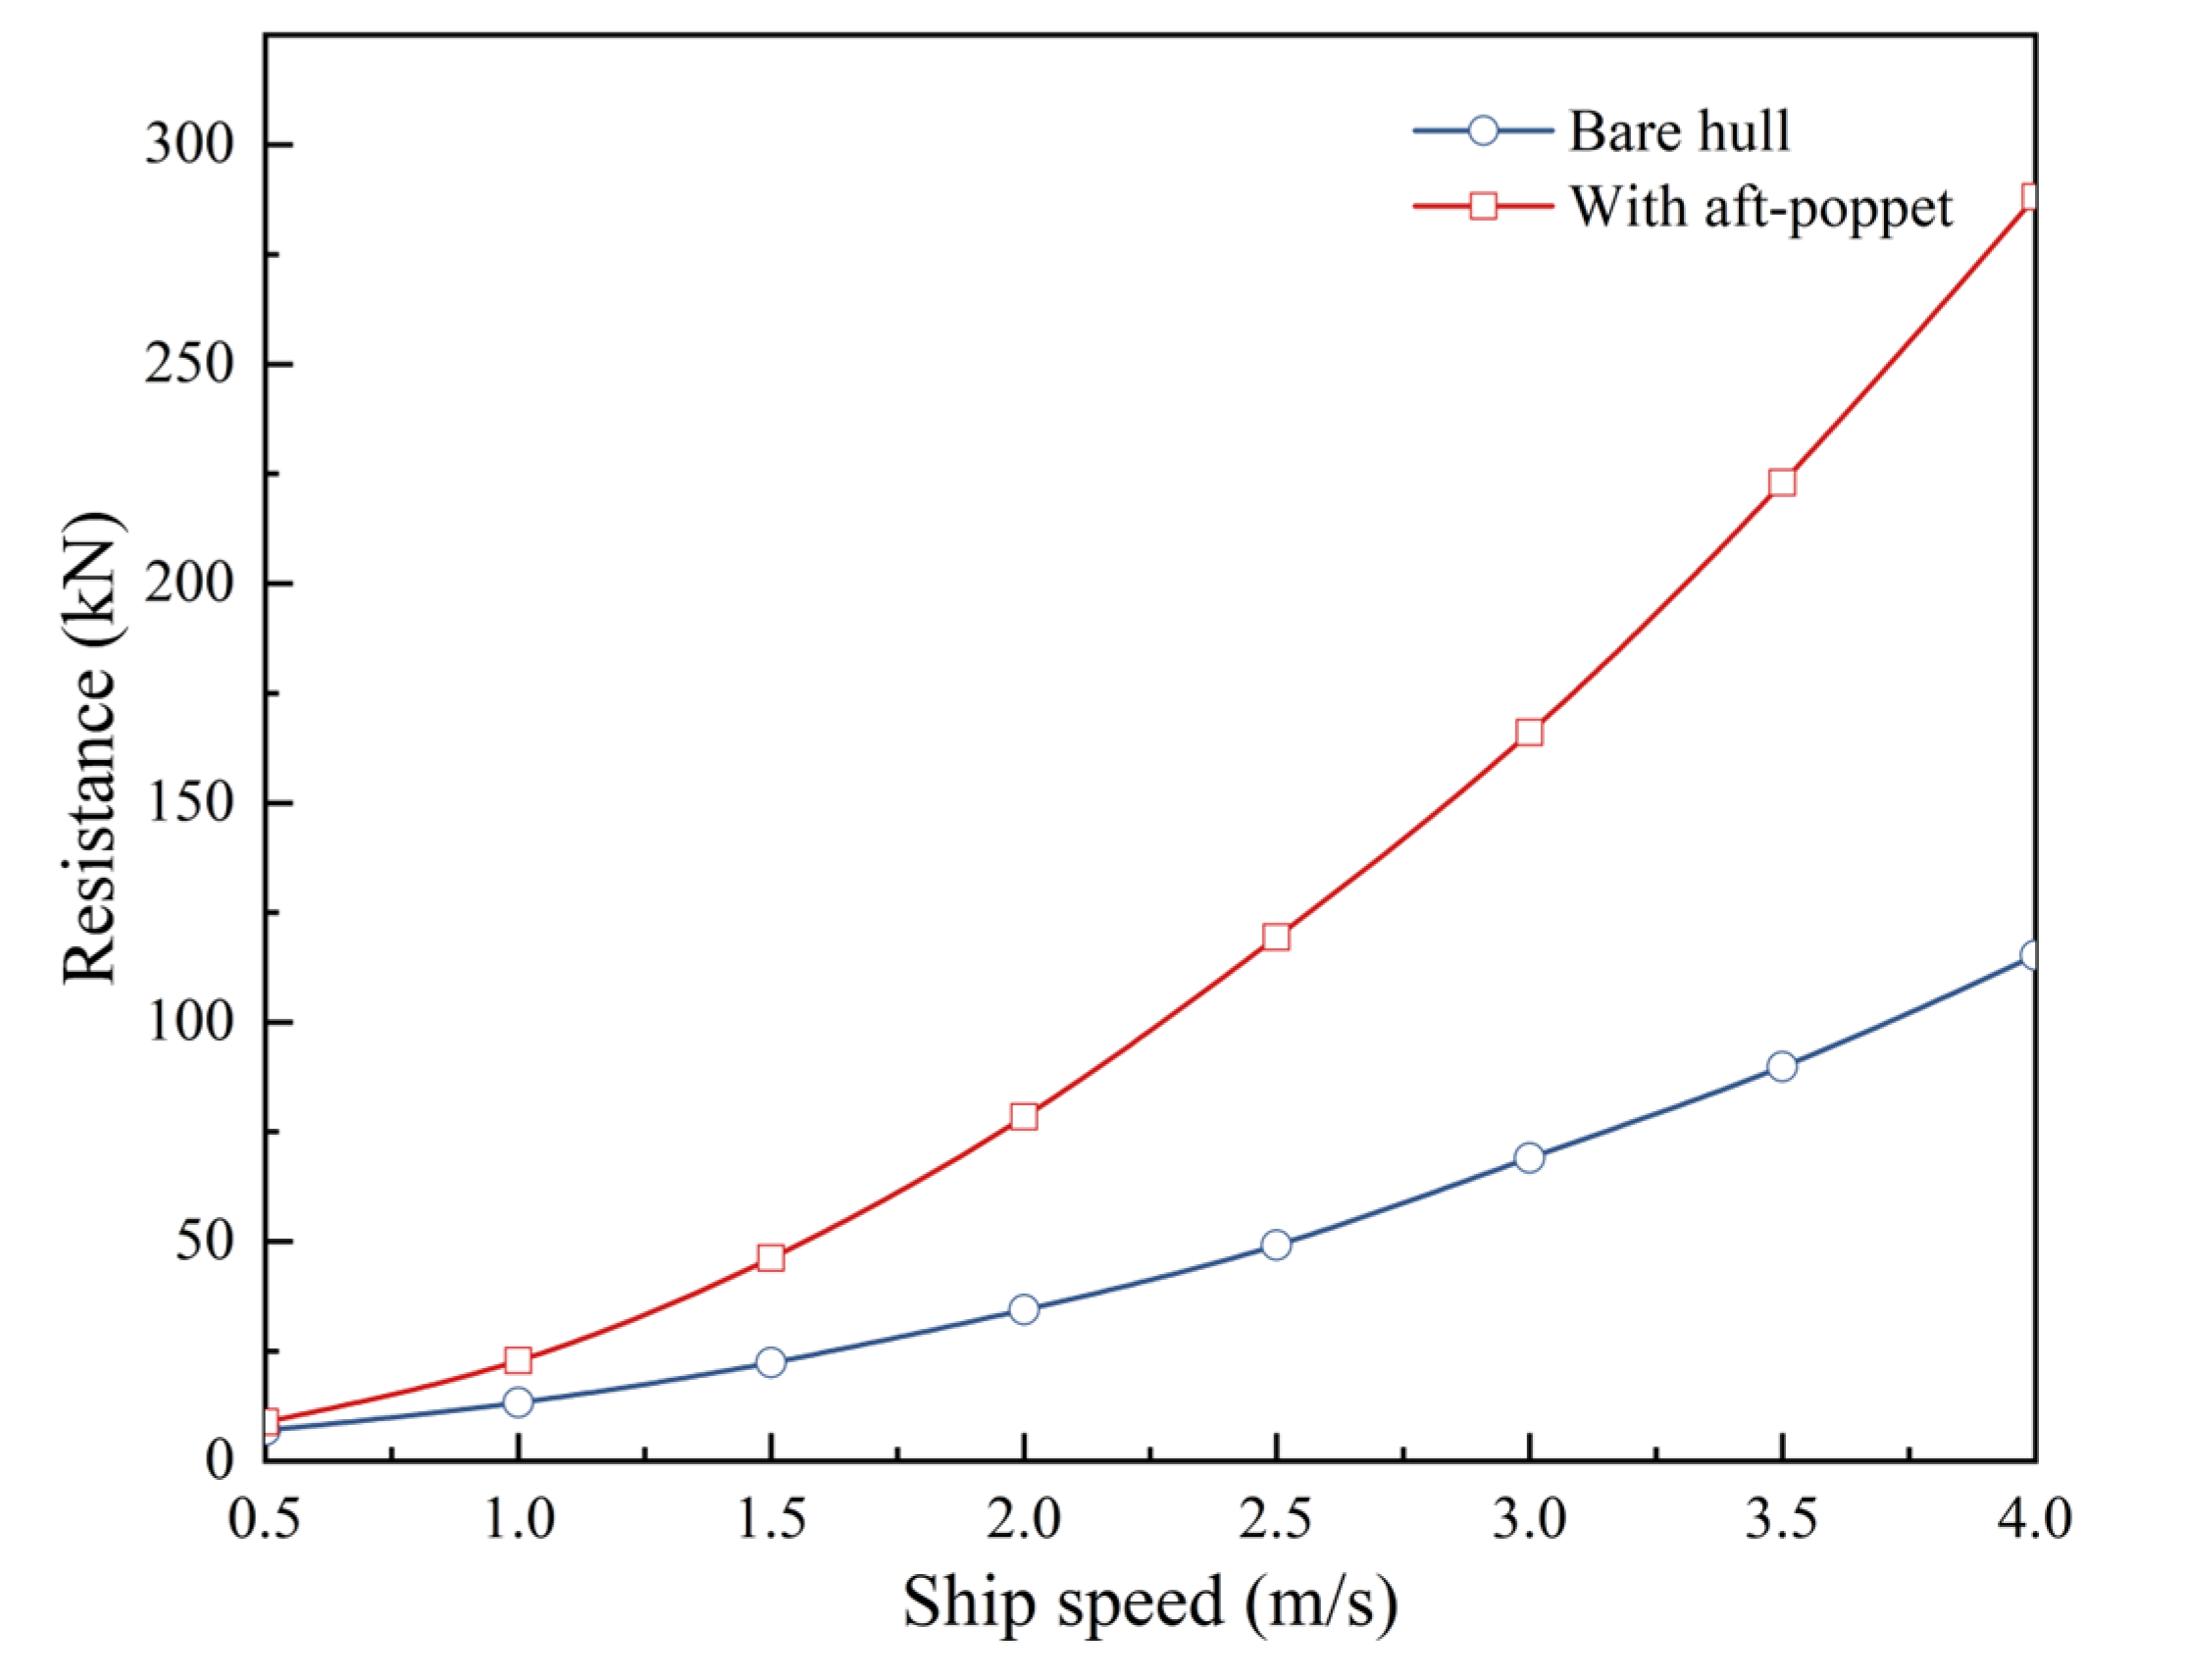
Figure 6 shows the variation of ship resistance with velocity in the fourth phase (refer to Figure 1) under the ship hull both with and without the aft poppet.
In the whole drift stage, as shown in Figure 6, the hull with the aft poppet has a higher ship resistance than without it. However, the influence of the hull with the aft poppet on the ship’s resistance gradually weakened with the decreased speed. At the launch speed of 4.0 and 0.5 m/s, the ship resistance with the hull with the aft poppet was 2.61 and 1.28 times that without it, respectively.
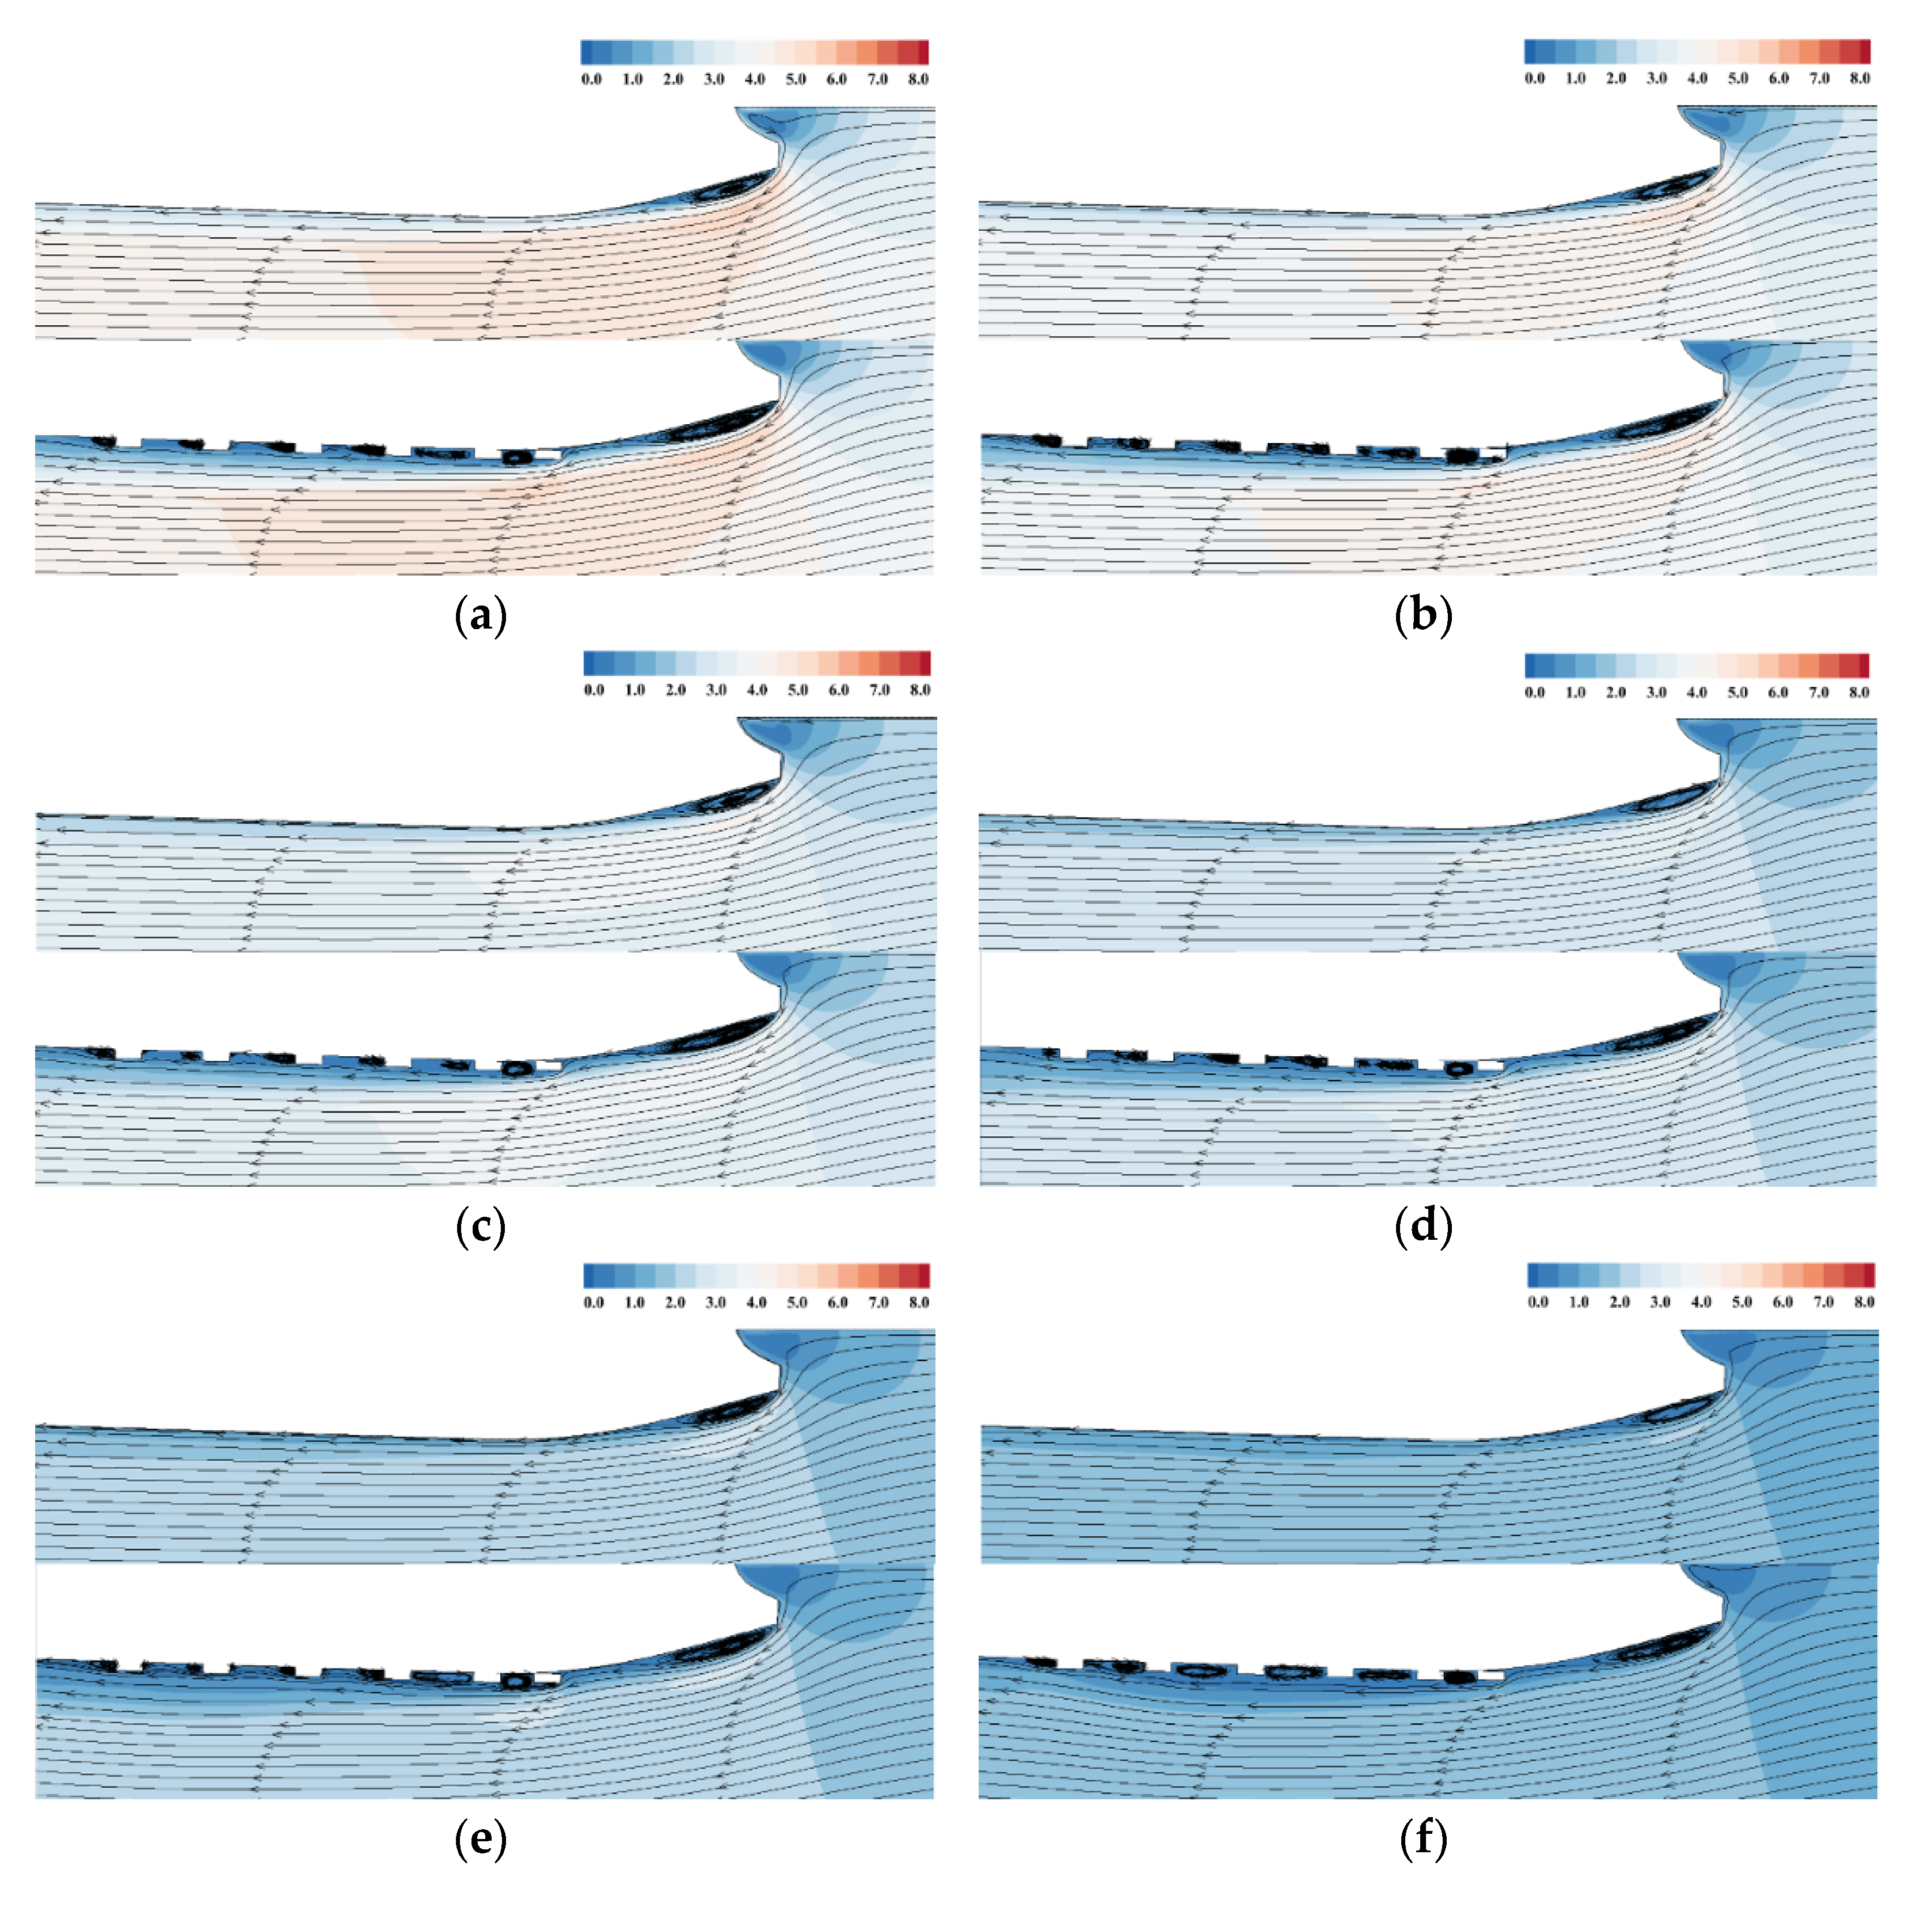
The above results showed a significant difference in ship resistance due to the aft poppet. The ship resistance increased and reduced slippage with the hull with the aft poppet. The results also indicate that the slippage of large ships could effectively be reduced by installing a stern appendage due to the high launching speed in the drifting stage. Figure 7 shows the velocity field and the streamline distribution at various ship speeds with the hull, both with and without the aft poppet.

4.2.2. Flow Field Distribution

The weight of the superstructure and the main engine of a large container ship is mainly concentrated in the stern, resulting in a large trim angle and inducing a certain angle in the direction of the incoming flow.
The velocity field distribution surrounding the hull decreases with the launching speed after the bow fulcrum is separated from the slipway (Figure 7a–h). The distribution of streamlines surrounding the hull with the aft poppet at various speeds was similar to that without the aft poppet. The direction of the streamlines in the far field was parallel to the ship’s motion. The streamline and the ship velocity were identical. Despite the wall boundary influencing the distribution streamlines, the velocity distribution was consistent with the boundary layer.
Owing to a certain angle induced between the hull and the incoming flow after the water flowed through the lower end of the stern, vortices and vortex shedding occurred at the lower part of the hull, resulting in increased pressure resistance moving along the ship hull at various speeds.
The distribution of streamlines of the hull with the aft poppet was relatively complicated because of the stern appendage. The velocity field distribution in the far field was similar to that of the hull without the aft poppet. The aft poppet blocked the water near the wall during the backward flow. Some water is trapped between the aft poppets, resulting in a low-velocity distribution near the aft poppets. Additionally, vortices and vortex shedding were observed at the No. 1 aft poppet after the incoming flow through the stern poppet. The blocking of water flow at the No. 1 aft poppet under the current trim angle causes the vortices to accumulate at the far end of the stern. The accumulation of these vortices would lead to the difference in pressure distribution at the front and rear ends of the aft poppet, which further increased the pressure resistance of the ship in launching.
The velocity field at lower launch speed near the stern poppets was stable (Figure 7g,h). The vortex at the No. 2 aft poppet occurred after the No. 1 aft poppet due to the accumulated vortex in its rear end. The reduced vortices in the front and rear poppets cause the pressure difference to reduce the pressure resistance of the ship model. Therefore, the impact of the aft poppet on the hull in the fourth phase at a lower ship speed was minimal.
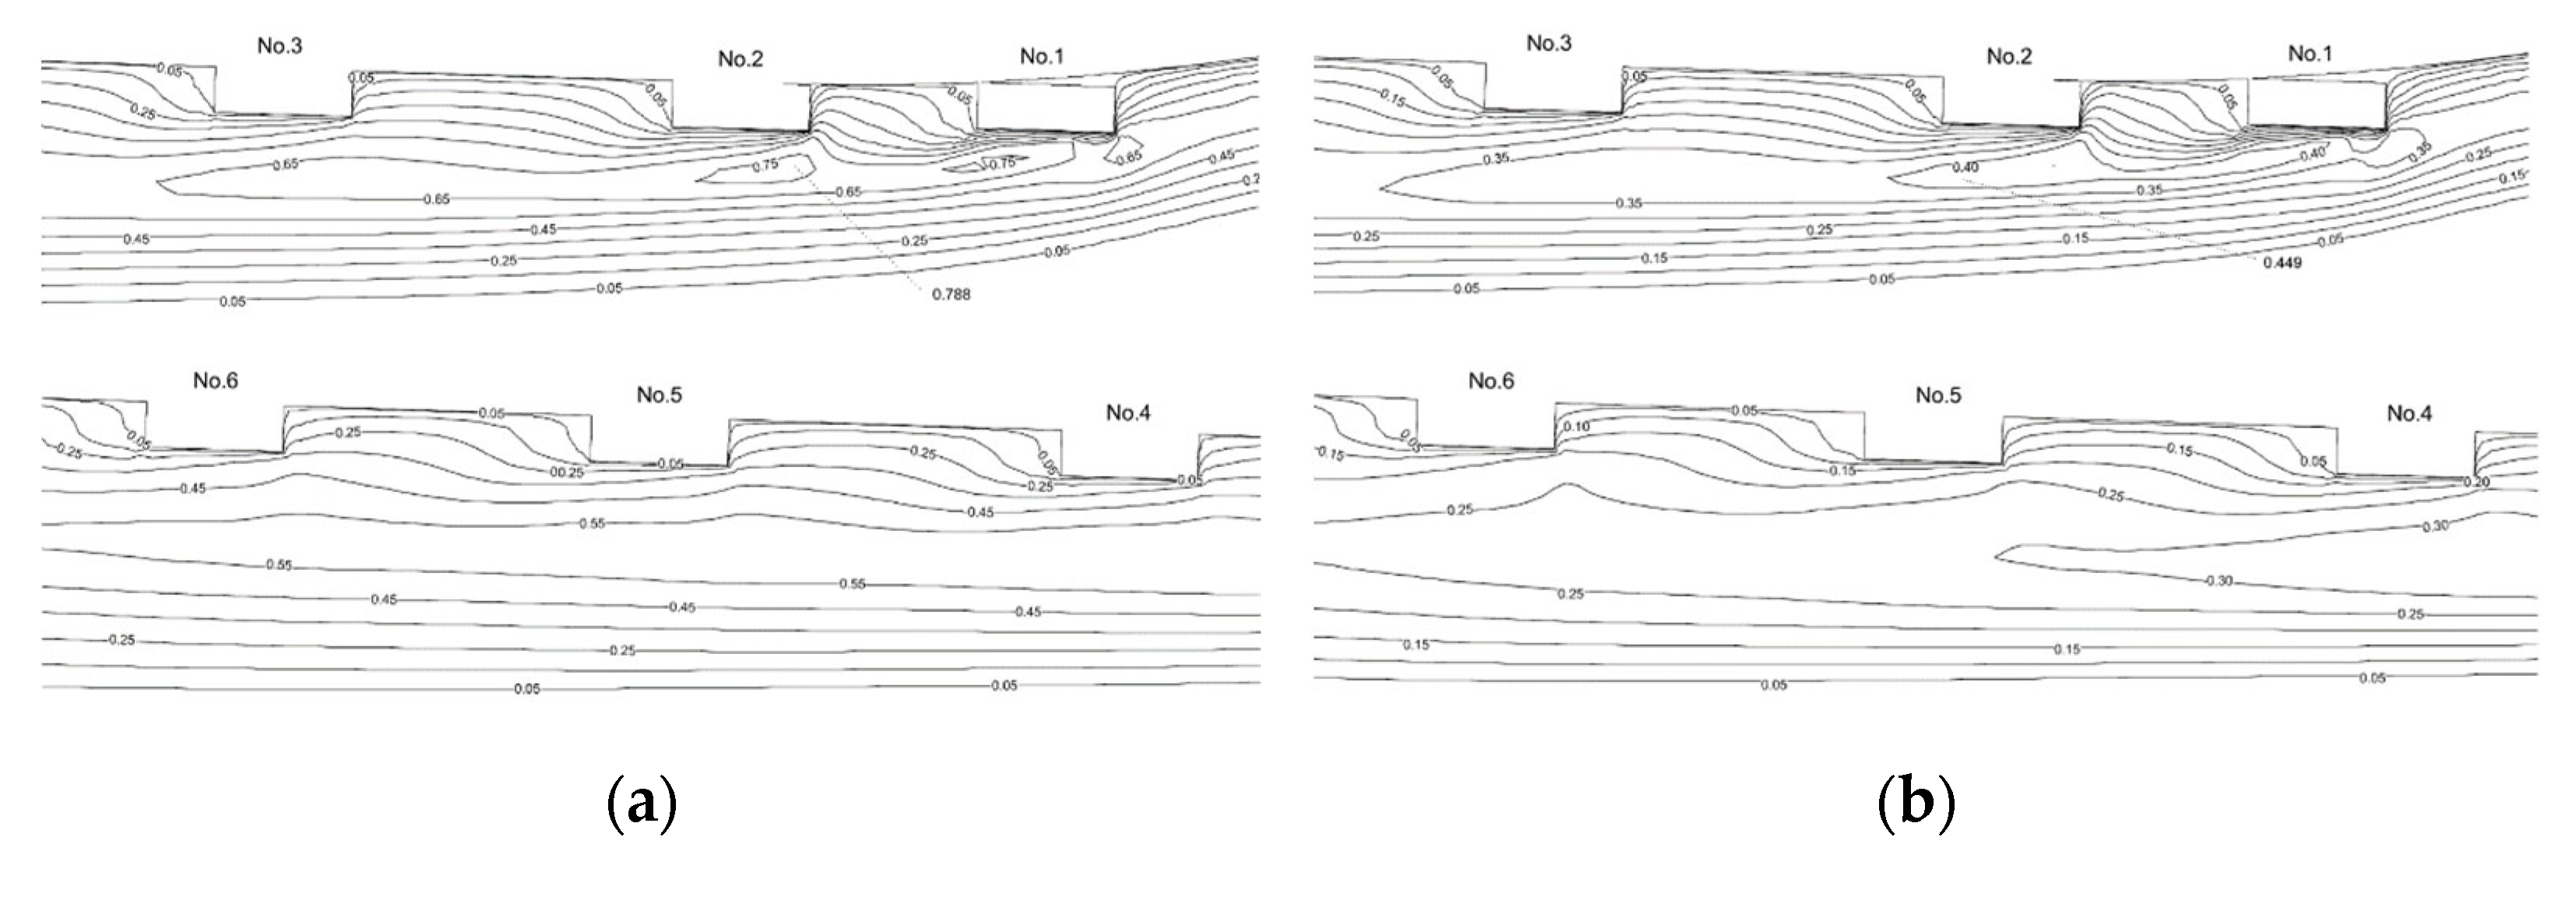
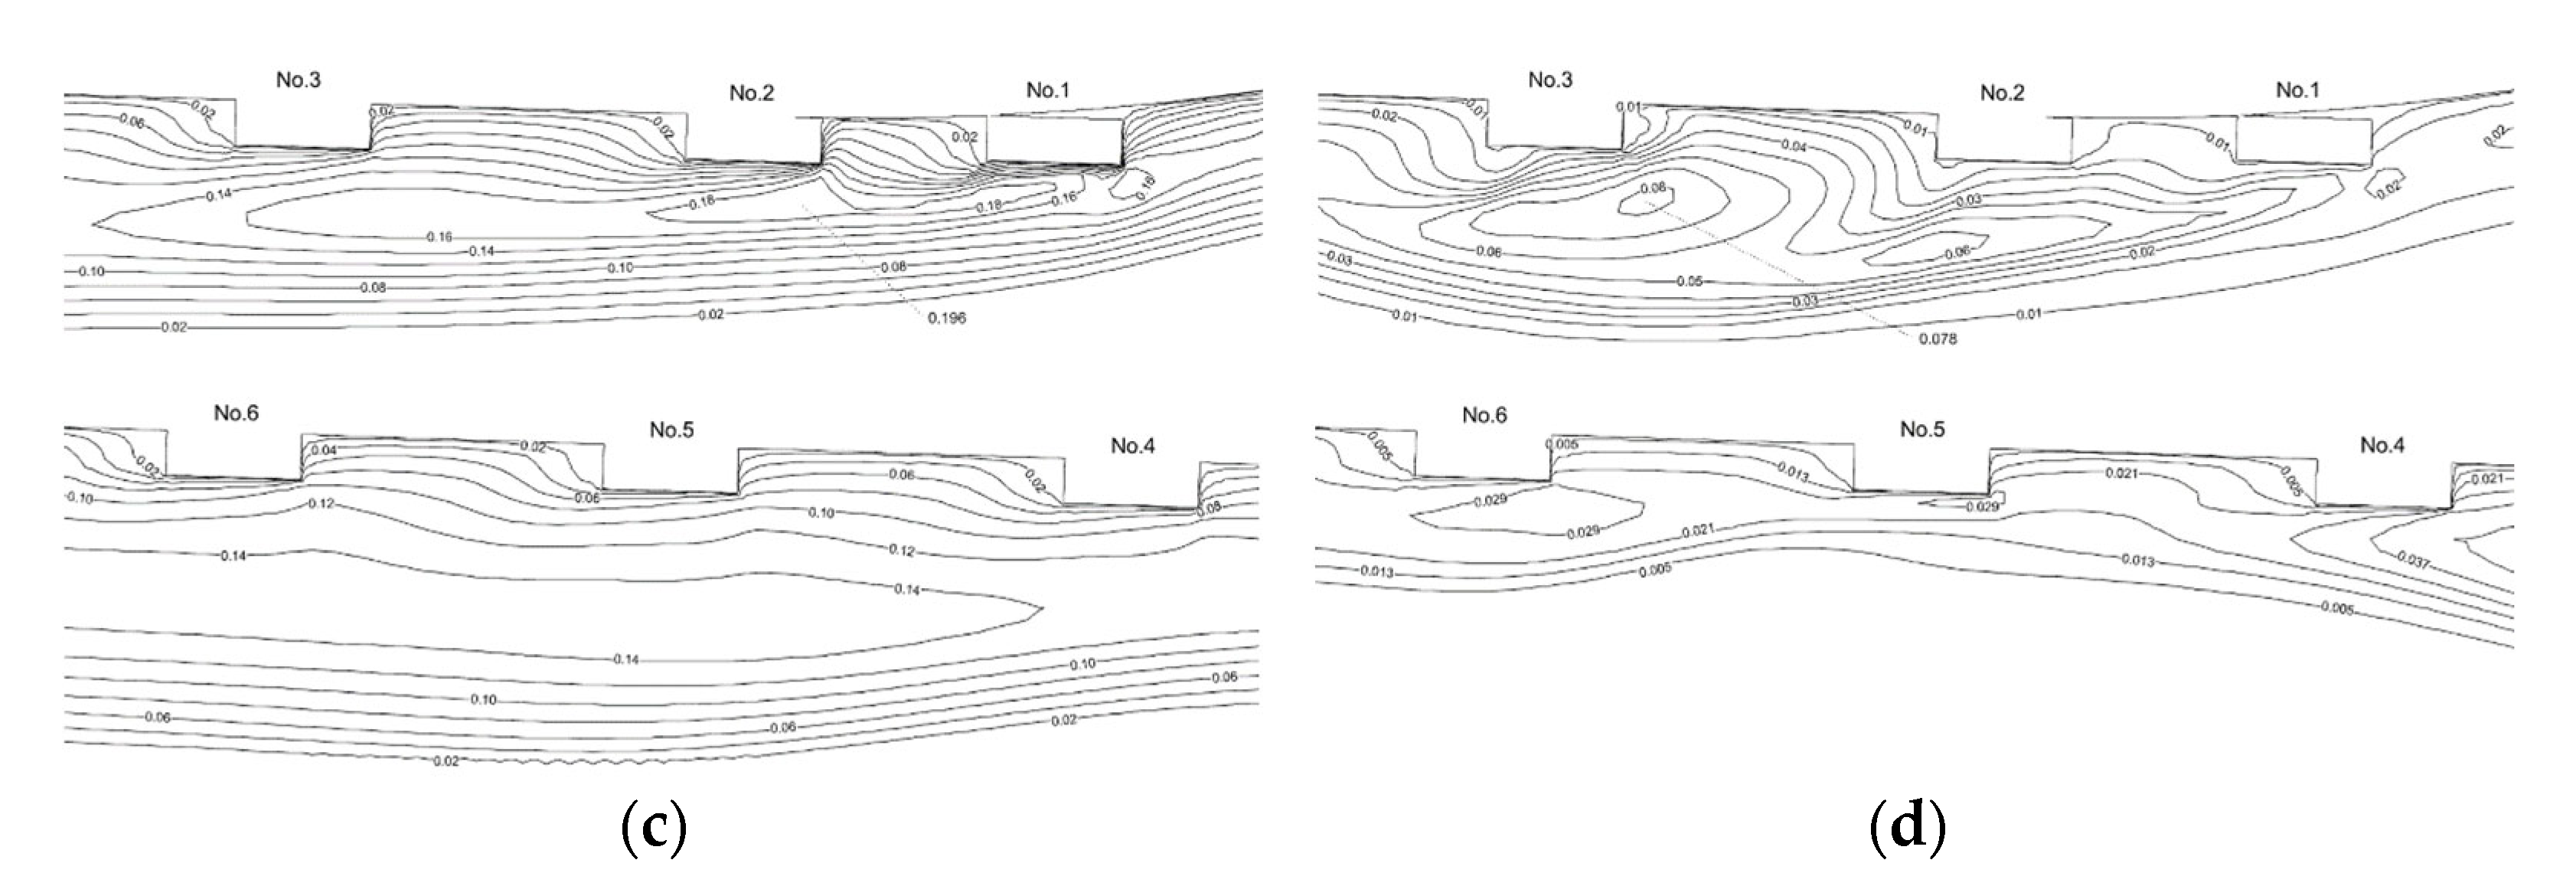
Figure 8 shows the contours of the streamline distributions near the ship hull with aft poppets according to the turbulent kinetic energy. The distribution of turbulent kinetic energy near the ship stern remained the same at high launch speeds (greater than 1.0 m/s), owing to the angle of inclination in the process of launching (Figure 8a–c).
The vortices formed after the current from the stern flowed through the lower part of the No. 1 aft poppet along the hull and diminished. This formation of vortices continued to extend from the stern to the bow. Other aft poppets were in the wake area of the No. 1 aft poppet. Since the No. 2 and No. 3 aft poppets were closer to the No. 1 aft poppet, and especially to the No. 2 aft poppet, the vortex shedding at these locations influenced the turbulent kinetic energy distribution. The kinetic energy distribution surrounding the No. 4 to No. 6 aft poppets remained identical. The maximum turbulent kinetic energy was near the vortex core of vortex shedding formed by the No. 1 aft poppet.
The flow velocity near the stern decreased with the launch speed. The vortices generated at the No. 1 aft poppet do not escape from the hull after shedding but continue to flow back along the aft poppets. The distribution of turbulent kinetic energy around the No. 2 to No. 6 aft poppets is affected but different from that at higher launch speeds.
The above study showed that the presence of stern appendages significantly improves the pressure resistance at the stern and effectively reduces the slippage, especially in the case of the high initial velocity of launching.

4.3. Influence of Water Depth

Launching operations of large container ships on small slipways, in which the water depth is usually limited, are prone to accidents, such as collision and grounding. Furthermore, the under-keel clearance at the stern is insufficient and affected by the shallow-water effect [26]. Therefore, it is necessary to have an appropriate tide height to ensure the safe launch operation of the ship.
The Permanent International Association of Navigation Congresses (PIANC) uses the ratio of water depth to draught, H / T , as the standard to measure different water depths, where H / T > 3.0   is deep water, 1.5 < H / T < 3.0 is medium deep water, and H / T < 1.5 is shallow water.
The water depth with the tide near the launching slipway is 15 m, with an H/T ratio of about 1.5 (Figure 9), classified as shallow water. The simulations in shallow water were based on the settings of deep water, adjusting the z-position of the seabed. The numerical analysis is on the ship resistance, mechanism, and flow field under deep and shallow-water conditions with the hull with aft poppets to study the influence of water depth on ship-launching dynamics.

4.3.1. Ship Resistance Curve

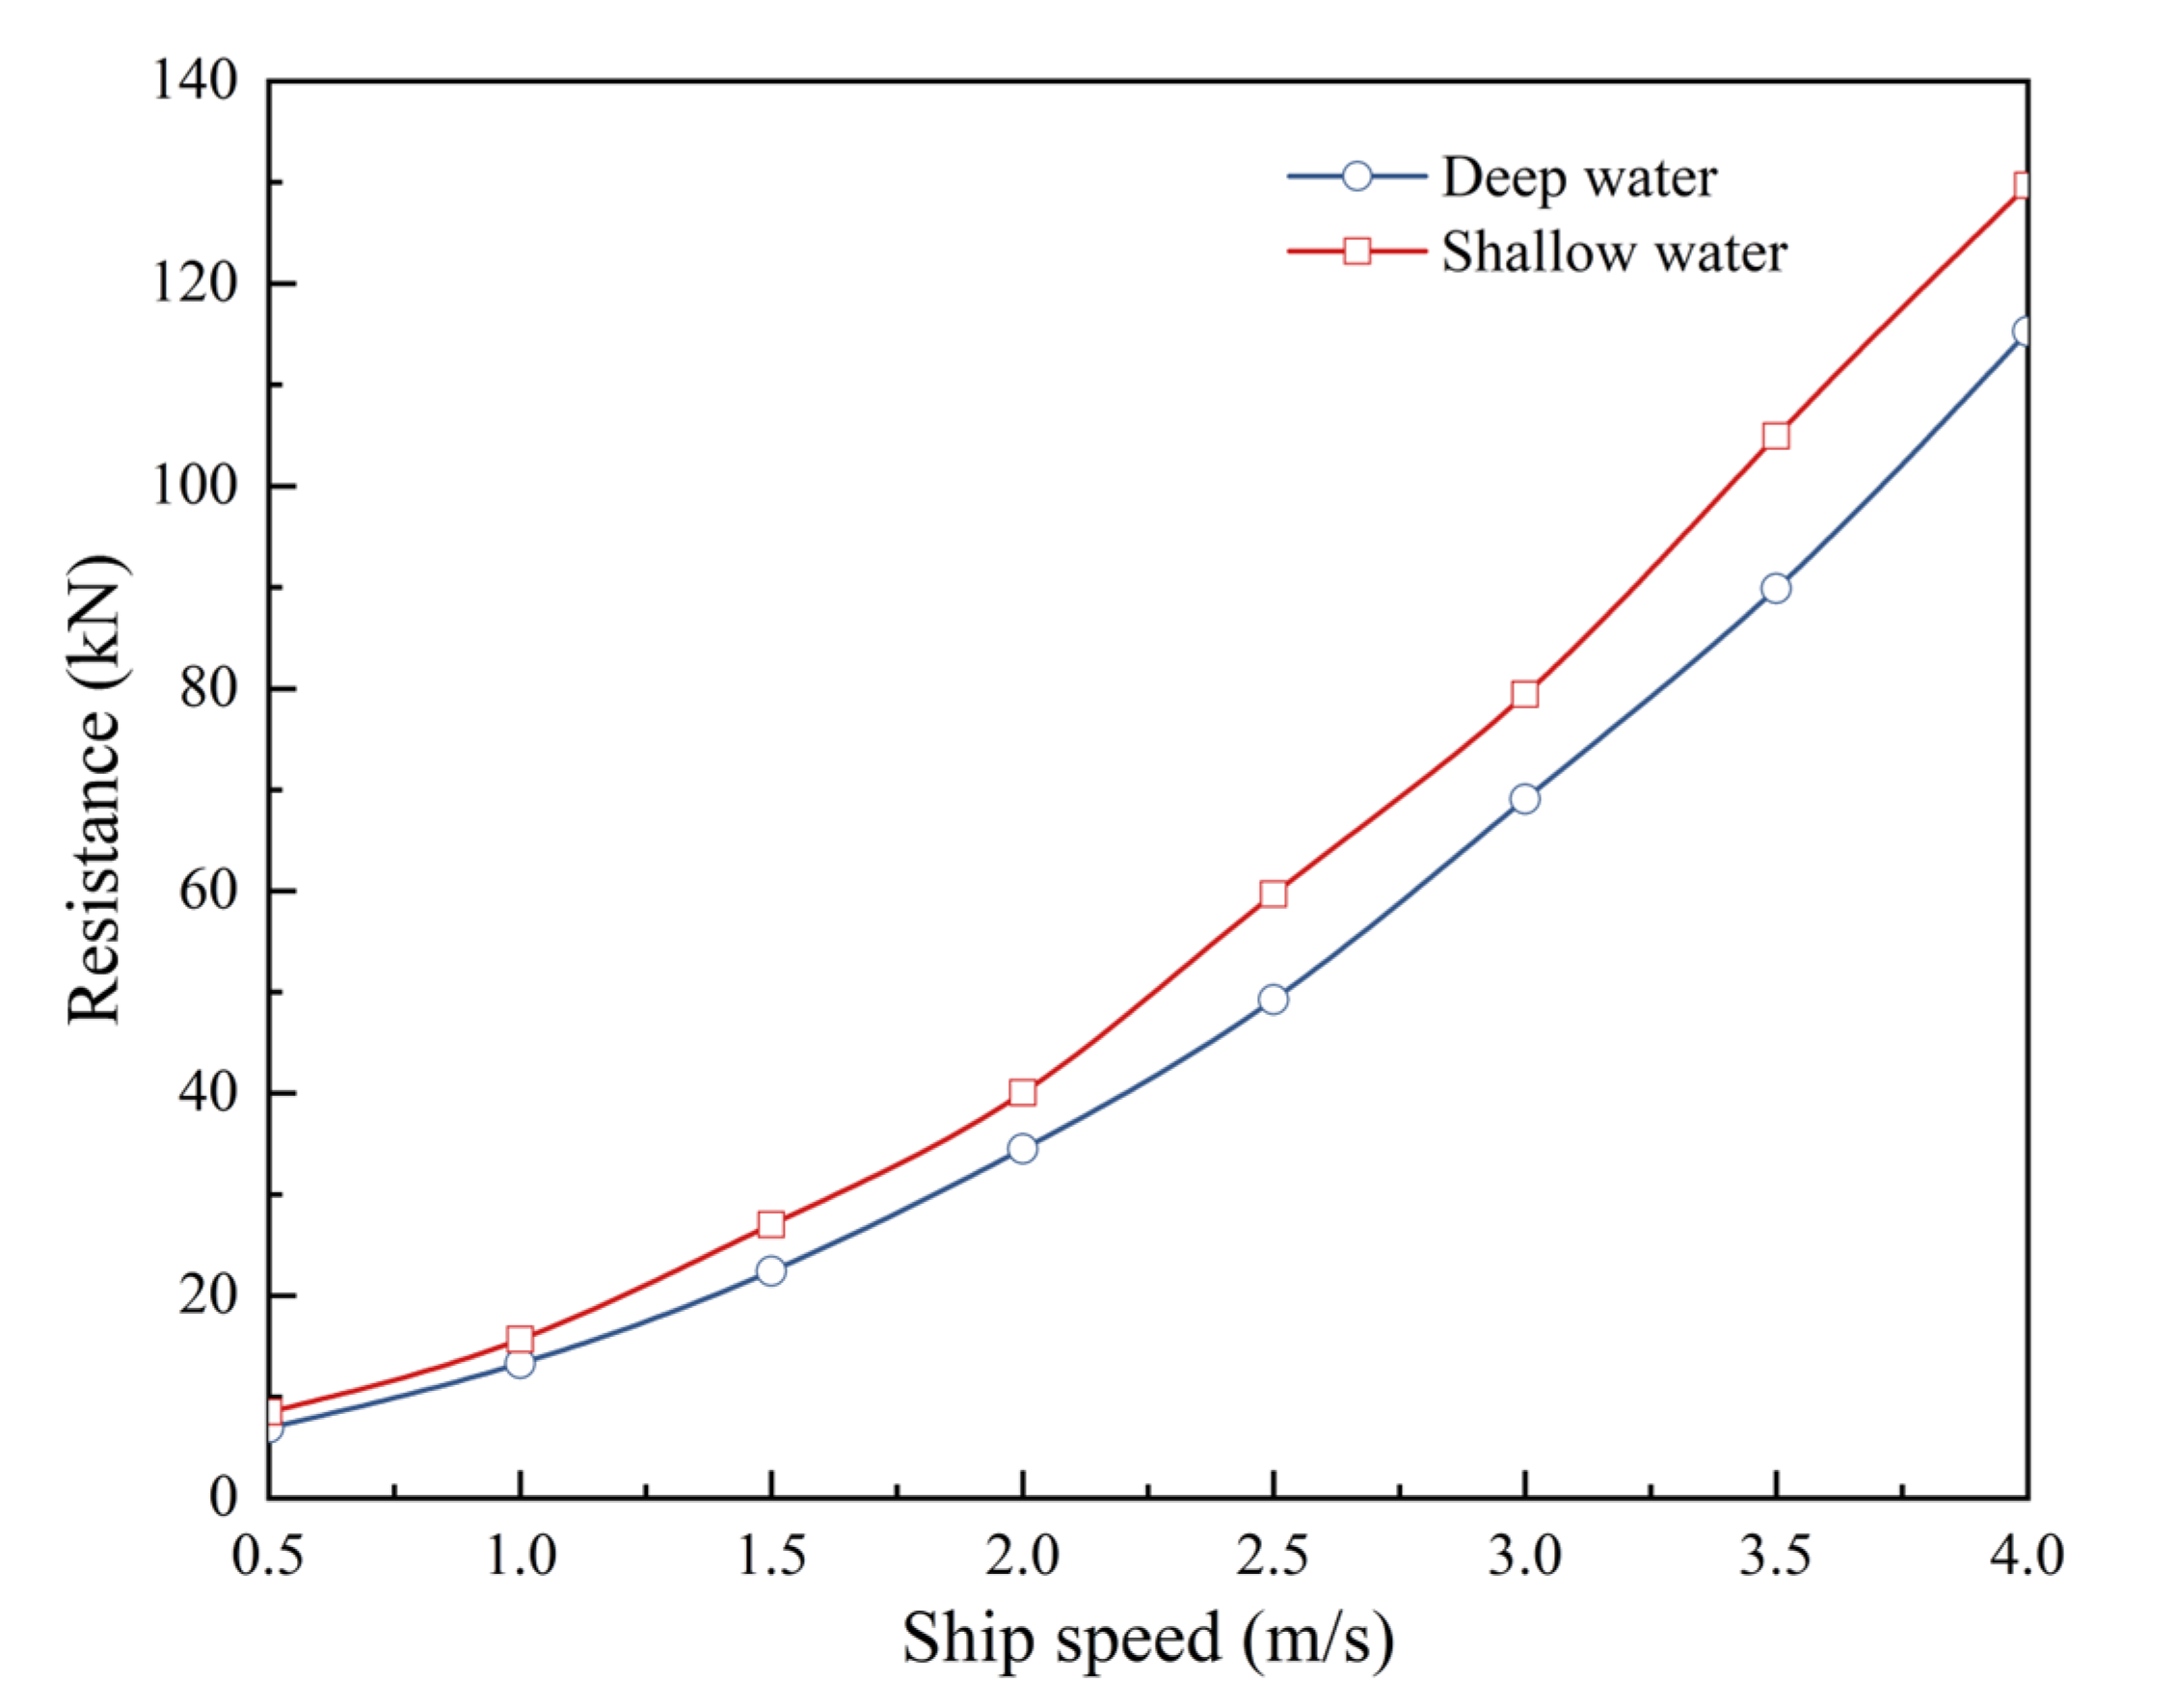
The numerical study involves the ship-hull model without aft poppets to simulate the variation of ship resistance with speed under the influence of water depth. Figure 10 summarizes the ship resistance curves of the ship-hull model under deep- and shallow-water conditions. It showed that the ship resistance at each speed in shallow waters was higher than in deep waters, with an increase of 19.6% to 31.6% due to the water-depth effect. However, the distribution of each speed interval was relatively uniform.
For the case of large ships in the fourth phase (refer to Figure 1), the flow field near the ship’s bottom was compressed and accelerated. The reduced water pressure below the hull causes ship sinkage and tipping.
The viscous resistance reflects the influence of the shallow-water effect on drag. The shear resistance increases with the wetted surface due to the ship’s sinkage and tipping. The ship resistance increases with a large pressure gradient.
In the current numerical simulation, the ship’s floatation and draught under shallow waters are fixed conditions. As the change of ship resistance under shallow water compared to deep water was minimal, the actual situation of the ship sinkage and tipping in the shallow waters could not be accurately captured. Figure 11 shows the variation of ship resistance with speed in different conditions.
The ship resistance with the hull with aft poppets was slightly larger than without aft poppets, with an increase of about 7%. However, the ship’s resistance in shallow waters was reduced by about 50% from that of the deep waters. The results showed the effect of aft poppets in reducing the increased resistance due to the water-depth effect. In the following section, the flow field near the hull under shallow- and deep-water conditions is discussed to study the influence of water depth on the resistance of stingers.

4.3.2. Flow Field Distribution

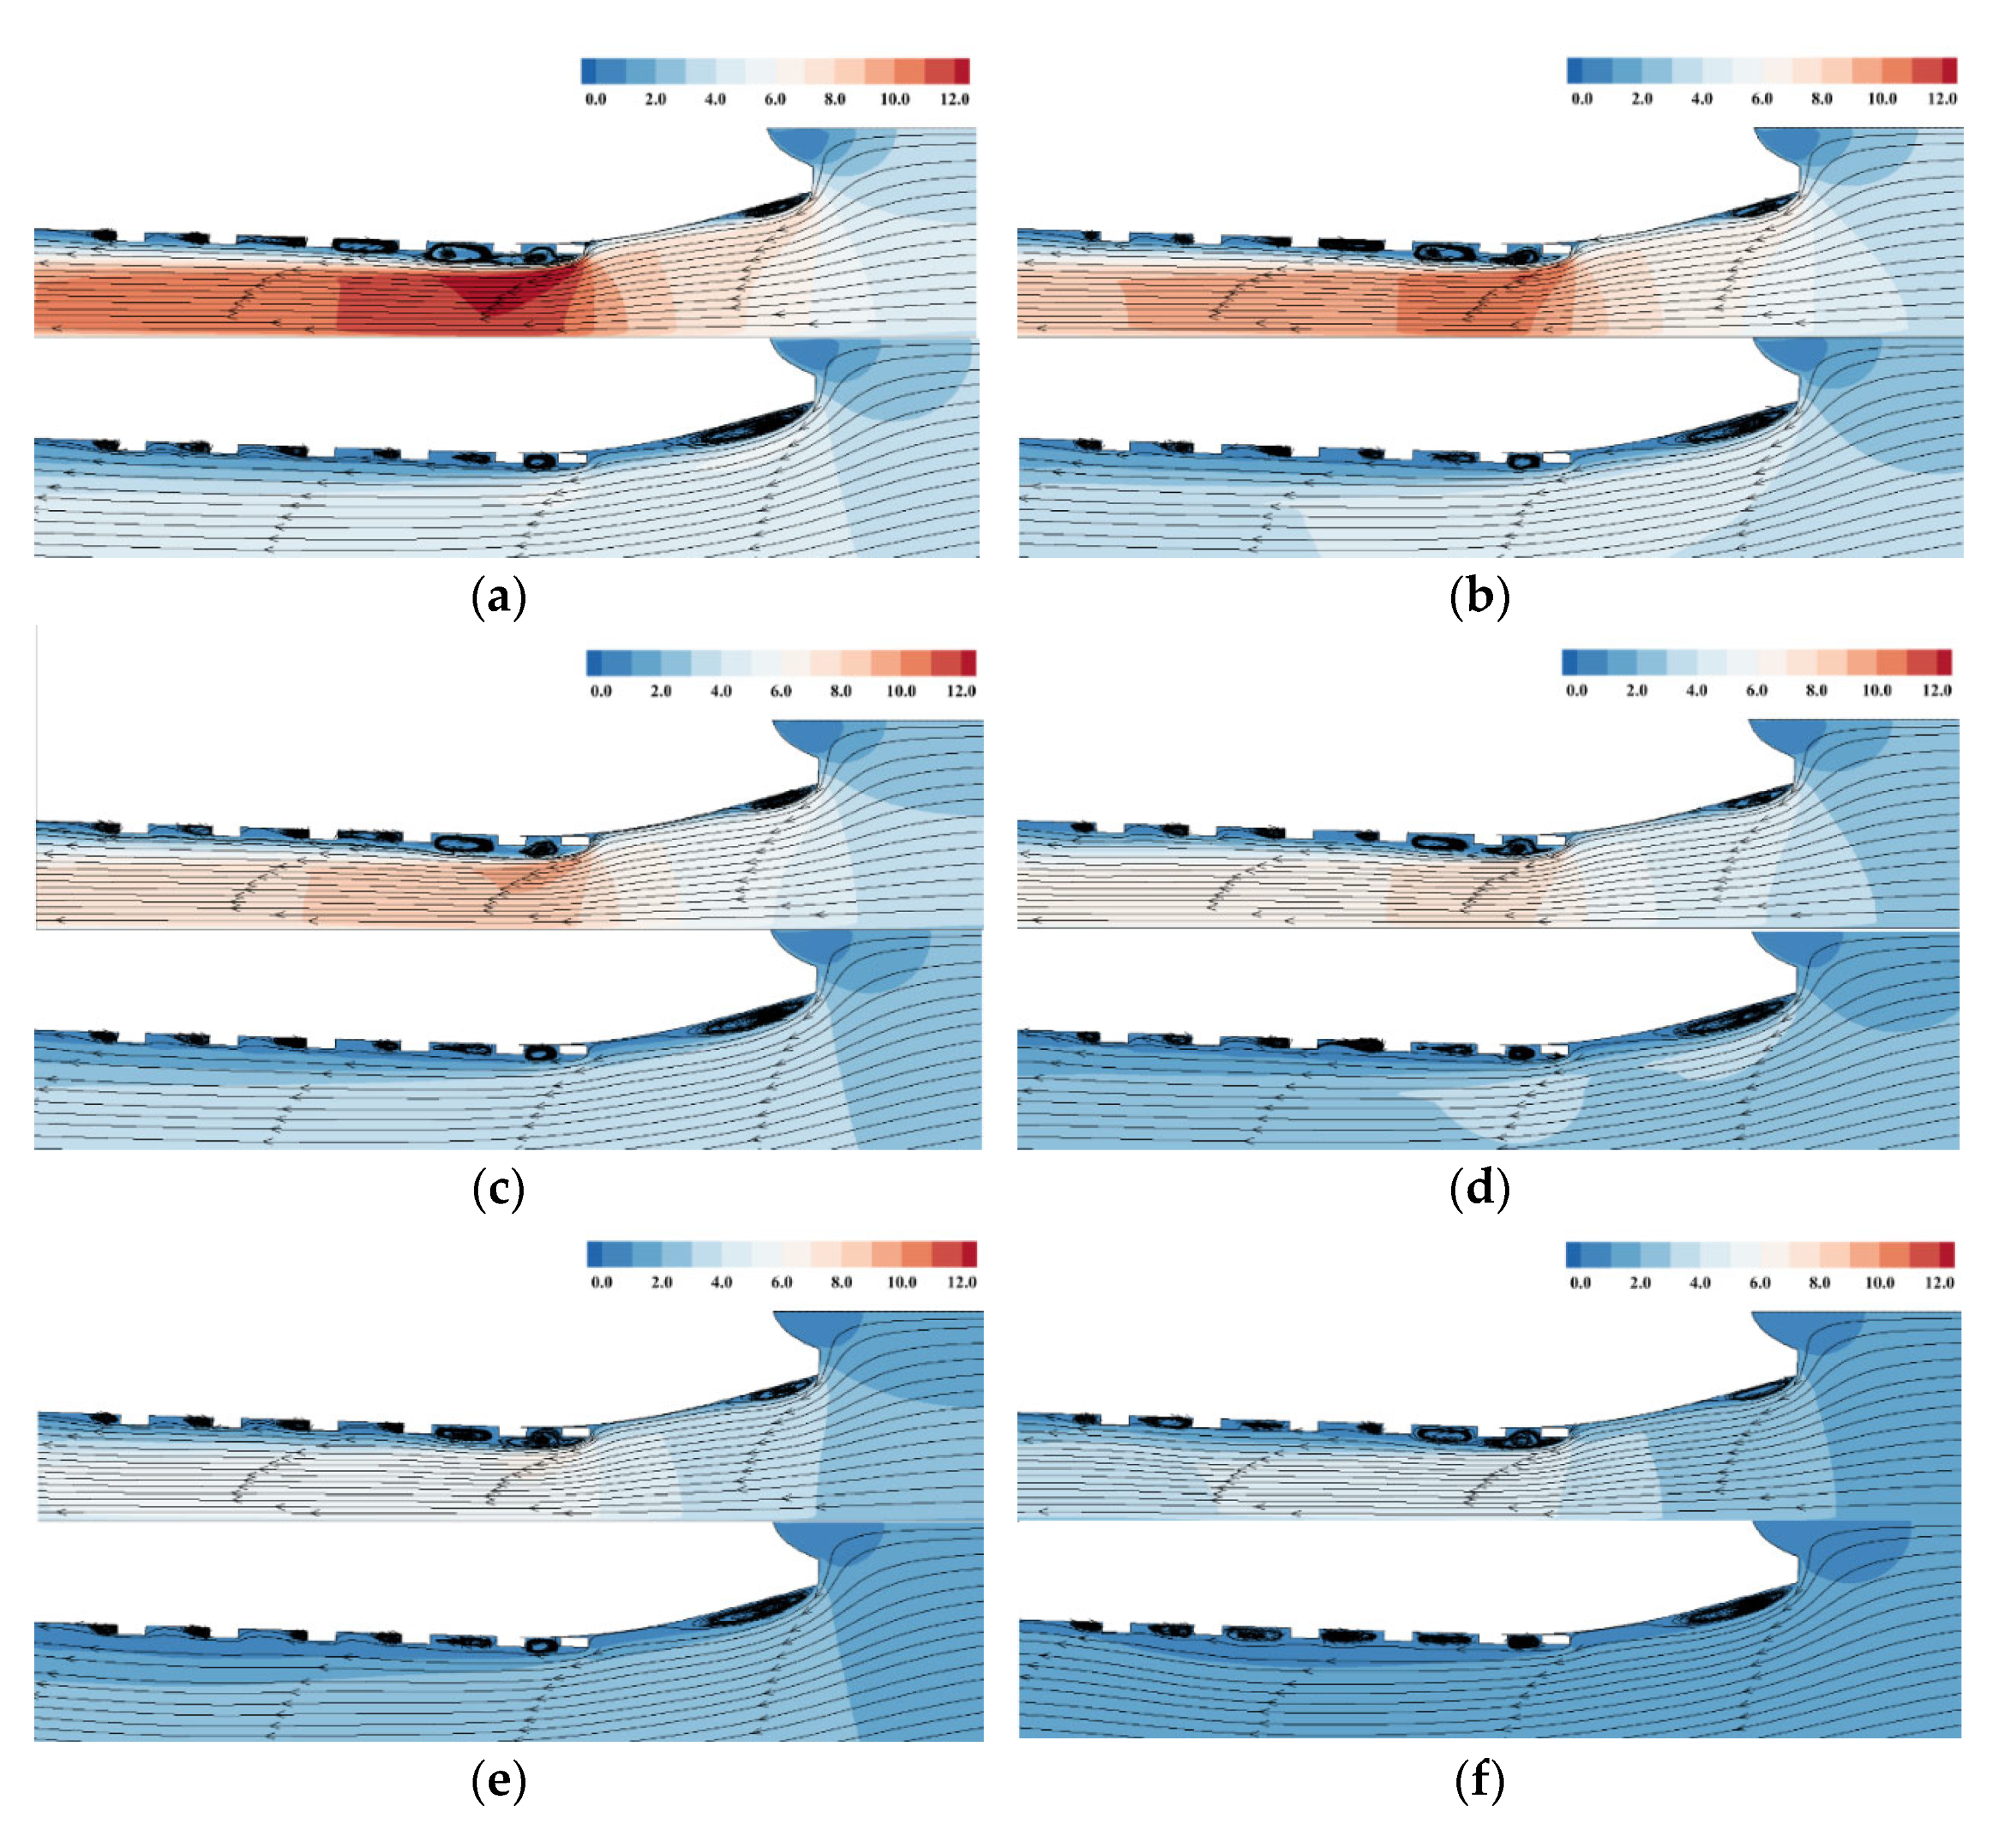
Figure 12 shows the velocity field distribution, with streamlines in deep- and shallow-water conditions ( H / T = 1.5 ). The velocity field near the wall in deep waters presented three-dimensional flow characteristics. The incoming flow passing through the stern and aft poppets causes the vortices to evolve and form.
The distribution of streamlines in the far field is parallel to the direction of ship motion. The distribution was relatively sparse, and the velocity was almost identical. The distribution of streamlines due to the blocking effect surrounding the wall is more complicated. Some vortices were on the hull between aft poppets. Most vortices surrounding the stern end cause a pressure difference on the front and rear of the same aft poppet. As a result, the resistance on the same ship speed significantly increased.
The figure showed that the flow velocity in shallow water is much higher than in deeper water. The increased flow velocity and the reduced pressure attributed to the current flowed backward through the ship’s bottom, and the distribution of streamlines became denser. A pressure difference at the ship’s bottom led to a downward movement of vortices on the hull surface. Note that excessive flow velocity has not resulted in the evolution and development of the vortex.
Vortices were formed after water flowed through the No. 1 aft poppet in deep water. These vortices were partially attached to the hull surface between No. 1 and No. 2 aft poppets (Figure 12a–f). For the case of shallow-water conditions, part of the vortices continued to move backward along the lower surface of the aft poppet and interacted and merged with the vortices between the No. 2 and No. 3 aft poppets. The interaction of these vortices affected the vorticity field distribution near the other aft poppets. The shape of vortices in shallow water was relatively slender than in deep water.
The pressure difference between aft poppets and the additional pressure resistance generated by aft poppets was reduced in shallow water. In shallow water, the hull with aft poppets showed less resistance than the hull without aft poppets. However, the change of ship resistance at low speeds is small. The interaction of vortices was observed at No. 2 aft poppet. Additionally, the sinkage and tipping of the ship due to the shallow-water effect resulted in the reduced distance between the hull and seabed, increased flow velocity, and vorticity-distribution changes.
The following simulations presented the velocity field distribution at various water-depth-to-draught ratios under H/T values of 4.0, 3.0, 2.0, 1.5, and 1.2.
Figure 11 shows the velocity field and streamline distribution surrounding aft poppets at a ship speed of 4.0 m/s. The flow velocity increased with decreasing H/T ratio as the water compressed. The maximum flow rate was at the lowest point of the stern.
The vortices formed and accumulated on the hull face between aft poppets (Figure 13a,b). The shape of the vortices becomes obvious after H/T exceeding 3.0. The aft poppets significantly improve the pressure resistance of the ship to launch.
The vortices between the No. 1 and No. 2 aft poppets affected the shape and vorticity field distribution in the vicinity (Figure 13c,d). The increased resistance due to the aft poppets was suppressed and reduced in shallow water. The ship launching at shallow water with less than 1.5 was particularly significant. The excessive flow at the ship’s bottom affected the evolution and development of vortices. The vortices concentrated on the stinger with a slender shape. The pressure difference was minimal. The ship model friction resistance improved with the resistance of the hull with aft poppets due to the shallow-water effect.
In summary, the launching operation of large container ships should consider a suitable tidal height and the shallow water effect to suppress the increasing resistance due to the damping effect of the stern appendage.

5. Conclusions

The dynamic characteristics of the launching ship were developed based on the CFD method and MATLAB programming. The ship model is a full-scale 8500 TEU container ship, with its initial launching velocity and floatation calculated by MATLAB. The hydrodynamic characteristics and the flow field of the ship model are determined by using the commercial CFD software STAR-CCM+, considering the fluid viscosity.
The verification of the ship model is on the ship resistance compared with that of the experimental results. The results show that the ship model agrees very well with the experiment data, with an error of grid and time-step settings of less than 3%. The ship model is subsequently used to determine the launching ship resistance in the drifting stage to provide a reference for the selection of a damped system of the ship model to simulate a large container ship in longitudinal launching.
The ship model also considers the stern appendages and the hull with and without aft poppets under deep-water conditions. The comparison of the ship’s resistance curves and the velocity field distribution indicated that the stern appendages could influence the ship resistance and the flow field surrounding the ship wall. However, the distribution of streamlines at the stern with the hull with aft poppets is more complicated. A large number of vortices around the poppet surface causes the pressure resistance to increase.
The weight of the superstructure and the main engine of the large container ship on its stern induced a large trim angle and will be subject to the shallow-water effect in launching in restricted waters. The numerical results showed that the hull resistance in shallow water is higher than in deep water. The water depth suppresses the resistance-increasing effect of the ship during launching.
Vortices accumulated on the surface observed between aft poppets for the case of shallow-water conditions. The vorticity field distribution in the vicinity of stern appendages at 1.5 < H/T < 3.0 was significantly affected by water depth. The vortices between the appendages interact and form a slender vortex, resulting in decreased pressure resistance. At shallow-water conditions with H/T < 1.5, the excessive flow rate at the ship’s bottom prevents the evolution and development of the vortices. The formation of vortices resulting in a slender shape on the wall between aft poppets increases the resistance due to the shallow-water effect.
This paper provides a limited study on the practical means to determine a damped system of ship model to simulate a large container ship in longitudinal launching, using the CFD method. The numerical results indicated that the stern appendages and water depth could influence the increasing resistance of the ship’s longitudinal launching. For a large container ship launched in a small slipway under restricted water, a proper design of aft poppets at the ship stern could effectively increase the ship resistance due to the high launching speed in the drifting stage.
Future work will cover the influence and optimization of the aft poppet configurations and the study on the suppression of the ship’s longitudinal launching due to water depth and slippage in shallow water, the increasing ship resistance due to stern appendages, and the effect of tide for safe and effective launch operation.

Author Contributions

Conceptualization, K.L. and B.Z.; methodology, B.Z. and Y.W.; formal analysis, Z.W. and J.P.; validation, B.Z.; writing—review and editing, W.M.G. All authors have read and agreed to the published version of the manuscript.

Funding

This research was funded by the National Natural Science Foundation of China (Grant Nos. 52071059, 52192692, and 52061135107); the LiaoNing Revitalization Talents Program (Grant Nos. XLYC1807190 and XLYC1908027); the Dalian Innovation Research Team in Key Areas (No. 2020RT03); the Fundamental Research Funds for the Central Universities (No. DUT20TD108); and the State Key Laboratory of Ocean Engineering (Shanghai Jiao Tong University) (Grant No. GKZD 010081).

Institutional Review Board Statement

Not applicable.

Informed Consent Statement

Not applicable.

Data Availability Statement

Some or all data, models, or codes generated or used during this study are available from the corresponding author upon request.

Conflicts of Interest

The authors declare no conflict of interest.

References

  1. Sheng, Z.; Liu, Y. Principle of Naval Architecture, 1st ed.; Shanghai Jiao Tong University Press: Shanghai, China, 2003. [Google Scholar]
  2. Žgomba, D.; Turk, A.; Hadjina, M.; Hadjina, D.; Margić, I. Longitudinal Ship Launching. J. Mar. Trans. Sci. 2020, 3, 239–249. [Google Scholar] [CrossRef]
  3. Liu, J.; Yu, L. Numerical investigation on nonlinear contact coupling during ship launching process by an array of airbags. Ocean Eng. 2022, 255, 111481. [Google Scholar] [CrossRef]
  4. Li, H.; Fang, X.; Yu, L. Research on safety of ship launching with airbags under extreme condition of airbag explosion. Ship Eng. 2017, 39, 59–63+79. [Google Scholar]
  5. Zhong, J.; Cheng, Y.; Liu, J.; Zeng, G. Elastic calculation of ship end launching using ANSYS. J. Ship Mech. 2007, 05, 752–758. [Google Scholar]
  6. Lin, S.; Sun, J.; Zeng, J.; Xie, D. A direct calculation method for ship longitudinal launching curves. Chin. J. Ship Res. 2016, 11, 128–134. [Google Scholar]
  7. Farkas, A.; Degiuli, N.; Martić, I. Assessment of hydrodynamic characteristics of a full-scale ship at different draughts. Ocean Eng. 2018, 156, 135–152. [Google Scholar] [CrossRef]
  8. Degiuli, N.; Farkas, A.; Martić, I.; Zeman, I.; Ruggiero, V.; Vasiljević, V. Numerical and experimental assessment of the total resistance of a yacht. Brodogradnja 2021, 72, 61–80. [Google Scholar] [CrossRef]
  9. Zhao, C.; Wang, W.; Jia, P.; Xie, Y. Optimisation of hull form of ocean-going trawler. Brodogradnja 2021, 72, 33–46. [Google Scholar] [CrossRef]
  10. Farkas, A.; Degiuli, N.; Martić, I.; Dejhalla, R. Numerical and experimental assessment of nominal wake for a bulk carrier. J. Mar. Sci. Technol. 2019, 24, 1092–1104. [Google Scholar] [CrossRef]
  11. Bašić, J.; Degiuli, N.; Dejhalla, R. Total resistance prediction of an intact and damaged tanker with flooded tanks in calm water. Ocean Eng. 2017, 130, 83–91. [Google Scholar] [CrossRef]
  12. Senjanovic, I.; Katavić, J.; Vukcevic, V.; Vladimir, N.; Jasak, H. Launching of ships from horizontal berth by tipping tables—CFD simulation of wave generation. Eng. Struct. 2020, 210, 110343. [Google Scholar] [CrossRef]
  13. Fitriadhy, A.; Malek, A.M. Computational fluid dynamics analysis of a ship’s side launching in restricted waters. J. Mech. Eng. Sci. 2017, 11, 2993–3003. [Google Scholar] [CrossRef]
  14. Güzel, B.; Korkmaz, F.C. Reducing water entry impact loads on marine structures by surface modification. Brodogradnja 2020, 71, 1–18. [Google Scholar] [CrossRef]
  15. Li, H.; Yu, H.; Li, X.; Ren, H. Dynamic analysis of longitudinal ship launching in restricted water. Shipbuild. China 2009, 50, 61–66. [Google Scholar]
  16. Wang, W.; Wang, Y. Dynamic analysis for ship launching based on CFD method. J. Dalian Marit. Univ. 2009, 35, 1–4. [Google Scholar]
  17. Blagoveschensky, C.N. Manual of Ship Theory, 1st ed.; National Shipbuilding Literature Press: Leningrad, Russia, 1950. [Google Scholar]
  18. Ferziger, J.H.; Perić., M.; Street, R.L. Computational Methods for Fluid Dynamics, 4th ed.; Springer: Cham, Germany, 2020. [Google Scholar]
  19. Menter, F.R. Two-equation eddy-viscosity turbulence modeling for engineering applications. AIAA J. 1994, 32, 1598–1605. [Google Scholar] [CrossRef] [Green Version]
  20. Wilcox, D.C. Turbulence Modeling for CFD, 2nd ed.; DCW Industries Inc.: La Canada, CA, USA, 1998. [Google Scholar]
  21. Wilcox, D.C. Formulation of the k-ω turbulence model revisited. AIAA J. 2008, 46, 2823–2838. [Google Scholar] [CrossRef] [Green Version]
  22. Berberović, E.; Van Hinsberg, N.; Jakirlić, S.; Roisman, I.; Tropea, C. Drop impact onto a liquid layer of finite thickness: Dynamics of the cavity evolution. Phys. Rev. E 2009, 79, 036306. [Google Scholar] [CrossRef] [PubMed]
  23. Yang, K.; Duan, W.; Huang, L.; Zhang, P. A prediction method for ship added resistance based on symbiosis of data-driven and physics-based models. Ocean Eng. 2022, 260, 112012. [Google Scholar] [CrossRef]
  24. Park, S.; Park, S.; Rhee, S.; Lee, S.; Chol, J. Kang, S. Investigation on the wall function implementation for the prediction of ship resistance. Int. J. Nav. Archit. Ocean. Eng. 2013, 5, 33–46. [Google Scholar] [CrossRef] [Green Version]
  25. Islam, H.; Rahaman, M.; Akimoto, H.; Islam, M. Calm Water Resistance Prediction of a Container Ship Using Reynolds Averaged Navier-stokes Based Solver. Procedia Eng. 2017, 194, 25–30. [Google Scholar] [CrossRef]
  26. Zhang, W. Shallow water effect on ship and its empirical calculation method. Nav. Arch. Ocean Eng. 2019, 35, 6–12. [Google Scholar]
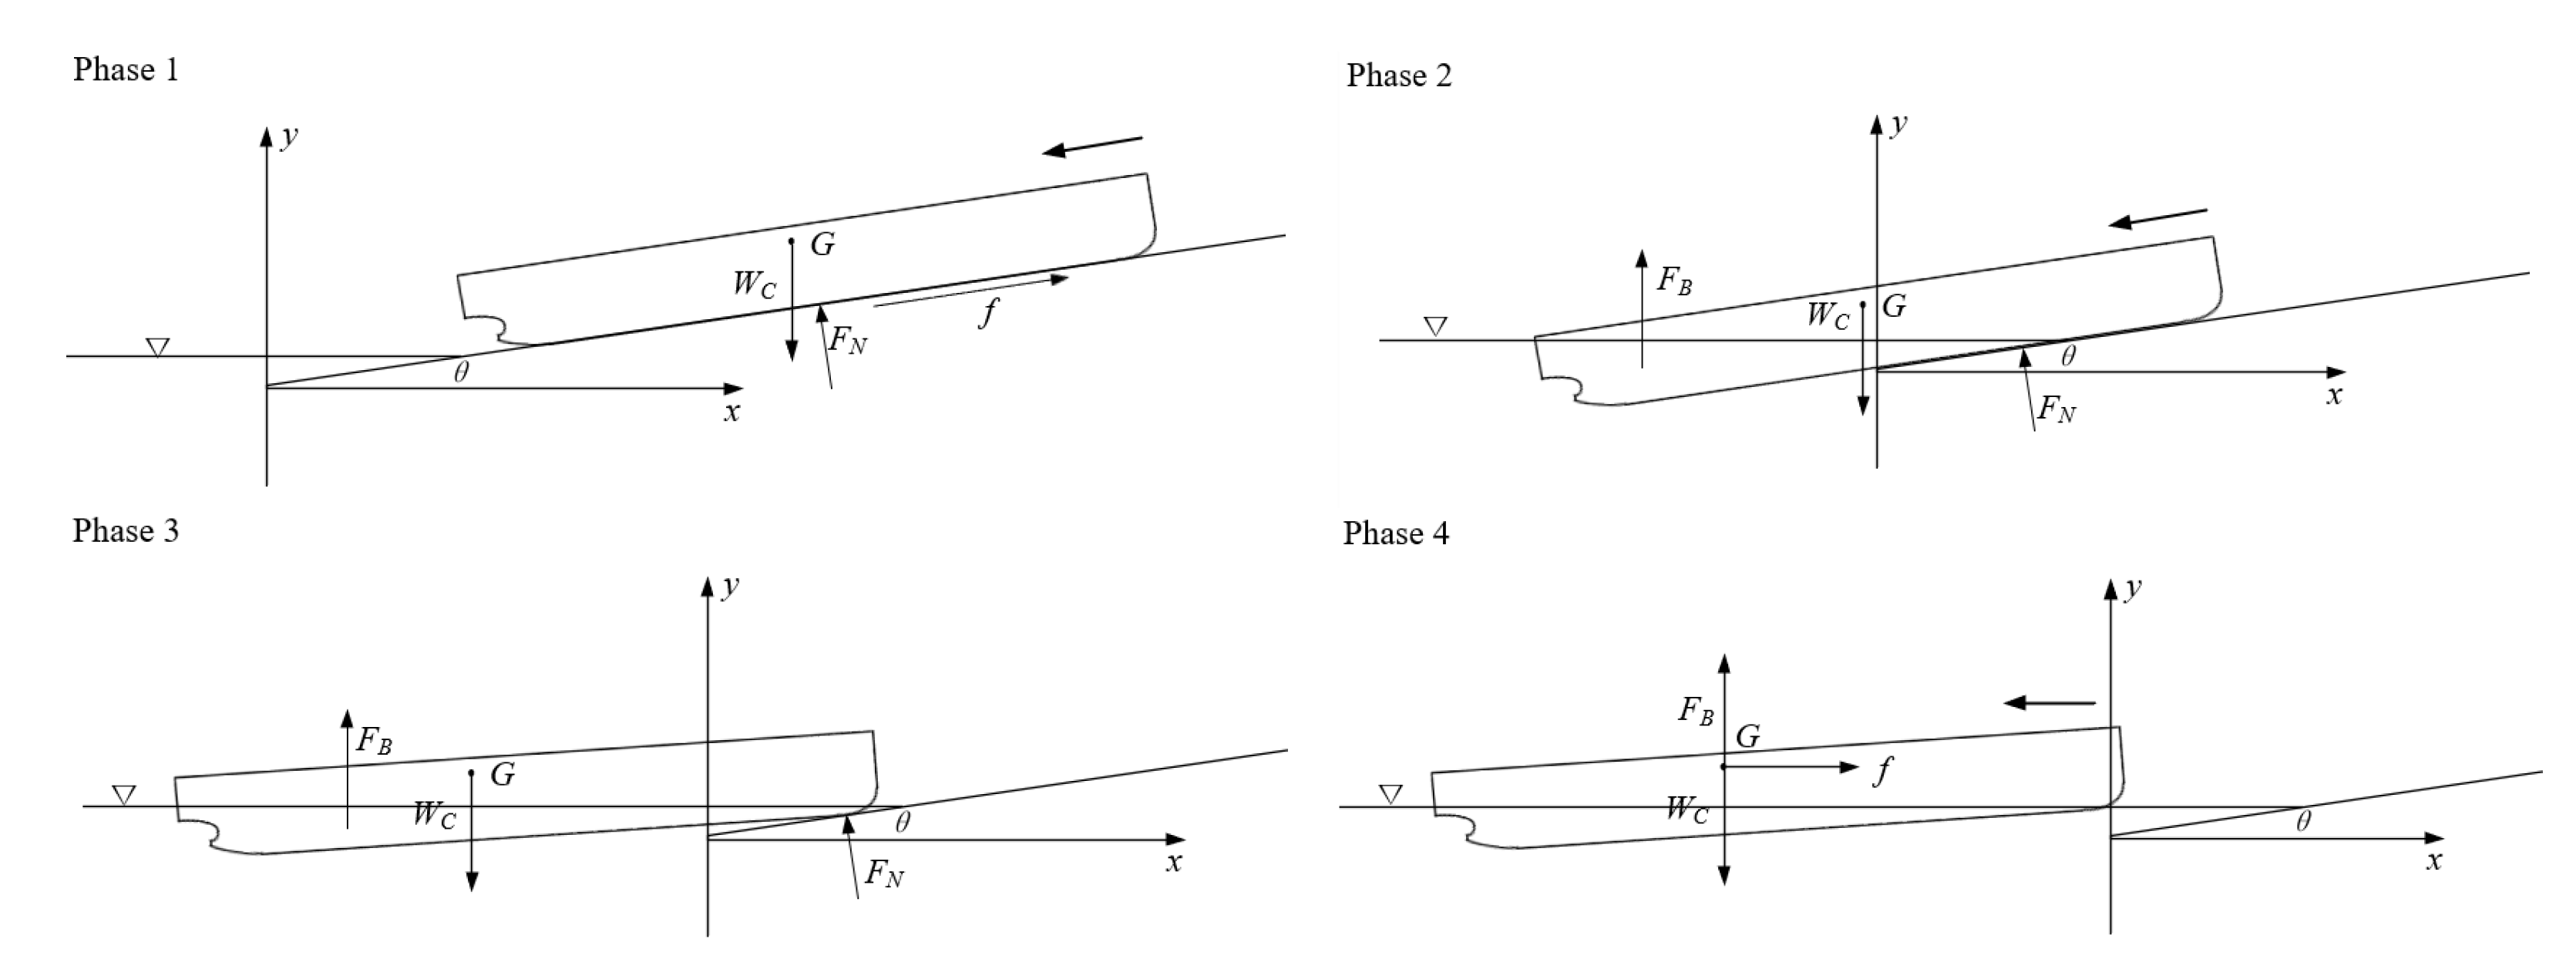
Figure 1. Four (4) stages of longitudinal ship launching.
Jmse 10 01583 g001
Figure 2. Overview of methodology for the ship’s longitudinal launching.
Jmse 10 01583 g002
Figure 3. Reaction forces of launching ship on slipway.
Jmse 10 01583 g003
Figure 4. Overview of computational domain and mesh: (a) position arrangement of computational domain and (b) longitudinal section of mesh.
Jmse 10 01583 g004
Figure 5. Schematic diagram of ship aft poppet: (a) longitudinal profile view and (b) back elevation view.
Jmse 10 01583 g005
Figure 6. Schematic diagram of ship resistance curves.
Jmse 10 01583 g006
Figure 7. Velocity field distribution: (a) 4.0 m/s, (b) 3.5 m/s, (c) 3.0 m/s, (d) 2.5 m/s, (e) 2.0 m/s, (f) 1.5 m/s, (g) 1.0 m/s, and (h) 0.5 m/s. (Note: Upper object in the figure for the hull without the aft poppet and the lower object for the hull with the aft poppet.)
Jmse 10 01583 g007aJmse 10 01583 g007b
Figure 8. Distribution of turbulent kinetic energy: (a) 4.0 m/s, (b) 3.0 m/s, (c) 2.0 m/s, and (d) 1.0 m/s.
Jmse 10 01583 g008aJmse 10 01583 g008b
Figure 9. Arrangement for finite-water-depth condition.
Jmse 10 01583 g009
Figure 10. Comparison of ship resistance curves under deep and shallow waters.
Jmse 10 01583 g010
Figure 11. Ship resistance curves under deep- and shallow-water conditions.
Jmse 10 01583 g011
Figure 12. Distribution of velocity field and streamlines: (a) 4.0 m/s, (b) 3.5 m/s, (c) 3.0 m/s, (d) 2.5 m/s, (e) 2.0 m/s, (f) 1.5 m/s, (g) 1.0 m/s, and (h) 0.5 m/s. (Note: Upper object in the figure for the hull without aft poppet and the lower object for the hull with aft poppet.)
Jmse 10 01583 g012aJmse 10 01583 g012b
Figure 13. Velocity field and streamline distribution at various H/T values.
Jmse 10 01583 g013
Table 1. Calculation results of the ship’s longitudinal launching.
ParametersSymbolsValue
Draft foredF (m)0.1116
Draft aftdA (m)9.8832
Initial velocity of drift stagev (m/s)4.0589
Table 2. The main parameters of 8500 TEU container ship model.
Main ParticularsSymbolsValue
Length between perpendicularsLBP (m)300.5
Length overallLOA (m)306
Breath moldedBWL (m)51.4
Depth moldedD (m)29.5
Launching weightM (t)44,450
Longitudinal center of gravityLCG (m)123.87
Vertical center of gravityVCG (m)19.53
Table 3. Parameters of experimental setup.
ParticularsSymbolsValue
TemperatureTemp (°C)15.8
Densityρ (kg/m3)998.98
Kinematic viscosityv (m2/s)1.115 × 10−6
DepthDEXP (m)4.2
Table 4. Calculation of the discretization error for the verification study.
Spatial ConvergenceTemporal Convergence
N1(Δt1)6,795,2410.05 s
N2(Δt2)3,742,2600.1 s
N3(Δt3)2,079,6240.2 s
r211.352.0
r231.342.0
φ10.00200600.0020072
φ20.00198920.0019927
φ30.00195490.0019758
ε32−3.43 × 10⁻⁵−1.69 × 10⁻⁵
ε21−1.68 × 10⁻⁵−1.45 × 10⁻⁵
s1.01.0
e a 21 0.84%0.72%
q2.90 × 10−20.0
pa2.4750.221
φ e x t 21 2.054 × 10−32.022 × 10−3
e e x t 21 2.64%0.72%
G C I f i n e 21 3.00%0.90%
Table 5. Comparison of ship resistance in calm water.
GridGrid QuantityResistance Coefficient (Ct)Error (%)
N32.0790.00195493.17
N23.7420.00198921.47
N16.7950.00200600.64
EFD---0.0020189---
Publisher’s Note: MDPI stays neutral with regard to jurisdictional claims in published maps and institutional affiliations.