Article

Broken Ice Photogrammetry in Model-Scale Experiments with Sloped Structure

Laboratory of Ice Engineering Research Fundamentals, Peter the Great St. Petersburg Polytechnic University, 195251 St. Petersburg, Russia
*
Author to whom correspondence should be addressed.
J. Mar. Sci. Eng. 2022, 10(11), 1590; https://doi.org/10.3390/jmse10111590
Submission received: 13 September 2022 / Revised: 13 October 2022 / Accepted: 25 October 2022 / Published: 27 October 2022
(This article belongs to the Special Issue The Ice-Ocean Boundary)

Abstract

:
Testing a physical model of an ice-resistant marine structure in an ice tank is one of the methods used for design validation. For a stationary structure design, not only is the possible global ice load of interest but also the processes of creation and evolution of ice rubble in front of the contacting surface. While the load registering technique in model-scale experiments is very well-developed, the photogrammetric analysis of broken ice morphometry and locomotion is not. The photographs taken to illustrate the breaking process do not usually accompany the information necessary for the photogrammetric reconstruction of the scene. This paper outlines a systematic approach to the photogrammetric analysis of the scenes in model-scale conditions. Using this approach, the broken ice dimensions were measured in seven model-scale experiments for which the model of a sloped marine structure was reconstructed. In these experiments, a 700 mm wide slope with an inclination angle of 53° caused an upward flexural failure of the model’s granular ice. Reference global load histories for these experiments are provided. For the first contact episodes, the successful reconstruction of the broken ice mosaic in the polynya showed the insignificant contribution of compressive failure. In continual ice–structure interaction, the morphometry of the ice blocks visible on the slope of the rubble pile and on the surface of the surrounding ice sheet was retrieved from orthorectified video frames. The results were compared with the after-test nadir drone view of the polynya. The error in estimating the top-side area and the maximum linear dimension of the ice block fell into the interval of 0–10%. The morphometric information of the broken ice floes obtained in ice tank experiments with physical models can be used for the improvement of the mechanical models of ice fracture and failure against inclined offshore ice-resistant structures.

1. Introduction

Recording visual information on ice features to estimate their sizes, shapes, and locations is a common practice in both natural and model-scale investigations. In natural conditions, observations are usually made from a navigating ship by a specially trained observer [1]. The measurements performed in this way depend on the experience of the observer, and sometimes, it can be difficult to match visual observations made by different people. In model-scale experiments, for video and photo documentation, attention is paid to a better view of a scene and not to the parameters that may help photogrammetrically reconstruct the scene. Thus, the focal length, height, and inclination angle of imaging are rarely recorded, and images are often taken from an oblique view with both the inclination and rotation of a camera. However, obtaining a full set of parameters required for photogrammetry is easier in ice tank conditions than in in situ observations.
The algorithmic photogrammetry of automatically recorded images is the desired solution for data acquisition, both in model-scale tests and in natural ice conditions. In expedition studies, reliable algorithmic photogrammetry may decrease the required number of staff members on vessels while at the same time providing results convenient for comparative analysis. In model-scale ice tank experiments, the automatization of photogrammetry will help to include the broken ice morphometric data in the output of experiments on a regular basis.
At the moment, the photogrammetry of natural ice objects is being studied in relation to satellite, aerial, and ship-based images taken both with the nadir or inclined position of a camera. In airborne studies of ice conditions, the nadir position of a camera is widely used [2,3,4,5]. For the ship-based registration of ice thickness, the nadir position of a camera is used as well. Obtaining information about the thickness of ice by analyzing video recordings of ice fragments on board the ship has been used since the 1990s [6]. This method is also actively used in recent studies [4,6,7,8,9] and does not require orthorectification.
For estimating the ice concentration and ice features from a vessel [1,10,11] or close-range pancake ice observations from a buoy [12], oblique view cameras are used. In this case, the obtained images demand orthorectification for the subsequent retrieval of the dimensions of ice objects and their relative positions.
For example, when recording ice from an icebreaker, described in [10], the following original method is used for orthorectification. When a vessel is moving through the ice, a transformed image of the ice situation is made from sequentially received data from a single row of pixels of the video camera image recorded at a constant frequency. However, it should be noted that this method will not be effective if a vessel has rolling or pitching motions. The dynamic behavior of broken ice also prevents using this method in ice tank experiments. In other studies, orthorectification was performed with the use of calibration images [1] or analytic equations [13].
Up to now, the photogrammetry of broken ice in model-scale experiments with the retrieval of the geometric characteristics of single ice objects has been successfully implemented using nadir view cameras [14,15,16]. In these cases, the planar dimensions of thousands of objects floating on the water surface have been retrieved, which allowed researchers to draw conclusions on the floe size distribution after a physical action, i.e., wave ice breakage. The nadir position of a camera can be achieved by using a crane, which can move high above the scene [16,17]. For nadir images, there are still some issues of recognition demanding manual corrections such as the over-segmentation of peculiar-shaped ice floes or the under-segmentation of tightly positioned floes. The recognition of separate modeled ice pieces in an image of the ice tank surface is not an easy task due to fuzzy edges and errors in the recognition of the closing ice floes [14,16,18].
The images captured with a hand camera are usually inclined to the horizon. To the best of the authors’ knowledge, the oblique-view images of ice tank experiments have not been the subject of photogrammetric scene reconstruction thus far.
The photogrammetry of broken ice on the surface of an ice tank is relevant in the context of both analyzing the results of a model experiment [16,19,20,21] and verifying the loading models of broken ice [22].
Apart from retrieving data on broken ice from natural and model-scale experiments, predictions can be made by using mechanical models. In the case of a sloping structure, the analytical model of level ice failure against an inclined plane [23] or its numerical model [24] has previously been developed. The particular interest in ice–slope interactions involves the loads caused by the structure and their connection with the behavior of broken ice. Several studies have been performed on the DEM and FEM simulation of these processes, the results of which were compared with ice tanks’ results [24,25,26]. Currently, the behavior of broken ice pieces in the ice–slope interaction is understood only with a high degree of generalization. Model-scale experiments have shown that the loads on a structure in this kind of interaction do not show any signs of stationarity [27]. Photogrammetry in a model-scale experiment with a sloped structure is applicable to the study of the ice fragments formed after the first contact of the ice floe with the structure. In this case, by stopping the towing trolley immediately after the formation of these fragments is completed, their morphometry can be studied in detail. However, if the trolley continues moving, the appearing fragments will be submerged, split into several pieces, and milled. Such continuous transformation demands using a special approach of photogrammetry of the ice blocks positioned on an inclined plane. For this purpose, transparent walls and templates with rectangular arrangements were previously used [28,29].
This paper presents a systematic study of broken ice photogrammetry in ice tank experiments with a model-scale sloped wall. The structure of the paper is as follows: An introduction is provided in the first section. In the second section, the characteristics of the model-scale experimental setup and conditions are provided. In the third section, image processing is described, including the correction of distortion and orthorectification. In the fourth section, the results of broken ice photogrammetry in experiments are presented, including the photogrammetry of the broken ice from the pile in front of a moving sloped structure. The fifth section contains a discussion, while the sixth section provides the conclusions.

2. Experiments

2.1. Experimental Setup

To obtain the broken ice images for the photogrammetric study, experiments were performed in the ice tank of Krylov State Research Centre (KSRC), St. Petersburg. In all the experiments, a 700 mm wide model with a frontal wall inclination of 53° was used (Figure 1). The experiments were performed according to the principle of inverse motion: The model was towed against the ice floe with a towing carriage, while the floe itself was standing still. No false bottoms were used in the tests. In the first part of the experiment, four large cantilever beams were prepared from the ice floe and broken by the sloped wall of the model at a velocity of 2.5 mm/s (Figure 1a). After the first beam–slope contact, the crack in the beam appeared in about 8 s, then the “support” phase took place, when the broken fragment behaved like a spacer, transmitting stress to the remaining part of the beam and resulting in new cracks. After release, the photogrammetry of the broken fragments that contacted the structure was performed. In the second part of the experiment, level ice sheets imitating a semi-infinite plane were broken by the sloped wall of the structure at velocities of 2.5 mm/s and 5 mm/s (Figure 1b). After the first plane–slope contact, circumferential and radial cracks appeared, generating several fragments. The photogrammetry of these fragments was performed for all the tests, while for the last test, the photogrammetry of the ice pieces observable during the evolution of rubble piles in the continuous ice–structure interaction was performed.
In total, two ice floes were employed: Floe 1—for the tests with beams and for two of the three tests with planes; Floe 2—for the third test with an ice plane. Both floes were of nearly equal thickness and were prepared in a similar way. Their characteristics are provided in Table 1.

2.2. Ice Model’s Characteristics

In the KSRC ice tank, as a rule, granular ice floe models are used, which are prepared according to fine-grain technology. These ice floes have sizes that allow for performing several different tests with one floe [30]. The technology for producing granular ice models was invented in the 1980s [31] in order to improve the modeling of strength properties. Granular ice is obtained by depositing small ice granules on cooled water in several layers. When a layer of the required thickness is formed, a long-term stage of cooling is performed. A similar approach but with differences in dopants was used in the ice tank at Aalto University, which is in Espoo, Finland [32]. However, this is not the only way to obtain the material applicable for testing the models of ice-resistant structures and ships [33]. For instance, the natural growth of ice crystals from an initially seeded thin layer of ice microgranules was used in the HSVA ice tank model [34] located in Hamburg, Germany.
After finishing all the stages of the modeled ice floe’s preparation, the temperature in the ice tank was raised to different values that would be comfortable for operating the experiment and high enough for preventing the natural ice appearance in the openings of clear water. The mechanical properties of ice were usually measured at the beginning of the experimentation day and at the end of it. As is common, the measurements were performed according to the recommendations of the International Towing Tank Conference [35]. In fact, the mechanical properties of the modeled ice floe did not remain constant during the experimentation day for the ice model grown naturally from a thin seeded layer [36] or for the fine-grain ice model used in the experiment for this study. In Table 1, the separate meanings of the properties analyzed at the beginning and end of the day are provided.
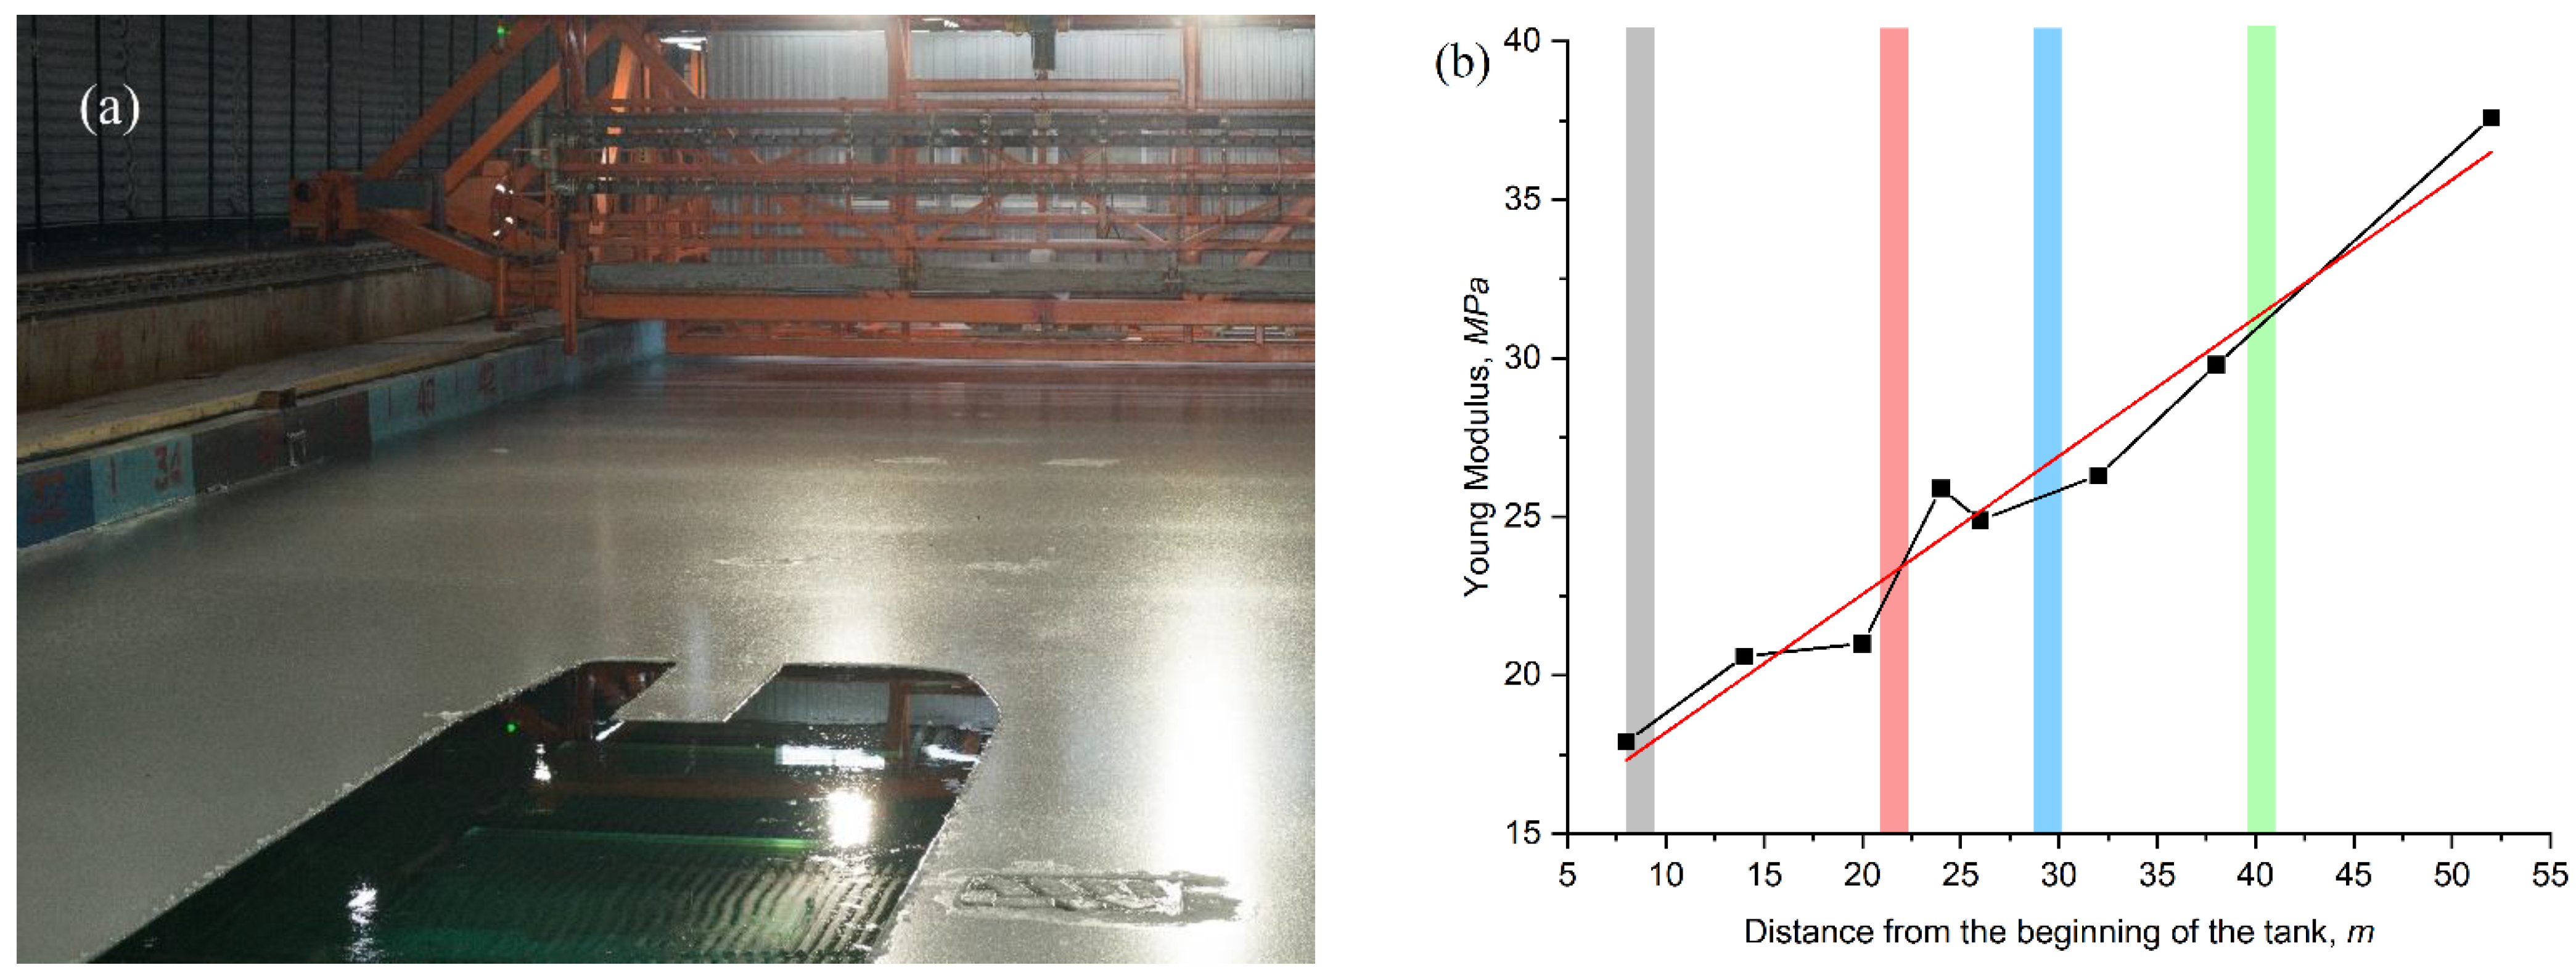
The measurements of compressive and flexural strength require making holes in the ice floe, while the elastic modulus measurements use the temporal deformation of the floe using a dead weight without punching it through. This fact was used to control the elastic modulus of the ice in the experimented places before making a beam or cutting a polynya. For Floe 1, the spatial differentiation of the elastic modulus throughout the first half of the ice tank is presented in Figure 2b. The black dots represent the averages of four measurements at the specific distance from the edge of the ice tank: two measurements from the right side of the floe and two from its left side. One can see that the longwise tendency for the elastic modulus E for this particular floe is well-described by linear tendency.
E = 13.84   MPa + a x
where x is the longitudinal coordinate in meters, and coefficient a = 0.44   MPa m . The fitted tendency is given in Figure 2b with a red line, while the approximate positions of the cantilever beams along the floe are provided with colored rectangles. For Floe 2, the elastic modulus was measured 18 times before the test in different places throughout the ice plane. The average value was 24.4 MPa, the minimum measured value was 21.1 MPa, and the maximum was 26 MPa.

2.3. Image Acquisition and Processing

In this section, image acquisition equipment and the rectification of the obtained images are described. Having a rectified image with a restored scale, it was possible to reconstruct the dimensions and contours of the fragments to obtain metric information about the location of their mass centers at the time of taking pictures, as well as to identify the ice fragments on sequentially obtained video frames or photographs.
Knowing the parameters of both photo or video cameras and the shooting condition plays a key role in the successful photogrammetric reconstruction of the details of a scene. In the ice tank experiment, simulated ice with a constant thickness was used, so the restoration of the 2D contours of the flat ice floes was the main concern. This task can be performed most successfully by photographing them from a nadir position from a known height, while it is desirable to have a contrasting background (water). The design features of the towing carriage in the KRSC ice tank prevent the stationary location of a video camera in the nadir position in the ice-breaking zone; therefore, the recording of the processes in the described experiments was conducted at an angle.
For the acquisition of the broken ice images, both stationary and hand cameras were used. Two GoPro HERO9 Black cameras were deployed on the towing carriage: one to provide an inclined view from the above and the other to provide a side view of the breaking processes. The images with a general view and the final results of the ice floe breakage were acquired with a hand high-resolution camera NIKON D800. GoPro HERO9 cameras had a focal distance of 2.92 mm, while NIKON D800 used a variable focal length, recorded each time in the metadata of the resulting image. In the studied images, this focal length varied in a range of 35–55 mm.
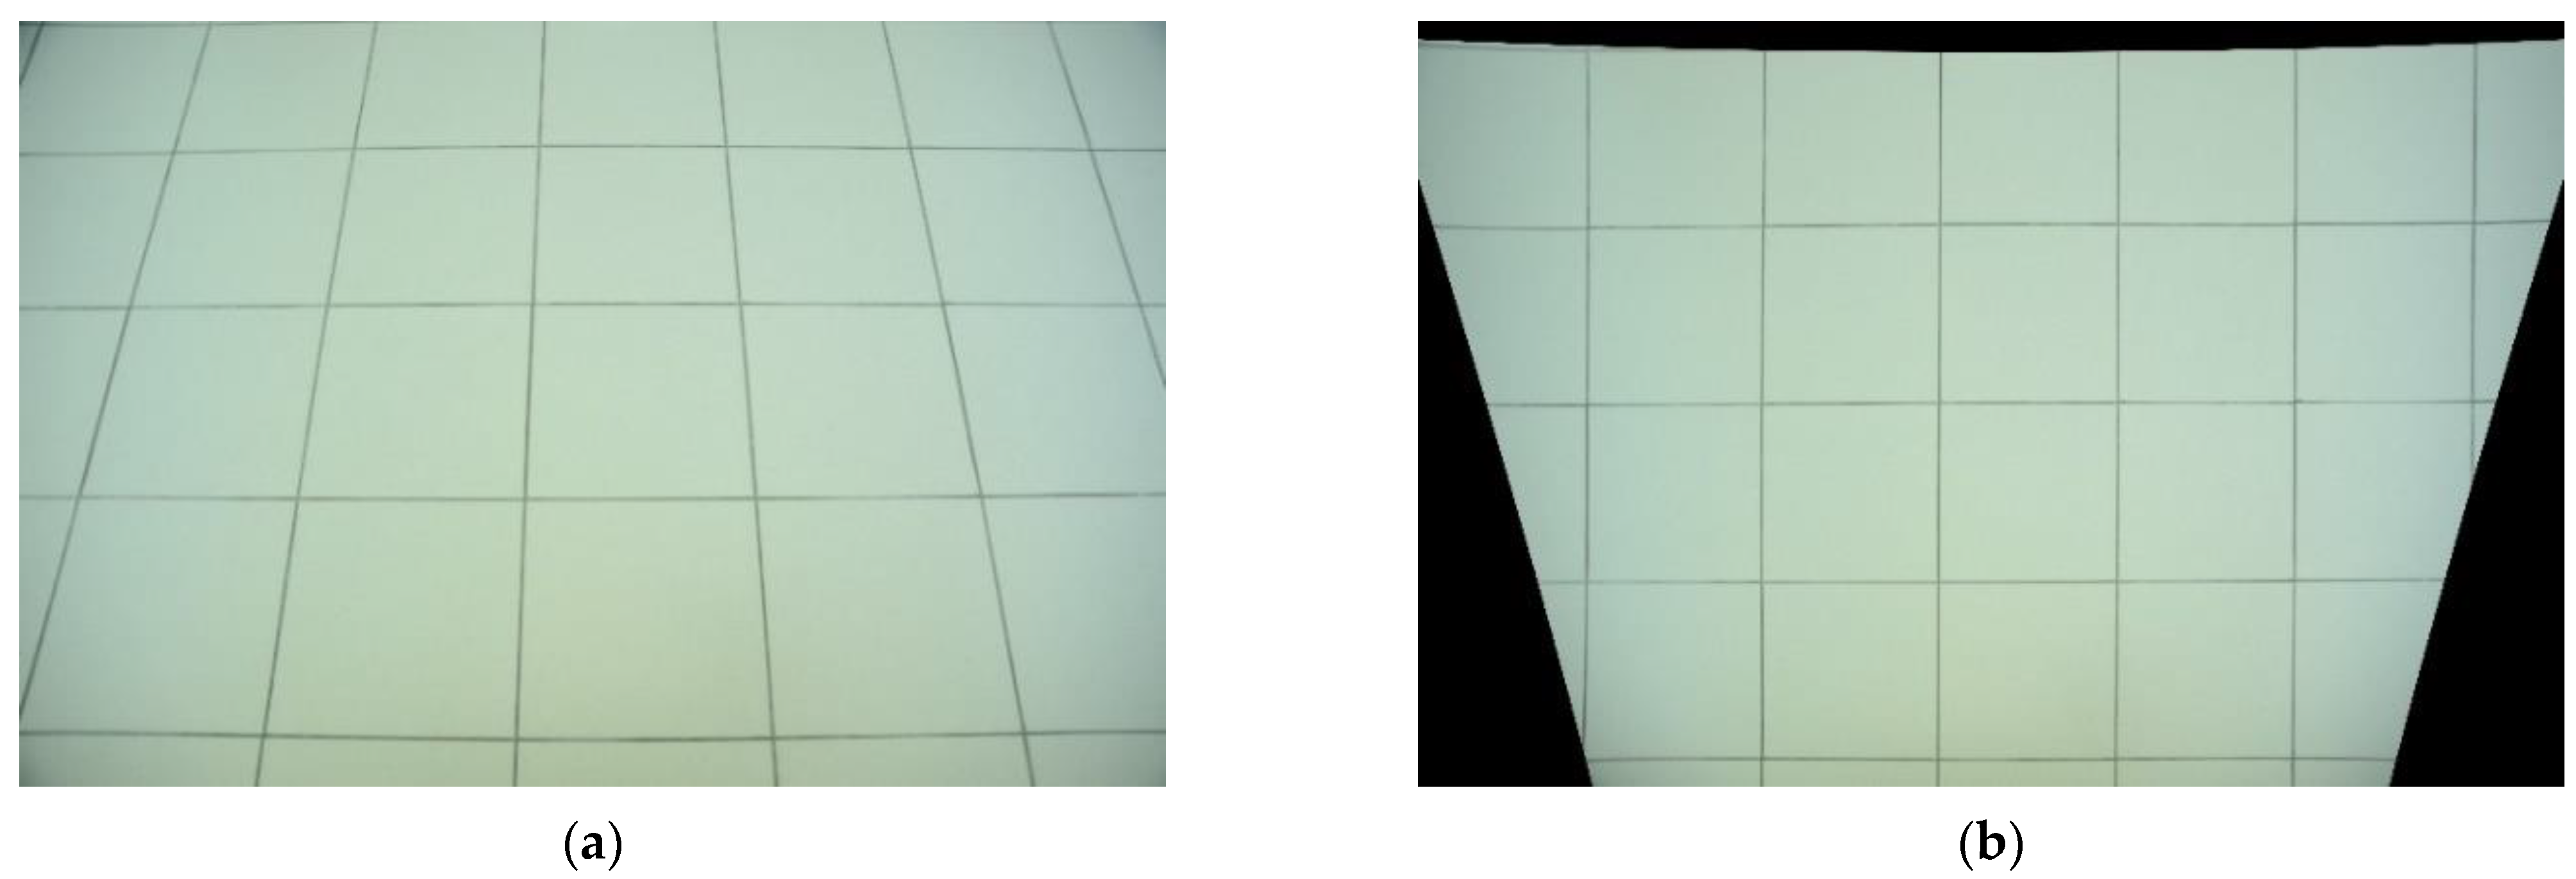
The cameras were tested on radial distortion, which is the optical aberration making straight lines in the scene curvilinear in the image. Following [1], the images of a tile floor were used for testing and calibration. The images captured with NIKON D800 had noticeable distortion (Figure 3a), while the images captured with GoPro HERO9 did not. For correcting the distortion in NIKON D800 images, the method developed in [37] was implemented, which uses a straight-line distortion in the image.

3. The Method

Let the image under consideration be the matrix of h × w pixels. We consider the central point of the image ( h 2 , w 2 ) as the distortion center. Following [38], for correcting the distortion, we applied the simple version of his division model:
i u = i 1 + λ r 2   ;   j u = j 1 + λ r 2
where r = ( i i c d ) 2 + ( j j c d ) 2 is the distance of the pixel ( i , j ) from the distortion center ( i c d , j c d ) in the distorted image, while the new undistorted position of this point is ( i u , j u ) , and λ is the parameter of radial distortion, which for the images from NIKON D800, happened to be −0.069. The undistorted orthorectified calibration image is provided in Figure 3b.
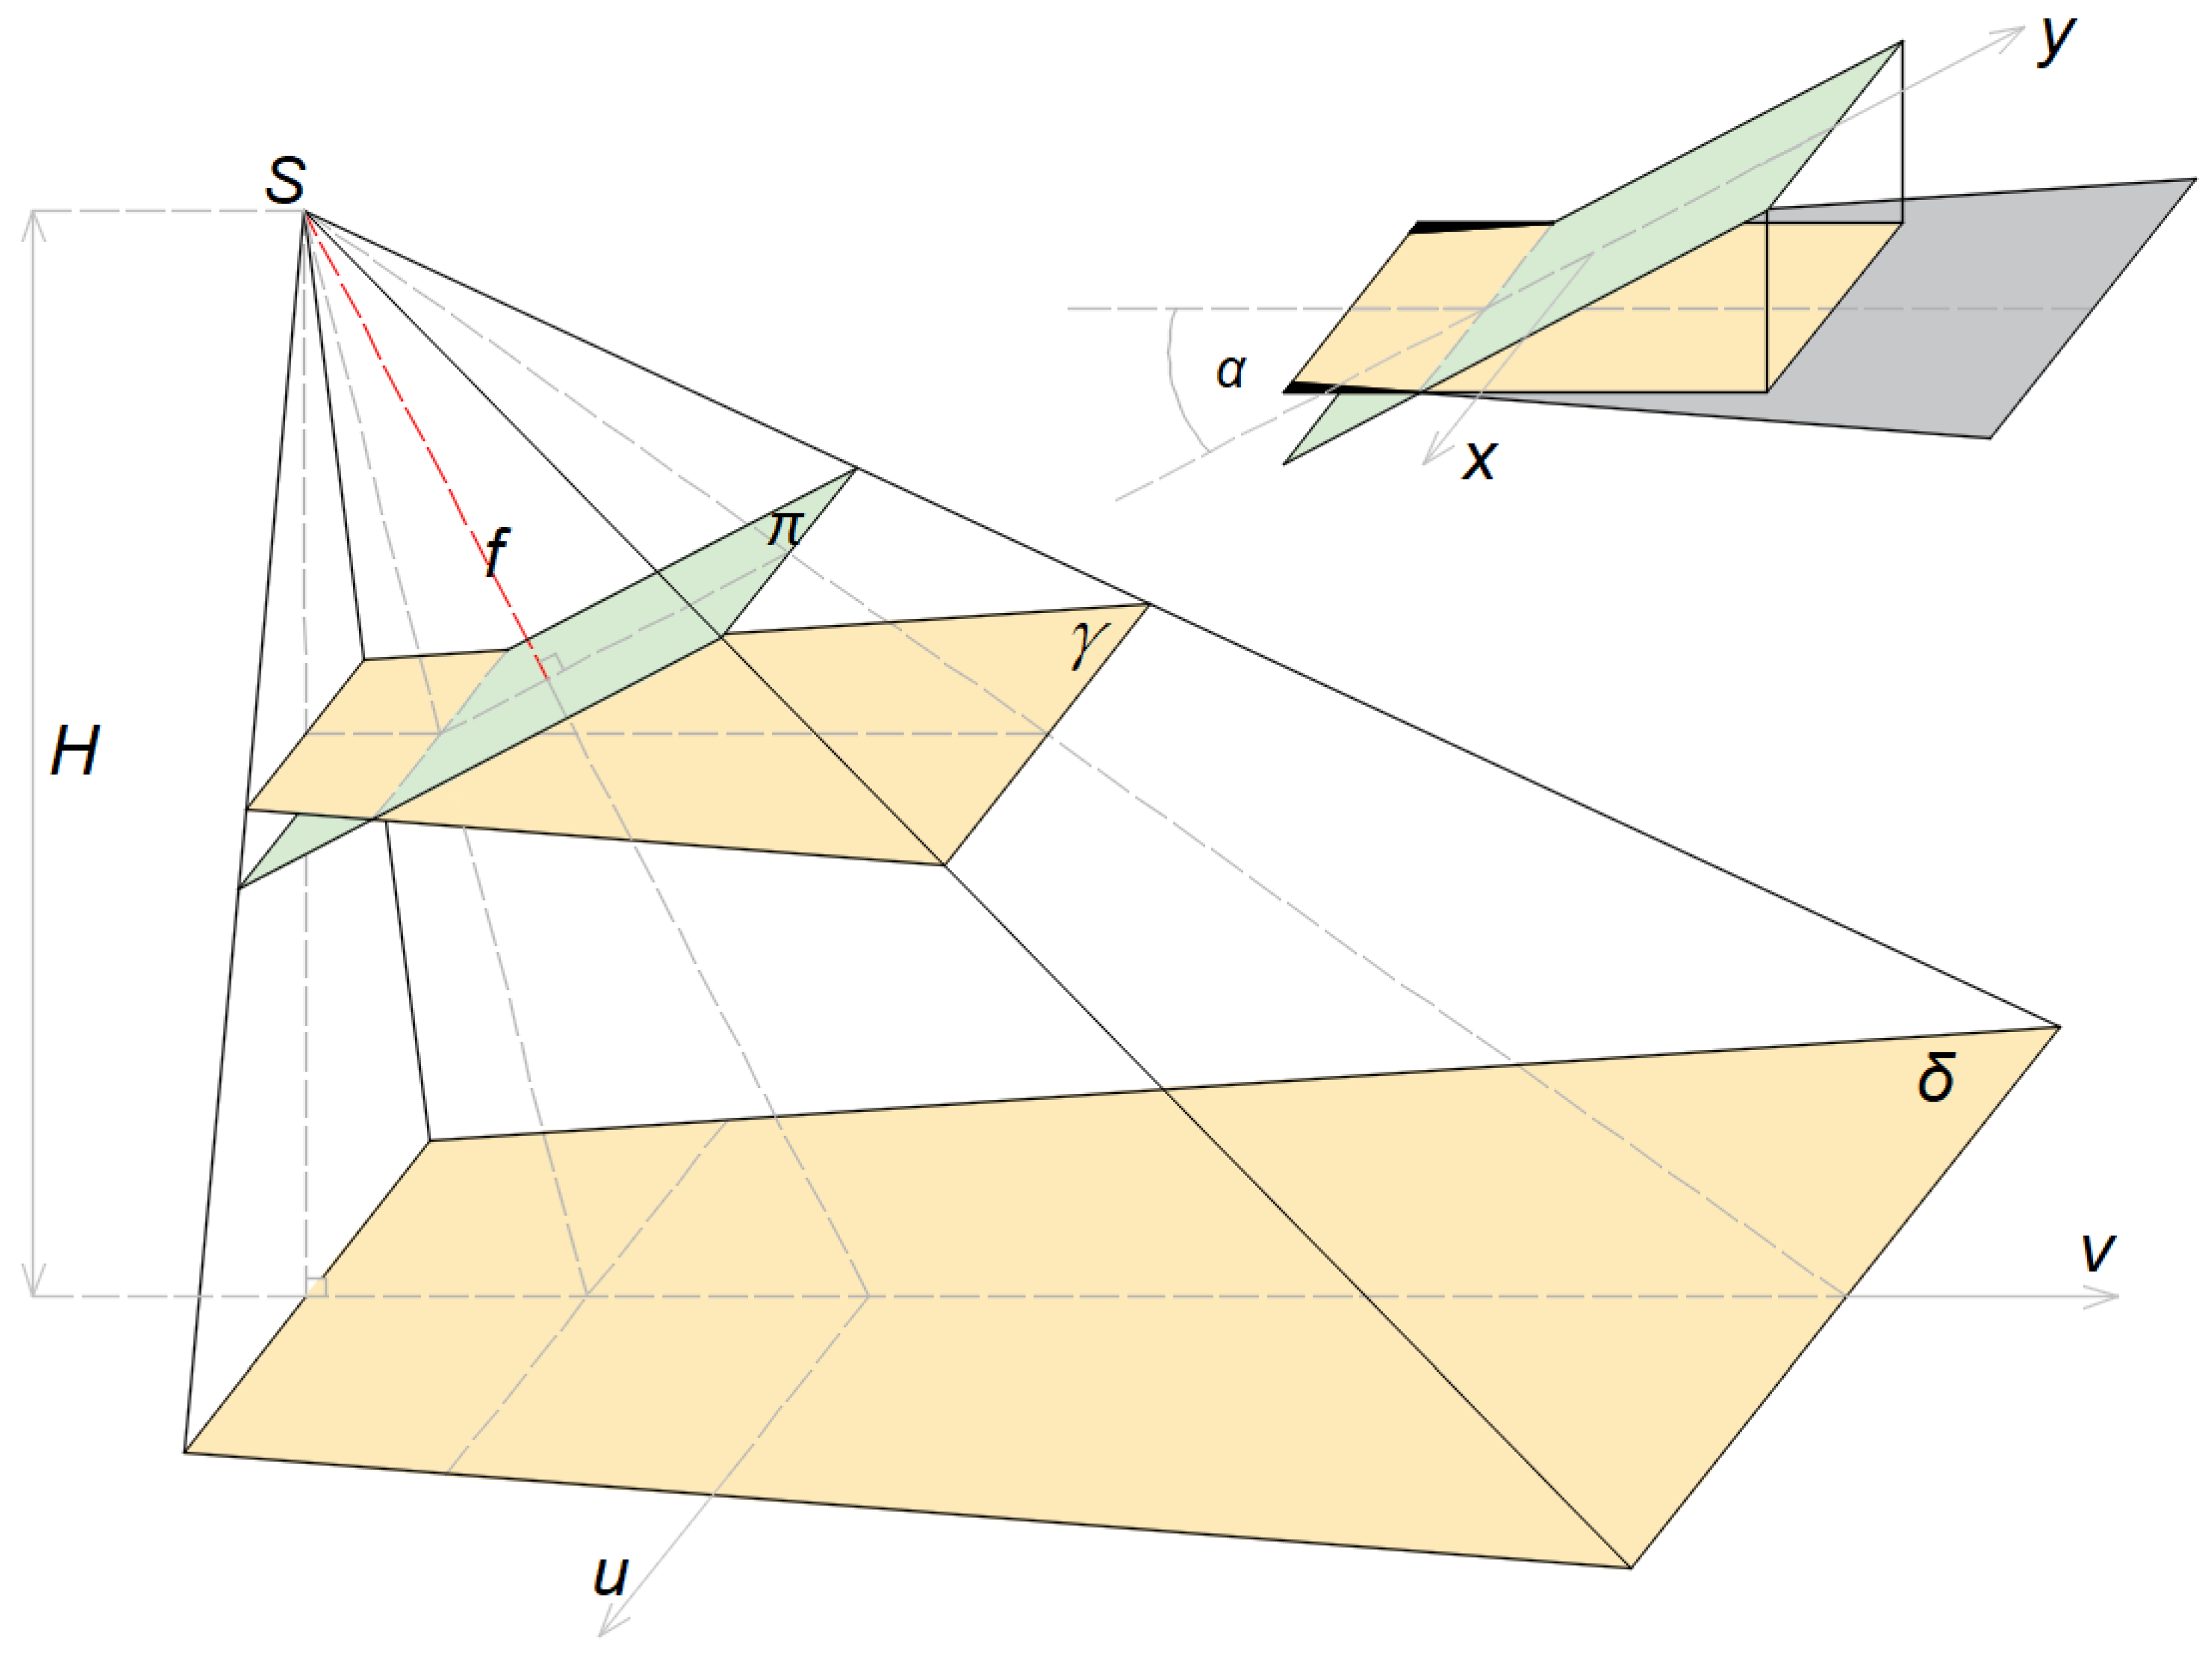
After the distortion correction (if needed), the orthorectification of the image was required due to the non-nadir position of the camera. Orthorectifying an oblique view bitmap image or contours in it, we evaluated the new positions of pixels obtaining a nadir view of the scene. Let us denote the position of the image inclined by the angle α with π and introduce the coordinate system ( x , y ) with the origin at the point of normal to S (Figure 4). Following [39], let us denote the plane of the ice tank surface with δ and introduce the coordinate system ( u , v ) there. Let the origin ( u , v ) be located at the point of the incidence of the normal to plane π passing on through the origin ( x , y ) . At the nadir position of the camera, for parallel π and δ , the coordinates of their points are proportional, with the proportionality coefficient of f / H . Here, f is the focal length of the camera, and H is the height of the point S above δ . For every point   ( x , y ) in π , the corresponding point in δ can be found using the following formulas:
u ( x , y , f , H , α ) = H x f cos α y sin α
v ( y , f , H , α ) = H y ( f cos α y sin α ) cos α
The orthorectified image can be obtained as the rectangular fragment of the plane γ , which contains the line of the unchanged scale of the image and at the same time is parallel to δ . The area in δ represented in a rectangular, inclined image π has a trapezoidal shape. Thus, in the orthorectified image, the informative area is also trapezoidal (Figure 4). Frequently, in such an image, only the central part of the scene is left, which results in unpainted lateral triangles. All the coordinates in γ are proportional to those in δ with coefficient f / H :
x γ ( x , y , f , α ) = f x f cos α y sin α
y γ ( y , f , α ) = f y ( f cos α y sin α ) cos α
The direct pixel-by-pixel orthorectification from π to γ leaves unfilled gaps. Therefore, the inverse procedure is widely used, which consists of finding a pixel in π with coordinates   ( x , y ) , which corresponds to a pixel in γ with coordinates ( x γ , y γ ) :
x = x γ f cos α f + y γ sin α cos α
y = y γ f co s 2 α f sin α cos α
Then, the pixel in γ is assigned to a color of the pixel in π , which results in obtaining the orthorectified image scaled by f / H in γ .
For correct orthorectification in scale, the values of three parameters ( f , H , α ) should be known. For a stationary camera, height H is known, while for a hand camera, the exact meaning of H is usually unknown. Focal length f can be either static or dynamic, depending on the camera, and is usually recorded in the properties of an image. When shooting with a manual camera, it is necessary to maintain the parallelism of the base of the frame to the axis u . However, the immediate angle α of the inclination of π to δ , as a rule, remains unknown. For an after-experiment evaluation of this angle with a known H , an apriori known dimension in an image can be used. If a distance L between two points ( u 1 , v 1 ) and ( u 2 , v 2 ) in the scene are known, as well as their positions ( x 1 , y 1 ) and ( x 2 , y 2 ) in image π , then with respect to (3) and (4), we can find α by numerically solving the equation
( u 1 ( H , α ) u 2 ( H , α ) ) 2 + ( v 1 ( H , α ) v 2 ( H , α ) ) 2 L 2 = 0
After the transformations, we obtain a system with unknown A and B at f > 0 :
{ y = f 2 + y 1 y 2 f 2 + y 1 2 x f ( y 1 y 2 ) f 2 + y 1 2 1 A 2 f 2 + y 1 2 ( x 1 B x 2 A ) 2 + ( y 1 y 2 ) 2 f 2 = L 2 H 2 A 2 B 2
where
A = y 1 sin ( α ) + f cos ( α )
B = y 2 sin ( α ) + f cos ( α )
Additionally, hence
α = arcsin ( B A y 1 y 2 ) ,   0 α π 2
However, if H is unknown, this approach does not help. Though with known L 1 and L 2 , the system of these two parameters in Equation (9) with unknown ( α , H ) can still be formulated, it is too complex. Thus, for hand camera images with both unknown angle and height but with a template object in the scene, the brutal force search of the inclination angle α in the expected range of values was performed first, and the evaluation of H from (9) was made afterward. The summary of the approaches implemented for the orthorectification of hand and stationary camera images is outlined in Figure 5.

4. Results

4.1. Modeled Ice Beams and Planes: Floe Fragments

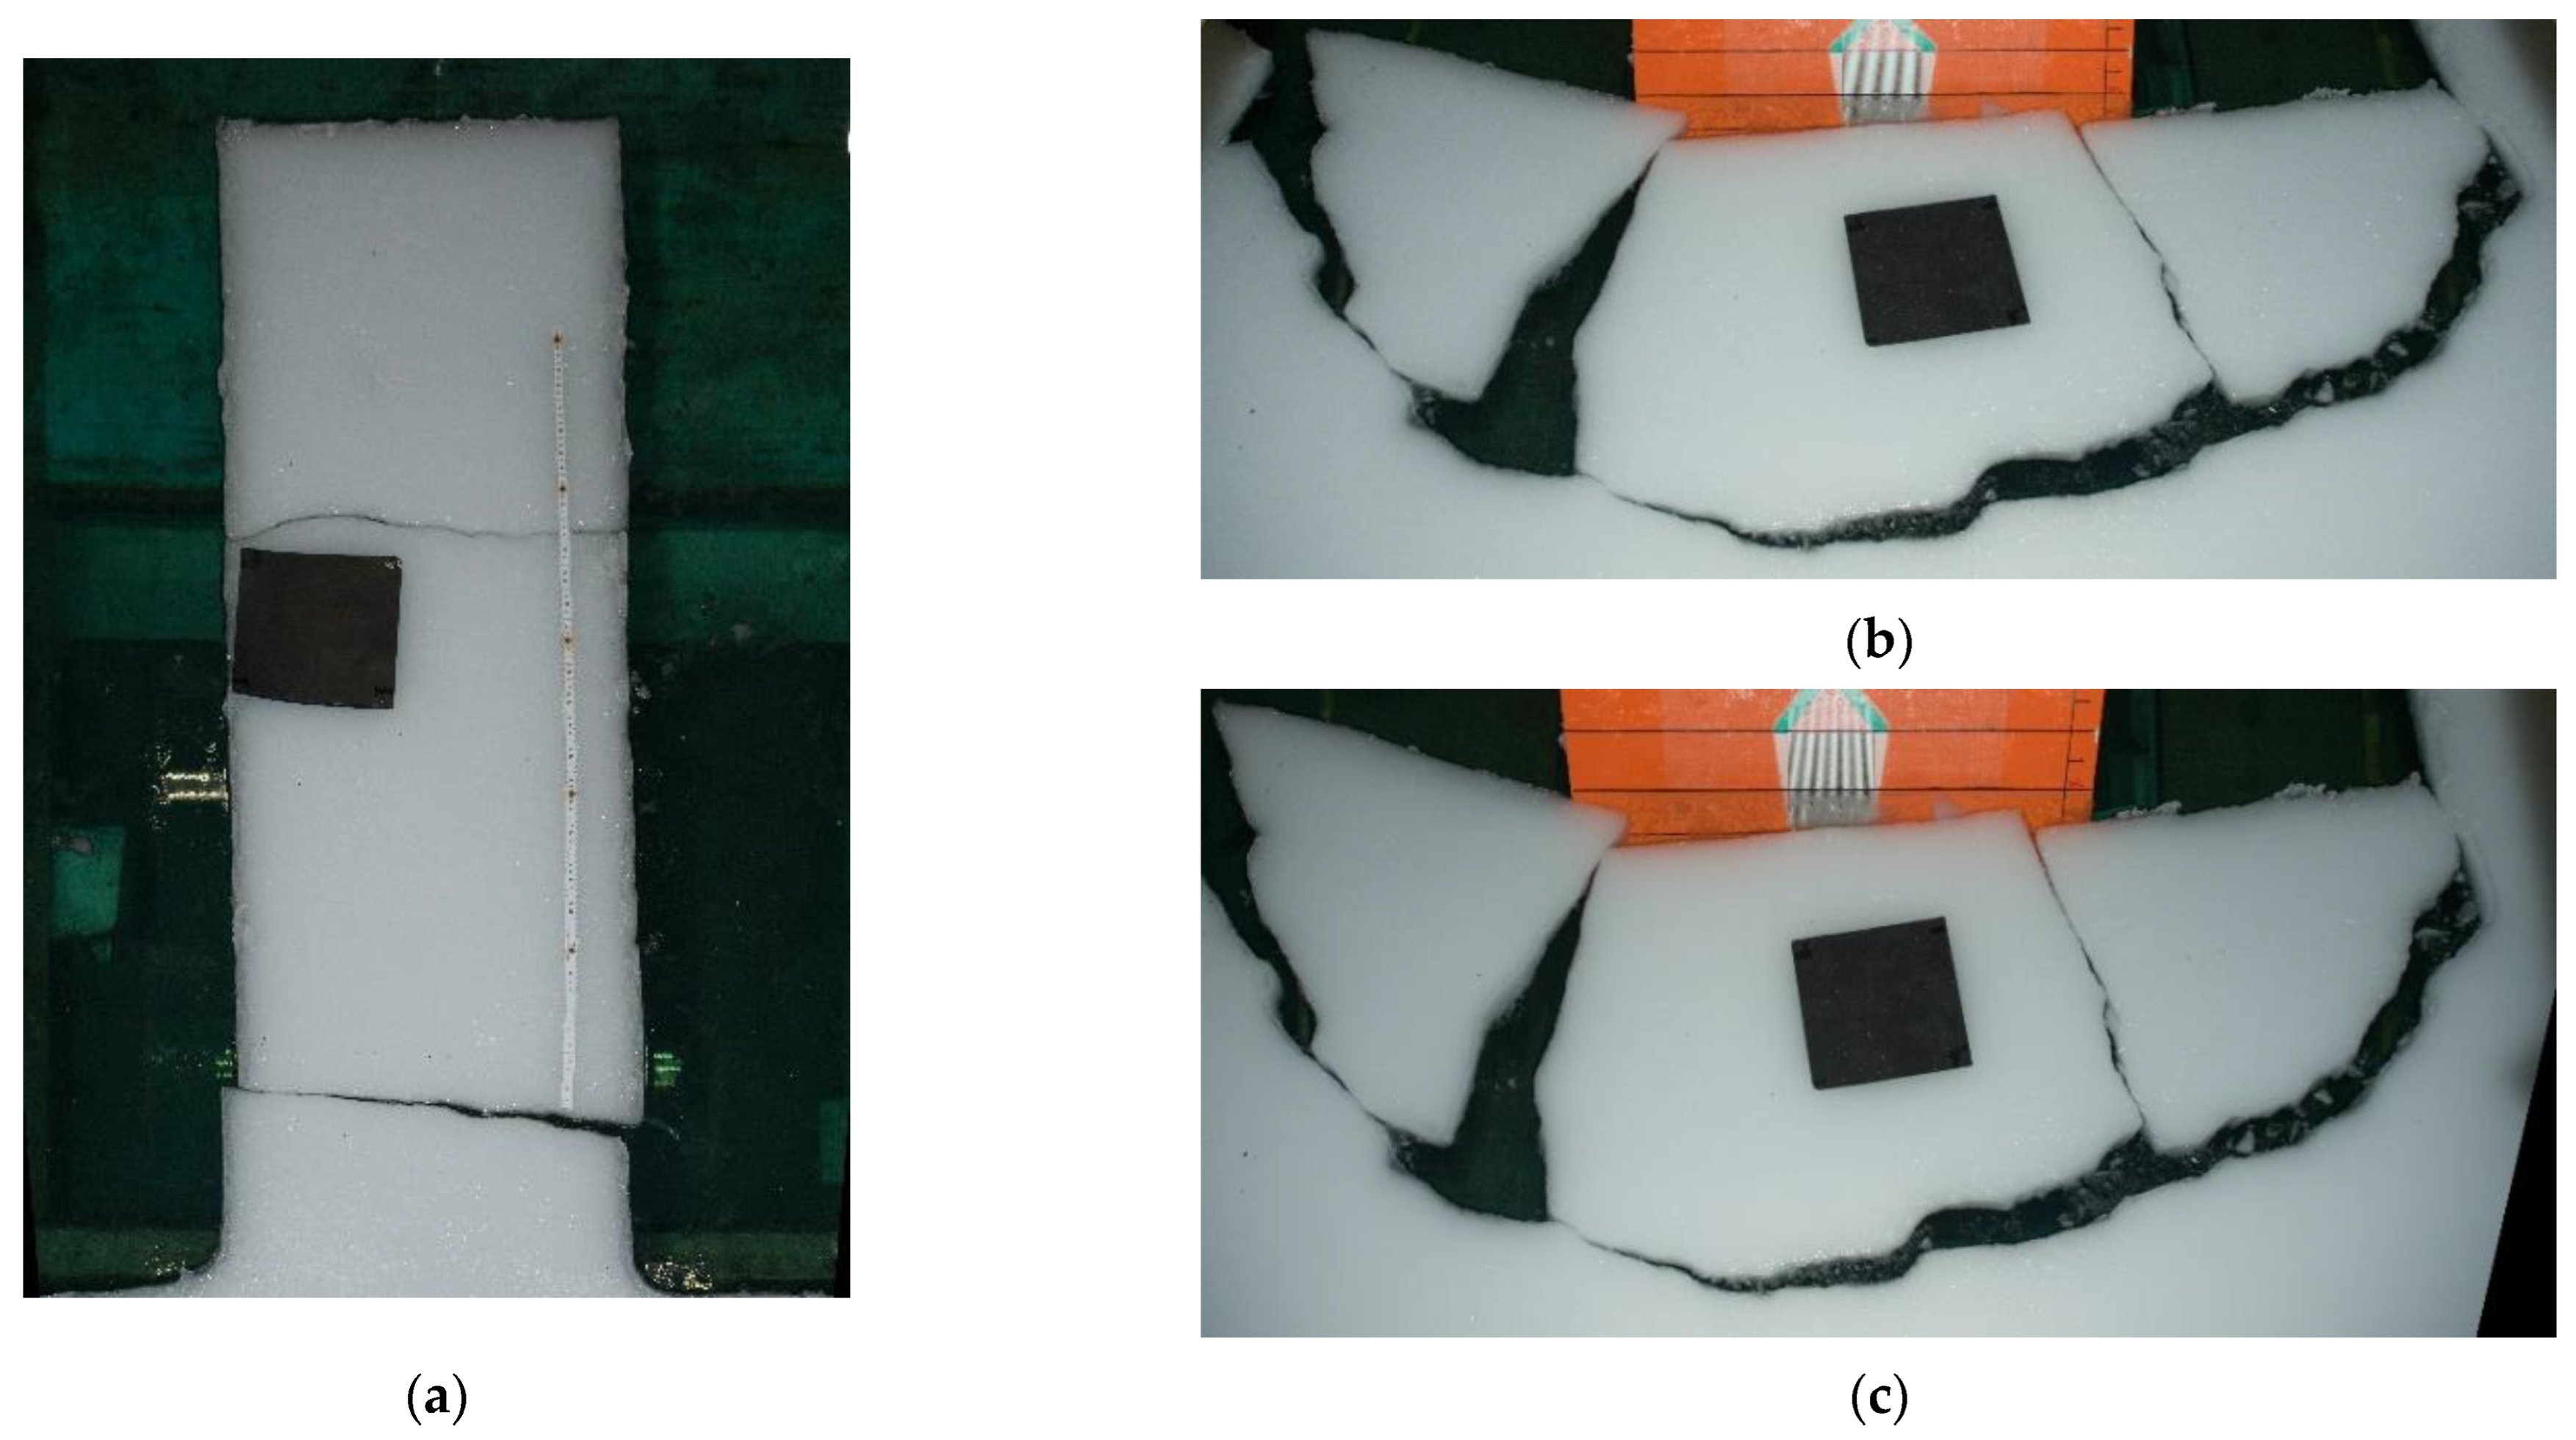
The study of the modeled ice fragments formed shortly after the inclined slope encountered the ice edge was mainly performed with the use of the high-resolution images taken with NIKON D800. For the scale and calibration, a rectangular template with a size of 200 × 200 mm was deposited on the ice surface in each of the photographed scenes except in the Plane 3 experiment. In the broken beam scenes, a ruler was additionally laid along the beam fragments, as it is shown in Figure 6a. As soon as the images were captured with the hand camera, each time the angle α was different. The example of the original unrectified image of the broken plane scene is provided in Figure 6b, while Figure 6c represents the orthorectified image of this scene; Figure 6a presents one of the orthorectified scenes with a broken ice beam.
After orthorectification, manual tracing was used to obtain the contours of the ice pieces. This ground truth approach for ice visual analysis has been in practice since the 1980s [40]. It should be noted that the experiment in the ice tank was carried out with artificial illumination using a variety of light sources, which led to flares. Furthermore, the ice fragments, due to being soaked and submerged in water, changed their color to a darker one, which hindered the accurate recognition of the boundaries of a floating ice object. For the case of “ice on ice” (rafted ice or an ice rubble pile), the positions of some contours could only be guessed, leaving much uncertainty in the resulting dimensions. In addition, the ice surfaces not parallel to the orthorectification plane were misshaped: an example of this contortion can be seen in Figure 6c for the ice thickness visible at the utmost left ice fragment.
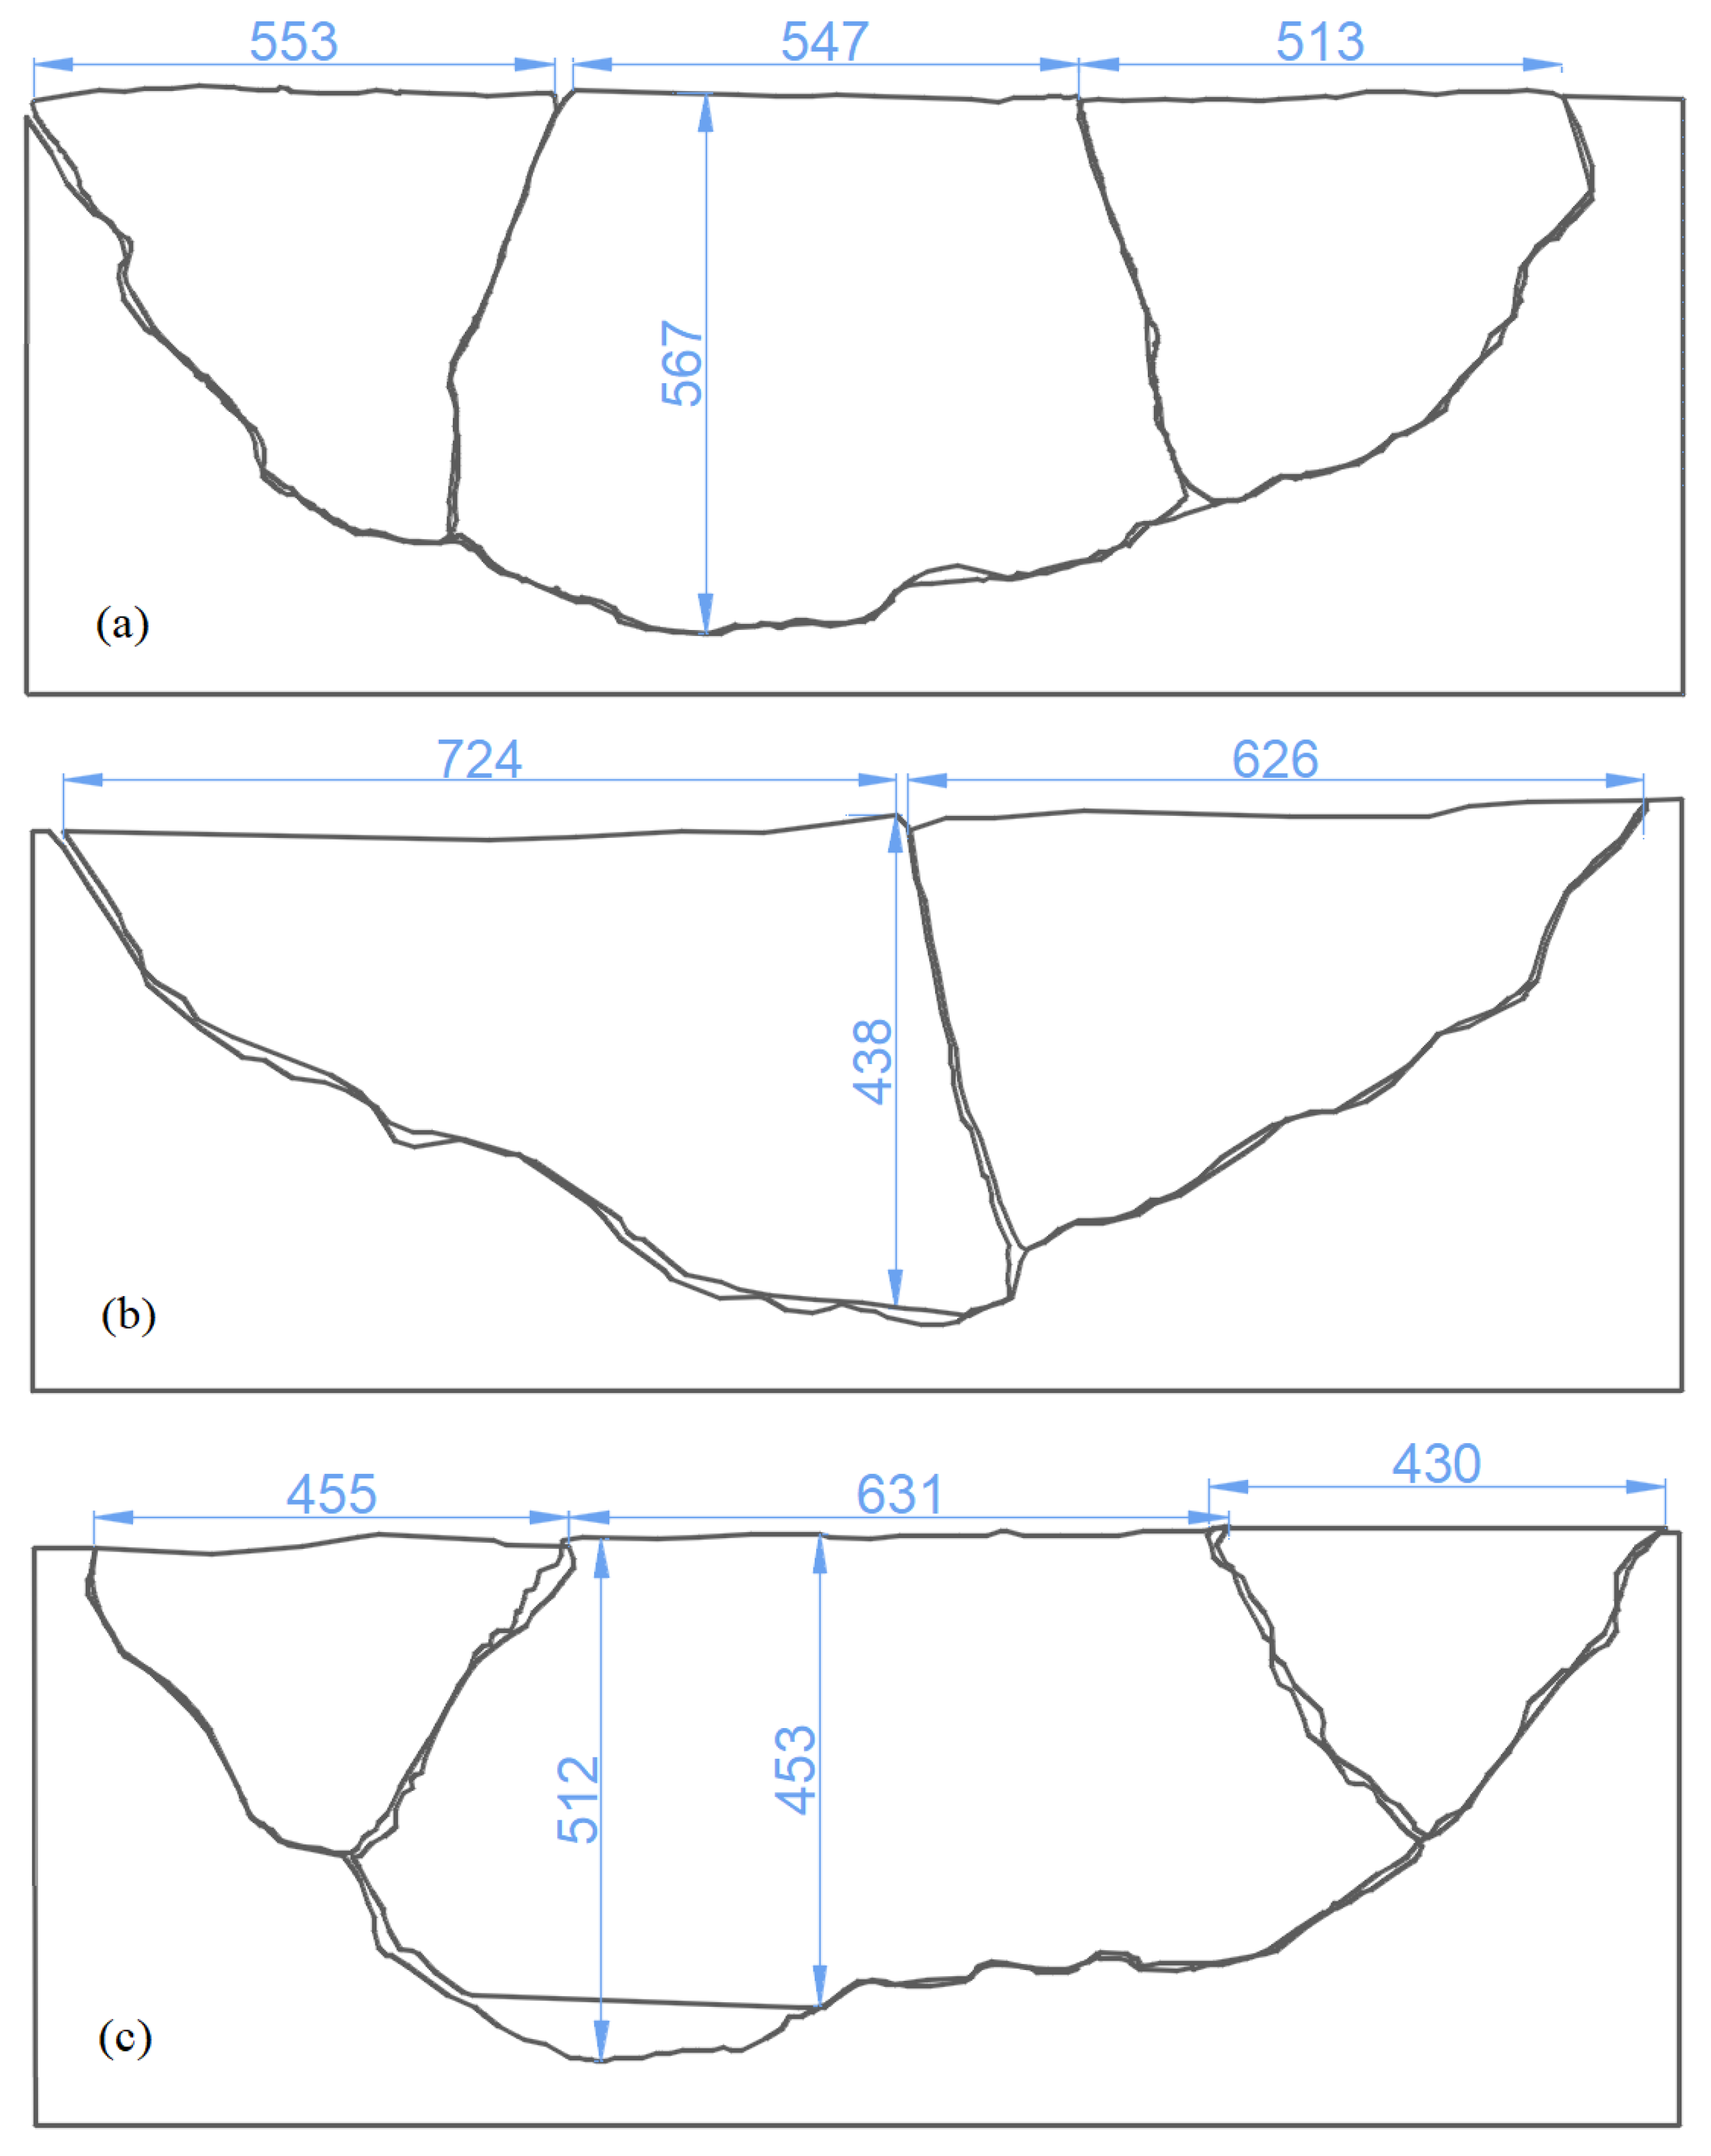
In Figure 7, the drawings of the broken ice beams’ free ends are provided as a result of the orthorectification and contouring of the original images. The largest and smallest longitudinal dimensions, as well as the widths, were restored from the images and are provided in the figure in mm. The reconstruction of ice plane failure in the episodes of a sloping structure encounter was carried out using NIKON D800 pictures of the floating fragments (Planes 1 and 2) and using GoPro video frames (Plane 3). All the images required orthorectification, after which the dimensions of the fragments were evaluated, and their mosaic was put together, thus reconstructing the cracks in a broken plane.
In Figure 8a–c, the orthorectified and reconstructed mosaics of broken Plane 1, Plane 2, and Plane 3 are provided, respectively.
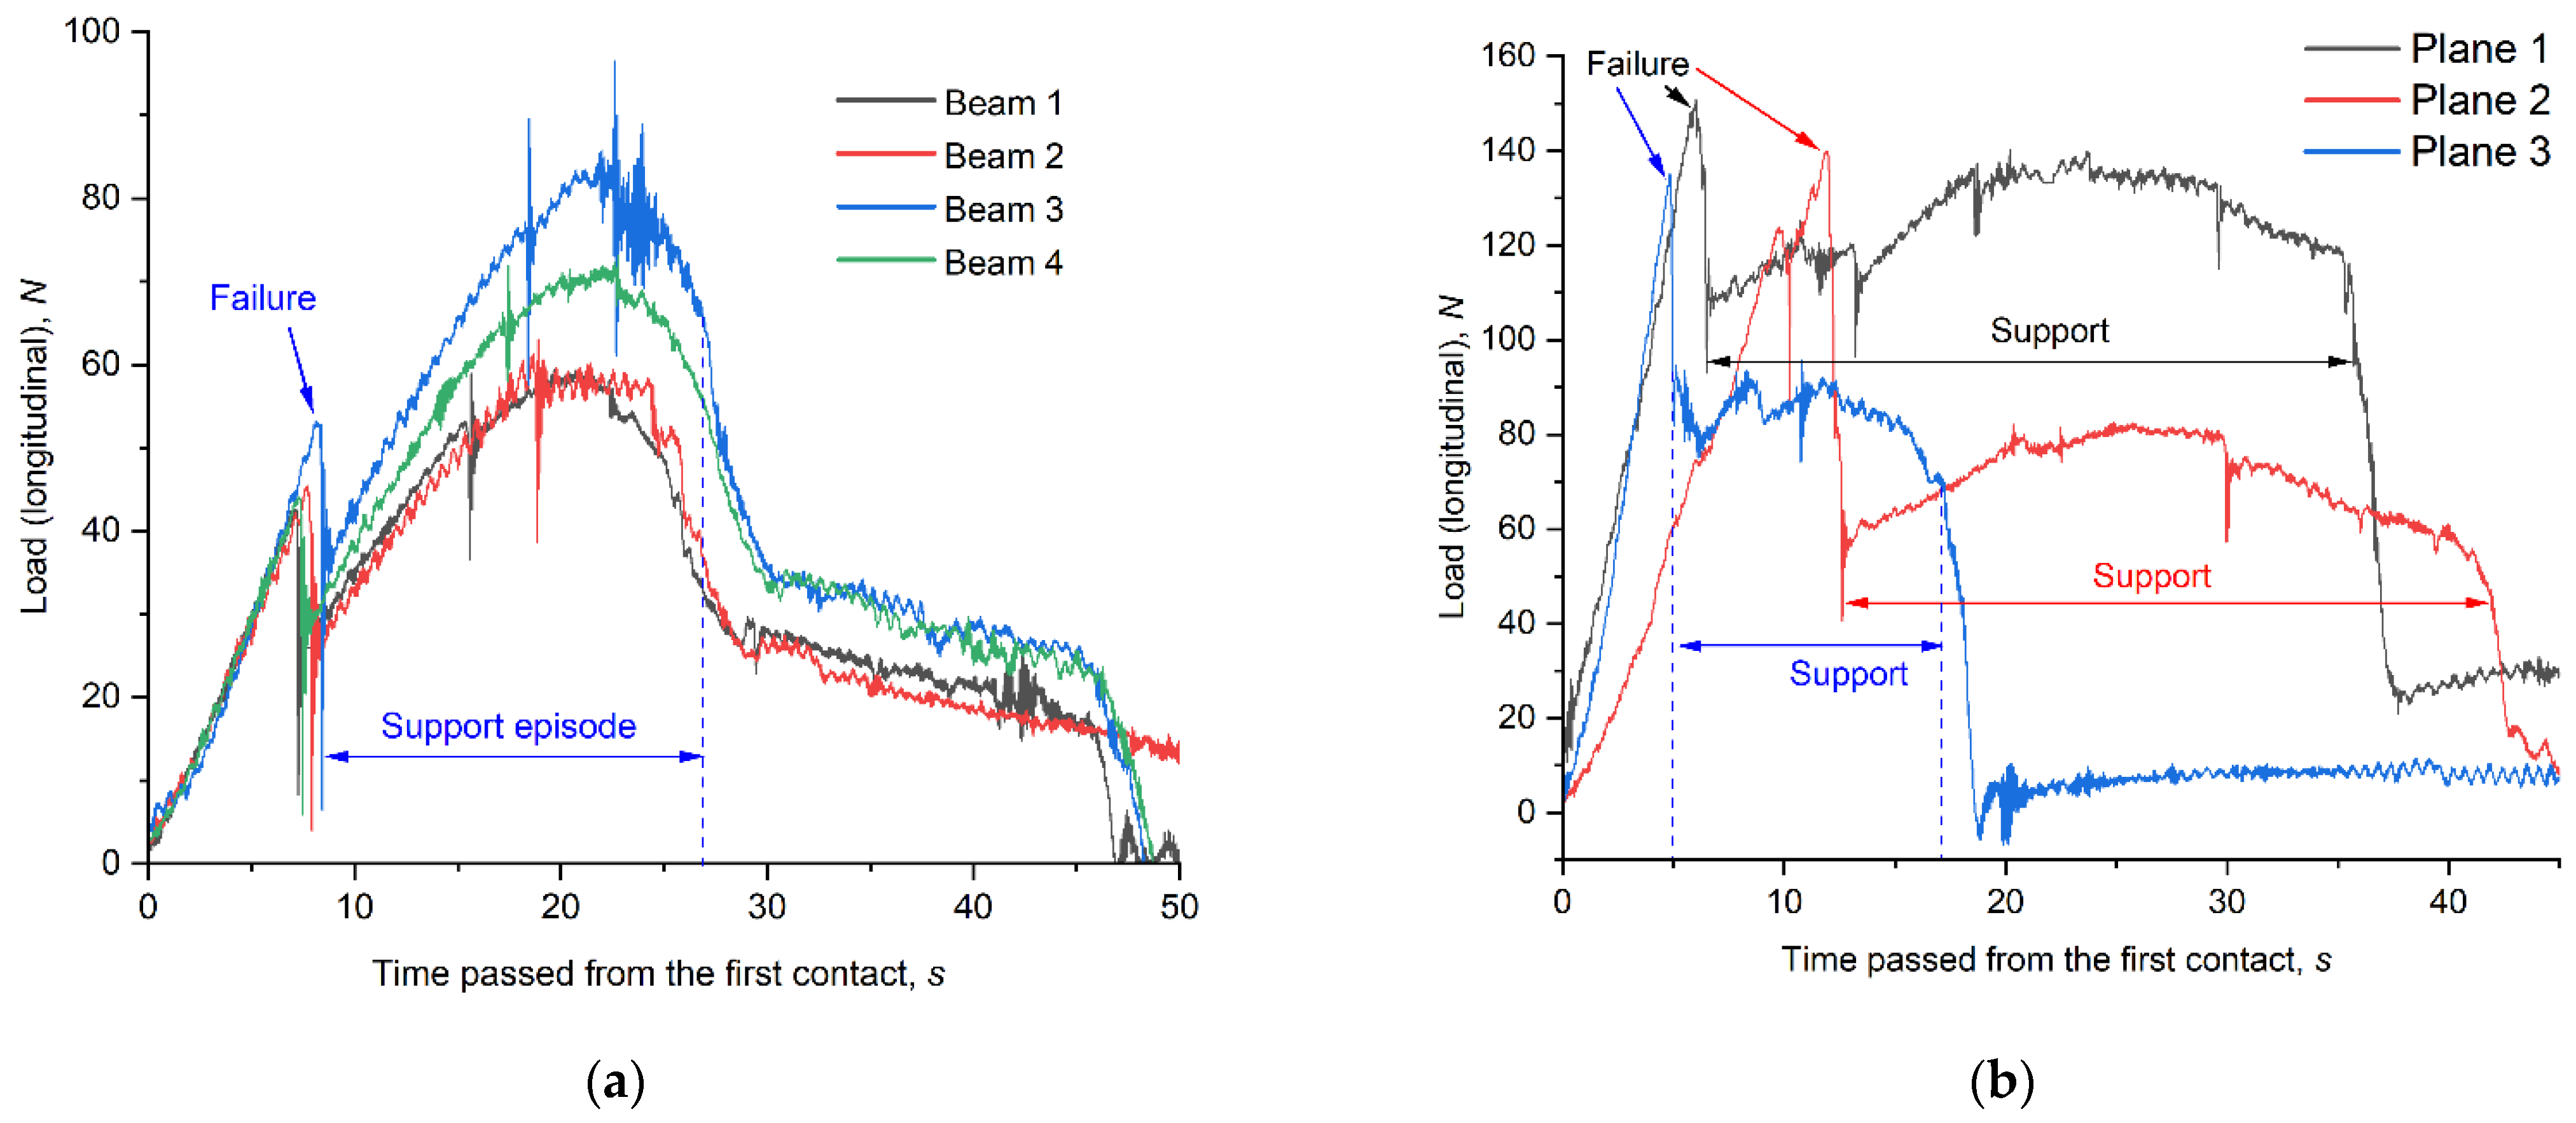
A better understanding of a failure process can be achieved from the force measurements performed using a dynamometer mounted at the place of the connection of a sloping model with a towing trolley. In Figure 9, the curves of the force longitudinal component are provided, illustrating the interaction processes in the considered experiments. The first phase of the contact occurred before the ice fracture was characterized by a rapid, linear-like rise of the load. In the experiments with the beams, this phase was very similar (Figure 9a), while in the experiments with the planes, it is more variable. In Figure 9b, with black and red curves, the loads caused by the ice planes at the interaction velocity of 2.5 mm/s are provided, while the load at the velocity of 5 mm/s is given with a blue curve. Note that in terms of the load vs. horizontal displacement, the 5 mm/s experiments showed similarity with the 2.5 mm/s experiments, though the values were measured in Floe 2, not in Floe 1.
After the main crack appeared, a “support” episode took place in every experiment with a plane or a beam: The fragment contacting with the slope of the structure was supported by it from one side and compressed by the remaining beam/plane from the other side; thus, it did not slip down to the water but bridged the unbroken ice edge and the structure. The structure continued to move, and the contact of the fragment with the unbroken ice floe worked as a joint. This lasted until this “joint” broke, and the broken fragment fully (for a beam) or partially (for a plane) slipped into the water. In the beam experiments, complex “joints” consisting of a sequence of fragments were observed.

4.2. Modeled Ice Plane: Ice Rubble

The third experiment imitating a semi-infinite ice plane failure against the sloped structure (Plane 3) was continued beyond the first failure of the ice sheet and the “support” stage. In total, 5 min of the interaction was performed; the sloping structure passed 1.5 m through the ice sheet, breaking out new fragments from it and grinding the previously broken ones. During the interaction, the released fragments accumulated in front of the sloping structure as a pile, deposited on the ice surface aside on the channel, submerged into water, and remained under the ice sheet or floated up behind the model. Three options were used for retrieving the morphometry of the ice fragments in this experiment: the orthorectification of the fragments distributed on the slope of the structure, the orthorectification of the fragments slipped on the surrounding horizontal ice sheet, and the after-test nadir imaging of the ice left around the polynya. All these three options are based on knowing the parameters H and α required for the photogrammetric interpretation of the scene.
In the considered experiment, after the loading episode, when the first broken ice fragments worked as spacers, the model ran through polynya almost freely for quite a long period. This resulted in very small loads from the 19th second (Figure 9b, a blue curve). Thereafter, the model continued its motion and broke out into 25–40 cm wide pieces. The orthorectified snapshot with such blocks is presented in Figure 10a. A few of the initially broken blocks survived in the following rubble pile evolution: In particular, only Block # 1 was located in the after-test view of the polynya (Figure 10c). Most such blocks could only be observed shortly in some moments during the test, as they rapidly ground into smaller pieces and ice brush. This way, the only option to obtain photogrammetric information on the broken ice fragments was to study the orthorectified surface of the pile in front of the sloping structure. In the experiment with the ice plane, the slope of the rubble pile approximately followed the slope of the structure.
Another way of obtaining morphometric information is to monitor the ice fragments ejected to the adjacent ice sheet. The uniform ice thickness of the ice floe in the experiment allowed for a confident elevation of the surfaces of the rafted fragments. An example of the orthorectified scene of the broken ice falling onto the adjacent ice sheet is provided in Figure 10b.
Figure 10c presents the nadir image of the resulting polynya with the ice fragments, most of which were ground. This image was captured after moving the model structure back. The ice fragments, which were located both in the nadir image and in the orthorectified video frames of the evolving rubble pile, are contoured with blue color. The comparison of the estimations of maximum linear sizes and the areas evaluated from the nadir image and the orthorectified frame is given in Table 2. One can see that the relative estimation errors for the areas fell into intervals of 2–10%, while for the linear dimension, these errors were 0–5%. Note that the estimations included errors in positioning the object’s contour, which is a non-trivial task for white ice blocks on a white background or tightly contacting blocks.
Some of the smaller ice rubble pieces that were formed in the process of the secondary failure of the ice fragments are contoured with yellow. The reference statistics on the contoured pieces are as follows: the mean area was 102.8 cm2, with an area range of 35.1–201.9 cm2; the mean maximum linear size was 14.3 cm, with a respective range of 8.2–21.4 cm. The smaller pieces were visible on the water, but their sizes were comparable with the ice thickness; thus, it was unclear whether their topside was a part of the ice sheet surface or not. The provided data give an idea of what the milled, modeled ice fragments in this kind of experiment can be.

5. Discussion

Visual observations of ice blocks are already practiced in model-scale experiments conducted in ice tanks [41,42,43,44] but rarely in the form of systematic photogrammetry. Regular ice tank tests are, as a rule, photo- and video-documented, but these materials are used for illustration and not intended for reconstructing the imaged scenes. Such pictures are taken from variable heights and arbitrary inclination angles, while the parameters of cameras and calibration images are not provided in the reports. This makes vast amounts of the visual material inappropriate for further morphometric analysis of broken ice formation and evolution.
Ice-resistant marine structural model tests are very promising for regular photogrammetric investigations. In the case of a marine structure with simple walls, it is easier to capture broken ice shapes through video recording and evaluate the parameters necessary for image orthorectification. Photogrammetry should become an affordable way of studying the ice-breaking processes caused by models of offshore structures. The results of photogrammetry can provide new information for the validation and development of mechanical models of ice failure. Coupled with the detailed data it provides on the loads caused by the structure in every episode of the ice–structure interaction, photogrammetric analysis can be especially powerful.
In the experiments considered in this paper, equal ice thickness and the similarity of the mechanical properties of Floes 1 and 2 ensured similar results regarding the morphometric characteristics of the ice fragments as well as the global longitudinal ice load.
The channel made in ice was about 10–15% wider than the model, while the sum width of the fragments broken out of the intact floe simulating the semi-infinite plane was more than two times larger than the model width. One can compare the fragments in Figure 8 with the blocks broken out when the model came in contact with a shaped edge and made the channel in the ice sheet presented in Figure 10a. In their original dimension, such blocks survived if they were ejected aside on the rubble pile. The grinding process significantly decreased the dimensions of the ice rubble. For a more confident location of the broken ice edges and the automation of such a procedure, further development of preprocessing and recognition methods are strongly required with a focus on the images of rafted ice, ice pieces having soaked edges, and floating ice debris.
For automatic data acquisition in a dynamic and long-term experiment such as the one described in Section 4.2, the most common problems to be solved are:
-
Dynamically moving ice blocks are very often in the plane with unknown angles to the matrix of a camera. Hence, the correct orthorectification and dimension acquisition become impossible.
-
In a chaotic pile, it can be very difficult to locate the edges of the blocks. Even manual tracing with a thorough investigation of a zoomed image can be uncertain. There is a lack of algorithmic solutions for contour tracing that could be applicable to the case of an ice rubble pile. This is mostly due to the background color of the mashed ice.
A synchronous observation of the scene from several angles and further development of algorithms may help to partially solve these problems in the future.

6. Conclusions

The photogrammetry of a sloping structure in ice tank experiments can be organized with simple instruments such as a hand camera with a large focal length and/or action cameras. For the orthorectified results, either the focal length, height, and inclination angle should be known, or the in-scene reference object and the camera calibration procedure are required. In the case in which a reference distance is available in the image, an unknown parameter can be evaluated with the use of a line segment distance equation. However, this perfectly works for only one unknown parameter, so if a combination of parameters is unknown, then a brutal force search coupled with an analysis of the calibration images is recommended.
The ice tank experiments imitating the contact of a semi-infinite ice sheet with the inclined wall of the structure resulted in a similar fracturing scheme of the main elliptical circumferential crack. This crack had a semi-major axis of about the length of the model and a semi-minor axis of about 60–70% of the length of the model. The experiments with the ice beam failure resulted in a transversal crack located in the vicinity of 40% of the length of the beam.
In all of the performed experiments with the artificially made smooth edge of the modeled ice sheet, a “support” stage was observed when a fractured fragment worked as a spacer transferring the contact force to the unbroken part of the ice sheet. The photogrammetric analysis revealed that the modeled ice fragments obtained after the first episode of the ice sheet failure perfectly fit the edges of each other and the resulting polynya. This way, the occurrence of a crushing failure was not significant in this stage. However, in the further evolution of the rubble pile, the crushing failure occurred, producing slush and ice debris.
Due to the constant thickness of the ice floe, good results were obtained in the photogrammetry of the ice fragments lying on the slope of the structure or the slope of the rubble pile and for the ice fragments ejected to the surface of the surrounding ice sheet. The obtained morphometric information on broken ice floes can be used for improving the mechanical models of ice fracture and failure against inclined structures.

Author Contributions

Conceptualization, P.Z.; methodology, P.Z.; software, P.Z., I.P. and T.Z.; validation, P.Z., I.P. and T.Z.; formal analysis, P.Z., I.P. and T.Z.; investigation, P.Z. and I.P.; resources, P.Z. and T.Z.; data curation, P.Z., I.P. and T.Z.; writing—original draft preparation, P.Z. and I.P.; writing—review and editing, P.Z.; visualization, P.Z., T.Z. and I.P.; supervision, P.Z.; project administration, P.Z.; funding acquisition, P.Z. All authors have read and agreed to the published version of the manuscript.

Funding

This research was funded by the Ministry of Science and Higher Education of the Russian Federation grant number 0784-2020-0021.

Institutional Review Board Statement

Not applicable.

Informed Consent Statement

Not applicable.

Acknowledgments

This work was carried out as a part of project 0784-2020-0021 supported by the Ministry of Science and Higher Education of the Russian Federation.

Conflicts of Interest

The authors declare no conflict of interest.

References

  1. Weissling, B.; Ackley, S.; Wagner, P.; Xie, H. EISCAM—Digital image acquisition and processing for sea ice parameters from ships. Cold Reg. Sci. Technol. 2009, 57, 49–60. [Google Scholar] [CrossRef]
  2. Lu, P.; Li, Z.J.; Zhang, Z.H.; Dong, X.L. Aerial observations of floe size distribution in the marginal ice zone of summer Prydz Bay. J. Geophys. Res. Oceans 2008, 113, C2. [Google Scholar] [CrossRef]
  3. Steer, A.; Worby, A.; Heil, P. Observed changes in sea-ice floe size distribution during early summer in the western Weddell Sea. Deep Sea Res. Part II Top. Stud. Oceanogr. 2008, 55, 933–942. [Google Scholar] [CrossRef]
  4. Toyota, T.; Haas, C.; Tamura, T. Size distribution and shape properties of relatively small sea-ice floes in the Antarctic marginal ice zone in late winter. Deep Sea Res. Part. II Top. Stud. Oceanogr. 2011, 58, 1182–1193. [Google Scholar] [CrossRef] [Green Version]
  5. Perovich, D.K.; Jones, K.F. The seasonal evolution of sea ice floe size distribution. J. Geophys. Res. Oceans 2014, 119, 8767–8777. [Google Scholar] [CrossRef] [Green Version]
  6. Shimoda, H.; Endoh, T.; Muramoto, K.; Ono, N.; Takizawa, T.; Ushio, S.; Kawamura, T.; Ohshima, K.I. Observations of sea-ice conditions in the Antarctic coastal region using ship-board video cameras. Antarct. Rec. 1997, 41, 355–365. [Google Scholar]
  7. Niioka, T.; Cho, K. Sea ice thickness measurement from an ice breaker using a stereo imaging system consisted of a pairs of high definition video cameras. In International Archives of the Photogrammetry, Remote Sensing and Spatial Information Sciences—ISPRS Archives; International Society for Photogrammetry and Remote Sensing: Hannover, Germany, 2010; Volume 38, pp. 1053–1056. [Google Scholar]
  8. Kulovesi, J.; Lehtiranta, J. Level Ice Thickness Measurement Using Ship-Based Semi-Automatic Computer Vision. In Proceedings of the 22nd IAHR International Symposium on Ice, Singapore, 11–15 August 2014; pp. 679–686. [Google Scholar]
  9. Zambon, A.; Moro, L.; Brown, J.; Kennedy, A.; Oldford, D. A Measurement System to Monitor Propulsion Performance and Ice-Induced Shaftline Dynamic Response of Icebreakers. J. Mar. Sci. Eng. 2022, 10, 522. [Google Scholar] [CrossRef]
  10. Toyota, T.; Takatsuji, S.; Nakayama, M. Characteristics of sea ice floe size distribution in the seasonal ice zone. Geophys. Res. Lett. 2006, 33. [Google Scholar] [CrossRef] [Green Version]
  11. Alberello, A.; Onorato, M.; Bennetts, L.; Vichi, M.; Eayrs, C.; Machutchon, K.; Toffoli, A. Brief communication: Pancake ice floe size distribution during the winter expansion of the Antarctic marginal ice zone. Cryosphere 2019, 13, 41–48. [Google Scholar] [CrossRef] [Green Version]
  12. Roach, L.A.; Smith, M.M.; Dean, S.M. Quantifying Growth of Pancake Sea Ice Floes Using Images From Drifting Buoys. J. Geophys. Res. Oceans 2018, 123, 2851–2866. [Google Scholar] [CrossRef]
  13. Zhang, Q.; Skjetne, R. Image processing for identification of sea-ice floes and the floe size distributions. IEEE Trans. Geosci. Remote Sens. 2015, 53, 2913–2924. [Google Scholar] [CrossRef]
  14. Zhang, Q.; Skjetne, R.; Metrikin, I.; Løset, S. Image processing for ice floe analyses in broken-ice model testing. Cold Reg. Sci. Technol. 2015, 111, 27–38. [Google Scholar] [CrossRef] [Green Version]
  15. Reimer, N. Model tests on wave induced sea ice breakup. In Proceedings of the Arctic Technology Conference Offshore Technology Conference, Houston, TX, USA, 24–26 October 2016. [Google Scholar] [CrossRef]
  16. Herman, A.; Evers, K.U.; Reimer, N. Floe-size distributions in laboratory ice broken by waves. Cryosphere 2018, 12, 685–699. [Google Scholar] [CrossRef] [Green Version]
  17. Gutiérrez-Romero, J.E.; Ruiz-Capel, S.; Esteve-Pérez, J.; Zamora-Parra, B.; Luna-Abad, J.P. Methodology Based on Photogrammetry for Testing Ship-Block Resistance in Traditional Towing Tanks: Observations and Benchmark Data. J. Mar. Sci. Eng. 2022, 10, 246. [Google Scholar] [CrossRef]
  18. Zvyagin, P.; Voitkunskaia, A.; Maksimov, E. Noise analysis of model ice contours in images. In Proceedings of the 25th POAC Conference, Delft, The Netherlands, 9–13 June 2019. [Google Scholar]
  19. Kjerstad, O.K.; Metrikin, I.; Løset, S.; Skjetne, R. Experimental and phenomenological investigation of dynamic positioning in managed ice. Cold Reg. Sci. Technol. 2015, 111, 67–79. [Google Scholar] [CrossRef]
  20. Zong, Z.; Yang, B.Y.; Sun, Z.; Zhang, G.Y. Experimental study of ship resistance in artificial ice floes. Cold Reg. Sci. Technol. 2020, 176, 103102. [Google Scholar] [CrossRef]
  21. Mintu, S.; Molyneux, D. Experimental study of combined wave and ice loads on a fixed offshore structure. In Proceedings of the 40th OMAE Conference, Virtual, Online, 21–30 June 2021. [Google Scholar] [CrossRef]
  22. van den Berg, M.; Lubbad, R.; Løset, S. Repeatability of ice-tank tests with broken ice. Mar. Struct. 2020, 74, 102827. [Google Scholar] [CrossRef]
  23. Frederking, R.M.W.; Timco, G.W. Quantitative analysis of ice sheet failure against an inclined plane. J. Energy Resour. Technol. 1985, 107, 381–387. [Google Scholar] [CrossRef] [Green Version]
  24. Paavilainen, J.; Tuhkuri, J.; Polojärvi, A. 2D numerical simulations of ice rubble formation process against an inclined structure. Cold Reg. Sci. Technol. 2011, 68, 20–34. [Google Scholar] [CrossRef]
  25. Liang, L.; Shkhinek, K.N. Dynamic interaction between ice and inclined structure. Mag. Civ. Eng. 2014, 45, 71–79. [Google Scholar] [CrossRef]
  26. Lemström, I.; Polojärvi, A.; Tuhkuri, J. Model-scale tests on ice-structure interaction in shallow water, Part I: Global ice loads and the ice loading process. Mar. Struct. 2022, 81, 103106. [Google Scholar] [CrossRef]
  27. Zvyagin, P.; Sazonov, K. Analysis and probabilistic modeling of the unstationary ice loads stochastic process, based on experiments with models of offshore structures. In Proceedings of the 34th OMAE Conference, St. Johns, NL, Canada, 31 May–5 June 2015. [Google Scholar] [CrossRef]
  28. Repetto-Llamazares, A.H.V.; Gudmestad, O.T.; Gürtner, A.; Høyland, K.V. Shoulder ice barrier ice tank testing part II: Estimation of breaking length and block size using image analysis. In Proceedings of the 28th OMAE Conference, Honolulu, HI, USA, 31 May—6 June 2009; pp. 23–31. [Google Scholar] [CrossRef]
  29. Serré, N.; Lu, W.; Høyland, K.; Bonnemaire, B.; Borge, J.; Evers, K.U. Rubble ice transport on Arctic Offshore Structures (RITAS), Part II: 2D scale-model study of the level ice action. In Proceedings of the 22nd POAC Conference, Espoo, Finland, 9–13 June 2013. [Google Scholar]
  30. Timofeev, O.Y.; Sazonov, K.E.; Dobrodeev, A.A. New ice basin of the Krylov State Research Centre. In Proceedings of the 23rd POAC Conference, Trondheim, Norway, 14–18 June 2015. [Google Scholar]
  31. Wilkman, G.; Leiviskä, T. Forty three years of ice model testing in Finland. In Proceedings of the 22nd POAC conference, Espoo, Finland, 9–13 June 2013. [Google Scholar]
  32. von Bock und Polach, R.; Ehlers, S.; Kujala, P. Model-scale ice—Part A: Experiments. Cold Reg. Sci. Technol. 2013, 94, 74–81. [Google Scholar] [CrossRef]
  33. von Bock und Polach, R.U.F.; Ettema, R.; Gralher, S.; Kellner, L.; Stender, M. The non-linear behavior of aqueous model ice in downward flexure. Cold Reg. Sci. Technol. 2019, 165, 102775. [Google Scholar] [CrossRef] [Green Version]
  34. Evers, K.U. Model tests with ships and offshore structures in HSVA’s ice tanks. In Proceedings of the 24th POAC Conference, Busan, Korea, 11–16 June 2017. [Google Scholar]
  35. ITTC. Test Methods for Model Ice Properties; Revision 2, 7.5-0.2-0.4-0.2; ITTC: Tuas, Singapore, 2014; p. 19. [Google Scholar]
  36. Suominen, M.; Haase, A. WP9 JRA2 COMPLEX—Cross disciplinary Observations of Morphodynamics and Protective structures, Linked to Ecology and Extreme Events. D 9.5: Collection of Benchmark data sets. Chapter—Ice Strength Measurements, EC contract no 654110, HYDRALAB. 2018; p. 18. [Google Scholar]
  37. Wang, A.; Qiu, T.; Shao, L. A simple method of radial distortion correction with centre of distortion estimation. J. Math. Imaging Vis. 2009, 35, 165–172. [Google Scholar] [CrossRef]
  38. Fitzgibbon, A.W. Simultaneous Linear Estimation of Multiple View Geometry and Lens Distortion. In Proceedings of the IEEE Computer Society Conference on Computer Vision and Pattern Recognition, Kauai, HI, USA, 8–14 December 2001. [Google Scholar] [CrossRef]
  39. Muramoto, K.; Endoh, T.; Kubo, M.; Matsuura, K. Sea ice concentration and floe size distribution in the Antarctic using video image processing. In Proceedings of the International Geoscience and Remote Sensing Symposium (IGARSS), Singapore, 3–8 August 1997; pp. 414–416. [Google Scholar] [CrossRef]
  40. Rothrock, D.A.; Thorndike, A.S. Measuring the sea ice floe size distribution. J. Geophys. Res. 1984, 89, 6477–6486. [Google Scholar] [CrossRef]
  41. Timco, G.W.; Cornett, A.M. The influence of variable-thickness ice on the loads exerted on sloping structures. Cold Reg. Sci. Technol. 1997, 26, 39–53. [Google Scholar] [CrossRef]
  42. Hopkins, M.A. Onshore ice pile-up: A comparison between experiments and simulations. Cold Reg. Sci. Technol. 1997, 26, 205–214. [Google Scholar] [CrossRef]
  43. Tuhkuri, J.; Lensu, M. Laboratory tests on ridging and rafting of ice sheets. J. Geophys. Res. Oceans 2002, 107, 8-1–8-14. [Google Scholar] [CrossRef]
  44. Dobrodeev, A.A.; Sazonov, K.E. Physical modeling of ice load on extended hydraulic constructions. Sloping constructions with an inclined edge. Arkt. Ekol. I Ekon. 2021, 11, 90–100. [Google Scholar] [CrossRef]
Figure 1. A scheme of the experiments with an inclined model: (a) against a large ice cantilever beam and (b) imitating contact with a semi-infinite plane.
Jmse 10 01590 g001
Figure 2. (a) The overview of an ice model’s cantilever beam prepared for an experiment and (b) variations in the elastic modulus of the ice model throughout the length of Floe 1: black points—measurements, red line—fitted linear tendency, colored rectangles—positions of cantilever beams.
Jmse 10 01590 g002
Figure 3. Tile calibration image before (a) and after (b) distortion correction and image orthorectification from oblique view with α = 27 ° .
Jmse 10 01590 g003
Figure 4. Geometric orthorectification of the image taken from the inclined position: π is the image inclined on angle α to the scene plane δ , while γ is the plane with the orthorectified image.
Jmse 10 01590 g004
Figure 5. The steps taken for orthorectification of the images from hand and stationary cameras.
Jmse 10 01590 g005
Figure 6. The examples of orthorectification: (a) Beam 1, orthorectified from α = 18 ° ; (b) Plane 1, the original image, α = 35 ° ; (c) Plane 1, the orthorectified image.
Jmse 10 01590 g006
Figure 7. End fragments after beam failure: Beams 1–4 (from left to right). Sizes are given in mm, and the separating crack is presented with red color.
Jmse 10 01590 g007
Figure 8. Reconstruction of broken ice mosaic after the first episode of a sloping structure–ice sheet contact obtained in experiments: (a) Plane 1; (b) Plane 2; (c) Plane 3.
Jmse 10 01590 g008
Figure 9. Longitudinal loads recorded: (a) at velocity of 2.5 mm/s in experiments with Beam 1 (black), Beam 2 (red), Beam 3 (blue), and Beam 4 (green); (b) in experiments with ice planes at velocity of 2.5 mm/s, Plane 1 (black), Plane 2 (red), and at velocity of 5 mm/s, Plane 3 (blue).
Jmse 10 01590 g009
Figure 10. “Plane 3” test: (a) broken ice blocks when the structure moved in the channel, showing the orthorectified scene on the slope of the structure in the video frame at 02:16; (b) broken blocks ejected away or slipped down the rubble pile, showing the orthorectified scene on the ice sheet surface in the video frame at 04:28; (c) after-test nadir drone view of the polynya.
Jmse 10 01590 g010
Table 1. Characteristics of ice fields used for the experiments.
Floe NoDateIce Floe Thickness, mmCompressive Strength at Longwise Middle, kPaFlexural Strength at Longwise Middle, kPa
Beginning of the DayEnd of the DayBeginning of the DayEnd of the Day
117 February 202149–5026.033.123.6-
218 August 202148–5018.329.511.230.8
Table 2. Ice fragments characteristics retrieved from a video recording of the rubble pile and from the after-experiment nadir photo.
After-Experiment Nadir PhotoOrthorectified Video FrameRelative Discrepancy
Fragment NoLinear Size, cmArea, cm2Linear Size, cmArea, cm2For Linear Size, %For Area, %
128.0421.129.2411.7−4.32.2
222.0215.822.7195.7−3.29.3
332.3589.832.3554.60.06.0
430.0341.130.2321.4−0.75.8
523.9310.722.7326.25.0−5.0
620.7251.521.7229.6−4.88.7
719.4188.120.3183.3−4.62.6
Publisher’s Note: MDPI stays neutral with regard to jurisdictional claims in published maps and institutional affiliations.