Article

Spatial Variability of Surface Waves and Nearshore Currents Induced by Hurricane Harvey along the Southern Texas Coast

by
Angélica Romero-Arteaga
1,
Amaia Ruiz de Alegría-Arzaburu
1,* and
Bernardo Esquivel-Trava
2
1
Instituto de Investigaciones Oceanológicas, Universidad Autónoma de Baja California, Ensenada 22860, Mexico
2
Departamento de Oceanografía Física, CICESE, Ensenada 22860, Mexico
*
Author to whom correspondence should be addressed.
J. Mar. Sci. Eng. 2022, 10(11), 1722; https://doi.org/10.3390/jmse10111722
Submission received: 29 September 2022 / Revised: 1 November 2022 / Accepted: 8 November 2022 / Published: 11 November 2022
(This article belongs to the Section Coastal Engineering)

Abstract

:
Extreme weather events such as hurricanes are expected to become more severe with the human-induced increase in average global temperatures, exacerbating the risk of major damage. Efforts to predict these events typically require detailed hydrodynamic data that are difficult to collect in the field. Here, nearshore data collected with three ADCP moorings were used to describe the hydrodynamics induced by Hurricane Harvey along the southern Texas coast. Wave spectra and nearshore current variations were analyzed along the hurricane’s trajectory and compared to other offshore locations. The results indicate that winds intensified along the coast as Harvey approached the Port Aransas coastline. Southerly wind stresses of ~−0.9 Nm−2 generated ~2 ms−1 depth-averaged flows towards the southwest close to landfall in the north, while flows of ~1 ms−1 and <1 ms−1 were measured in the center and the south of the study site, respectively. The hydrodynamics induced by the hurricane were compared to those induced by an intense synoptic-scale cold front (CF). Both events generated southward-directed alongshore wind stresses of similar magnitudes ( τ y ~−0.4 Nm−2) that caused similar depth-averaged flows (0.5 to 0.7 ms−1) and wave energy conditions (Hs of ~4 m) in the south. Harvey caused extremely energetic conditions close to landfall in the north compared to the CF; depth-averaged flows and Hs of 2 ms−1 and 10 m were induced by Harvey, as opposed to 0.6 ms−1 and 4 m by the CF, respectively. While intense currents (>1 ms−1) and waves (Hs > 4 m) lasted for less than a day during Harvey, these persisted a few days longer during the CF. This study highlights the relevant role of synoptic-scale cold fronts in modulating the nearshore hydrodynamics, which occur more frequently than tropical cyclones in the northwestern Gulf of Mexico.

1. Introduction

Human-caused climate change is altering global hurricane activity. The high ocean heat content in recent years is enhancing natural hurricanes’ occurrence and the risk of damage [1], but periods of hurricane droughts have also existed in the past. For example, the hurricane activity in the 1970s and 1980s was extremely quiet in the Atlantic, and this has been related to a sea-surface temperature depression enhanced by anthropogenic sulfate aerosols that decreased precipitation in the Sahara region and increased dust transport over the Atlantic [2]. In contrast, the 2020 North Atlantic hurricane season was one of the most active on record, related to human activities that caused a sea-surface temperature increase of 0.4–0.9 °C, causing strong surges, heavy rains, and high winds [3].
An atmospheric warming of 2 °C is expected to cause a 5% increase in hurricane wind strength, leading to a 13% increase in the number of category 4–5 storms [4,5]. Tropical cyclones, including hurricanes, bring intense winds that generate strong ocean surface circulation and large surface waves [6], and the wave fields will depend on the hurricane’s path relative to the shelf orientation [7]. For example, in 2005, Hurricane Katrina generated waves of up to 16 m and storm surges of nearly 9 m along the Mississippi coastline [8]. The wave fields generated by hurricanes can have high spatiotemporal variability—particularly at landfall, where winds are influenced by the land surface and surface waves are affected by shallow water processes [9]. In addition, the width and depth of the continental shelf determine the percentage of wave energy dissipation of tropical cyclones due to bottom friction [10].
Record high ocean heat values in the Gulf of Mexico prior to the 2017 summer provided the conditions to sustain and intensify Hurricane Harvey, which caused record-breaking heavy rainfalls [11], decreasing the ocean heat content via evaporative cooling [1]. In August 2017, Harvey landed in Texas as a category 4 hurricane and caused major wind damage in small communities such as Port Aransas and Rockport, along with record rains and devastating floods in large metropolitan areas such as Houston [12]. Storm surge levels are critical components that define the morphological evolution of barrier islands, typically eroding the shoreface and depositing sediment landward as overwash deposits. After Harvey’s landfall, offshore-directed intense winds in the northwest region generated strong seaward-directed flows and sediment transport, and storm surges of up to 2 m were recorded [13].
Most noticeable hurricane-induced changes typically correspond to overwash events and beachface and dune erosion [13,14,15]; as a consequence, the majority of field studies focus on describing post-hurricane impacts in terms of rainfall and morphological changes, e.g., [16,17,18], while fewer studies describe hurricane-induced hydrodynamics. In the northwestern Gulf of Mexico, synoptic-scale cold fronts occur more frequently than tropical cyclones, and these fronts significantly modulate the nearshore hydrodynamics [19,20]. The purpose of this study was to investigate the cross-shore and longshore flows and wave fields generated by Hurricane Harvey before and after landfall and along the southern Texas coast based on field measurements. These results were compared with the hydrodynamics induced by an individual cold front of high-intensity and more frequent occurrence than a tropical storm (see [20] for further details), so as to better understand the differences in the magnitude and directionality of flows and waves between the two extreme events.

2. Materials and Methods

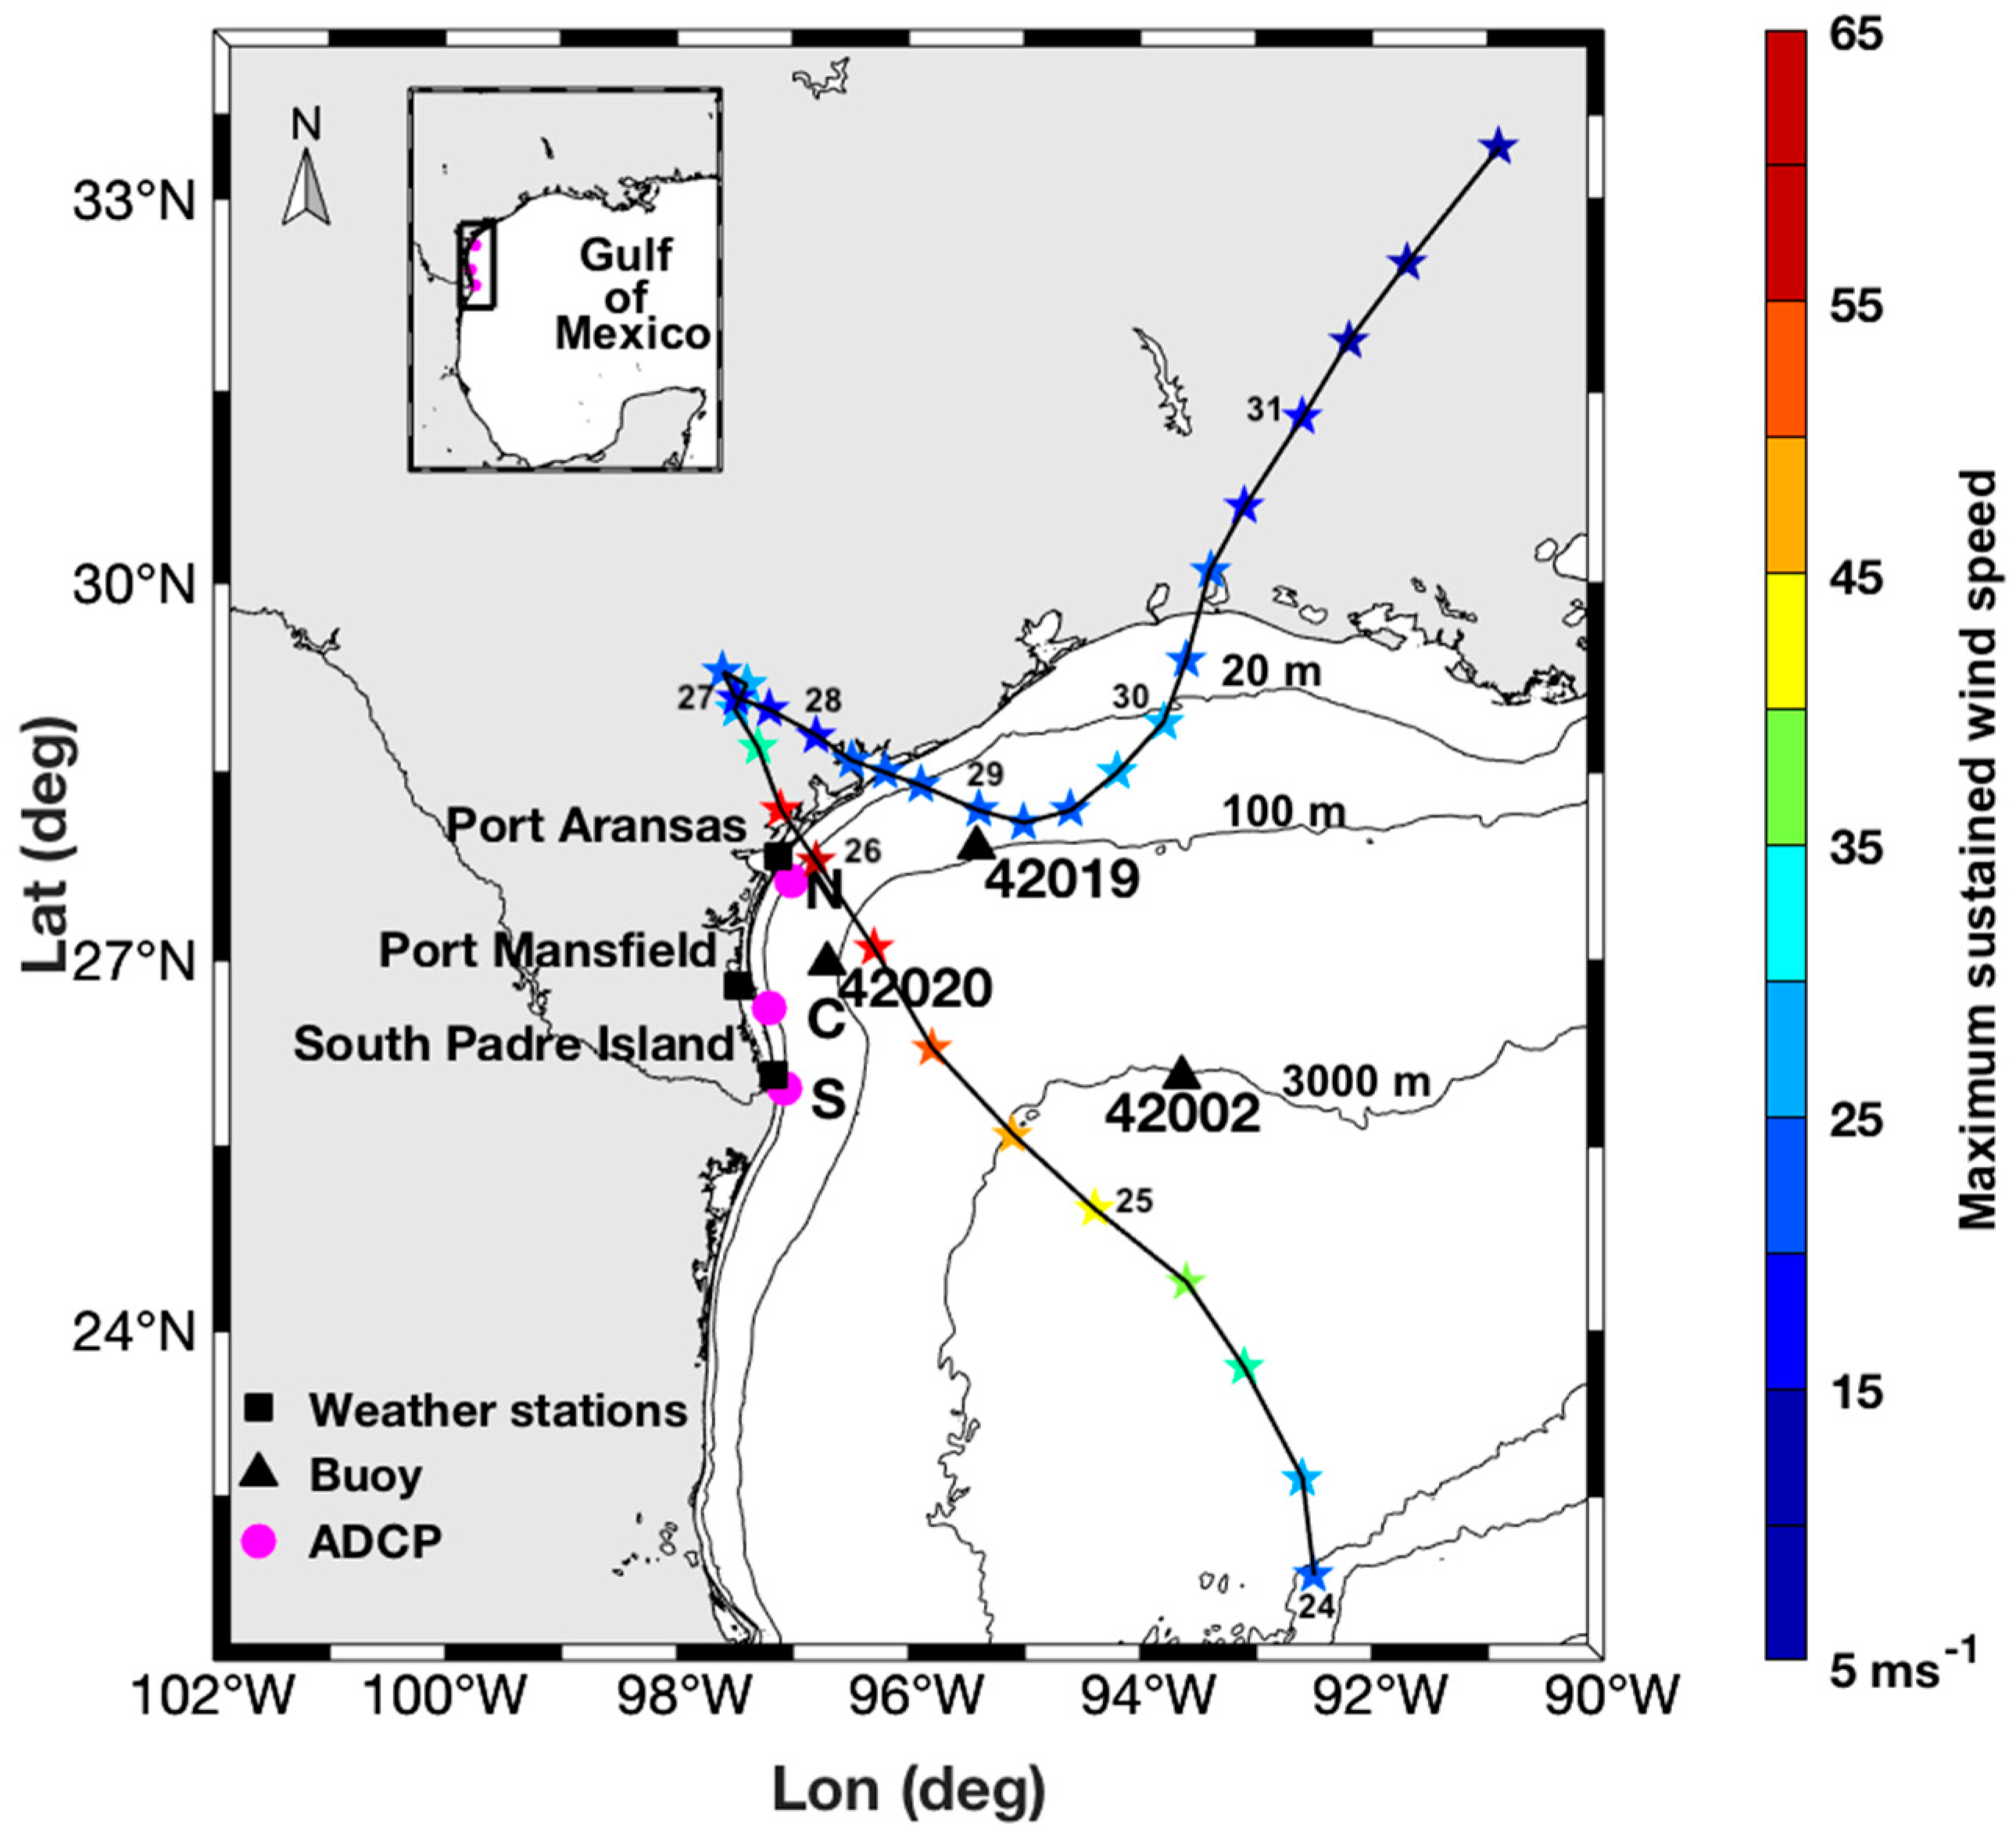
2.1. Field Site and Experimental Setup

The field site was located in the inner Texas–Louisiana shelf, between Port Aransas (northern end) and South Padre Island (southern end), along the southern Texas coast (Figure 1). In this region, the cross-shelf mass exchange between the outer and inner continental shelf is limited due to the presence of large bathymetric gradients that act as a boundary [21]. The wind is the dominant forcing mechanism for the inner-shelf circulation [22,23], and seaward advected river plumes induce baroclinically driven flows that can enhance cross-shelf transport in the summer [21].
Alongshelf wind stresses and currents are highly correlated in the inner shelf [22], but the current directions also depend on the coastline’s orientation relative to the dominant wind forcing. Alongshelf flow directions are expected to vary considerably on the southern Texas coast during the synoptic-scale cold front season from October to April [24]. Upcoast mass transport dominates for most of the year, but cold fronts can reverse surface currents towards Mexico [21]. Recent findings indicate that cold fronts induce strong northerly winds that generate downcoast alongshore flows during the winter, while moderate southeasterly winds generate dominant upcoast flows from spring to fall [20]. Generally, surface downcoast flows dominate in the Port Aransas area (northern study site) during the passage of cold fronts, but upcoast currents prevail along the South Padre area (southern study site), and a convergence zone can be identified between the two sites around Mustang Island [23,25].
Three ADCP (acoustic Doppler current profiler) moorings were placed at approximate depths of 20 m off Port Aransas in the north (N), Mustang Island in the center (C), and South Padre Island in the south (S) (magenta dots in Figure 1). The closest wind conditions to each mooring were obtained from weather stations (WSs; black squares in Figure 1), and deep-water wave data were additionally obtained from three offshore buoys (triangles in Figure 1). Hurricane Harvey attained Category 4 and presented maximum sustained wind speeds of 65 ms−1 a few hours before hitting the Port Aransas coast on the 26 August 2017.

2.2. Meteorological Data

Hourly wind data were obtained from three NOAA (www.ndbc.noaa.gov; accessed on 23 February 2021) weather stations (WSs) closest to the north, center, and south ADCP locations for the period influenced by Hurricane Harvey—24th to 31st of August 2017 (Figure 1). Wind speeds were averaged hourly over a 2-min period (WSPD), and the average of 8 s of the maxima were reported as gusts. Wind data were converted to oceanographic convention (i.e., the direction toward which the wind blows). Synoptic wind and mean sea-level pressure (MSLP) data were additionally obtained hourly from the Era-5 global reanalysis product by the European Centre for Medium-Range Weather Forecasting (ECMWF) over a grid of 0.25° resolution. The closest Era-5 nodes to the weather stations were used when weather station data were absent.
Surface wind stresses were calculated from the Era-5 zonal and meridional wind velocity components ( u w ,   v w ) using a quadratic friction law (Equation (1)):
( τ x , τ y ) = ρ a C d | W | ( u w , v w )
where τ x   and τ y are the zonal and meridional wind-stress components (Nm2), respectively, W is the wind speed (ms1), ρ a is the air density (1.2 kg m3), and Cd is the empirical wind drag coefficient, defined as C d = ( 0.55 + 2.97 W ˜ 1.49 W ˜ 2 )   10 3 , where W ˜ = W 10 W r e f , with W r e f being the refence wind; W r e f = 31.5 ms1 for the CD maxima [26]. Positive τ x   and τ y indicate eastward- and northward-directed winds, respectively.
The vertical component of the wind-stress curl × τ (Nm3) was calculated during the passage of Hurricane Harvey (Equation (2)) to determine the rotation that the vertical column of air experienced in the varying wind field:
× τ = 1 R c o s θ [ τ y λ θ ( τ x c o s θ ) ]
where θ is the latitude, λ is the longitude, and R is the Earth’s radius [27].

2.3. Current Measurements and Analysis

Simultaneous current velocities were measured with bottom-mounted ADCPs (1 MHz Aquadopp) to determine the spatiotemporal variations in nearshore currents throughout the water column (see the locations in Figure 1). Three moorings were installed at 17–22 m depths at sites covering ~200 km of the southern Texas coast, off Port Aransas Pass in the north (Boatmens Reef), off Port Mansfield in the center (Wreck Reef), and off South Padre Island in the south (Port Isabel Reef). Current profiles were recorded for a week from the 24th to the 31st of August 2017, measured at 1 Hz and averaged over 120 s at 20 min intervals.
Current measurements with instrument tilting angles greater than 20° were disregarded, and unreliable data were removed by applying quality control thresholds (<20 counts of return amplitudes). The uppermost 10% of the water column (~2 m depth) was discarded due to sidelobe interference with the water surface (<0.60 correlation between the alongshelf current and wind speed). Flow measurements were collected across 26 vertical bins of 0.75–1 m resolution, with a blanking distance of 0.4 m from the seabed. Therefore, the average velocities for the surface and bottom layers excluded the uppermost 1.85 m and lowermost 0.4 m of the water column, respectively. Velocities were measured in east-north-up (ENU), and a right-handed coordinate system was considered, with positive x (u) and y (v) indicating the offcoast and upcoast directions, respectively.

2.4. Wave and Water-Level Measurements and Analysis

Time series of pressure and orbital velocities measured by the ADCPs were used to determine the non-directional and directional wave characteristics through the PUV method [28], based on the assumption that the waves approached from a primary direction at each frequency band. A Fourier transform was then applied to separate signals per frequency band and determine each direction separately. The directional spectrum was finally calculated using the parametric function proposed by Donelan et al. [29].
Water-level variations were calculated from the time series of ADCP pressure data and referred to the local mean low water-level using time series of local tide-gauge data closest to the ADCP moorings (see [13]). The specific NOAA tidal gauge stations were Aransas Pass 8775241 in the north, Port Mansfield Channel 8778485 in the center, and Brazos Santiago 8779749 in the south.

3. Results

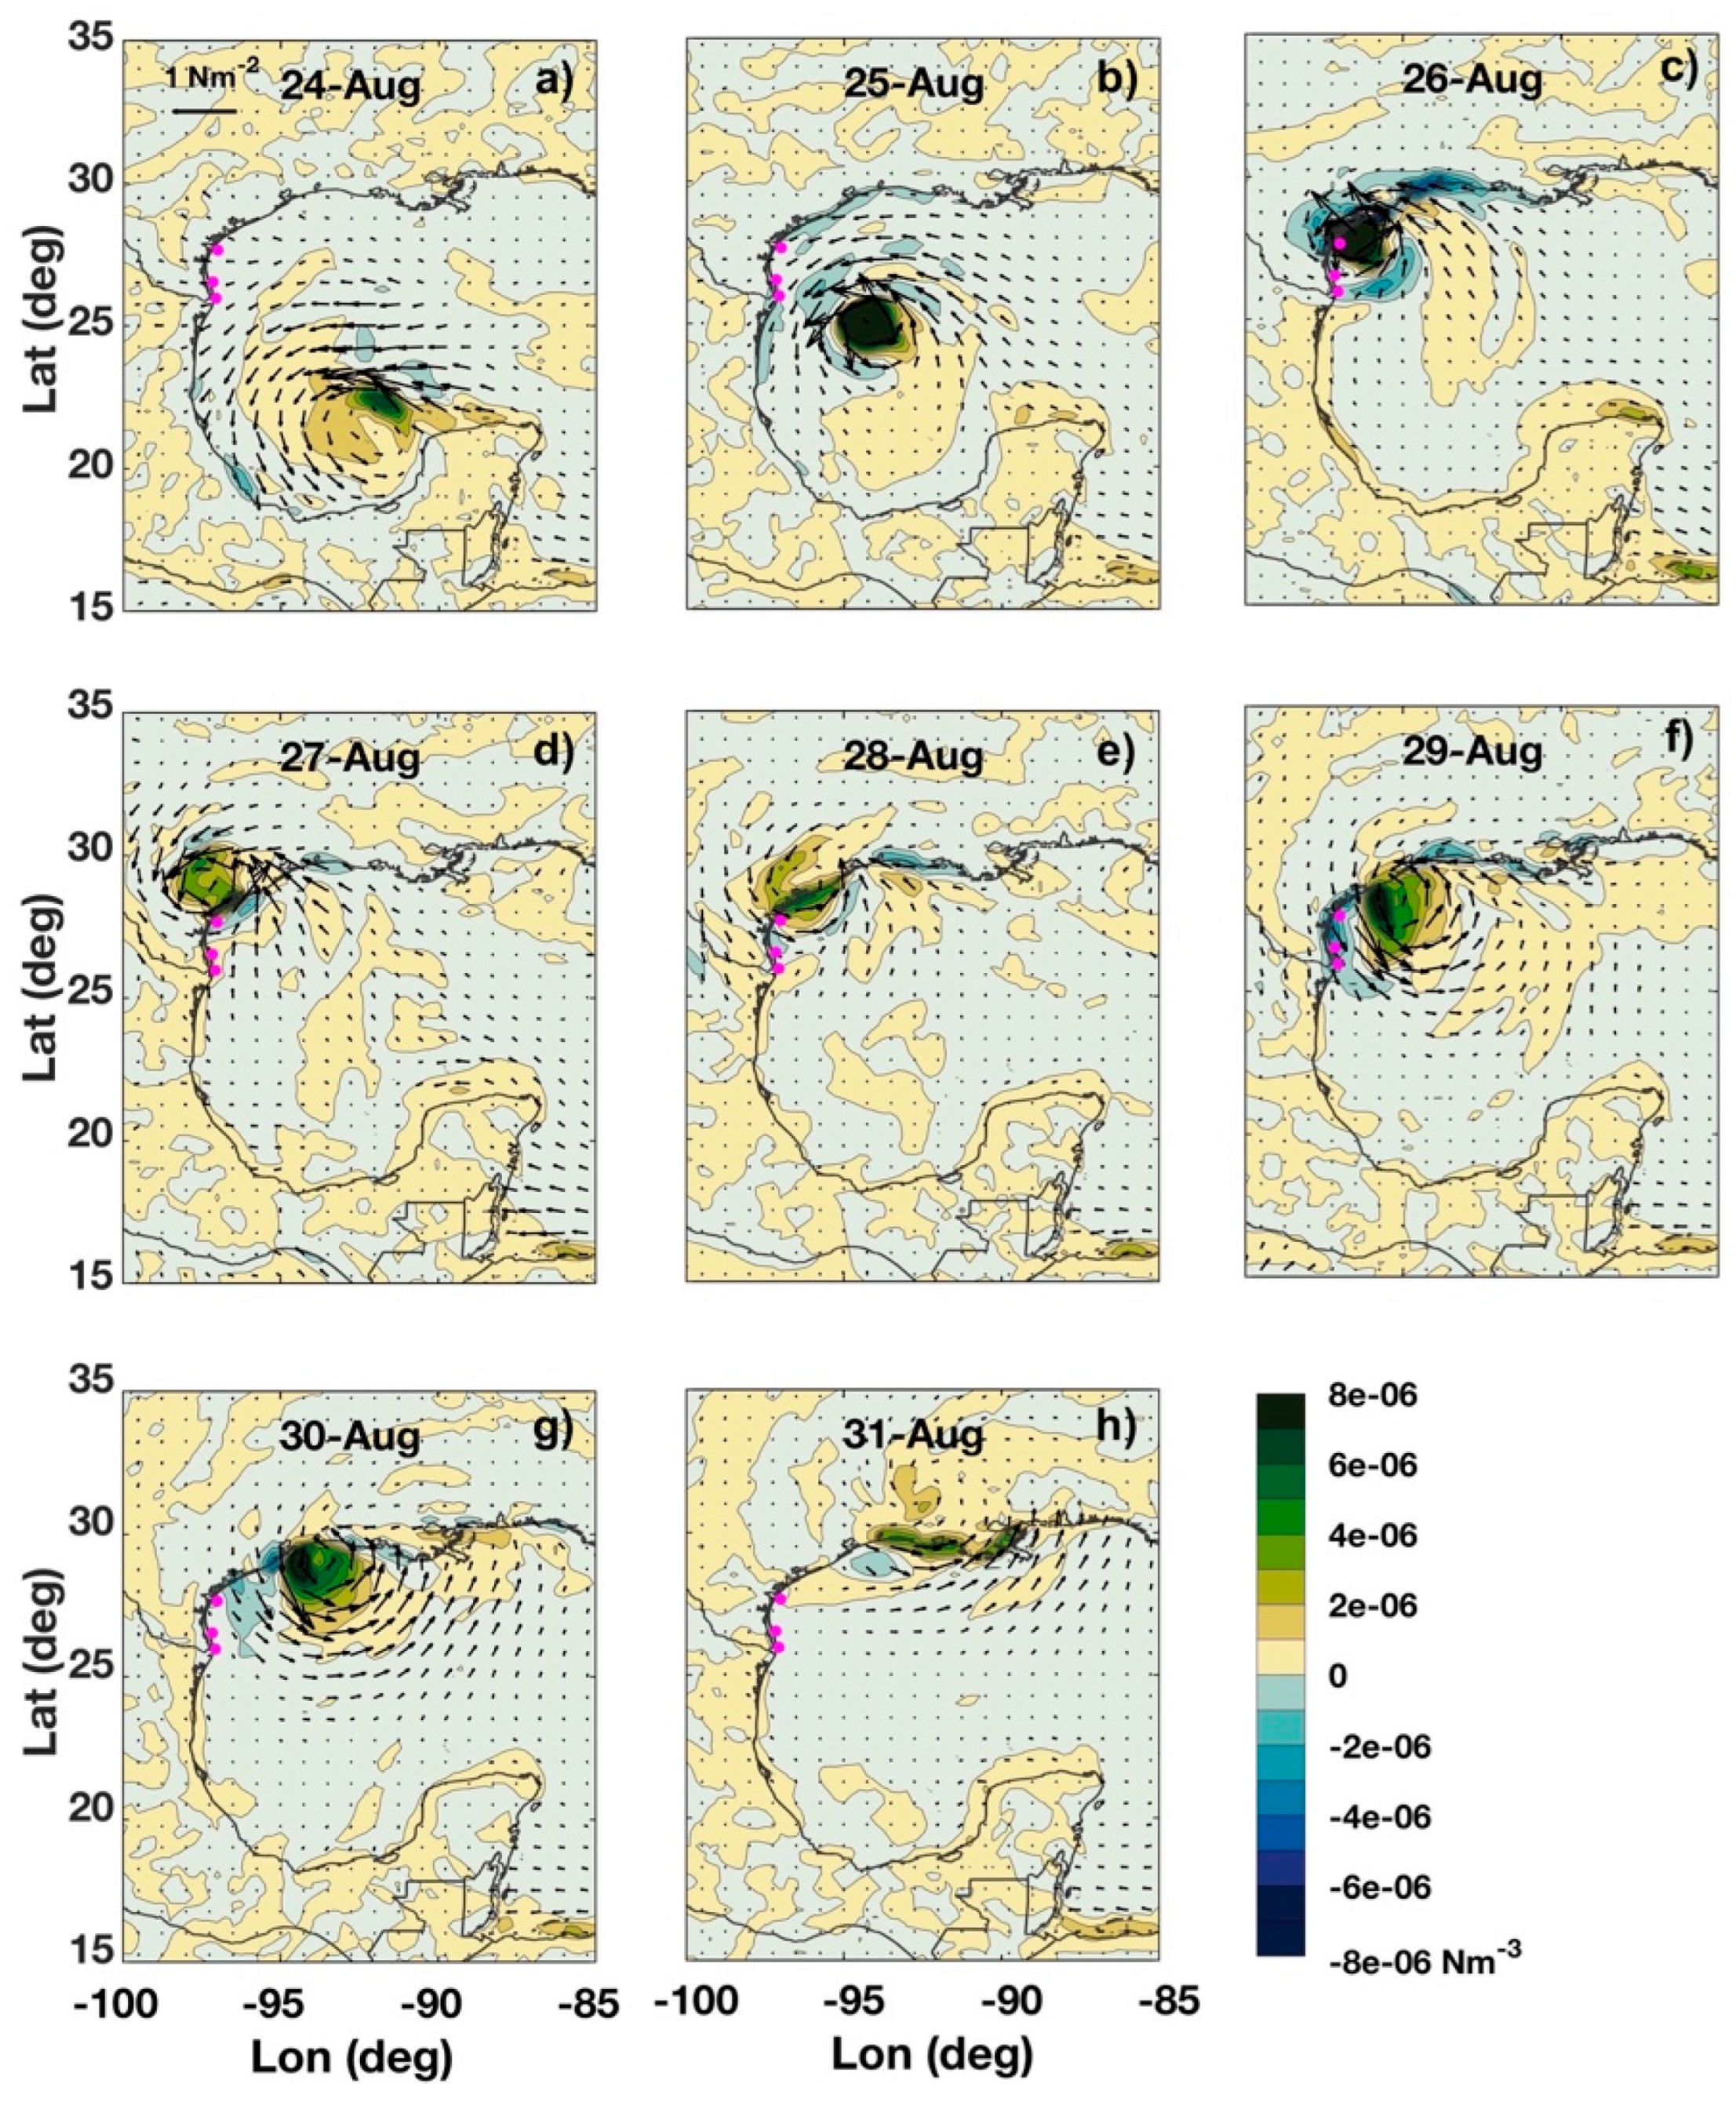
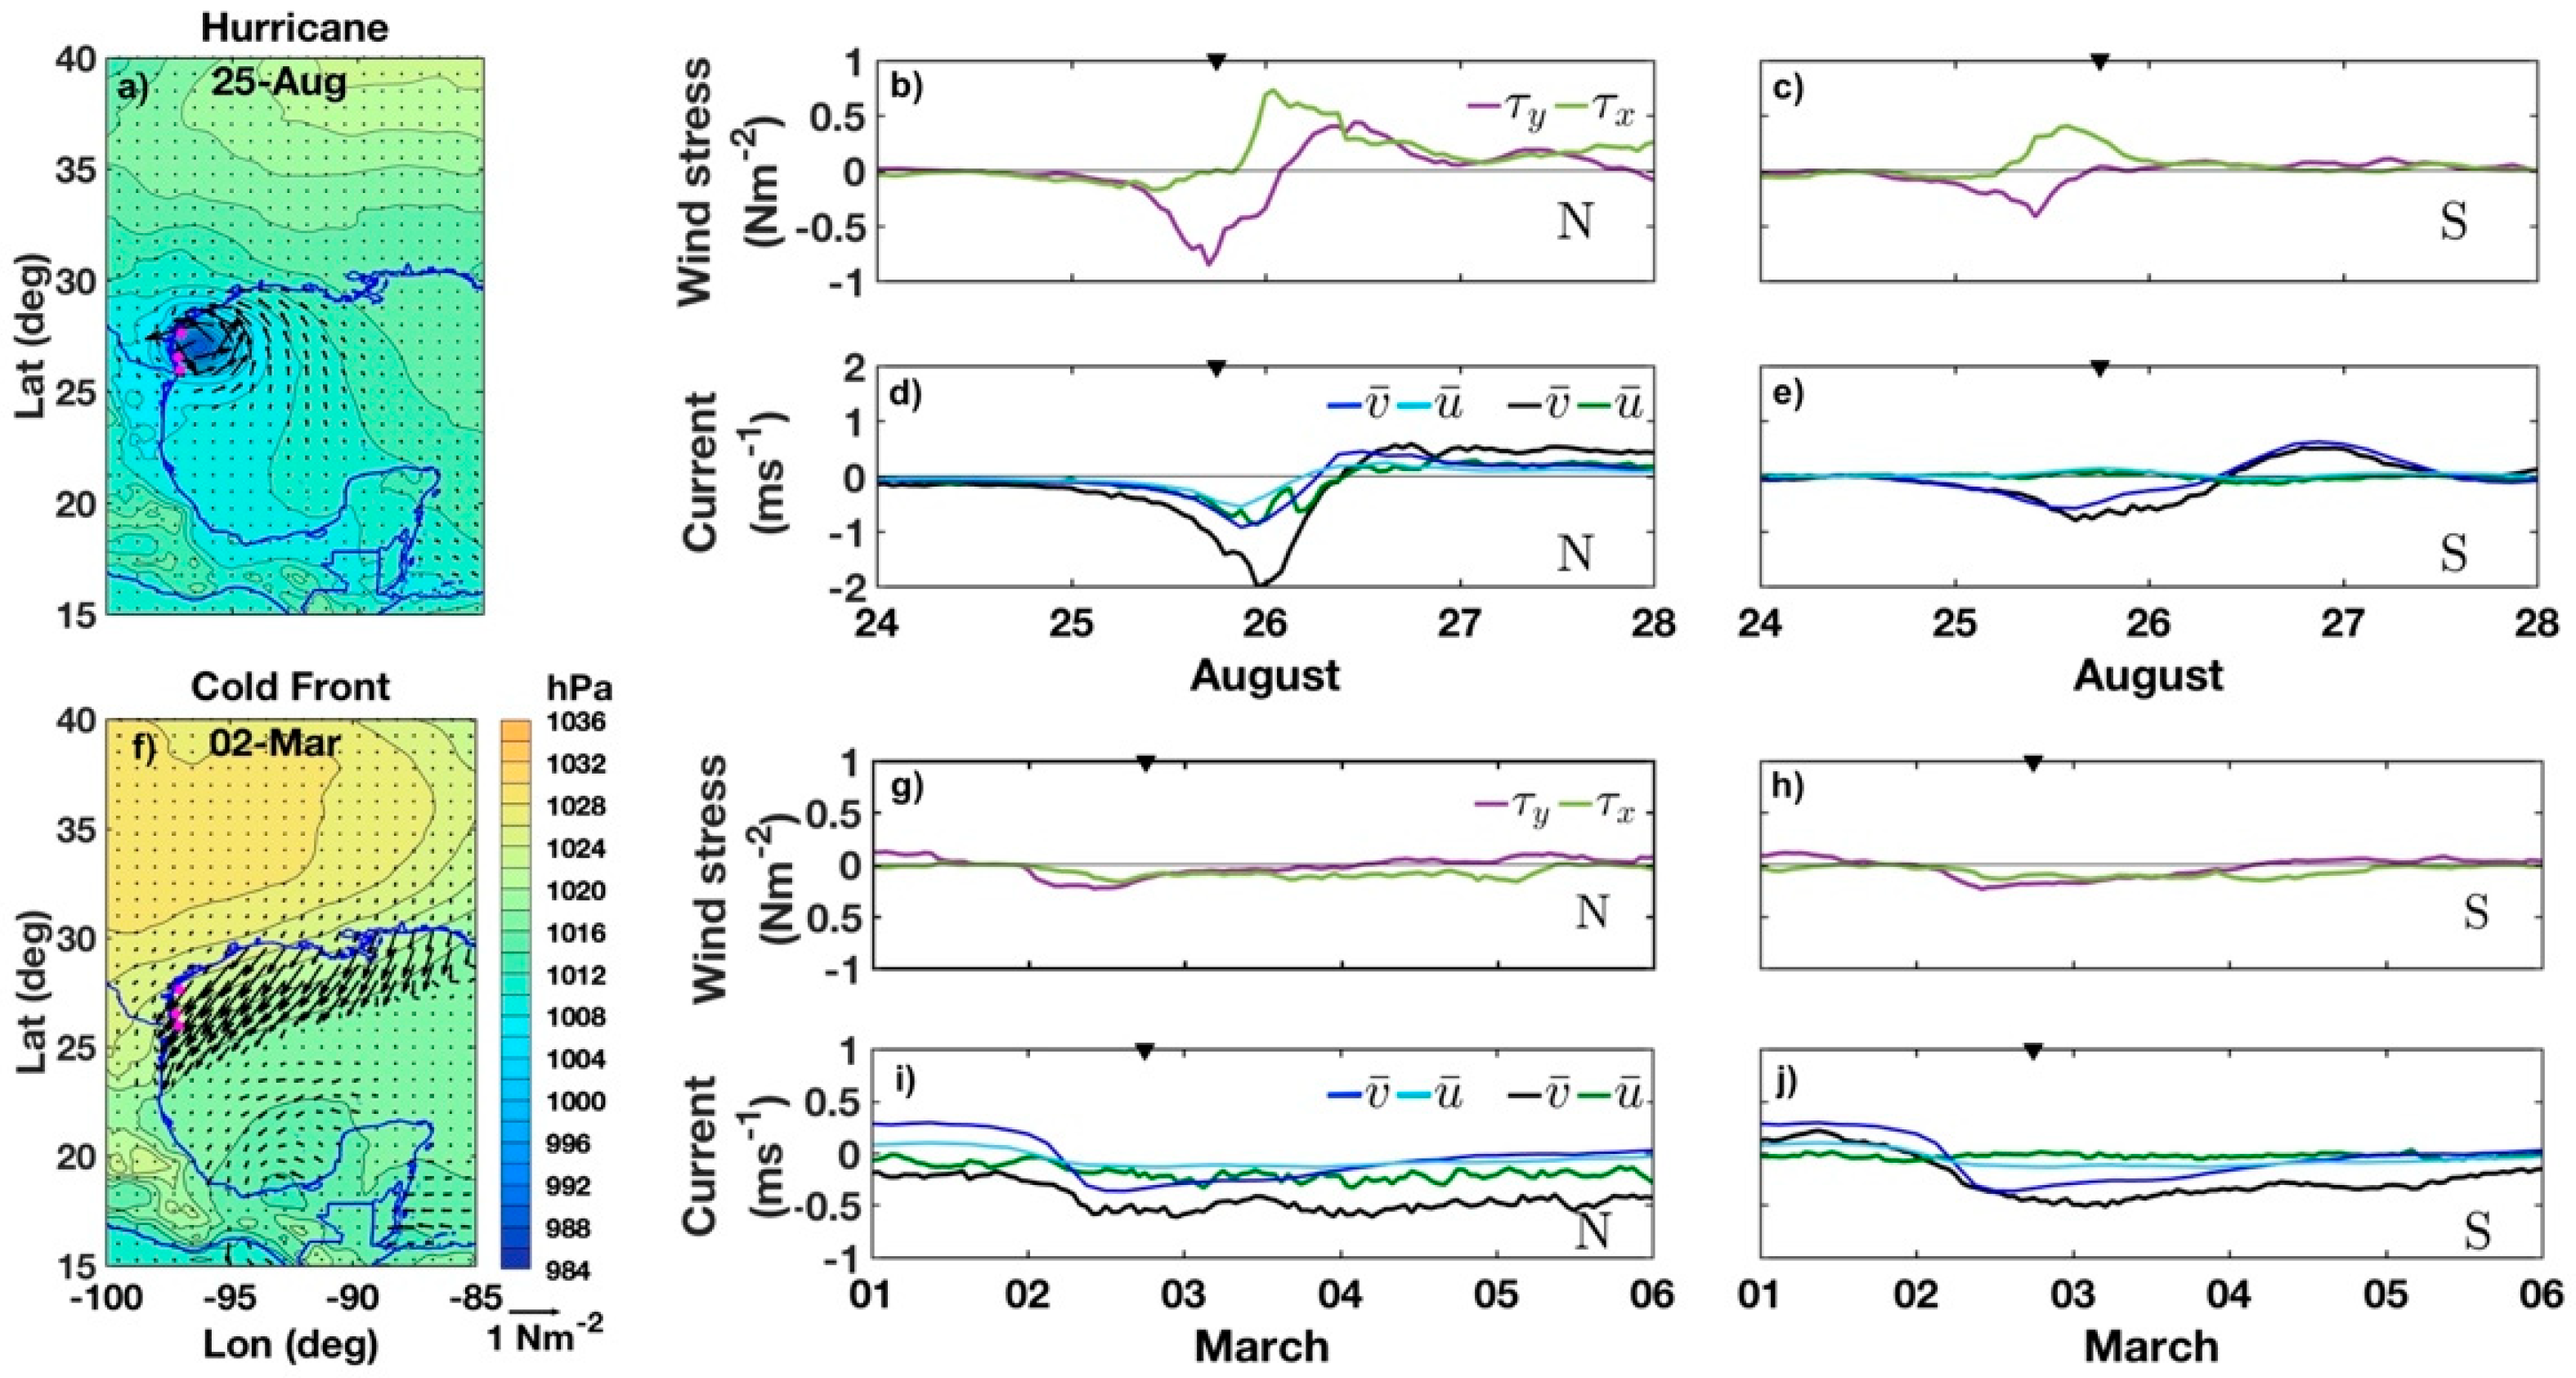
3.1. Wind Characteristics

The speed of the wind increased from south-to-north as Hurricane Harvey approached the study site (Figure 1 and Figure 2). Hourly averaged winds of up to 20 ms−1 were measured in the south, while these reached 50 ms−1 one day later (on 26th August) near to landfall in the north (Figure 2a–c). All sites (i.e., N, C, and S) presented similar zonal ( τ x ) and meridional ( τ y ) wind-stress variations, but the energy increased significantly towards the north during the hurricane event (Figure 2).
Harvey entered the Gulf of Mexico as a tropical depression and became a hurricane on the night of the 24th of August, while located west of the Yucatan Peninsula (Figure 3a). It rapidly migrated and intensified towards the northwest, becoming a Category 4 hurricane on the 26th of August, before landing in Rockport (Port Aransas area) with a maximum intensify of 8 × 10⁻⁶ Nm−3 (Figure 3c) and maximum sustained wind speeds of 65 ms−1 (Figure 1). The day after landfall, Harvey weakened (3 × 10⁻⁶ Nm−3) and became a tropical storm that displaced landward, and then travelled back onto the shelf, moving east toward Louisiana after the 29th of August (Figure 3f–h).

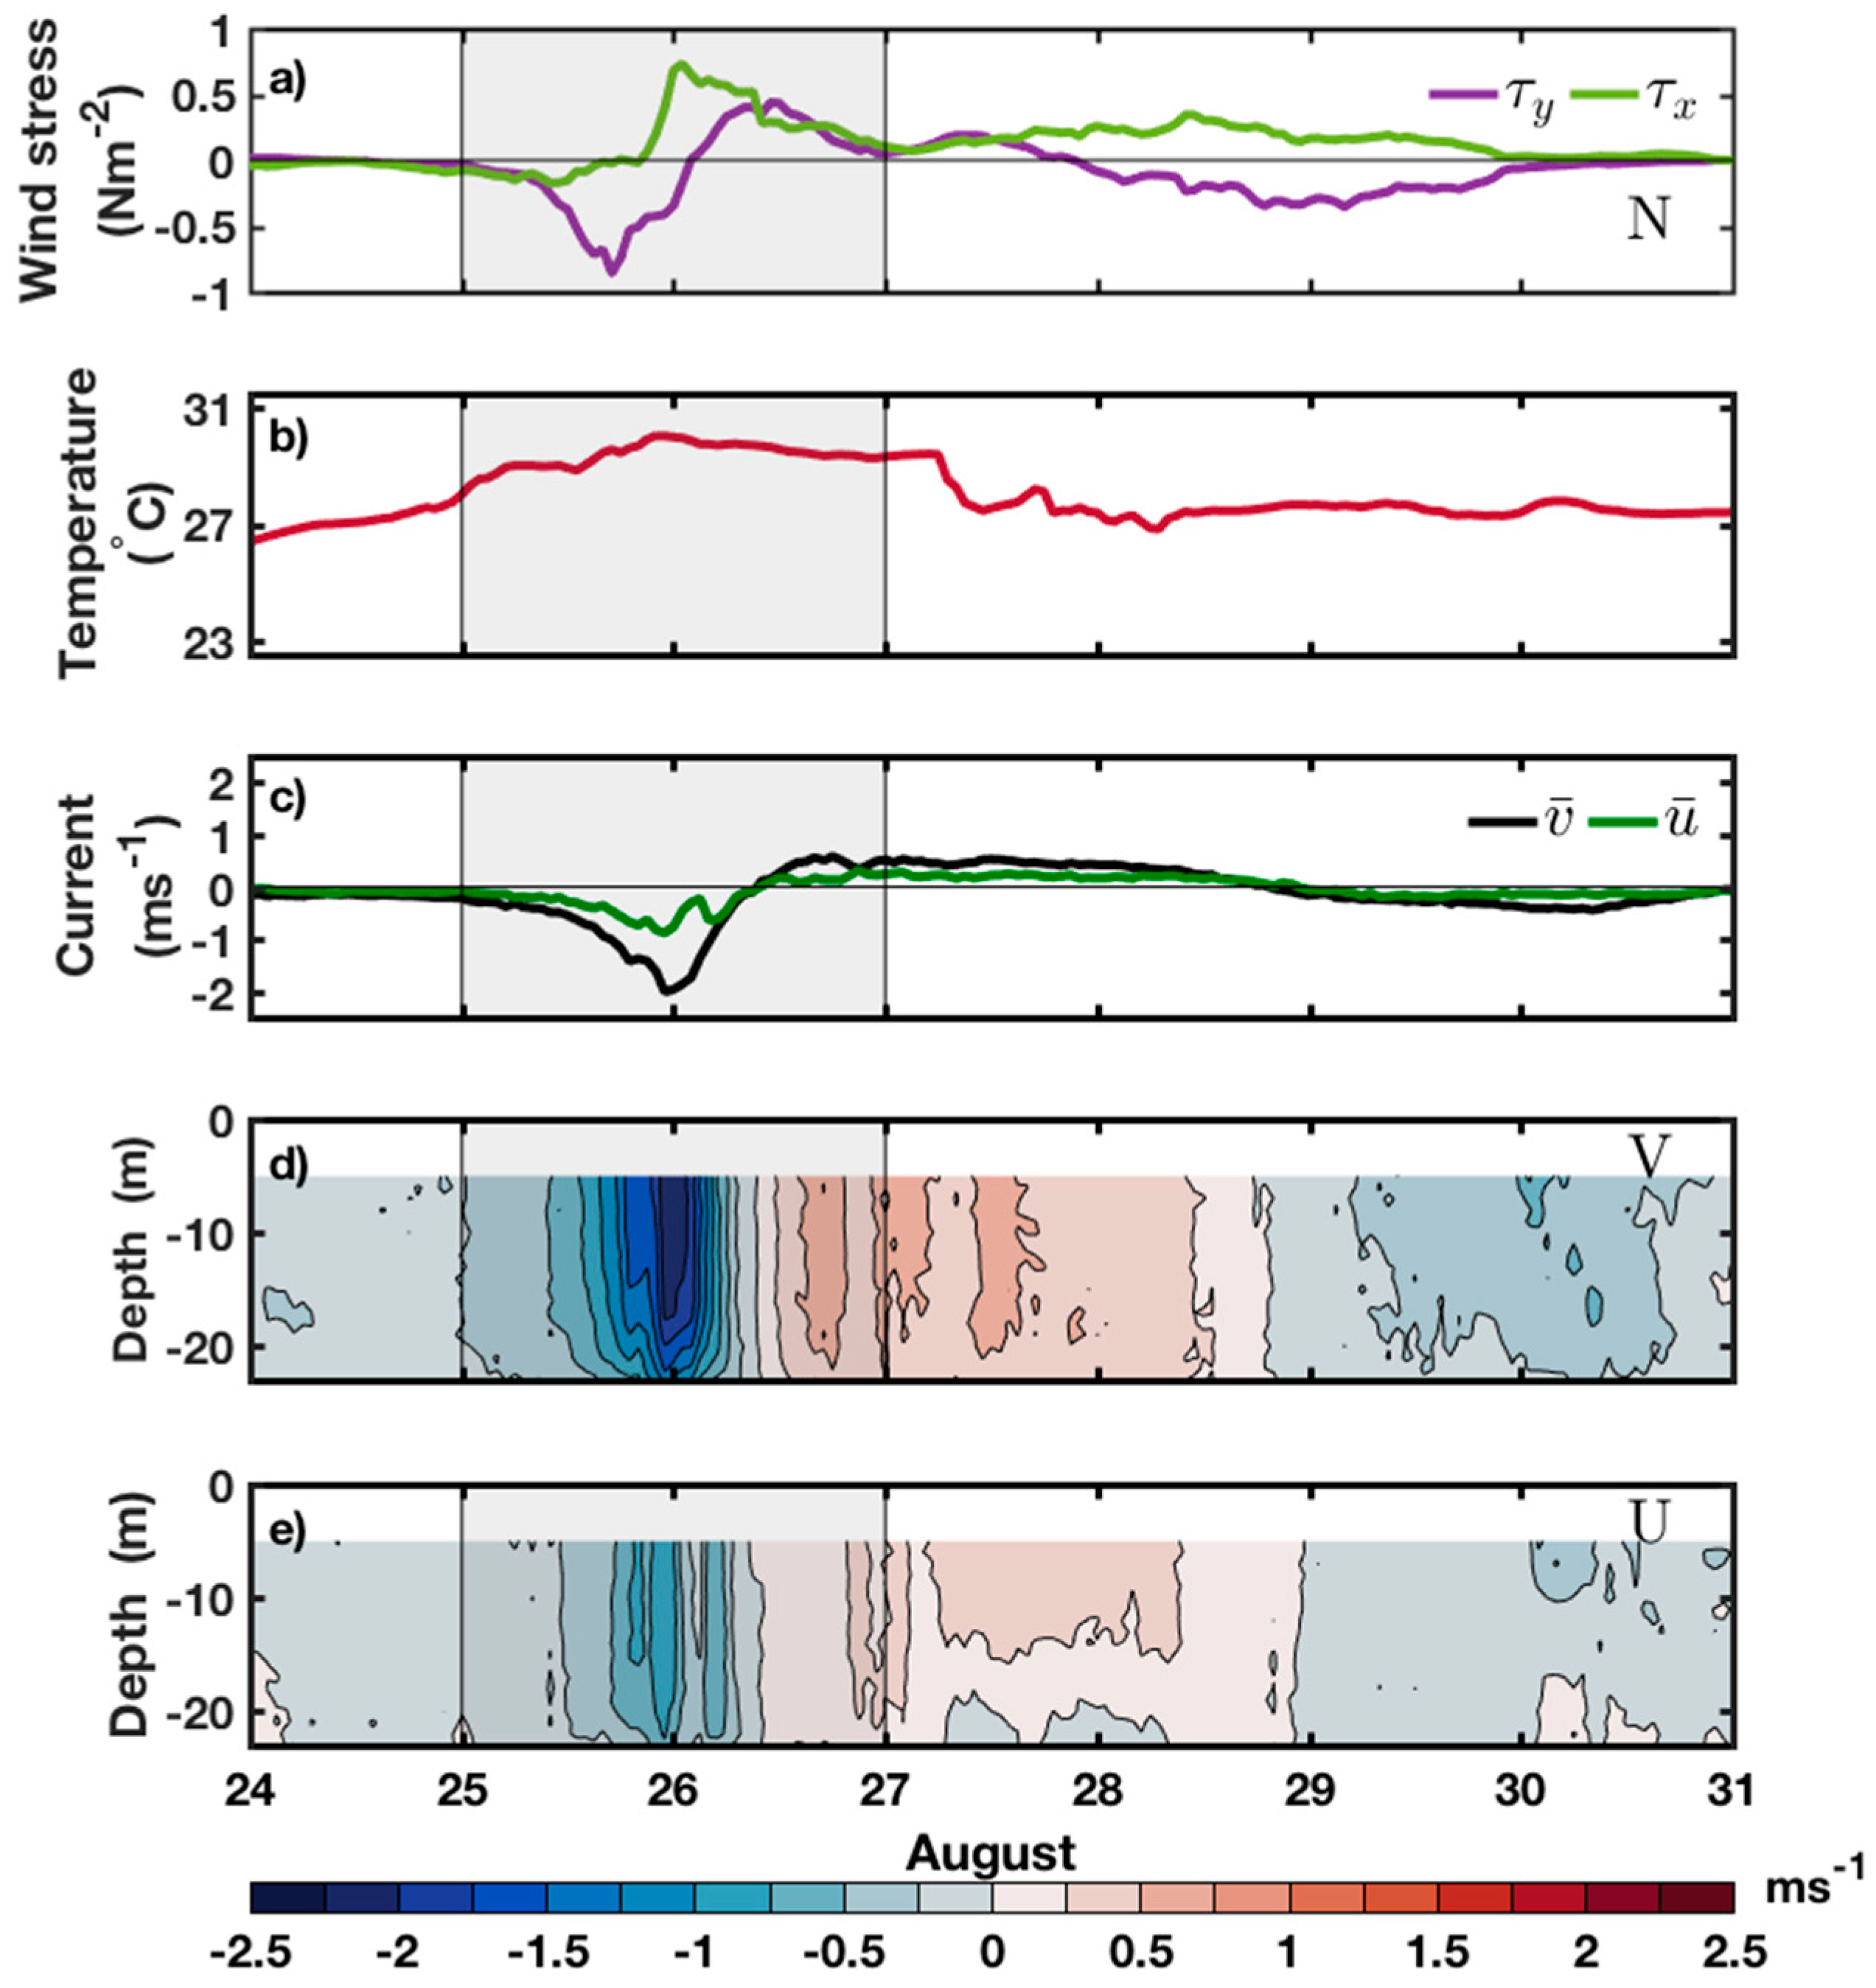
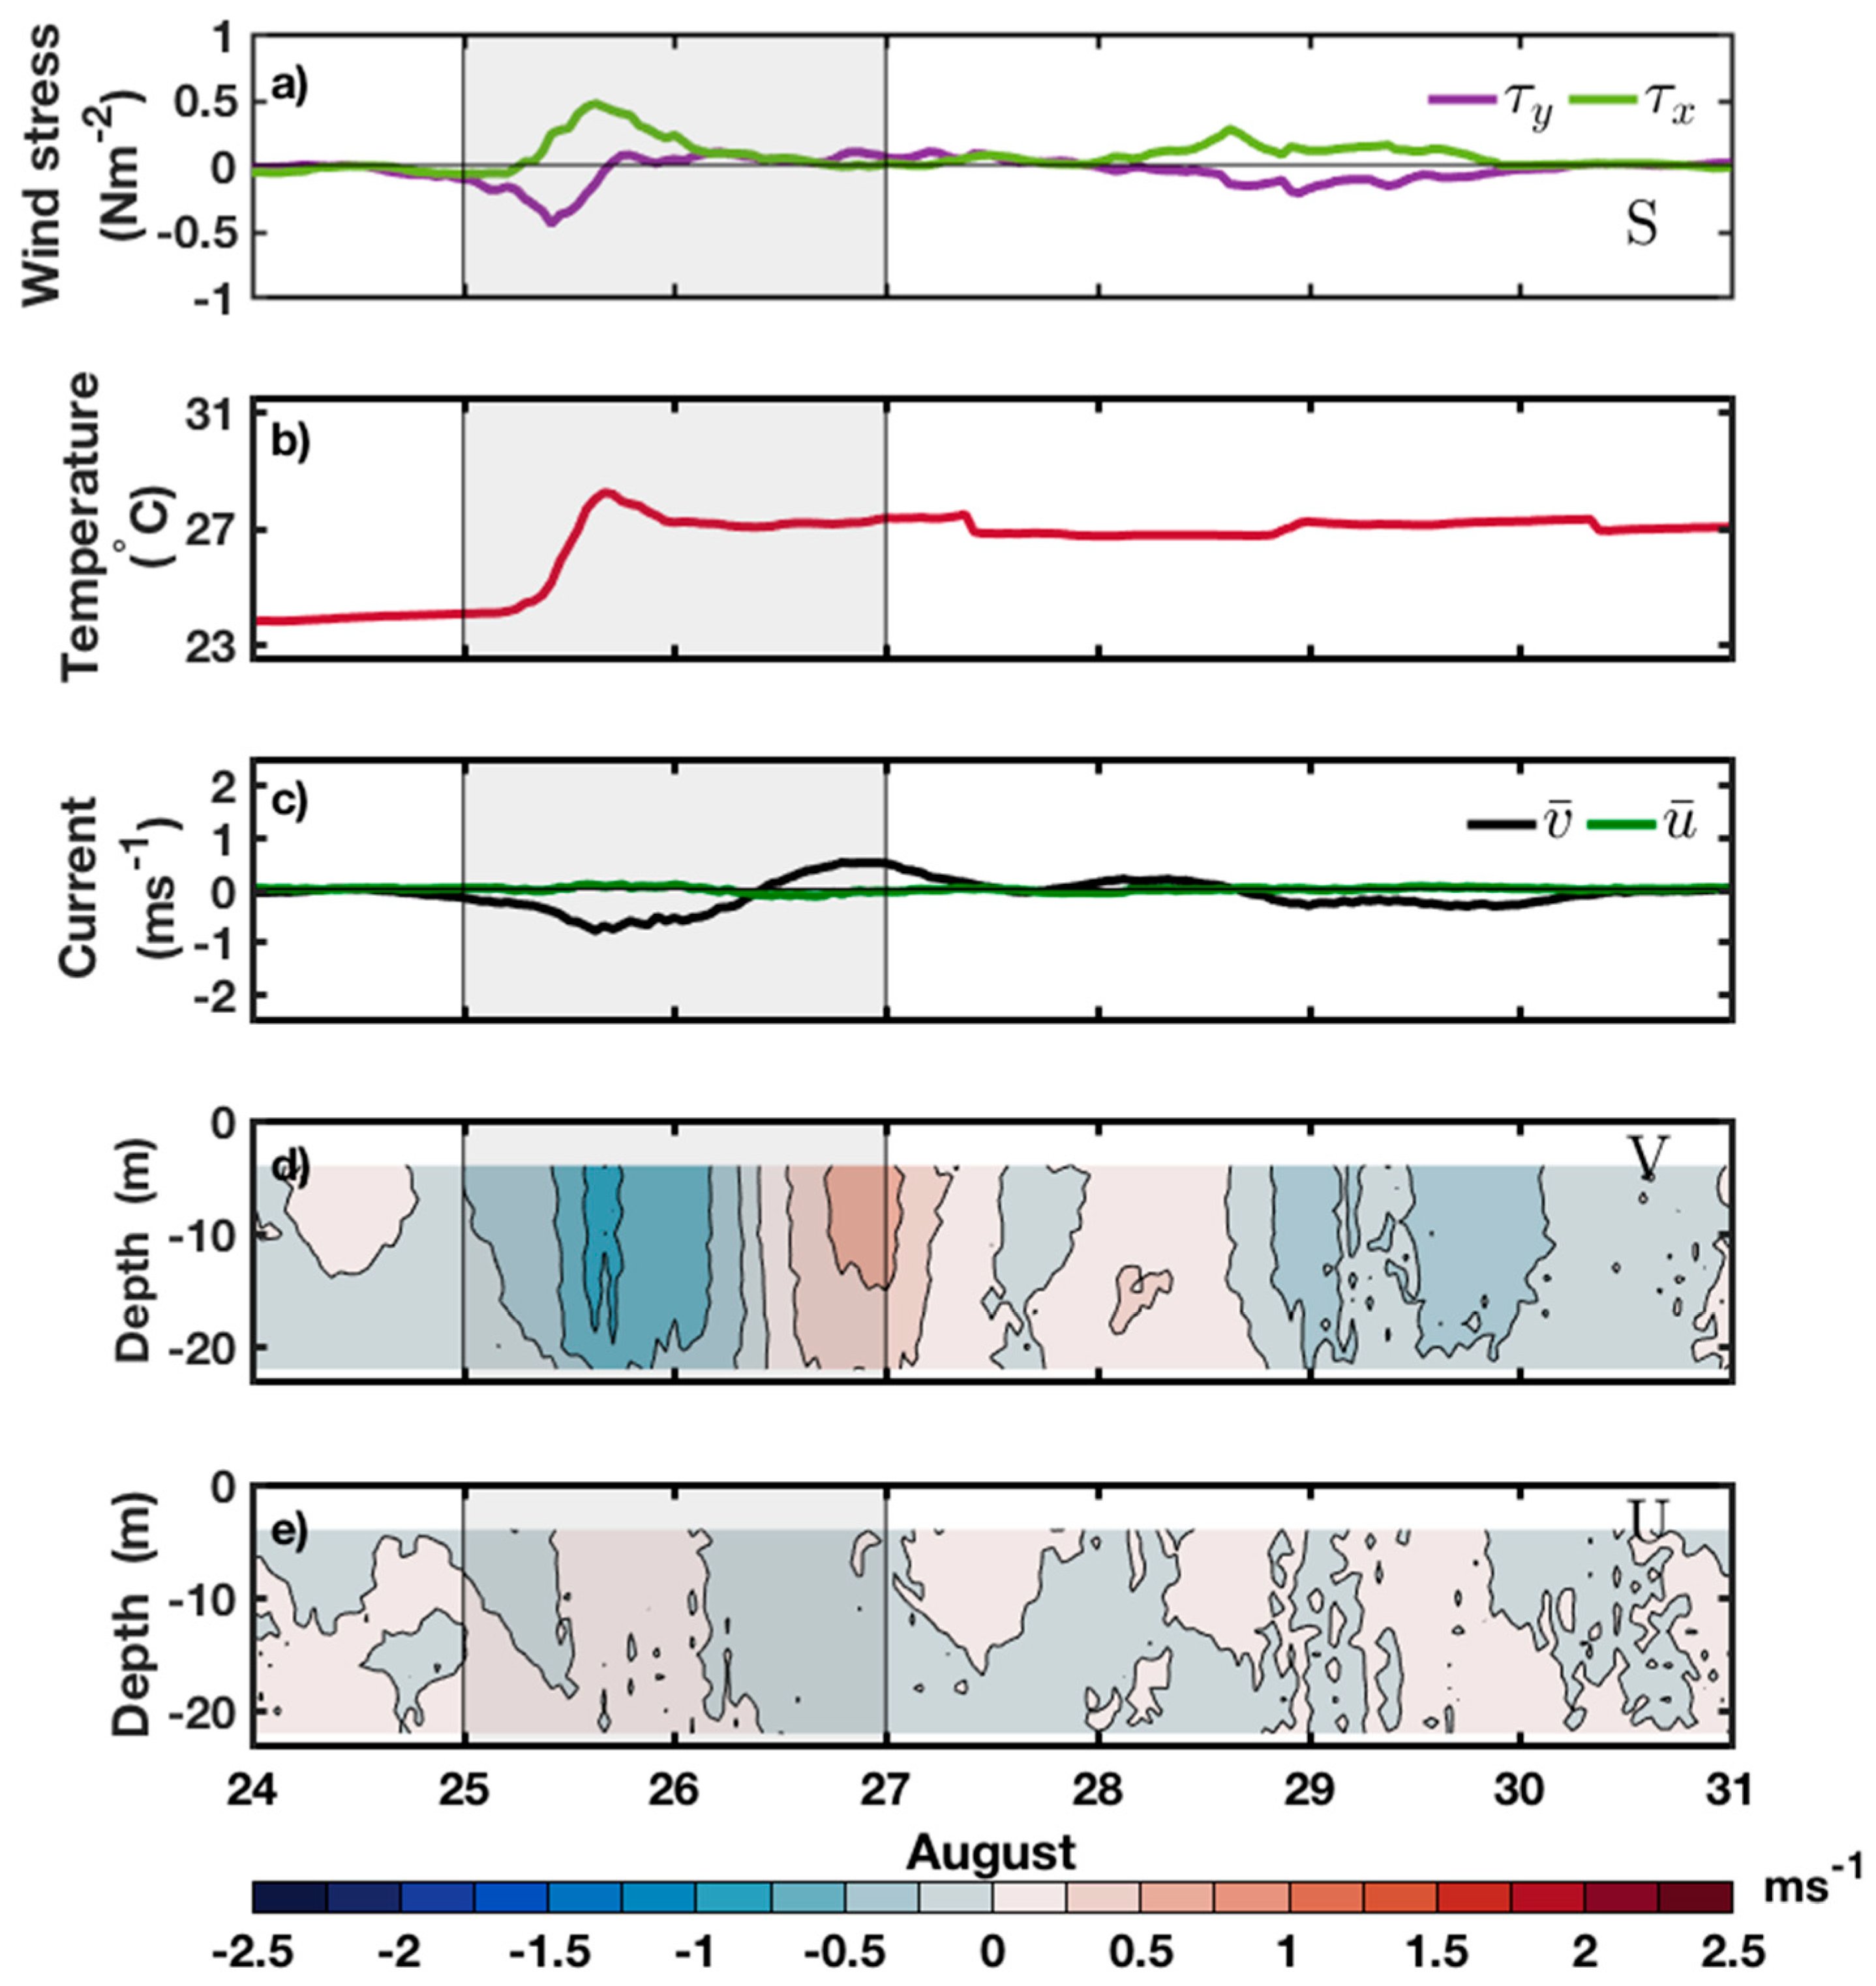
3.2. Hydrodynamic Characteristics

Wind, wave, water-level, seabed temperature, and current characteristics varied along the study site before, during, and after the incidence of Hurricane Harvey. From the hydrodynamics perspective, the presence of the hurricane was first noticed in the south, but contained significantly less energy than in the north (Figure 4). The hurricane induced intense south-southeasterly winds of up to −0.7 Nm−2 averaged over 3 h (Figure 4a). The inland displacement of Harvey on the 27th of August (Figure 3d–f) allowed the inversion of wind directions towards the north, but after the 29th of August Harvey approached the study site again and generated intense southerly winds along the coast (up to 0.25 Nm−2) that weakened towards the south (Figure 4a).
The wave height increased towards the north as the hurricane approached the Port Aransas coast (Figure 1, Figure 3 and Figure 4b). Maximum significant wave heights (Hs) of less than 4 and 5 m were measured at depths of ~20 m in the south and center before midday on the 25th of August, respectively, while the largest waves of Hs of 10 m were measured on the 26th of August in the north (Figure 4b). The timing of water level increases aligns with Harvey approaching the coast; maximum levels of up to 1 m were measured on the 26th of August in the north, and these were up to 0.8 m in the center and south. Harvey stalled inland over Houston as a tropical storm after the 27th of August, and the water levels showed fluctuations following the tidal signal (Figure 4c).
Harvey caused seawater temperature increases of around 3 °C along the study site, reaching 30 °C in the north and 27 °C in center/south. A few days after the hurricane landing (after the 28th of August), the temperature became alongshore uniform at 27 °C (Figure 4d). Before and after the hurricane the net depth-averaged flows were relatively weak and north-northeasterly (<0.3 ms−1) along the study site, while these were south-southwesterly dominated and energetic (>1 ms−1) during the presence of Harvey (Figure 4e,f). Maximum depth-averaged southward-directed flows of 2 ms−1 occurred on the 26th of August near to landfall in the north, while these were less than 1 ms−1 in the center/south. Alongshore flows inverted their direction northwards as soon as Harvey moved inland after midday on the 26th of August (Figure 4e). Onshore flows were considerably weaker than the alongshore flows; maximum onshore flows of 1 ms−1 were measured in the north, while weak offshore flows occurred in the south and they were negligible in the center (Figure 4f).

3.3. Alongshore Current Variations

Alongshore current profiles for the northern (N), central (C), and southern (S) sites are presented in Figure 5, Figure 6 and Figure 7 before, during and after the passage of Hurricane Harvey. Relatively weak wind conditions before Harvey (24th of August) generated depth uniform southwesterly directed weak currents of up to 0.25 ms−1 in the north. During the hurricane peak, the current directionality remained similar, directed towards the south, but significantly intensified reaching alongshore speeds of up to −2 ms−1 across most of the water column associated with τ y of −0.9 Nm−2.
After landfall, the hurricane moved inland and the wind reversed its direction from the southeast towards the northeast causing flow directionality inversion towards the northeast across the water column, and reaching maximum speeds of 0.7 ms−1 across the water column (Figure 5). A few hours before the 29th of August the flow inverted its direction towards the southwest again (~0.5 ms−1) due to the presence of southeasterly winds ( τ y of up to −0.25 Nm−2). Highest seabed water temperatures coincided with the τ y maxima (Figure 5a,b).
Alongshore and cross-shore current components were significantly weaker across the water columns at the central (C) and southern (S) sites compared to the north (Figure 5, Figure 6 and Figure 7). Weak current speeds (0.25 ms−1) prevailed before Harvey (24th of August) at the central site, associated with weak winds of −0.05 Nm−2. The seawater temperature remained constant at 25 °C before Harvey, and it rose to nearly 28 °C after midday on the 25th of August, associated with higher-intensity winds of τ y ~−0.7 Nm−2 (Figure 6a,b). The strongest alongshore speeds at the central site were 1.25 ms−1—half the magnitude of those in the north—and the resultant flow was directed towards the southeast rather than towards the southwest like in the north (Figure 5 and Figure 6). After Harvey, wind reversals towards the northeast resulted in weak northward-directed flows of <0.5 ms−1. On the 29th of August, the winds shifted towards the southeast ( τ y intensified to −0.25 Nm−2) and induced southeast-directed flows of up to 0.5 ms−1 across the water column (Figure 6).
In the south (S), the magnitude and directionality of the wind and currents were similar to those at the northern and central sites, but with lower intensity (Figure 5, Figure 6 and Figure 7). The resultant wind stress during Harvey was towards the southeast ( τ y maxima of −0.45 Nm−2), and the generated depth-averaged flows were the weakest along the study site (<1 ms−1). The seawater temperature presented a similar pattern to the central site—it rose from 24 °C to nearly 28 °C after midday on the 25th of August (Figure 7b). The flow effect of Hurricane Harvey finished by midday on the 26th of August, when the intensity of the wind stresses diminished to 0.05 Nm−2 and the flows reverted towards the north with a similar intensity of nearly 1 ms−1 (Figure 7d,e). Similar to the north and center, τ y inverted its direction southwards on the 29th of August, when Harvey returned towards the study site (Figure 3d–f); τ y maxima of −0.2 Nm−2 caused the reversal of the flow (0.5 ms−1) towards the south (Figure 7c–e).

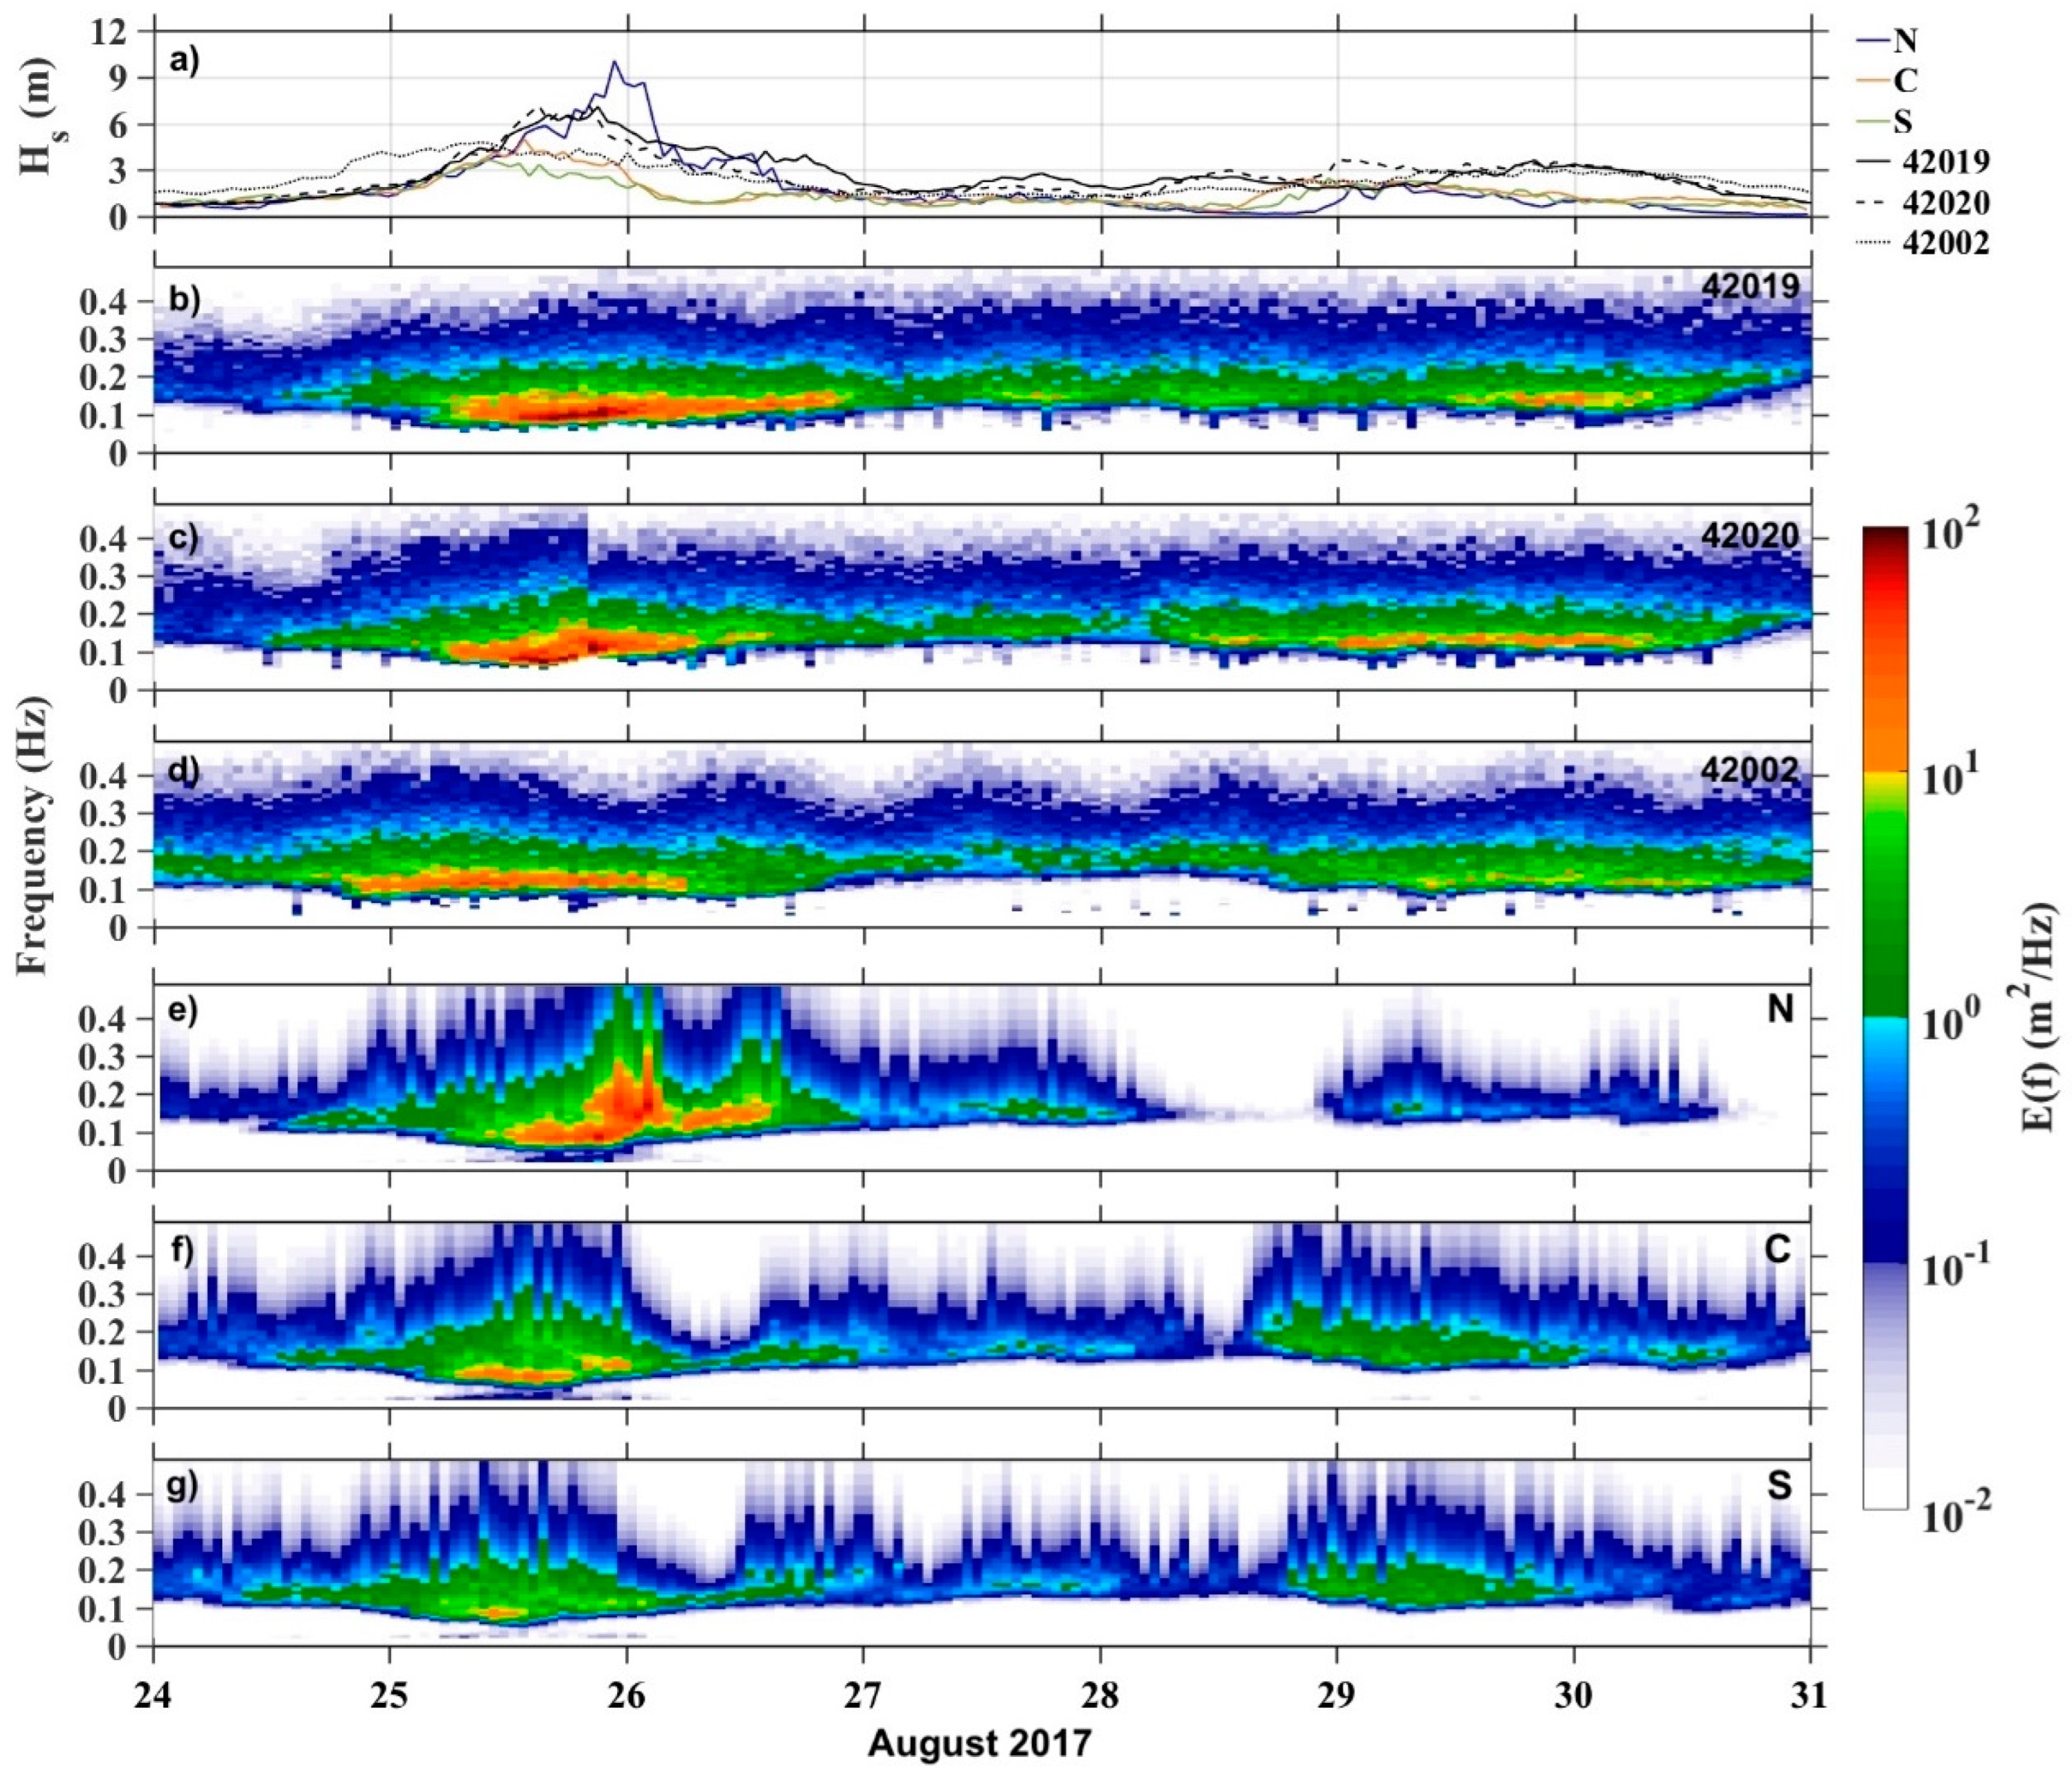
3.4. Wave Variations

Hurricane Harvey approached the study site on the 25th of August in a south-to-north direction, and after landfall it displaced inland and turned around, approaching the study site again on the 29th of August (Figure 1 and Figure 3). As a consequence, the spectral wave energy increased from south to north and presented a primary peak before landfall and a secondary peak on the 29th of August. The offshore buoy 42002 was the first instrument to register swells generated by the tropical storm (Figure 8d), followed by the southern mooring (S), but with lesser energy (Figure 8g). Since winds affecting buoy 42002 were associated with the tropical storm (rather than the hurricane), more wave energy was distributed at higher frequencies (i.e., 0.2 Hz, green colors), and the energy maxima occurred at 0.1 Hz due to the larger fetch than in other locations (Figure 8d). The northern instruments (N, 42019, 42020) measured swell waves related to hurricane winds (red colors in Figure 8b–e). The maximum-wind-speed region on the 25th of August was the largest and most intense (>17 ms1) of the time series, and the coastal moorings presented the frequency spreading of the energy, with an increase to up to 0.4 Hz just before landfall on the 26th of August (Figure 8e–g).
Wave height maxima were recorded in the regions of maximum wind speeds (see red colors in Figure 8), but due to wind rotations the energy was distributed in different directions. The maximum nearshore Hs measured in the south was 4 m, while it was up to 5 m in the center, and the largest waves of 10 m were measured in the north just before landfall (Figure 8a). Similarly, offshore waves in the south (42002) reached 5 m, while these were up to 8 m at the northern buoys (42019 and 42020) a few hours before landfall (Figure 8a). The wave heights diminished when Harvey displaced inland, but waves of up to 2 m were measured along the coast and over 4 m offshore on the 29th of August (Figure 8a).

4. Discussion

Harvey entered the Gulf of Mexico as a tropical depression, strengthened to category 1 two days later, and rapidly intensified, making landfall as category 4 hurricane at Rockport early on the 26th of August 2017; however, later that day, it downgraded to a tropical storm [12]. It stalled inland over Houston and travelled offshore on the 28th of August, finally moving east toward Louisiana after the 29th of August. Harvey caused seawater temperature increases of ~3 °C along the study site (reaching 30 °C in the north and 27 °C in the center/south), and this is suggested to be related to the presence of well-mixed very warm water extending across the water column, which diminished the hurricane’s impact on surface temperatures and supported its continued intensification [30].
The measured wave heights along Harvey’s trajectory were of similar magnitude to those observed during hurricanes Sandy [31] and Florence [7] along the East Coast of the US. As the hurricane translated, the maximum waves were typically in the right-front quadrant [6]. Both Harvey and Sandy generated nearshore waves of up to 10 m in the northeast quadrant of the storm, where the wave heights were amplified due to increased surface ocean stresses produced by winds blowing in the direction of the storm’s propagation. Unlike Hurricane Sandy, along Harvey’s storm track the maximum wave heights preceded the passage of the eye of the storm, possibly due to the reduction in wind stress in the inner eye and the lower relative wind speeds on the back side of the storm [31].
An offshore storm surge occurred associated with Hurricane Harvey; as a consequence, the water level rose by up to 1 m off the Port Aransas inlet [13]. Storm-induced water levels were similar to those in Galveston Bay, where continuous storm-related freshwater outflows occurred [11]. Similar to Sandy, at the location of landfall of Harvey, the highest water levels preceded the maximum wave heights by an hour, possibly because the water-level displacement at the eye was predominantly driven by the reduction in atmospheric pressure [31]. In contrast, the timing of largest wave heights occurred before the highest water levels at the other mooring sites (i.e., central and south) down the coast.
The inner-shelf circulation is primarily wind-driven in the northwestern Gulf of Mexico, and the alongshelf wind-stress component defines the main current direction [23,32,33]. The winds intensified along the coast as Harvey approached the Port Aransas coastline. Southwesterly wind stresses of ~0.9 Nm−2 generated depth-averaged flows of ~2 ms−1 towards the southwest close to landfall during Hurricane Harvey, of similar magnitude to those observed at the Galveston Channel entrance [11], and these flows were uniform across the water column. The wind stresses were of similar magnitude along the coast, but slightly rotated eastwards from north to south; as a consequence, the depth-averaged maximum flows decreased to ~1 ms−1 in the center and <1 ms−1 in the south.
Highly seasonal wind conditions prevail in the northwestern Gulf of Mexico [21] and cause alongshore flows of different directionality. Summer winds from the southwest induce northward flows, while winds from the northeast during non-summer months generate southward flows along the inner shelf [34]. Figure 9 compares the wind and current characteristics of Hurricane Harvey with those of an individual intense cold front (CF) on the 2nd of March 2017 (see CFI in [23] for further details). The winds presented preferential directions towards the southeast and southwest during Harvey and the cold front, respectively (Figure 9b,c,g,h). The hurricane induced southward-directed alongshore wind stresses of up to −0.9 Nm−2 and −0.4 Nm−2 in the north and south, respectively (Figure 9b,c), while τ y was up to −0.3 Nm−2 during the cold front along the coast (Figure 9g,h). Harvey generated very intense southerly depth-averaged flows of up to −2 ms−1 at N and −0.9 ms−1 at S (Figure 9d,e), while the intense CF induced milder southerly flows of up to −0.6 ms−1 at N and −0.5 ms−1 at S (Figure 9i,j). Despite the significant differences in flow magnitudes between the two events, the relatively intense flows induced by the CF persisted a few days longer than during Harvey, when the most intense currents (>1 ms−1) lasted for less than a day.
Flows measured with the ADCP moorings were compared to those obtained from the HYCOM + NCODA global analysis model (GOFS 3.1 of 1/12° and 3 h resolution) for the upper 20 m of the water column at the closest nodes to N and S (located at 120 m depth), and for the hurricane (Figure 9d,e) and CF (Figure 9i,j) periods. Similar responses of nearshore and offshore flows were observed in terms of directionality. Currents in the south (S) responded similarly to both events (Figure 9e,j). The largest flow differences happened in the north (N); alongshore currents were significantly more energetic and persistent than alongshelf flows during both events (Figure 9 d,i).
Current profiles for the velocity maxima are presented in Figure 10 for Harvey and the CF; both events generated wind-induced barotropic velocity profiles [27]. During the CF, very intense alongshore surface flows (i.e., the upper 5 m of the water column) of up to −0.9 ms−1 and −0.7 ms−1 were measured in the north and south, respectively, while milder flows of ~−0.4 ms−1 occurred across the rest of the water column at both sites (Figure 10b,e). Very intense currents of −2 ms−1 persisted across 16 m depth of the water column in the north during Harvey, and these diminished to −1.5 ms−1 near the seabed (Figure 10a). In contrast, the velocity profile in the south during Harvey was similar to that induced by CF (Figure 10d,e). These results indicate that both events induced barotropic near-steady wind-driven flows.
The wave characteristic differences between Harvey and the intense CF are presented in Figure 11. The largest wave energy was registered within the region of maximum winds in the north (N) just before Harvey’s landfall (Figure 11b). The wave energy in the south (S) was of similar magnitude to that generated by the CF along the coast (Figure 11c,h); the maximum Hs was nearly 4 m. Thus, the amount of wave energy induced by the CF was similar to that generated by Harvey, excluding the highest waves of Hs > 4 m before landfall, which lasted for 14 h (Figure 11b,g). Synoptic-scale cold fronts occur more frequently than tropical cyclones in the northwestern Gulf of Mexico [35], and these fronts significantly modulate the nearshore circulation [20,36]. In this study, we found that both extreme events intensified alongshore currents and induced highly energetic waves. While Harvey caused extremely energetic conditions near to landfall, its impact along the southern Texas coast was comparable to that of the intense CF, which caused more persistent energetic wave conditions and downcoast flows (Figure 9 and Figure 11).

5. Conclusions

Wave and current characteristics associated with Hurricane Harvey and an intense synoptic-scale cold front (CF) were analyzed along the southern Texas coast based on ADCP measurements, offshore buoy data, and weather observations from inland stations and Era-5 global reanalysis. The energetic CF peaked on the 2nd of March and lasted four days (1–5 March 2017). Harvey approached the study site as a tropical storm and became a hurricane on the night of the 24th of August 2017. Well-mixed very warm water extending across the water column diminished the hurricane’s impact on surface temperatures (caused increases of ~3 °C) and supported its continued intensification. Hence, it rapidly migrated and intensified towards the northwest, becoming a category 4 hurricane on the 26th of August before landfall near Port Aransas. The day after landing it displaced inland and weakened, becoming a tropical storm that approached the study site again on the 29th of August.
An offshore storm surge occurred associated with Hurricane Harvey; the water level rose by up to 1 m off the Port Aransas inlet. The highest water levels preceded the maximum wave heights by an hour at landfall, possibly because the water-level displacement at the eye was predominately driven by the reduction in atmospheric pressure. In contrast, the timing of the largest wave heights occurred before the highest water levels at the other moorings down the coast. The winds intensified along the coast as Harvey approached the Port Aransas coastline. Southwesterly wind stresses of ~−0.9 Nm−2 generated depth-averaged flows of ~2 ms−1 towards the southwest close to landfall, and these flows were uniform across the water column. The wind stresses diminished by up to ~−0.4 Nm−2 in the south; thus, the depth-averaged maximum flows induced by Harvey decreased to ~1 ms−1 in the center and <1 ms−1 in the south.
Both Hurricane Harvey and the intense CF induced southward-directed alongshore wind stresses of similar magnitudes ( τ y ~−0.4 Nm−2) that generated similar depth-averaged flows (0.5 to 0.7 ms−1) and wave energy conditions (maximum Hs of ~4 m) in the south. While Harvey caused extremely energetic conditions near to landfall in the north compared to the CF (depth-averaged flows and Hs of 2 ms−1 and 10 m rather than 0.6 ms−1 and 4 m, respectively), its effect on the alongshore hydrodynamics was comparable to that of the intense CF. Relatively intense CF-induced flows persisted for a few days longer than the very energetic currents induced by Harvey, since the most intense currents (>1 ms−1) and waves (Hs > 4 m) lasted for less than a day. Both extreme events intensified alongshore currents and induced highly energetic waves. We highlight the relevant role of synoptic-scale cold fronts that significantly modulate the nearshore hydrodynamics and occur more frequently than tropical cyclones in the northwestern Gulf of Mexico.

Author Contributions

A.R.d.A.-A. led the funding acquisition, project administration, and research conceptualization. Data collection was supported by the CIGOM-UABC group, and data analysis was performed by A.R.-A. and B.E.-T. Original draft preparation was led by A.R.d.A.-A., with the support of A.R.-A. and B.E.-T. All authors have read and agreed to the published version of the manuscript.

Funding

This research was funded by the National Council of Science and Technology of Mexico–Mexican Ministry of Energy–Hydrocarbon Trust, project 201441; this is a contribution of the Gulf of Mexico Research Consortium (CIGoM).

Institutional Review Board Statement

Not applicable.

Informed Consent Statement

Not applicable.

Data Availability Statement

The datasets generated and/or analyzed during the current study are not publicly available due to the internal policy of the CIGOM project, but may be available from the corresponding author upon reasonable request.

Acknowledgments

The authors are grateful to CONACyT for the grant provided to A.M.R.A. The support provided by the Coastal Morphodynamics research group (www.mordics.org) is acknowledged—especially the technical assistance of Alejandro Dominguez. We are greatly thankful to Jim Naismith and his team at Naismith Marine Services for their excellent support with the installation of the moorings.

Conflicts of Interest

The authors declare no conflict of interest.

References

  1. Trenberth, K.E.; Cheng, L.; Jacobs, P.; Zhang, Y.; Fasullo, J. Hurricane Harvey links to ocean heat content and climate change adaptation. Earth’s Future 2018, 6, 730–744. [Google Scholar] [CrossRef]
  2. Rousseau-Rizzi, R.; Emanuel, K. Natural and anthropogenic contributions to the hurricane drought of the 1970s–1980s. Nat. Commun. 2022, 13, 5074. [Google Scholar] [CrossRef] [PubMed]
  3. Reed, K.A.; Wehner, M.F.; Zarzycki, C.M. Attribution of 2020 hurricane season extreme rainfall to human-induced climate change. Nat. Commun. 2022, 13, 1905. [Google Scholar] [CrossRef]
  4. Knutson, T.; Camargo, S.J.; Chan, J.C.; Emanuel, K.; Ho, C.-H.; Kossin, J.; Mohapatra, M.; Satoh, M.; Sugi, M.; Walsh, K. Tropical cyclones and climate change assessment: Part II: Projected response to anthropogenic warming. Bull. Am. Meteorol. Soc. 2020, 101, E303–E322. [Google Scholar] [CrossRef]
  5. Loehle, C.; Staehling, E. Hurricane trend detection. Nat. Hazards 2020, 104, 1345–1357. [Google Scholar] [CrossRef]
  6. Esquivel-Trava, B.; Ocampo-Torres, F.J.; Osuna, P. Spatial structure of directional wave spectra in hurricanes. Ocean Dyn. 2015, 65, 65–76. [Google Scholar] [CrossRef]
  7. Manchia, C.M.; Mulligan, R.P. Hurricane wind-driven surface waves on narrow continental shelf and exposed coast. Cont. Shelf Res. 2022, 237, 104681. [Google Scholar] [CrossRef]
  8. Dietrich, J.C.; Zijlema, M.; Westerink, J.J.; Holthuijsen, L.H.; Dawson, C.; Luettich Jr, R.A.; Jensen, R.E.; Smith, J.M.; Stelling, G.S.; Stone, G.W. Modeling hurricane waves and storm surge using integrally-coupled, scalable computations. Coast Eng. 2011, 58, 45–65. [Google Scholar] [CrossRef]
  9. Pruszak, Z.; Szmytkiewicz, P.; Ostrowski, R.; Skaja, M.; Szmytkiewicz, M. Shallow-water wave energy dissipation in a multi-bar coastal zone. Oceanologia 2008, 50, 43–58. [Google Scholar]
  10. Ardhuin, F.; O’reilly, W.C.; Herbers, T.H.C.; Jessen, P.F. Swell transformation across the continental shelf. Part I: Attenuation and directional broadening. J. Phys. Oceanogr. 2003, 33, 1921–1939. [Google Scholar] [CrossRef]
  11. Thyng, K.M.; Hetland, R.D.; Socolofsky, S.A.; Fernando, N.; Turner, E.L.; Schoenbaechler, C. Hurricane Harvey caused unprecedented freshwater inflow to Galveston Bay. Estuaries Coasts 2020, 43, 1836–1852. [Google Scholar] [CrossRef]
  12. Blake, E.S.; Zelinsky, D.A. National Hurricane Center Tropical Cyclone Report: Hurricane Harvey; Tech. Rep. AL092017; National Hurricane Center: Miami, FL, USA, 2018. [Google Scholar]
  13. Goff, J.A.; Swartz, J.M.; Gulick, S.P.S.; Dawson, C.N.; Ruiz de Alegría-Arzaburu, A. An outflow event on the left side of Hurricane Harvey: Erosion of barrier sand and seaward transport through Aransas Pass, Texas. Geomorphology 2019, 334, 44–57. [Google Scholar] [CrossRef]
  14. Thieler, E.R.; Young, R.S. Quantitative evaluation of coastal geomorphic changes in South Carolina after Hurricane Hugo. J. Coast. Res. 1991, 8, 187–200. [Google Scholar]
  15. Gencarelli, R.; Tomasicchio, G.R.; Kobayashi, N.; Johnson, B.D. Beach profile evolution and dune erosion due to the impact of hurricane Isabel. In Proceedings of the 31st International Conference on Coastal Engineering, Hamburg, Germany, 31 August–5 September 2008; World Scientific: Singapore, 2018; pp. 1697–1709. [Google Scholar]
  16. Donnelly, C.; Kraus, N.; Larson, M. State of knowledge on measurement and modeling of coastal overwash. J. Coast. Res. 2006, 22, 965–991. [Google Scholar] [CrossRef]
  17. Lorenzo-Trueba, J.; Ashton, A.D. Rollover, drowning, and discontinuous retreat: Distinct modes of barrier response to sea-level rise arising from a simple morphodynamic model. J. Geophys. Res. Earth Surf. 2014, 119, 779–801. [Google Scholar] [CrossRef] [Green Version]
  18. Schwab, W.C.; Baldwin, W.E.; Warner, J.C.; List, J.H.; Denny, J.F.; Liste, M.; Safak, I. Change in morphology and modern sediment thickness on the inner continental shelf offshore of Fire Island, New York between 2011 and 2014: Analysis of hurricane impact. Mar. Geol. 2017, 391, 48–64. [Google Scholar] [CrossRef]
  19. Appendini, C.M.; Hernández-Lasheras, J.; Meza-Padilla, R.; Kurczyn, J.A. Effect of climate change on wind waves generated by anti-cyclonic CF intrusions in the Gulf of Mexico. Clim. Dyn. 2018, 51, 3747–3763. [Google Scholar] [CrossRef]
  20. Romero-Arteaga, A.; Ruiz de Alegría-Arzaburu, A.; Rivas, D.; Juárez, B. Nearshore current variations during the passage of cold fronts in NW Gulf of Mexico. Cont. Shelf Res. 2022, 238, 104697. [Google Scholar] [CrossRef]
  21. Thyng, K.M.; Hetland, R.D. Seasonal and interannual cross-shelf transport over the Texas and Louisiana continental shelf. Cont. Shelf Res. 2018, 160, 23–35. [Google Scholar] [CrossRef]
  22. Nowlin WDJr Jochens, A.E.; Reid, R.O.; DiMarco, S.F. Texas-Louisiana Shelf Circulation and Transport Processes Study: Synthesis Report, Volume II: Appendices; OCS Study MMS 98-0036; U.S. Dept. of the Interior, Minerals Mgmt Service, Gulf of Mexico OCS Region: New Orleans, LA, USA, 1998; 288p. [Google Scholar]
  23. Romero-Arteaga, A.; Ruiz de Alegría-Arzaburu, A. Spatial variability of currents associated with different cold fronts along the southern Texas coast. Ocean Dyn. 2022, 72, 279–294. [Google Scholar] [CrossRef]
  24. Huh, O.K.; Rouse, L.J.; Walker, N.D. Cold air outbreaks over the Northwest Florida Continental Shelf: Heat flux processes and hydrographic changes. J. Geophys. Res. 1984, 89, 717–726. [Google Scholar] [CrossRef]
  25. Cochrane, J.D.; Kelly, F.J. Low-frequency circulation on the Texas-Louisiana Continental Shelf. J. Geophys. Res. 1986, 91, 10645. [Google Scholar] [CrossRef]
  26. Zijlema, M.; van Vledder, G.P.; Holthuijsen, L.H. Bottom friction and wind drag for wave models. Coast. Eng. 2012, 65, 19–26. [Google Scholar] [CrossRef]
  27. Nelson, C.S. Wind Stress and Wind Stress Curl over the California Current; NOAA Tech. Rep. NMFS SSRF-714; NOAA: Washington, DC, USA, 1977; 87p. [Google Scholar]
  28. Gordon, L.; Lohrmann, A. Near-shore doppler current meter wave spectra. In Ocean Wave Measurement and Analysis; San Francisco, CA, USA, 2002; pp. 33–43. [Google Scholar]
  29. Donelan, M.A.; Hamilton, J.; Hui, W.H. Directional Spectra of Wind-Generated Waves. Philosophical Transactions of the Royal Society of London. Series A. Math. Phys. Sci. 1985, 315, 509–562. [Google Scholar]
  30. Potter, H.; DiMarco, S.F.; Knap, A.H. Tropical cyclone heat potential and the rapid intensification of Hurricane Harvey in the Texas Bight. J. Geophys. Res. Ocean. 2019, 124, 2440–2451. [Google Scholar] [CrossRef]
  31. Warner, J.C.; Schwab, W.C.; List, J.H.; Safak, I.; Liste, M.; Baldwin, W. Inner-shelf ocean dynamics and seafloor morphologic changes during Hurricane Sandy. Cont. Shelf Res. 2017, 138, 1–18. [Google Scholar] [CrossRef] [Green Version]
  32. Winant, C.D. Coastal circulation and wind-induced currents. Annu. Rev. Fluid Mech. 1980, 12, 271–301. [Google Scholar] [CrossRef]
  33. Nowlin, W.D.; Jochens, A.E.; Dimarco, S.F.; Reid, R.O.; Howard, M.K. Low-frequency circulation over the Texas-Louisiana continental shelf. Geophys. Monogr. Ser. 2005, 161, 219–240. [Google Scholar]
  34. Thyng, K.M. Deepwater Horizon Oil could have naturally reached Texas beaches. Mar. Pollut. Bull. 2019, 149, 110527. [Google Scholar] [CrossRef]
  35. Huang, W.; Li, C. Contrasting hydrodynamic responses to atmospheric systems with different scales: Impact of cold fronts vs. that of a hurricane. J. Mar. Sci. Eng. 2020, 8, 979. [Google Scholar] [CrossRef]
  36. Needham, H.F.; Keim, B.D. A storm surge database for the US Gulf Coast. Int. J. Clim. 2012, 32, 2108–2123. [Google Scholar] [CrossRef]
Figure 1. Instrumental setup of the study site located on the southern Texas coast, northwestern Gulf of Mexico: The alongshore array of moored ADCPs is presented as magenta dots near to the 20 m isobaths for the north (N), center (C) and south (S). Selected NOAA weather stations and tidal gauges are shown as black squares, while the black triangles represent oceanographic buoys. Colored stars represent the maximum sustained wind speeds during the trajectory (black line) of Hurricane Harvey (source: NCDC NOAA).
Jmse 10 01722 g001
Figure 2. Time series from the 24th to the 31st of August 2017 of hourly averaged wind speeds (WSPD) and speed maxima (Gust) measured at the north (N), center (C), and south (S) weather stations (panels (ac), respectively). Zonal ( τ x ) and meridional ( τ y ) wind stresses (panels (d,e), respectively) were calculated for the three locations using the data from the closest Era-5 nodes to the weather stations. The bottom panels (f,g) present latitudinal variations of τ x and τ y during the study period, respectively; ADCP locations are indicated as dotted symbols as a reference. Note the lack of data at the northern weather station (panel a) due to disruptions caused by the hurricane’s impact. Shaded sections represent time periods affected by Harvey (25–26 August).
Jmse 10 01722 g002
Figure 3. Temporal sequence of the spatial distribution of the wind-stress curl (magnitude in color bar) overlapped with wind stresses (black arrows) during Hurricane Harvey’s trajectory near to the study site (ADCP locations are indicated by magenta dots). Subplots (ah) represent snapshots at 12 a.m. each day from the 24th to the 31st of August, respectively.
Jmse 10 01722 g003
Figure 4. Time series of hourly averaged parameters from the 24th to the 31st of August 2017: (a) wind-stresses; (b) significant wave heights; (c) water levels; (d) seawater temperature at 20 m depth; and depth-averaged (e) alongshore and (f) cross-shore current components for the north (N), center (C), and south (S). Note the use of different scales of magnitude in (e,f), and that wind stresses were plotted 3-hourly to avoid saturation.
Jmse 10 01722 g004
Figure 5. Time series between the 24th and 31st of August 2017 of: (a) meridional ( τ y ) and zonal ( τ x ) wind-stresses; (b) sea-water temperature; (c) depth-averaged alongshore, v ¯ , and cross-shore, u ¯ , velocities; and depth-varying (d) alongshore, V, and (e) cross-shore, U, velocities at the northern site (N). Negative velocities indicate southward and onshore flows. The shaded section denotes the period affected by the presence of hurricane Harvey.
Jmse 10 01722 g005
Figure 6. Time series between the 24th and 31st of August 2017 for (a) meridional ( τ y ) and zonal ( τ x ) wind stresses; (b) seawater temperature; (c) depth-averaged alongshore ( v ¯ ) and cross-shore ( u ¯ ) velocities; and depth-varying (d) alongshore (V) and (e) cross-shore (U) velocities at the central site (C). Negative velocities indicate southward and onshore flows. The shaded section denotes the period affected by the presence of Hurricane Harvey.
Jmse 10 01722 g006
Figure 7. Time series between the 24th and 31st of August 2017 for (a) meridional ( τ y ) and zonal ( τ x ) wind-stresses; (b) seawater temperature; (c) depth-averaged alongshore ( v ¯ ) and cross-shore ( u ¯ ) velocities; and depth-varying (d) alongshore (V) and (e) cross-shore (U) velocities at the southern site (S). Negative velocities indicate southward and onshore flows. The shaded section denotes the period affected by the presence of Hurricane Harvey.
Jmse 10 01722 g007
Figure 8. Time series between August 24th and 31st in 2017 for (a) significant wave heights (Hs) and wave spectra measured at the offshore buoys—(b) 42019 and (c) 42020 in the north, and (d) 42002 in the south—and at the nearshore ADCP moorings: (e) north, N; (f) center, C; and (g) south, S.
Jmse 10 01722 g008
Figure 9. Mean sea-level pressure (magnitude in color bar) and wind-stress (arrows) characteristics for (a) Hurricane Harvey a few hours before landfall and (f) a few hours after the peak of an intense cold front on the 2nd of March 2017. Time series of meridional ( τ y ) and zonal ( τ x ) wind stresses for the hurricane and the cold front are presented in panels (b,g) for the north (N) and (c,h) for the south (S), respectively. Panels (d,e) and (i,j) present depth-averaged alongshore ( v ¯ ) and cross-shore ( u ¯ ) flows for the northern (N) and southern (S) sites for the hurricane and cold front, respectively. The dark- and light-blue lines in (d,e) correspond to depth-averaged alongshelf and cross-shelf flows for the upper 20 m of the water column at 120 m depth obtained from the HYCOM global model for the closest nodes to N and S, respectively. Note the use of different depth-averaged current scales for the hurricane (d,e) and the cold front (i,j). Triangles in the time series denote the exact times at which (a,f) were captured.
Jmse 10 01722 g009
Figure 10. Current profiles across the water column during the velocity maxima in the north (N) and south (S), for hurricane Harvey (panels (a,d)) and the intense cold front (panels (b,e)), respectively. Panels (c,f) represent the velocity speeds for both events and their differences (purple line) in the north and south, respectively.
Jmse 10 01722 g010
Figure 11. Mean sea-level pressure (magnitude in color bar) and wind-stress (arrows) characteristics for (a) hurricane Harvey a few hours before landfall and (f) a few hours after the peak of an intense cold front on the 2nd of March 2017. Time series of significant wave heights (Hs) for the hurricane and the cold fronts are presented in panels (b,g) for the north (N) and (c,h) for the south (S), respectively. Panels (d,e) and (i,j) present the evolution of the wave spectra for the northern (N) and southern (S) sites for the hurricane and cold front, respectively. Triangles in the time series denote the exact times at which (a,f) were captured.
Jmse 10 01722 g011
Publisher’s Note: MDPI stays neutral with regard to jurisdictional claims in published maps and institutional affiliations.

