Abstract
Collision-risk measurements are crucial for ships, as they are necessary for collision avoidance decision making. However, collision risks between ships have not been quantified in unified standards. In this study, a critical collision index is proposed to describe the critical degree of collision risks between ships. Based on the field theory, a collision-risk field was introduced to build a field strength model based on the collision index. The model synthetically considers the influences of distance at closest point of approach, time to closest point of approach, and the relative bearing of coming ships. Moreover, the real time to the closest point of approach was used for describing the collision risk between ships. In addition, encounter situations and collision risks in the field were simulated using the field strength model and isorisk lines. The results are in agreement with the real collision-risk perceptions of Officers on Watch. It was shown that the proposed ship critical collision index can play an important role in ship collision avoidance and early warning systems.
1. Introduction
Due to the high probability and severe consequences of ship collisions, collision avoidance is among the major tasks of Officers on Watch (OOW). The measurement of collision risks and its use for early warning is among the main challenges for avoiding ship collisions [1].
Several techniques have been applied to assess collision risks to improve situational awareness. The core of this process is a collision-risk assessment that refers to the probability or likelihood of a collision. In studies related to maritime transportation engineering, a collision risk is supposed to be a product of the probability of the occurrence of an undesired collision event and the expected consequences in terms of human, economic, and environmental losses [2]. The most simple and widely applied approach in collision probability assessments originated from studies by Fujii et al. [3] and MacDuff [4]. Information such as accident and annual reports was used as a data source. Although ship collisions may cause severe consequences, they are relatively infrequent, which influences the reliability of the results. Hence, if a system and its probability distributions are known, the collision probability with given uncertainties can be obtained using Monte Carlo simulations [5]. Moreover, human and organizational factors [6] are the main causes, in accordance with a high percentage of reports. Therefore, a fault tree analysis (FTA) [7] and Bayesian network [8] were introduced to perform a deductive analysis of system failures, which integrated the knowledge of experts, historical data, accident causations, and their interrelationship. However, the obtained results are too macroscopic to be fit for OOW.
From a microscopic perspective, a ship domain [9] is the space around a ship that should not be invaded by other ships. Thus, a ship domain-based method is important for the risk analyses of ship collisions. It considers a point of time and space relationship among ships, and the obtained intrusion or overlap scenarios are usually utilized as criteria for collision candidate detection with traffic data, such as AIS data [10]. Similarly, the minimum distance to collision (MDTC) [2] was proposed to assess collision risks in different encounter situations, introducing the ship’s maneuverability. If the distance between two ships is less than MDTC, a collision is inevitable. Nevertheless, the methods based on ship domain with different shapes [11] and MDTC indicate potential over/underestimation of results due to different criteria parameter settings [12], and a quantitative evaluation of collision risks is inaccurate for any typical encounter situation identified by OOW [13].
The closest point of approach (CPA) and its parameters, such as distance at CPA (DCPA; distance at closest point of approach) and time to CPA (TCPA; time to closest point of approach), are still the most fundamental parameters for the OOW to determine the existence of a collision risk and the severity of a probable collision. This approach provides the linear projected spatial and temporal proximity between ships if the ships maintain their speeds and courses during encounter situations. When the value of DCPA or TCPA is smaller than a specified threshold, a collision is thought to be possible and an alarm is sent to the OOW. Nevertheless, DCPA and TCPA are two criteria with different dimensions. Therefore, the synthetic combination of DCPA/TCPA with a polynomial equation has been considered in collision-risk analyses [14] to estimate the collision-risk index (CRI). A generalized CRI is linearly merged with weights. To determine these weights, the experts’ knowledge was added using some techniques, such as fuzzy inference [15], which utilizes the fuzzy set theory to map the inputs to the outputs. In addition to polynomial models, nonlinear relationships, such as the Euclidean [16] and exponential [17] forms, were introduced to measure CRI. However, such collision criteria cannot express the details of collision processes, and give an explicit judgment regarding the occurrence of a collision.
Other study groups laid emphasis on calculating the set of the speeds or courses of an own ship (OS) that may lead to collisions with a target ship (TS). A collision alarm is triggered when the current motion of an OS is inside this set. For example, the velocity obstacle (VO) [18] reveals the possible velocities through which a collision might occur provided that the target keeps its state of motion. A similar idea involving the collision threat parameter area (CTPA) [19] could determine collision risks if the OS’s velocity falls into CTPA. The CTPA is an another form of TCPA/DCPA in the velocity space [20], and is identical to Linear-VO. Further, CTPA combined with ship domain [21] was developed as a replacement of the safe area. Furthermore, in the generalized velocity obstacle algorithm [22], the varying motion of target and ship maneuverability are considered. However, there is a variety of uncertainties for a moving obstacle, such as position, speed, and domain [23]. Errors exist between the predicted trajectory and the actual nonlinear trajectory of a ship in simplified dynamic models based on Taylor expansion [24].
It is critical to adopt certain criteria to determine collision risks and warn the OOW. The above-mentioned study proposed criteria combining DCPA and TCPA using the linear/nonlinear equation to improve the collision-risk determination to some extent. Still, no standard scales exist for measuring the critical degrees of real collisions. To solve this problem, a novel collision-risk field is introduced in this study to construct a critical collision model. The field theory was applied to study collision avoidance for ships. For example, the artificial potential field (APF) [25] generates a repulsive potential field around the obstacles and an attractive potential field at the destination to determine the OS’s motion [26]. However, most of the existing field models in maritime research are not used for risk analysis, but for path planning. The model is related to the movement elements, space positions, and relative bearings of target ships. Thus, this study aims to find a suitable field theory–based collision model that can handle the critical degrees of real collisions.
2. Materials and Methods
The collision-risk field is introduced based on the relative motion of the target ship in this section. Then, the computational formulas of collision-risk field are deduced in analogy with the gravitational field.
2.1. Relative Speed and Course
OOW usually judge the collision-risk probability between an own (O) ship and a target (T) ship in the relative motion mode. VO and CO denote the speed and course of the OS. VT and CT denote the speed and course of the target ship. Moreover, VR(TO) is the relative speed of the target ship with respect to the OS, and VR(OT) is the relative speed of the OS with respect to the target ship. When the speeds and courses of the own and target ships are known and constant, the relative speed (Vx) and relative course (COT) are invariable regardless of the ships’ positions, as shown in Figure 1.
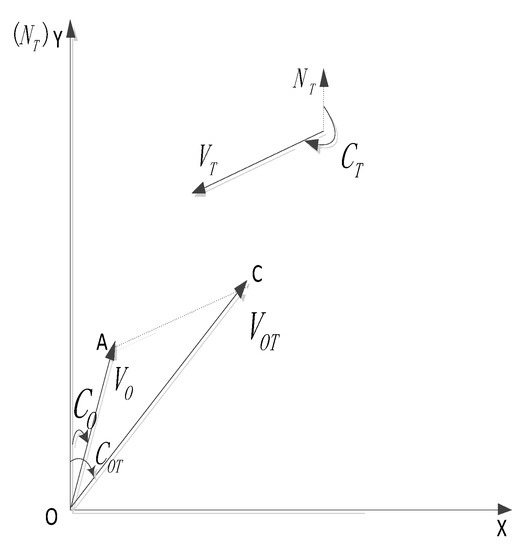
Figure 1.
Relative speed and course between own ship and target ship.
In Figure 1, the OS is located at the origin of the rectangular coordinate system. The Y-axis direction is north, and the X-axis direction is east. It is obvious that the vector is equal to . According to Equations (1) and (2), VOT and COT in the vector triangle OCA can be estimated using Equations (3) and (4), respectively.
2.2. Collision-Risk Field
The collision-risk field is put forward and is improved in view of ship collision avoidance in this section. The real collision risk index and isorisk index line are discussed subsequently.
2.2.1. Conceptual Proposal of Collision-Risk Field
A field is a physical quantity is assigned to every point in space by mean of a scalar, vector, or tensor. The distribution and variation of a physical quantity are normally tempting in physics. If a physical quantity is a scalar quantity, the field is called a scalar field and each point in the field corresponds to a certain value of this quantity, for example, electric potential field and temperature field. The field theory in physics is introduced in this section to construct the collision-risk field.
The collision-risk field is proposed to analyze and measure the collision-risk degree considering DCPA, TCPA, and the relative bearing of moving ships. A collision-risk value is expressed as a point in the field space. The collision risk is related to the relative speed and distance between an OS and a point. On one hand, the higher the relative speed of a target ship is, the higher the collision risk is. On the other hand, the larger the distance of target ship is, the lower the collision risk is. This field is similar to the universal gravitational field, replacing mass with the relative speed. According to the universal gravitational formula, the smaller the mass of objects and the farther the distance between them are, the smaller the gravitational attraction is. Therefore, the following definition and equation concerning the ship collision–risk field are introduced based on the universal gravitational field.
Definition 1.
Critical collision index (CCI).
CCI is the critical collision-risk degree between ships, and it ranges from 0 to +∞. When CCI is 0, no collision risk exists. Meanwhile, large values of CCI mean high collision probability and vice versa.
Definition 2.
Collision-risk field.
Once a target ship moves at a constant relative speed in a two-dimensional space field, it centers on the own ship. The field strength at a point in the field corresponds to CCI. This field is called collision-risk field.
The collision-risk field is similar to the gravitational field in physics, and thus, an elementary formula can be obtained through analogy, as shown in Table 1.

Table 1.
Analogy between the gravitational field and collision-risk field.
2.2.2. Improvement of Collision-Risk Field Formula
As mentioned previously, the field strength of a point is equal in any direction in the collision-risk field. In other words, when the relative speed is constant, the CCI of every point in the circle with radius R is the same, which obviously violates the perception of pilots. As shown in Figure 2, OS denotes the own ship. The relative speed of a target ship is VOT, and the relative speed of the OS is COT. NT denotes true north. If the target ship’s course and speed are constant, as shown in Figure 2, it travels in the circle with the center as OS and radius R; points A, B, C, D, E, F, and G represent positions of the target ship.
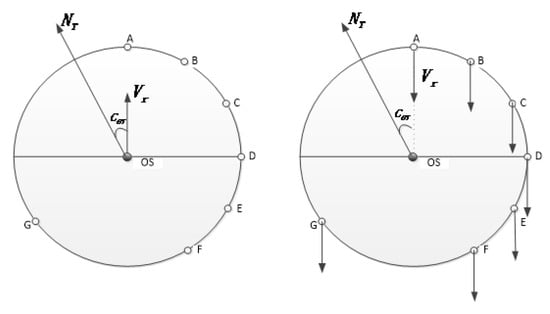
Figure 2.
Relative motion between own ship and target ship.
As shown in Figure 2, point A is directly in front of the OS, points B and C are located at the right-hand side of the OS’s moving direction, point D is the right abeam, and the rest of the points (E, F, and G) are behind the own ship. The motion pattern of the OS relative to the target ship is shown in Figure 2, whereas that of the target ship relative to the OS is shown in in Figure 2. It is obvious that the points behind do not put the OS at collision risk; thus, the CCI of points E, F, and G is zero for the target ship. Considering the dimensions, these target ship points are considered mass points in the sense of geometry. Moreover, the OS does not pose a collision risk to the target ship on the port beam and starboard beam. Thus, the CCI is zero for the target ship at point D. Nevertheless, the CCI is different for the target ship at points A, B, and C. The CCI is the highest for the target ship in the areas right ahead, and related areas. With an increase in the relative bearing of the OS, the CCI decreases until it becomes zero on the beam. Therefore, the OS detect the nearby areas as if it transmits the energy line before the beam in the collision-risk field centered on the OS, and the energy strength in every direction is uneven.
Hence, the definition of the collision-risk field was improved in this study, and its range, feature, and expression are described as follows:
(1) θ is the transmitting angle between the bearing and relative course of the target ship (i.e., ). The energy line is transmitted with the range in the collision-risk field centered on the OS.
(2) The collision-risk field has a bilateral symmetry and is not generated behind the beam of the OS.
(3) The coefficient of the transmitting strength is , which is a function of θ, as shown in Equation (5). Its ranges from 0 to 1. When θ is equal to zero, is equal to 1. In Equation (5), k is a shape parameter and its possible values are normally 1 to 3. The value of k is high when the duty officer’s collision risk perception is strong or the maneuverability of ship is poor.
(4) E represents CCI in the collision-risk field and is evaluated using Equation (6). When r is equal to zero, the OS will collide with the target ship, and E is infinite. When r is infinite, E is equal to zero. Hence, CCI ranges from zero to infinity.
The coordinate system of the collision-risk field is shown in Figure 3. The origin lies at the center of the OS, and the speed vector of the OS relative to the target ship constitutes the Y-axis passing through the origin. The X-axis is perpendicular to the Y-axis and passes through the origin. Thus, the origin represents the own ship, and the motion line of the target ship relative to the OS is parallel to the Y-axis. Presuming that a target ship is located at a point P with the coordinates (xp, yp) in the field, point A is the projection of P in the X-axis. Line PA is the relative motion line of the target ship at P relative to the OS, and the projection point A is the CPA from the target ship to the OS, which shows that the distance from the origin O to point A (dOA) in Equation (7) is DCPA from the OS to the target ship. The distance from point P to point A (dPA) in Equation (8) is the distance from the target ship to the CPA, which is the product of time taken to achieve TCPA and relative speed Vr. In general, DCPA and TCPA are important factors for judging the criticality of ship collisions. When DCPA is in a certain range, small TCPA and DCPA values can signify a high risk degree. Meanwhile, DCAP has a larger influence on the risk degree than TCPA.
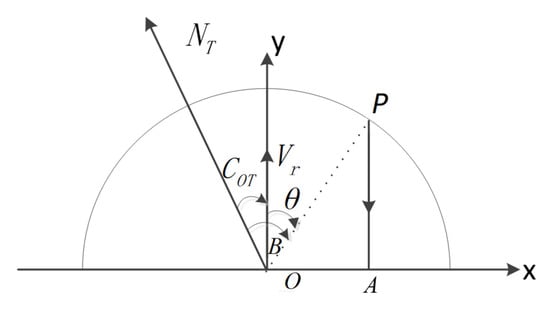
Figure 3.
Coordinate system of collision risk field.
Equations (7) and (8) indicate that the risk index at a point in the collision-risk field is related to the coordinate value at this point.
2.2.3. Real Collision-Risk Index
Definition 3.
Real collision.
The OS and target ship are considered two mass points, and their dimensions are ignored. When the direction of the relative motion line of the target ship directly points at the OS, it is regarded that a real collision between the two ships can occur.
Definition 4.
Real TCPA (RTCPA).
If the target ship and OS do not take measures to avoid collision, a real collision can eventually occur. The time taken to navigate the target ship to the point of collision is called the Real TCPA (RTCPA) in such conditions.
Definition 5.
Real collision risk index (RCSI).
RCSI is the degree of collision between the OS and target ship in the condition described in Definitions 3 and 4. Figure 3 shows that any target ship P on the Y-axis (0, yp) can collide with the OS. According to Equations (5) and (6), the E of point (0, yp) is as follows:
In accordance with Equation (8), the following Equations (10) and (11) can be obtained.
It is seen that RCSI is only related to RTCPA from Equations (8) and (11) when the target ship is on the Y-axis. A larger RTCPA exhibits a smaller real collision risk for a target ship on the Y-axis, and vice versa.
2.2.4. Isorisk Index Line
Similar to the isothermal line in the temperature field, the isorisk index line exists in the collision-risk field. The isorisk index line is the line connecting the isorisk index points in the field, and it is clear that all the points in the isorisk index line have the same risk degree.
In Equation (11), a point on the Y-axis in the field corresponds with a unique risk value EP. If the distance and bearing of a point are r and θ from the origin, respectively, the risk value E of this point in the space is shown in Equation (6). According to the definition of the isorisk index line, Ep is equal to E. Hence, the formula of the isorisk index line can be deduced using Equation (12).
It is seen that E and the corresponding line are confirmed with the defined RTCPA from Equation (12). Presuming that Vr is 12 kn and k is 2, E is 36, 9.0, 4.0, 2.3, 1.4, and 1.0 under RTCPA from 10, 20, 30, 40, 50 to 60 min, as described in Figure 4.
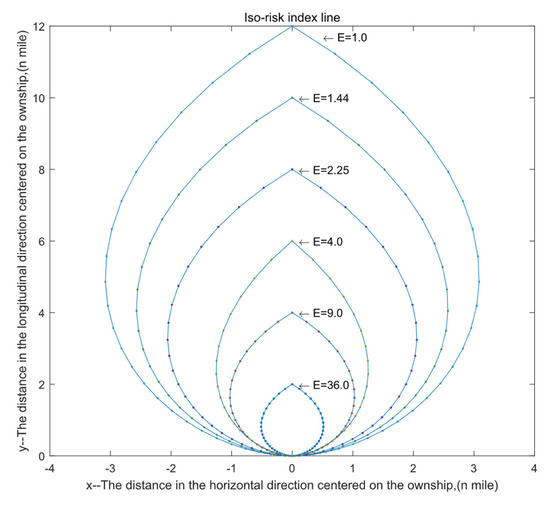
Figure 4.
Isoriskigurei index line.
The isorisk index line displays the flame shape in Figure 4. An isorisk index line was chosen for analysis, as shown in Figure 5. From P1 to P5, DCPA gradually increases to indicate the decreasing risk, while TCPA gradually decreases to indicate the increased risk. Because DCPA has a greater influence on the collision risk than TCPA, TCPA presents a steeper falling range to keep the same CCI. At P6, DCPA reaches a certain extent, and the decreasing TCPA cannot change the CCI value. Therefore, from P6 to P9, DCPA and TCPA both decrease to indicate the increasing CCI. To keep up with CCI, the Y-axis value of the point is reduced with small amplitude, and θ increases toward the beam to lower the risk. It can be perceived that the trend of the isorisk index line is consistent with that of the risk perception of pilots.
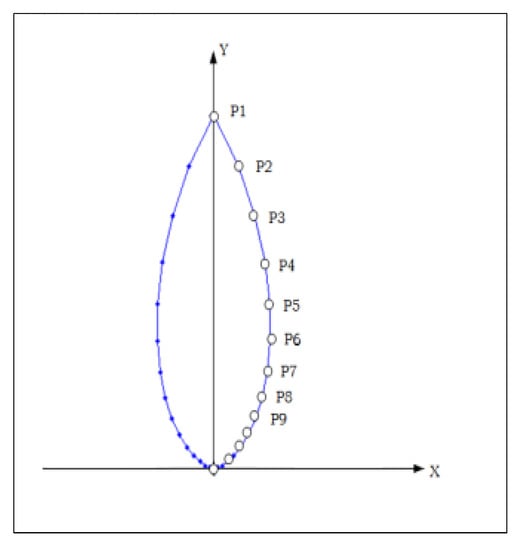
Figure 5.
Isorisk index line.
3. Results
The CCI field of the target ship exists relative to the OS, as long as the relative speed is not zero. Every target ship has a CCI field. According to the position of the target ship in the space, E can be estimated with a certain value as shown in Figure 6. Any CCI in the field can be expressed with RTCPA. According to the isorisk index line in Section 2.2 the CCI of a point B on the relative line is equal to E in the field. When a target ship is situated at the point, a real collision will happen between the target ship and OS. Therefore, the CCI of a target ship at any point in space can be measured by RTCPA.
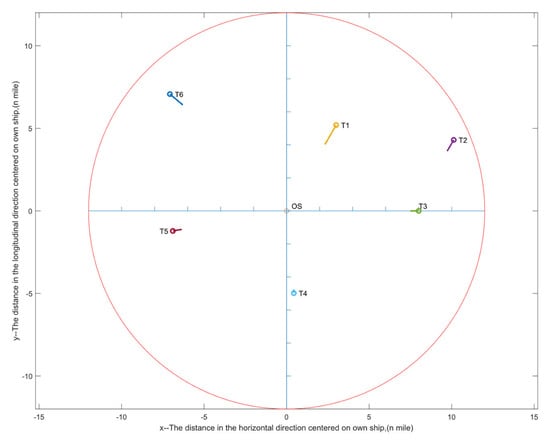
Figure 6.
Multiship encounter situation.
Motion data of target ships are listed in Table 2 while CCI of target ship is obtained. For example, VOT of T1 is 29.4 according to Equation (3) and its COT is 030° according to Equation (4) when the Speed, Course, Distance and Bearing is 17 kn, 240°, 6 n mile and 030°. E of T1 is 24.0 with k = 2 according to Equation (6). RTCPA of T1 is 12.2 minutes as the invert of square root of E according to Equation (11) because E is equal to Ep.
Table 2.
Motion data of target ship.
As seen in Table 3, the sequence of E of the target ships is T1 (24.0), T6 (4.0), T5 (2.6), T3(1.7), T4(0.1), and T2(0.42) from high to low, where the highest is T1. Owing to the smallest DCPA and TCPA, T1 is the most dangerous ship to the OS. The DCPA of T6 is 0.9 n mile, and there is a collision risk between this ship and the OS. However, its TCPA is 27.3 min and just lower than T1, which shows a low collision risk. The DCPA of T3 is 0.0 n mile, and its TCPA is 45.3 min, which also proves the lower E. The E of T2 is very low because its DCPA is 7.0, which is a far distance. Similarly, the long period of TCPA 99.6 min of T4 reveals its low risk, although its DCPA is only 0.4 n miles at a short range. Hence, based on the DCPA and TCPA values, the risk sequence is T1, T6, T5, T3, T4, and T2, which is the same as the risk sequence based on E. RTCPA is used to represent the collision risk E and shows the same sequence as E and more significant differences on the value, as listed in Table 3. Thus, RTCPA is a reasonable and intuitional risk assessment index.
Table 3.
CCI of target ship.
4. Discussion
The field strength of a point in a field expresses the CCI of a target ship relative to an OS and displays the collision-risk degree between the target ship at the point and OS by OOW’s perception. Such perception normally coincides with the following rules:
(1) When DCPA is constant, a smaller TCPA shows a high risk, and vice versa.
(2) When DCPA is below a certain limit, increasing DCPA can decrease the collision risk, and vice versa.
(3) When DCPA exceeds certain limits and TCPA is merely decreased, the risk degree cannot change.
(4) When DCPA and TCPA are decreased, the risk is increased. Nevertheless, when θ is increased toward the beam in the risk field coordinate system, the target ship’s risk is diminished.
According to the results of Section 3, CCI can synthesize the ship motion parameters in encounter situations to describe the above-mentioned risk features. Thus, the CCI based on the field theory provides an approach quantifying the ship’s collision risk. Once the CCI of a target ship exceeds a specified threshold, the ship enters the dangerous area surrounding the isorisk index line and triggers a collision alarm. For instance, in a scenario, RTCPA is 20 min, and the specified risk threshold alert is 9. When a target ship approaches a limit line with E 9, a collision warning is activated. Because of the forewarning, more attention is paid to the target ship, and avoidance measures can be taken. Meanwhile, the area bound by the threshold line of every target ship is just like the ship domain. In spite of the bearing of entering the limit, the OS should take evasive actions to keep a safe distance and avoid collision. Of course, even if a fixed forewarning threshold is set up, the scope of the area by the isorisk index line changes based on the target ship and encounter situation.
Moreover, CCI can be utilized to avoid collision. A minimum DCPA is often defined as the distance of safe closest point of approach (DSPA). After two ships take action to avoid collision, their DCPA values should be more than their DSPA values. Otherwise, the taken actions are deemed unsuccessful. DSPA is usually set as 2-n mile in open waters. A stated DSPA signifies that the corresponding limit of CCI is also ascertained. An isorisk index line is displayed, tangent to the line of DSPA 2.0 n mile. The Emax corresponding to the isorisk index line is the critical risk value with DSPA.
5. Conclusions
In ship collision avoidance and automatic collision avoidance systems, collision avoidance analysis and CCI measurements are fundamental. In this work, with the aim of constructing a CCI formula, the field theory in physics was introduced, and the risk field was used. The CCI formula is related to several factors, such as DCPA, TCPA, and the relative bearing of coming ships. The isorisk index line was attained by analyzing CCI in the field. Finally, the field strength formula was used to simulate the encounter conditions of two or more vessels. The results showed that RTCPA in the field strength formula is valid for quantifying collisions, and that it corresponds with the perceptions of pilots. On one hand, RTCPA can describe the collision risks between ships in a field. On the other hand, the safe boundaries for forewarning and collision avoidance can be mapped out with defined RTCPA thresholds. In the future, we aim to develop a ship decision-making model for collision avoidance by adding the domain and dimension based on the risk field.
Author Contributions
Conceptualization, W.M. and S.W.; methodology, W.M.; software, H.W.; validation, W.M.; formal analysis, H.W.; investigation, S.W.; resources, W.M. and H.W.; data curation, S.W.; writing—original draft preparation, W.M.; writing—review and editing, H.W. and S.W.; visualization, S.W.; supervision, H.W.; project administration, W.M. and S.W.; funding acquisition, H.W. and W.M. All authors have read and agreed to the published version of the manuscript.
Funding
This research was funded by the National Natural Science Foundation of China (52231014), Special projects in key fields of artificial intelligence of ordinary colleges and universities in Guangdong Province (2019KZDZX1035), Science and Technology Program of Zhanjiang (2019A01041) and Hubei Key Laboratory of Inland Shipping Technology (NHHY2020002), China Scholars Council Program (202208440272).
Institutional Review Board Statement
Not applicable.
Informed Consent Statement
Not applicable.
Data Availability Statement
Not applicable.
Conflicts of Interest
The authors declare no conflict of interest.
References
- Chen, P.; Huang, Y.; Mou, J.; van Gelder, P. Probabilistic risk analysis for ship-ship collision: State-of-the-art. Saf. Sci. 2019, 117, 108–122. [Google Scholar] [CrossRef]
- Montewka, J.; Hinz, T.; Kujala, P.; Matusiak, J. Probability modelling of vessel collisions. Reliab. Eng. Syst. Saf. 2010, 95, 573–589. [Google Scholar] [CrossRef]
- Fujii, Y.; Yamanouchi, H.; Mizuki, N. On the fundamentals of marine traffic control. Part 1 probabili-ties of collision and evasive actions. Electron. Navig. Res. Inst. Pap. 1970, 2, 1–16. [Google Scholar]
- Macduff, T. The probability of vessel collisions. Ocean. Ind. 1974, 9, 144–148. [Google Scholar]
- Shah, B.C.; Švec, P.; Bertaska, I.R.; Sinisterra, A.J.; Klinger, W.; von Ellenrieder, K.; Dhanak, M.; Gupta, S.K. Resolution-adaptive risk-aware trajectory planning for surface vehicles operating in congested civilian traffic. Auton. Robot. 2015, 40, 1139–1163. [Google Scholar] [CrossRef]
- Ren, J.; Jenkinson, I.; Wang, J.; Xu, D.; Yang, J. A methodology to model causal relationships on offshore safety assessment focusing on human and organizational factors. J. Saf. Res. 2008, 39, 87–100. [Google Scholar] [CrossRef]
- Uğurlu, Ö.; Köse, E.; Yıldırım, U.; Yüksekyıldız, E. Marine accident analysis for collision and grounding in oil tanker using FTA method. Marit. Policy Manag. 2015, 42, 163–185. [Google Scholar] [CrossRef]
- Montewka, J.; Ehlers, S.; Goerlandt, F.; Hinz, T.; Tabri, K.; Kujala, P. A framework for risk assessment for maritime transportation systems—A case study for open sea collisions involving RoPax vessels. Reliab. Eng. Syst. Saf. 2014, 124, 142–157. [Google Scholar] [CrossRef]
- Goodwin, E.M. A Statistical Study of Ship Domains. J. Navig. 1975, 28, 328–344. [Google Scholar] [CrossRef]
- Rawson, A.; Rogers, E.; Foster, D.; Phillips, D. Practical Application of Domain Analysis: Port of London Case Study. J. Navig. 2014, 67, 193–209. [Google Scholar] [CrossRef]
- Szlapczynski, R.; Szlapczynska, J. Review of ship safety domains: Models and applications. Ocean Eng. 2017, 145, 277–289. [Google Scholar] [CrossRef]
- Goerlandt, F.; Kujala, P. On the reliability and validity of ship–ship collision risk analysis in light of different perspectives on risk. Saf. Sci. 2014, 62, 348–365. [Google Scholar] [CrossRef]
- Zhang, J.; Yan, X.; Chen, X.; Sang, L.; Zhang, D. A novel approach for assistance with anti-collision decision making based on the International Regulations for Preventing Collisions at Sea. Proc. Inst. Mech. Eng. Part M J. Eng. Marit. Environ. 2012, 226, 250–259. [Google Scholar] [CrossRef]
- Wang, X.; Liu, Z.; Cai, Y. The ship maneuverability based collision avoidance dynamic support system in close-quarters situation. Ocean Eng. 2017, 146, 486–497. [Google Scholar] [CrossRef]
- Bukhari, A.C.; Tusseyeva, I.; Lee, B.-G.; Kim, Y.-G. An intelligent real-time multi-vessel collision risk assessment system from VTS view point based on fuzzy inference system. Expert Syst. Appl. 2013, 40, 1220–1230. [Google Scholar] [CrossRef]
- Lisowski, J. Game Control of Moving Objects. IFAC Proc. Vol. 2002, 35, 373–378. [Google Scholar] [CrossRef]
- Mou, J.M.; van der Tak, C.; Ligteringen, H. Study on collision avoidance in busy waterways by using AIS data. Ocean Eng. 2010, 37, 483–490. [Google Scholar] [CrossRef]
- Degré, T.; Lefèvre, X. A Collision Avoidance System. J. Navig. 1981, 34, 294–302. [Google Scholar] [CrossRef]
- Lenart, A.S. Collision Threat Parameters for a new Radar Display and Plot Technique. J. Navig. 1983, 36, 404–410. [Google Scholar] [CrossRef]
- Chen, P.; Huang, Y.; Mou, J.; van Gelder, P. Ship collision candidate detection method: A velocity obstacle approach. Ocean Eng. 2018, 170, 186–198. [Google Scholar] [CrossRef]
- Szlapczynski, R.; Szlapczynska, J. An analysis of domain-based ship collision risk parameters. Ocean Eng. 2016, 126, 47–56. [Google Scholar] [CrossRef]
- Huang, Y.; Chen, L.; van Gelder, P.H.A.J.M. Generalized velocity obstacle algorithm for preventing ship collisions at sea. Ocean Eng. 2019, 173, 142–156. [Google Scholar] [CrossRef]
- Zhang, W.; Wei, S.; Teng, Y.; Zhang, J.; Wang, X.; Yan, Z. Dynamic Obstacle Avoidance for Unmanned Underwater Vehicles Based on an Improved Velocity Obstacle Method. Sensors 2017, 17, 2742. [Google Scholar] [CrossRef] [PubMed]
- Huang, Y.; Chen, L.; Chen, P.; Negenborn, R.R.; van Gelder, P.H.A.J.M. Ship collision avoidance methods: State-of-the-art. Saf. Sci. 2020, 121, 451–473. [Google Scholar] [CrossRef]
- Khatib, O. Real-Time Obstacle Avoidance for Manipulators and Mobile Robots. In Autonomous Robot Vehicles; Cox, I.J., Wilfong, G.T., Eds.; Springer: New York, NY, USA, 1990; pp. 396–404. [Google Scholar] [CrossRef]
- Lyu, H.; Yin, Y. COLREGS-Constrained Real-time Path Planning for Autonomous Ships Using Modified Artificial Potential Fields. J. Navig. 2018, 72, 588–608. [Google Scholar] [CrossRef]


Publisher’s Note: MDPI stays neutral with regard to jurisdictional claims in published maps and institutional affiliations. |
© 2022 by the authors. Licensee MDPI, Basel, Switzerland. This article is an open access article distributed under the terms and conditions of the Creative Commons Attribution (CC BY) license (https://creativecommons.org/licenses/by/4.0/).