Abstract
FETSWCM-SWAN and DualSPHysics models are used to study the storm flooding process of Dazuo Seawall in Quanzhou city, Fujian province, China. Firstly, a storm over-topping assessment method is proposed. Secondly, the water level and storm wave at the foot of Dazuo Seawall calculated by FETSWCM-SWAN during the process of Typhoon Usagi in 2013 and Typhoon Dujuan in 2015. Finally, the typical wave and storm run-up processes at Dazuo Seawall are modeled by DualSPHysics. The results show that the typical wave run-up of Dazuo Seawall is less than 2 m, but the storm wave run-up can reach 6.85 m under Usagi. The risk is high when high tide is encountered. The risk of storm flooding is classified into three grades. This risk assessment could provide decision-making support to government departments in warning against storm flooding threats.
1. Introduction
A seawall is a type of water-retaining structure built on the shoal in estuaries and coastal areas to prevent tidal and wave invasion. Seawalls play an important role in ensuring the sustainability of economic development and public safety in southeastern coastal areas of China, where typhoons and stormsurges are frequent. Such disasters occur when waves pass over the seawall and a surge of seawater floods inland. Predicting the over-topping of seawalls and warning of flooding disasters caused by storms are important responsibilities of the government.
Flooding in coastal areas is commonly caused by a combination of the extremely high-water levels of storm tides and the overflow of large waves. It is necessary to consider the comprehensive influence of storm surge, astronomical tide level, and wave run-up at the seawall as storms develop so as to determine whether seawater will overflow the seawall and issue an early warning.
Accurate forecasting of the seawater level and the storm wave is one of the major tasks in storm flooding forecasting. Wave-flow models consider astronomical tides, storm surges, waves, and the interactions among them to achieve accurate calculations. Wave-flow models such as ROMS+SWAN [1], ADCIRC+SWAN [2,3,4], FVCOM_SWAVE [5], and FETSWCM-SWAN [6] have been well verified and applied offshore.
Calculating the storm wave run-up height at the seawall is the other task in a storm flood warning. Water runs up at the seawall by the action of waves, and the wave run-up height is measured from the normal sea level. Simulating wave run-up is complicated due to the fluid–structure interaction. There are four ways to calculate wave run-up: theoretical analysis, physical model tests, field observation, and numerical simulation.
Saville [7] proposed a formula to calculate wave run-up height based on an experimental study of a physical model in 1956. Iwagaki [8] studied irregular wave run-ups and proposed a formula for wave run-up height in 1977. Van Der Meer [9] proposed a formula to calculate the mass of wave over-topping and wave run-up height based on the experimental results of sloped seawalls in 1992. Duan [10] proposed the Putian formula to calculate wave run-up height according to six years of observation at the seawall of Putian, China. In 2002, the Technical Advisory Committee on Water Defense of the Netherlands proposed equations to calculate wave run-up and over-topping that take into account the influence of foreshore and shallow foreshore, roughness, slope, and wave angle. However, the above-mentioned formulas are complicated. Some correlation formulas based on observations at specific seawalls have been proposed [11,12], which are easy to compute but only valid for the specified seawalls.
Numerical wave tanks, with high precision and avoiding the scale-effect limitations of physical wave tanks, have been applied extensively to study wave propagation and wave–structure interaction [13,14,15]. Wave generation, wave elimination, and complex boundary dynamics are the major tasks in establishing a numerical wave tank [16,17]. To investigate wave run-up height, DualSPHysics, a platform of smoothed-particle hydrodynamics (SPH), is employed to simulate the wave action on Dazuo Seawall in the present study [18].
This paper is organized into four sections. Section 1 is the introduction. Section 2 describes the model setup, including study area and storm cases, the parameterization scheme adopted by the DualSPHysics model and FETSWCM-SWAN, and a two-way model coupling FETSWCM and SWAN. Section 3 describes the numerical results, including water level simulation, wave simulation and wave over-topping simulation during regular and typhoon periods. Section 4 presents the main conclusions of this work.
The aim of this paper is to conduct numerical experiments to quantitatively explore the typical wave and storm run-up processes at Dazuo Seawall during two super typhoons.
2. Models and Methods
2.1. Study Area and Storm Cases
Dazuo Seawall of Quanzhou City lies to the southeast of China, which suffers frequent storm disasters. Fujian Chongwu Dazuo Seawall (Figure 1) is located in Chongwu County, Quanzhou City, Fujian Province. It is a stepped seawall with a step-shaped cement-block protecting surface. The steps are 0.250-m high and 0.175-m wide, and the water level in front of the embankment is constant at 10 m. The seawall slope height is 8.2 m, the seawall inclination is 55°, and there is a 2-m vertical wave wall at the top of the seawall.
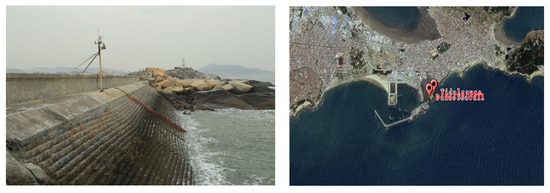
Figure 1.
Location of Dazuo Seawall, the tidal gauge of Chongwu.
In this paper, strategies for storm over-topping assessment are proposed, and the storm wave processes at the Dazuo Seawall during Typhoon Usagi in 2013 and Typhoon Dujuan [19] in 2015 are studied. These two typhoons were both designated as super typhoons and made landfall on the southeast coast of mainland China in 2013 and 2015, respectively, and their paths are shown in Figure 2.
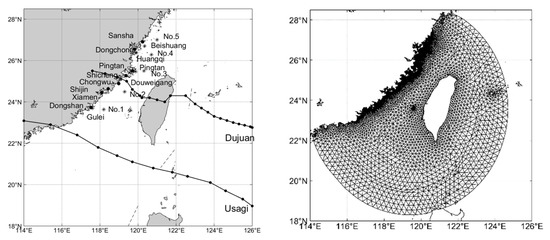
Figure 2.
Location of tidal stations and wave buoys (left) and mesh grid (right).
Typhoon Usagi, the 19th typhoon of 2013, was generated in the northwest Pacific Ocean, east of the Philippines, at 02:00 CST on 17 September. The maximum wind speed near its center was 18 m/s, and the minimum central pressure was 1000 hPa at that time. It then went westward slowly and upgraded to a super typhoon at 18:45 CST on 18 September. At that time, the maximum wind speed near its center was 52 m/s, and the minimum pressure at the center was 930 hPa. After that, Usagi continued to move northwest and made landfall near the southern coast of Shanwei City, Guangdong Province, at 19:40 CST on 22 September. The maximum wind speed near its center was 45 m/s, and the minimum pressure at the center was 940 hPa when landing.
Typhoon Dujuan, the 21st typhoon of 2015, was generated in the northwest Pacific Ocean on 23 September. The maximum wind speed near its center was 18 m/s, and the minimum central pressure was 998 hPa at that time. It then went westward slowly and upgraded to a severe tropical storm at 17:00 CST on 24 September. At that time, the maximum wind speed near its center was 25 m/s, and the minimum pressure at the center was 985 hPa. Dujuan was upgraded to a typhoon at 17:00 CST on 25 September, with a maximum wind speed near its center of 33 m/s and a minimum central pressure of 975 hPa. It was upgraded to a super typhoon at 8:00 CST on 27 September, with a maximum wind speed near its center of 55 m/s and a minimum central pressure of 930 hPa. Dujuan then moved westward and made landfall near Xiuyu District, Putian City, at 09:00 CST on 29 September. The maximum wind speed near its center was 33 m/s, and the minimum pressure at the center was 975 hPa when landing.
2.2. FETSWCM-SWAN Model
FETSWCM-SWAN, a two-way model coupling FETSWCM and SWAN established by the Storm Surge Research Group of Xiamen University (China), has been used to study the interaction of astronomical tide, storm surge, and typhoon waves in the middle part of Taiwan Strait and the coast of Fujian province [12]. FETSWCM, or Finite Element Tide Storm surge Wave Coupled Model, is a two-dimensional hydrodynamic model based on a specific typhoon wind model. SWAN [19], a third-generation wave model developed at Delft University of Technology (The Netherlands), computes random, short-crested, wind-generated waves. FETSWCM passes on the water levels and currents to SWAN and then computes with the radiation stress gradients feedback from SWAN in the next time step.
The model is forced by the modified wind model, which is considered influenced by the terrain of the Strait and Taiwan Island [20] the typhoon pressure field adopts the Holland pressure model [21]. The calculation time step of the SWAN model is 900 s, the spectral distribution is 360°, the direction step is 3°, and the discrete frequency is 0.125 Hz. The selected physical processes are wave shallowing, refraction, bottom friction, crushing, and three-phase wave nonlinearity. The calculated minimum water depth is set to 0.5 m, and the wind field, water level and flow field are jointly driven.
Water levels were recorded at eight tide gauge stations, and the wave heights were recorded at ten wave buoys. The locations of the tidal stations (solid circles) and wave buoys (open circles) are shown in Figure 2.
In FETSWCM mode, the governing equations are in Cartesian coordinates. In the GWCE equation under the system (Generalized Wave Continuity Equation) and VIMEs equations (Vertically Integrated Momentum Equations), the oxy surface of the coordinates is the same as the static sea surface. The x-axis points to the east, the y-axis points to the north, and the z-direction is positive.
The equation expression is as follows:
This paper takes the seawall along the coast of Fujian as the main research object, and the water depth distribution in the study area is shown in Figure 2. The computational domain is divided by triangular meshes; the resolution of the open boundary mesh is 30 km, the average resolution of the Fujian coastal mesh is 1 km, and the highest resolution is 100 m, with a total of 11,802 mesh nodes and 20,448 triangular meshes. The water depth of the computational domain is interpolated by etop2-1min water depth data in the open sea. The open boundary tidal drive is taken from the global tidal model NAO99b model [22].
Using the FETSWCM-SWAN model to simulate 5 typhoons that made landfall or affected Fujian Province in the Taiwan Strait during 2013–2015, The quasi-mean absolute error of the significant wave heights at ten buoy stations is 0.70 m [12].
2.3. DualSPHysics Model
DualSPHysics [23] is an open-source program developed at Universidade de Vigo (Spain) and the University of Manchester (UK) that uses the SPH method to deal with real-life engineering problems, which can be run on either CPUs or GPU cards. DualSPHysics simulates free-surface flow phenomena where Eulerian methods can be difficult to apply, such as waves or the impact of dambreaks on offshore structures. DualSPHysics has been applied to study wave run-up on a real armor block coastal breakwater [24,25,26] and evaluate wave impacts on coastal structures [27,28,29].
SPH is a gridless method established based on the Lagrangian system, and its calculation process does not depend on the calculation grid.
N-S(Navier–Stokes) equation derived by the SPH form is
And the continuity equation is:
In the numerical simulation, a Quintic kernel was set [30], and the initial particle spacing was set to 0.02 mm, which resulted in 2-D cases smoothing length of 0.034 m. The second-order wave generation solution [31], dynamic boundary condition (DBC) [32], The active wave absorption system (AWAS) [33], and Symplectic algorithm [34] integrate variables in time are adopted.
3. Results and Discussion
3.1. Water Level Simulation
The water level was simulated by FETSWCM-SWAN during the Usagi and Dujuan typhoons, which were influenced by the combination of tide and storm surge. The observed and simulated water levels are shown in Figure 3 and Figure 4, where it is obvious that FETSWCM-SWAN could simulate both the magnitude and phase of the real tide surge. The semi-diurnal tide is predominated in the central and northern parts of the Fujian coast, and the tide simulation has a higher accuracy, whereas the tide is irregular semi-diurnal at the southern Fujian coast, which has a more complex tidal process and is more difficult to simulate accurately.
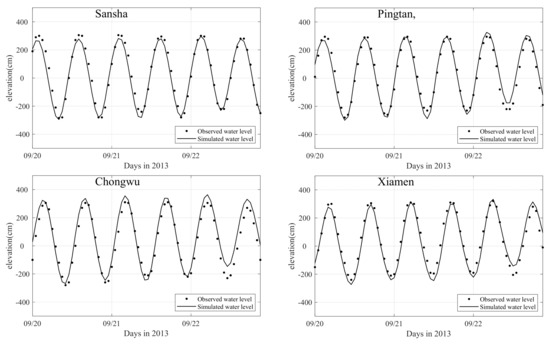
Figure 3.
Comparison of water level simulations and observations along the Fujian coast during Typhoon Usagi.
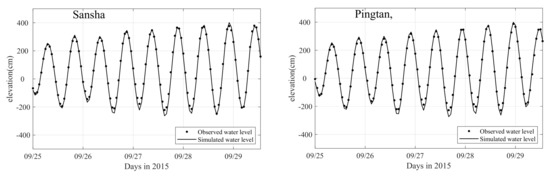
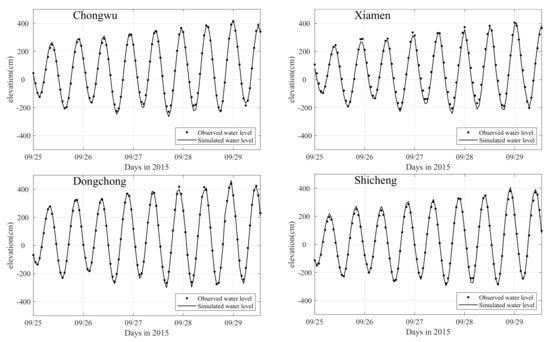
Figure 4.
Comparison of water level simulations and observations along the Fujian coast during Typhoon Dujuan.
These above results suggest that the FETSWCM-SWAN model can well-simulate hydrodynamic processes during storm periods.
In summary, the FETSWCM-SWAN model is successful in the simulation of the tide level near Fujian during typhoons.
3.2. Wave Simulation
Significant waves are simulated by FETSWCM-SWAN during the process of Usagi and Dujuan, which considers the effects of tide and storm surge. The observed and simulated wave values are shown in Figure 5 and Figure 6. The waves exceed 6 m in the central area of the Taiwan Strait, benefiting from the average water depth of 50 m. As the water becomes shallow near the shore, the wave heights decrease to approximately 2 m due to wave deformation and breaking. The waves oscillate in the tidal period at the nearshore area as a result of being affected by tides. The FETSWCM-SWAN model incorporates the effect of tidal current and tidal water level on wave action, which leads to agreement between the wave simulation and observations.
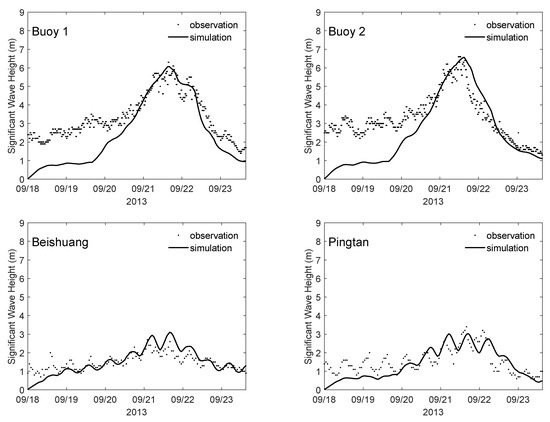
Figure 5.
Comparison of significant wave height simulations and observations along the Fujian coast during Typhoon Usagi.
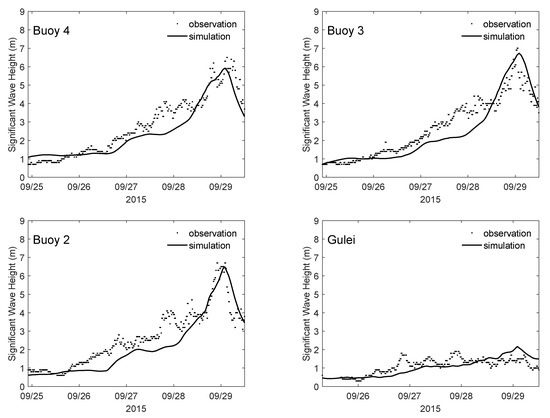
Figure 6.
Comparison of significant wave height simulations and observations along the Fujian coast during Typhoon Dujuan.
According to the observed results at buoys No. 1 and No. 2 in Figure 5, the wave height was approximately 2 m in the middle of the Taiwan Strait before Usagi developed. Other meteorological factors independent of the storm are not taken into account in FETSWN-SWAN, which causes an underestimation of wave height in the early process of Usagi.
The nearshore wave observations showed obvious tidal periodic oscillation, which was considered an effect of tidal action. The FETSWCM-SWAN model incorporates such wave–tide interactions. Therefore, the simulation results are in good agreement with the observations.
3.3. Typical Wave Run-Up Simulation
Water runs up at the seawall by the action of waves, and the wave run-up height is measured relative to the still sea water level. The simulation of wave run-up is complicated, as it involves fluid–structure interactions. According to the size and real sea conditions around Dazuo Seawall, an SPH numerical flume with a stepped slope is designed, as shown in Figure 7. The flume is 200 m in length and 20 m in height, and the water depth is 10 m. On the left side of the flume is the seawall with steps at a slope of 55°, which is 9.95 m in total height considering the vertical wall on the top. The left side of the flume is the wavemaker.
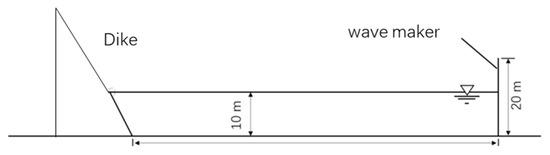
Figure 7.
Initial setup of the SPH flume of Dazuo Seawall.
Typical waves were determined by analyzing those observed at a distance of 100-m away from Dazuo Seawall over three months. The significant wave height with the highest frequency was 0.76 m and 5.29 s, and the significant wave height with a cumulative frequency of 65% was 1.24 m and 7.03 s.
The Active Wave Absorption System is implemented in DualSPHysics to eliminate the secondary reflected waves at the wavemaker by adjusting the boundary conditions of the numerical wave flume. As the typical waves were of intermediate height, regular and irregular waves were generated in accordance with Stokes’ second-order wave theory in DualSPHysics. To define the sea state, three-month wave data are measured in a buoy 100 m from the dike toe. The typical wave run-ups are simulated using the conditions of typical waves, which are set as follows (Table 1).

Table 1.
Typical wave conditions and maximum wave run-up heights.
The regular and irregular wave run-ups at Dazuo Seawall are shorter than 2 m, and the averaged high tide in the adjacent area is 3.73 m, according to Li’s analysis of tide data over 50 years [24]. Considering the height of Dazuo Seawall is 8.2 m, wave over-topping will not happen even when a typical wave is encountered during high tide. Thus, the design of Dazuo Seawall meets the protection requirements of typical waves.
Figure 8 and Figure 9 show the wave run-up time series of regular and irregular waves calculated by SPH mode under the typical incident wave conditions, respectively.
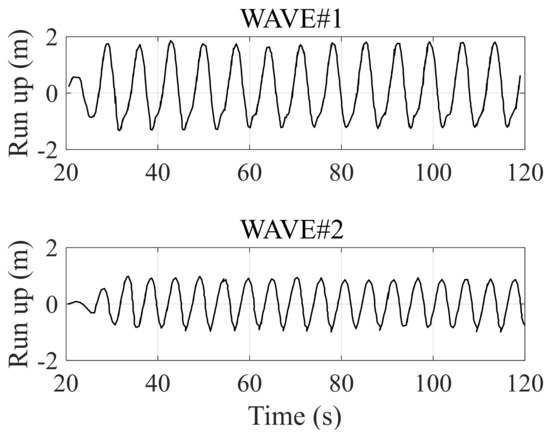
Figure 8.
Wave run-up time series of regular Wave#1 and Wave#2.
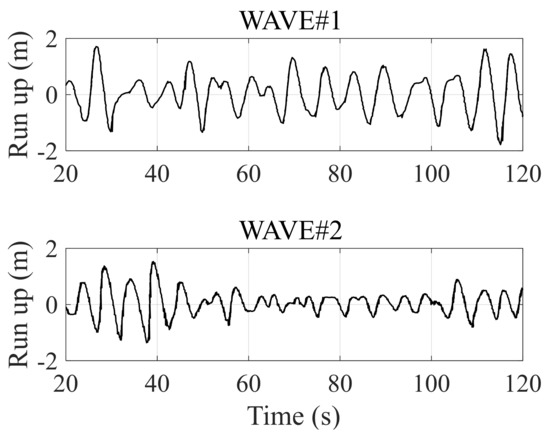
Figure 9.
Wave run-up time series of irregular Wave#1 and Wave#2.
3.4. Storm Over-Topping Simulation
The storm tides and the significant wave heights at the foot of Dazuo Seawall are simulated by FETSWCM-SWAN. As is shown in Figure 10, the significant waves show oscillation in the tide period that is two to four hours later than the tide phase, which was due to the interaction of tide and wave action.
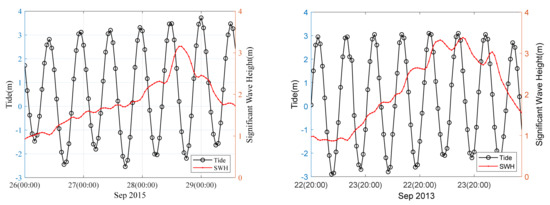
Figure 10.
Water level and significant wave height (SWH) simulations at Dazuo Seawall during typhoons Usagi (left) and Dujuan (right).
Eight sets of experiments are conducted according to the simulation of wave heights and tide levels three days before the landfall of both typhoons. As shown in Table 2 and Table 3, Exp 1 stands for the conditions at the time of the largest significant wave; Exp 2 stands for the conditions at the time of the highest storm tide level; Exp 3, 4, and 5 stand for the conditions when an average wave is encountered with average high tide, mean tide, and average low tide; and Exp 6, 7, and 8 stand for the conditions when the largest wave is encountered with average high tide, mean tide, and average low tide. The wave period of the average wave is calculated from the fitting formula derived from the wave height and wave period observations.
Table 2.
Wave conditions and wave run-ups for Typhoon Usagi.
Table 3.
Wave conditions and wave run-ups for Typhoon Dujuan.
The 16 sets of wave run-ups at Dazuo Seawall (over 15 s) are simulated by DualSPHysics, and all the waves are considered regular.
The time series of the wave run-up of Exp 1 and 2 are shown in Figure 11, those of Exp 3 and 5 are shown in Figure 12, and those of Exp 6 and 7 are shown in Figure 13.
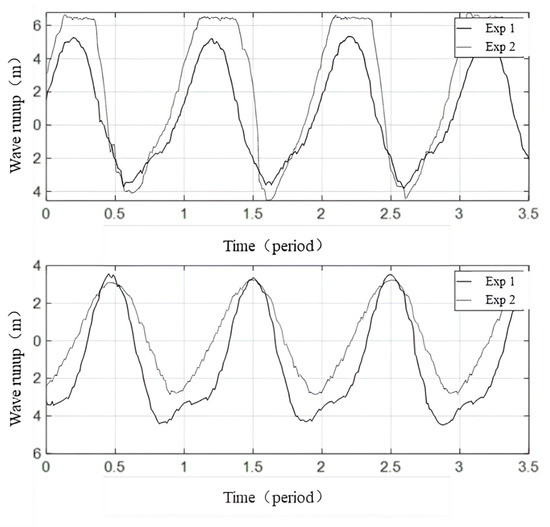
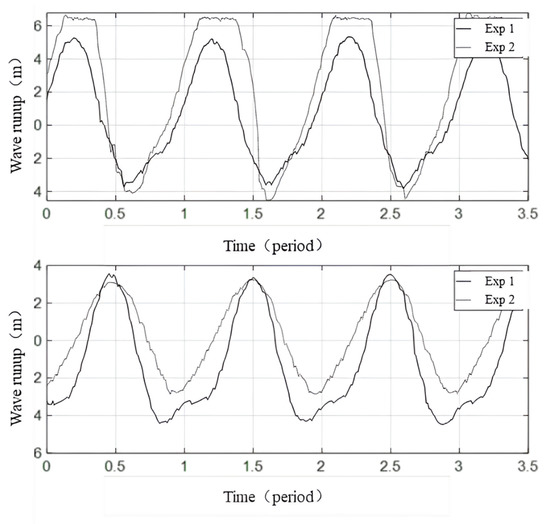
Figure 11.
Wave run-up at Dazuo Seawall for the highest wave and highest tide of typhoons, Usagi (upper) and Dujuan (lower).
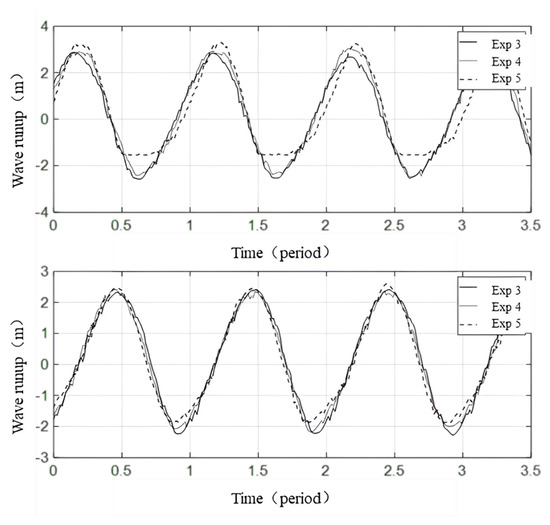
Figure 12.
Wave run-up at Dazuo Seawall for Exp 3–5 of typhoons Usagi (upper) and Dujuan (lower).
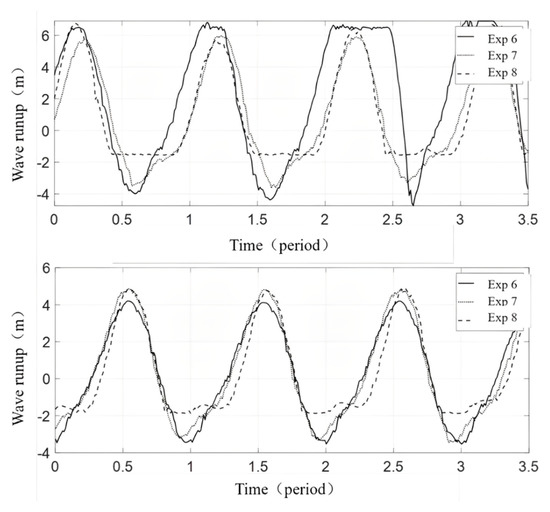
Figure 13.
Wave run-up at Dazuo Seawall for Exp 6–8 of typhoons Usagi (upper) and Dujuan (lower).
According to the simulation results of Exp 1–8 for Usagi, storm over-topping occurred at the time of the highest storm tide level (Exp 2) and when the largest wave was encountered with average high tide (Exp 6). As shown in the upper sections of Figure 11 and Figure 13, the time series of wave run-ups for Exp 2 and Exp 6 were truncated at the top, indicating that water passed over the seawall and storm over-topping occurred. The water exceeded the seawall in every quarter of the wave period in Exp 2 and exceeded the seawall in half of the time in Exp 6.
As shown in Figure 12 and Figure 13, the wave run-up decreases as the water becomes deeper under the same wave conditions. At an intermediate depth, waves propagate at a higher speed than in deep water, and they are stretched and shortened because of the different propagation speeds at the crest and trough.
As indicated by the results of Exp 2, 3 and 6, the risk of storm over-topping might increase when waves are encountered during high tide.
Figure 14 shows different points in time during the wave run-up for Exp 2 of Typhoon Usagi at Dazuo Seawall. Water climbs to the top of the seawall and reaches the vertical wall. With the blocking of the vertical wall, during high tide and under the action of large waves, water can climb to the top of the slope of the seawall, but it is not carried over the barrier.
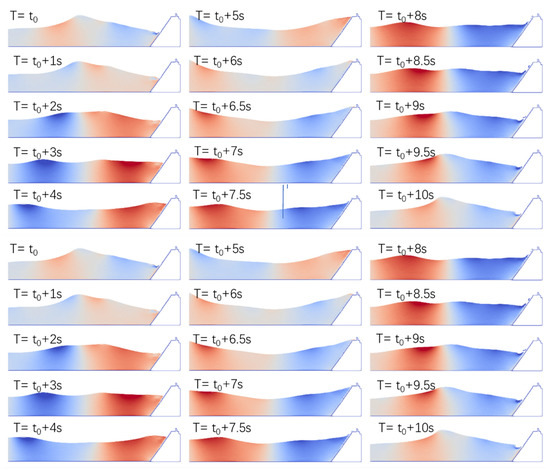
Figure 14.
Different points in time during the wave run-up for Exp 2 of Typhoon Usagi at Dazuo Seawall.
4. Conclusions
In this study, the FETSWCM-SWAN and DualSPHysics models are used to study the flooding process of typhoon waves at Dazuo Seawall. The numerical flume is more accurate and effective in reproducing the wave actions compared with the statistical method. The numerical simulation of storm tide level and wave run-up height can be used in practical disaster prevention and mitigation applications. This study is of great significance for the design of seawalls and the early warning of flood over-topping or inundation under extreme weather caused by typhoons.
- (1)
- The FETSWCM-SWAN model is used to calculate the tidal level, wind, and waves over Fujian and Taiwan Strait during Typhoon Usagi in 2013 and Typhoon Dujuan in 2015. The simulation results are in good agreement with the wave heights recorded by buoys. The FETSWCM-SWAN model successfully reproduces wave oscillation due to the interaction of tide and wave.
- (2)
- The DualSPHysics model is used to study the wave climbing process of Dazuo Seawall in Chongwu, Fujian province. A numerical flume with the Active Wave Absorption System is used to simulate the wave run-ups at Dazuo Seawall under typical waves and typhoon waves. The simulation results show that the typical wave run-up height of Dazuo Seawall is lower than 2 m, and the design of the seawall meets the daily protection requirements. Under the extreme conditions of Typhoon Usagi, the wave run-up height reached 19.95 m, exceeding the designed protecting height of Dazuo Seawall, and over-topping occurred.
- (3)
- The typhoon process usually lasts 3–5 days. Based on an analysis of tide level and wave simulations three days before the landfall of the typhoons, eight sets of experiments were conducted. The results show that the risk of over-topping increases during high tide. The wave run-up height decreases as the water becomes deeper under the same wave conditions as a result of the ocean wave being stretched and shortened by the different propagation speeds at crest and trough.
Author Contributions
Conceptualization, S.S. and F.Z.; methodology, L.W.; software, F.Z.; validation, L.W., Y.Z. and Y.S.; formal analysis, L.W. and Z.W.; investigation, L.W. and Z.W.; resources, Y.X.; data curation, Y.S.; writing—original draft preparation, L.Z. and Z.W.; writing—review and editing, L.Z.; visualization, L.W.; supervision, S.S.; project administration, S.S.; funding acquisition, Y.X. All authors have read and agreed to the published version of the manuscript.
Funding
This research received no external funding or This research was funded by National Natural Science Foundation of China: 52172327; Fujian Province Natural Science Foundation: 2021J011028; Fujian Province Natural Science Foundation: 2020J01860; Fujian Province Natural Science Foundation: 2022J05236; Fujian Province Natural Science Foundation: 2022J01112; Fujian marine economic development special fund project: FJHJF-L-2022-17; Fujian science and technology innovation key project: 2022G02027; the Science and Technology Planning Project of Fuzhou: 2021-S-236, 2021-SG-272.
Institutional Review Board Statement
Not applicable.
Informed Consent Statement
Not applicable.
Data Availability Statement
Not applicable.
Conflicts of Interest
The authors declare no conflict of interest.
References
- Warner, J.C.; Perlin, N.; Skyllingstad, E.D. Using the model coupling toolkit to couple earth system models. Environ. Model. Softw. 2008, 23, 1240–1249. [Google Scholar] [CrossRef]
- Dietrich, J.C.; Zijlema, M.; Westerink, J.J.; Holthuijsen, L.H.; Dawson, C.; Luettich, R.A., Jr.; Stone, G.W. Modeling hurricane waves and storm surge using integrally-coupled, scalable computations. Coast. Eng. 2011, 58, 45–65. [Google Scholar] [CrossRef]
- Sebastian, A.; Proft, J.; Dietrich, J.C.; Du, W.; Bedient, P.B.; Dawson, C.N. Characterizing hurricane storm surge behavior in Galveston Bay using the SWAN + ADCIRC model. Coast. Eng. 2014, 88, 171–181. [Google Scholar] [CrossRef]
- Xie, D.M.; Zou, Q.P.; Cannon, J.W. Application of SWAN ADCIRC to tide-surge and wave simulation in Gulf of Maine during patriot’s day storm. Water Sci. Eng. 2016, 9, 33–41. [Google Scholar] [CrossRef]
- Qi, J.; Chen, C.; Beardsley, R.C.; Perrie, W.; Cowles, G.W.; Lai, Z. An unstructured-grid finite-volume surface wave model (FVCOM-SWAVE): Implementation, validations and applications. Ocean. Model. 2009, 28, 153–166. [Google Scholar] [CrossRef]
- Zhang, L.; Shang, S.; Zhang, F.; Xie, Y. Tide-surge-wave interaction in the Taiwan Strait during Typhoons Soudelor (2015) and Dujuan (2015). Appl. Sci. 2020, 10, 7382. [Google Scholar] [CrossRef]
- Saville, T., Jr. Wave run-up on shore structures. J. Waterw. Harb. Div. 1956, 82, 925-1–925-14. [Google Scholar] [CrossRef]
- Iwagaki, Y.; Sakai, T.; Tsuda, T.; Oka, Y. Wave refraction and wave height variation due to current. Bull. Disaster Prev. Res. Inst. 1977, 27, 73–91. [Google Scholar]
- Van Der Meer, J.W.; De Waal, J.P. Wave run-up and overtopping on coastal structures. In Proceedings of the 23rd International Conference, Venice, Italy, 4–9 October 1992. [Google Scholar]
- Duan, X.; Mao, P.; Mao, C. Research on the status of seawall along the southeast coast (Fujian Province). Ocean. Eng. 1996, 14, 41–49. (In Chinese) [Google Scholar]
- Hofland, B.; Diamantidou, E.; van Steeg, P.; Meys, P. Wave runup and wave overtopping measurements using a laser scanner. Coast. Eng. 2015, 106, 20–29. [Google Scholar] [CrossRef]
- Zhang, L.; Shang, S.; Zhang, F.; Xie, Y. A tide-storm surge-wave coupled inundation warning system for Fujian coast. Mar. Forecast. 2016, 33, 61–69. [Google Scholar]
- Tanizawa, K. The state of the art on numerical wave tank. In Proceedings of the 4th Osaka Colloquium on Seakeeping Performance of Ships, Osaka, Japan, 17–21 October 2000; Volume 2000, pp. 95–144. [Google Scholar]
- Chang, Y.; Liu, S.; He, X.; Li, S.; Wang, G. Semi-analytical Solid Boundary Conditions for Free Surface Flows. In Computer Graphics Forum; Wiley: Hoboken, NJ, USA, 2020; Volume 39, pp. 131–141. [Google Scholar]
- Winchenbach, R.; Akhunov, R.; Kolb, A. Semi-analytic boundary handling below particle resolution for smoothed particle hydrodynamics. ACM Trans. Graph. TOG 2020, 39, 1–17. [Google Scholar] [CrossRef]
- Suzuki, T.; Altomare, C.; Yasuda, T.; Verwaest, T. Characterization of overtopping waves on sea dikes with gentle and shallow foreshores. J. Mar. Sci. Eng. 2020, 8, 752. [Google Scholar] [CrossRef]
- Zhang, F.; Crespo, A.; Altomare, C.; Domínguez, J.; Marzeddu, A.; Shang, S.P.; Gómez-Gesteira, M. DualSPHysics: A numerical tool to simulate real breakwaters. J. Hydrodyn. 2018, 30, 95–105. [Google Scholar] [CrossRef]
- Zhang, F.; Zhang, L.; Xie, Y.; Wang, Z.; Shang, S. Smoothed Particle Hydrodynamics Simulation of a Mariculture Platform under Waves. Water 2021, 13, 2847. [Google Scholar] [CrossRef]
- Lu, X.Q.; Yu, H.; Ying, M.; Zhao, B.K.; Zhang, S.; Lin, L.M.; Bai, L.N.; Wan, R.J. Western North Pacific tropical cyclone database created by the China Meteorological Administration. Adv. Atmos. Sci. 2021, 38, 690–699. [Google Scholar] [CrossRef]
- Chen, D.W.; Shang, S.P.; Shang, S.L.; University, X. Remote Sensing Study of Sea Surface Wind Field around Taiwan Island During Typhoon Periods. J.-Xiamen Univ. Nat. Sci. 2007, 46, 141–145. [Google Scholar]
- Holland, G.J. An analytic model of the wind and pressure profiles in hurricanes. Mon. Weather. Rev. 1980, 108, 1212–1218. [Google Scholar] [CrossRef]
- Matsumoto, K.; Takanezawa, T.; Ooe, M. Ocean Tide Models Developed by Assimilating TOPEX/POSEIDON Altimeter Data into Hydrodynamical Model: A Global Model and a Regional Model Around Japan. J. Oceanogr. 2000, 56, 567–581. [Google Scholar] [CrossRef]
- Crespo, A.J.; Domínguez, J.M.; Rogers, B.D.; Gómez-Gesteira, M.; Longshaw, S.; Canelas, R.J.F.B.; García-Feal, O. DualSPHysics: Open-source parallel CFD solver based on Smoothed Particle Hydrodynamics (SPH). Comput. Phys. Commun. 2015, 187, 204–216. [Google Scholar] [CrossRef]
- Fiedler, J.W.; Young, A.P.; Ludka, B.C.; O’Reilly, W.C.; Henderson, C.; Merrifield, M.A.; Guza, R.T. Predicting site-specific storm wave run-up. Nat. Hazards 2020, 104, 493–517. [Google Scholar] [CrossRef]
- Bender, J.; Kugelstadt, T.; Weiler, M.; Koschier, D. Implicit frictional boundary handling for SPH. IEEE Trans. Vis. Comput. Graph. 2020, 26, 2982–2993. [Google Scholar] [CrossRef] [PubMed]
- Altomare, C.; Crespo, A.J.; Rogers, B.D.; Dominguez, J.M.; Gironella, X.; Gómez-Gesteira, M. Numerical modelling of armour block sea breakwater with smoothed particle hydrodynamics. Comput. Struct. 2014, 130, 34–45. [Google Scholar] [CrossRef]
- da Silva, P.G.; Coco, G.; Garnier, R.; Klein, A.H. On the prediction of runup, setup and swash on beaches. Earth-Sci. Rev. 2020, 204, 103148. [Google Scholar] [CrossRef]
- Di Luccio, D.; Benassai, G.; Budillon, G.; Mucerino, L.; Montella, R.; Pugliese Carratelli, E. Wave run-up prediction and observation in a micro-tidal beach. Nat. Hazards Earth Syst. Sci. 2018, 18, 2841–2857. [Google Scholar] [CrossRef]
- Altomare, C.; Crespo, A.J.; Domínguez, J.M.; Gómez-Gesteira, M.; Suzuki, T.; Verwaest, T. Applicability of Smoothed Particle Hydrodynamics for estimation of sea wave impact on coastal structures. Coast. Eng. 2015, 96, 1–12. [Google Scholar] [CrossRef]
- Wendland, H. Piecewiese polynomial, positive definite and compactly supported radial functions of minimal degree. Adv. Comput. Math. 1995, 4, 389–396. [Google Scholar] [CrossRef]
- Madsen, P.A.; Fuhrman, D.R.; Schäffer, H.A. On the solitary wave paradigm for tsunamis. J. Geophys. Res.-Ocean. 2008, 113, 1–22. [Google Scholar] [CrossRef]
- Crespo, A.J.C.; Gómez-Gesteira, M.; Dalrymple, R. Boundary conditions generated by dynamic particles in SPH methods. Comput. Mater. Contin. 2007, 5, 173–184. [Google Scholar]
- Schaffer, H.A.; Klopman, G. Review of multidirectional active wave absorption methods. J. Waterw. Port Coast. Ocean. Eng. 2000, 126, 88–97. [Google Scholar] [CrossRef]
- Leimkuhler, B.J.; Reich, S.; Skeel, R.D. Integration Methods for Molecular Dynamic IMA Volume in Mathematics and Its Application; Springer: New York, NY, USA, 1996. [Google Scholar]


Publisher’s Note: MDPI stays neutral with regard to jurisdictional claims in published maps and institutional affiliations. |
© 2022 by the authors. Licensee MDPI, Basel, Switzerland. This article is an open access article distributed under the terms and conditions of the Creative Commons Attribution (CC BY) license (https://creativecommons.org/licenses/by/4.0/).