Article

SAR Observation of Waves under Ice in the Marginal Ice Zone

1
School of Marine Sciences, Nanjing University of Information Science & Technology, Nanjing 210044, China
2
The Key Laboratory of Space Ocean Remote Sensing and Application, Ministry of Natural Resources, Beijing 100081, China
3
National Satellite Ocean Application Service, Beijing 100081, China
*
Author to whom correspondence should be addressed.
J. Mar. Sci. Eng. 2022, 10(12), 1836; https://doi.org/10.3390/jmse10121836
Submission received: 23 October 2022 / Revised: 22 November 2022 / Accepted: 25 November 2022 / Published: 29 November 2022
(This article belongs to the Special Issue Frontiers in Physical Oceanography)

Abstract

:
The marginal ice zone (MIZ) connects the open ocean and the pack ice, playing significant roles in shaping the ice edge and wave–ice interaction. Spaceborne synthetic aperture radar (SAR) has been demonstrated to be one of the most advantageous sensors for MIZ exploration given its capability to collect images under all weather conditions during day and night. In this study, we take advantage of the Sentinel-1 wave mode vignettes acquired around the Antarctic to quantify the image properties over MIZ. A data set of SAR images covering the ice edge with both open water and sea ice present in the same scene was created by manual inspection. It is found that the radar return over sea ice decreases by an average of approximately 1.78 dB in comparison to its adjacent open water, which is roughly independent of the polarizations and incidence angles. The long ocean waves are barely attenuated right across the ice edge in terms of their comparable azimuth cutoff. Further inside the ice from the edge, the waves are gradually dampened out at distances associated with their wavelengths. The results obtained in this study shall help interpret the radar scattering model validation as well as the wave–ice interaction.

1. Introduction

Sea ice formation initiates from small platelets, clustering together into the frazil ice at diameters in the scale of millimeters. This type of ice will continuously grow into the grease ice of a thicker layer at an extended diameter with a soupy surface resembling that of oil spills [1,2]. The next ice growth stage is pancake ice named after its appearance resembling pancakes of various diameters floating on the water surface. Pushed by ocean waves, pancake ice will be attached to large blocks of sea ice and end up with pack ice [1]. In the course of sea ice growth, the wave–ice interaction constantly influences its formation and ice melting [3]. Before the availability of satellite data, field and laboratory experiments are the main efforts characterizing their interaction process. It has been reported that ocean waves penetrating into the grease ice decay at a linear rate dependent on the wave amplitude and wavenumber [4]. A couple of coordinated field programs extend our understanding of MIZ properties. The marginal ice zone experiment (MIZEX) project was carried out between 1983 and 1987, which was the first systematic field exploration of the permanent MIZ in the Arctic Ocean [5,6]. For ocean waves propagating inside sea ice, an exponential decay is observed in wave amplitude and the high-frequency waves are attenuated more rapidly than long waves by the sea ice [7]. In addition, the directional wave spectrum is reported to first broaden until it becomes isotropic at certain distances inside the sea ice. This critical distance varies significantly with respect to the wavelength that longer wavelengths correspond to further lengths. Short wind seas complete this widening process over a shorter distance, typically at 1 km versus the 10 km even 100 km for long swells [7]. The wave decay distance is found to exhibit high variability in the range of 400–700 km, which might be associated with the ice properties [8]. Other aspects, such as the prediction of floe size distribution, the kinematics of ice edge and the contributions of oceanic eddies to the local mass transport are also addressed using the data collected by MIZEX. Several MIZ experiments subsequently followed, including the Coordinated Eastern Arctic Experiment (CEAREX) [9] and the Seasonal Ice Zone Experiment (SIZEX) [10]. The latter took place on the ice edge of the Fram Strait, designed as a validation effort for the European Remote Sensing-1 (ERS-1) satellite observation of the sea ice. A concurrent study, the Labrador Ice Margin Experiment (LIMEX), was carried out in the Labrador Sea [11,12]. Airborne SAR images acquired over the sea ice and MIZ, together with the in situ information collected by the research vessels, provide essential insights into the SAR measurement principles of the various MIZ processes.
Spaceborne SAR observation of MIZ dates back to the Seasat-A satellite mission [1,11]. The radar backscattering first decreases from the open ocean inside the sea ice because of the reduced sea surface roughness caused by the high-frequency wave damping [1]. Weak radar return leads to the dark appearance on synthetic aperture radar (SAR) imagery. Far across the ice boundary, the roughened surface of pancake ice yields stronger backscattering and presents as bright patches [1]. A case of ocean waves penetrating into both the frazil and pancake ice captured by the L-band Seasat-A SAR was analyzed in depth and found consistent results with the prediction of a theoretical model in terms of the wavelength change and the refraction angle of the peak waves [1]. SAR measurements also provide significant input into the numerical simulation in an effort to model the ice edge and eddy formation [3]. Wave attenuation by sea ice is also broadly investigated using SAR observations. A method to estimate the attenuation rate was proposed through the decrease in wave orbital velocity variance associated with SAR azimuth cutoff [13]. Azimuth cutoff is often interpreted as the minimum wavelength that can be resolved in the along-track (azimuth) direction, which could be readily calculated from the image spectrum. Their results are consistent with the previously reported damping parameters obtained from the field campaigns [14,15]. The wave attenuation is also qualitatively discussed using a wide-swath SAR image over 400 × 400 km capturing ocean wave propagating far into the sea ice [16]. In addition, the attempt to derive ice thickness using SAR images has also been made through the change in wave dispersion relation as they travel into the frazil and/or pancake ice [17,18]. It is worth pointing out that other remote sensing techniques are also widely employed to investigate the characteristics of MIZ [19,20,21,22].
Sentinel-1 is a constellation of two SAR satellites, consisting of Sentinel-1A (S-1A) and Sentinel-1B (S-1B mission ended in 2022 due to issues in the instrument electronics power supply). These two C-band SAR sensors are able to collect images under all kinds of weather conditions during day and night. The innovative imaging mode, wave mode (WV), is able to continuously obtain acquisitions on the open ocean as well as inside the MIZ. Despite the general concept that frazil ice in MIZ appears darker compared to the surrounding open ocean, the decrease in radar backscattering has barely been quantified, possibly due to the limited availability of SAR data. In this study, we make an attempt towards this direction based on a small data set of hand-selected SAR images acquired by S-1 WV. Wave attenuation inside the MIZ is also demonstrated and discussed through the SAR parameter of the azimuth cutoff.
The rest of this paper is organized as follows. Section 2 describes Sentinel-1 SAR acquisitions and the manual selection process, along with the ancillary data set used in this study. Section 3 presents the properties of radar backscattering and azimuth cutoff from the open ocean to the wave in ice as well as the relevant discussions. The summary is given in Section 4.

2. Data and Method

2.1. Sentinel-1 SAR Images

As the successor of the past Environmental Satellite (ENVISAT) of the European Space Agency (ESA), Sentinel-1 is a dedicated SAR constellation to continue the global observation. The first two satellites, S-1A and S-1B, were launched into space in April 2014 and April 2016, respectively. After about 6 months of their commissioning phase, these two satellites begin to operationally acquire images at their full capacity. Each S-1 satellite carries a C-band SAR sensor with center frequency at 5.65 GHz (radar wavelength of 5.55 cm) and is designed to operate at four imaging modes. The extra-wide (EW) mode with the footprint of 400 × 400 km and the interferometric wide (IW) of 250 × 250 km swath focus on the exploitation of mesoscale phenomena in the coastal regions as well as the land usage. The stripmap (SM) mode has a spatial coverage of 100 × 100 km and is used over small islands and preserved for exceptional cases to support emergency management actions. Wave mode (WV) is the default mode across the global open ocean. It is designed to operate at two incidence angles of 23.5 (WV1) and 36.5 (WV2). SAR vignettes are collected by a novel ‘leap-frog’ pattern at these two incidence angles alternatively every 100 km. In other words, two consecutive SAR images at the same incidence are 200 km away along the track. Each WV image covers a swath of 20 × 20 km at a spatial resolution of 5 m. Given its primary focus on ocean waves, WV is typically suspended at a distance of approximately 500 km to the coast of the main continents. This leads to no WV acquisitions in the Arctic Ocean, while it continues to operate down to the latitude of 70 S in the Antarctic.
At its full potential, each S-1 sensor can collect approximately 60,000 SAR vignettes in one month, laying the basis for the investigation of various studies from a statistical point of view. In general, WV works at the vertical-transmit—vertical-receive (VV) polarization, while an exception takes place from 18 March 2017 to 3 July 2017 when S-1B operates at horizontal-transmit–horizontal-receive (HH) polarization. In this study, we explore the WV acquisitions collected over this period by S-1A and S-1B to demonstrate the dependence of SAR image statistics of open ocean and sea ice on radar polarization. SAR vignettes composed of both open water and waves under sea ice are manually selected as described below.

2.2. Sea Ice Concentration

In this study, the sea ice concentration is included as ancillary data to help interpret the SAR images with ocean waves propagating far into the ice. Sea ice concentration is defined as the percentage of sea ice coverage within one resolution grid, ranging from 0 to 1. Zero means that the imaged area is free of sea ice while one indicates that this region is entirely covered by sea ice. Here, we use the reprocessed sea ice concentration product generated by the European Organisation for the Exploitation of Meteorological Satellites OSI-SAF and distributed by Copernicus Marine Environment Monitoring Service (CMEMS). The product identifier within the framework of CMEMS is SST_GLO_SST_L4_REP_OBSERVATIONS_010_024. It is produced using the Special Sensor Microwave Imager/Sounder instruments aboard the Defense Meteorological Satellite Program satellites from 2016 onwards [23]. The reprocessed data are available on a daily basis at a spatial resolution of 0.25 across the globe.

2.3. CSARMOD Model

Most geophysical model functions relating to the radar return to radar configuration parameters (incidence and frequency, etc.) and surface wind field are created for single polarization. A dual-polarized geophysical model functions has been created using the ENVISAT SAR measurements and the collocated Advanced scatterometer winds [24]. It is valid in the incidence angle range of 17 to 42 , covering the two incidence angles of S-1 WV and has been shown to perform well for the wind speed from 2 m/s to 20 m/s [24]. We applied this model here to demonstrate the consistency of S-1 WV measured radar backscattering over the open ocean relative to model prediction.

2.4. Manual Selection of SAR Cases

The increasing volume of SAR acquisitions in recent decades has driven the investigation of observed geophysical features from a case study to a statistical basis. Big challenges remain, one being the automatic classification of the vast SAR data set in terms of the observed phenomena. Some attempts have been made to screen the frequently captured atmospheric and oceanographic patterns on SAR images using the deep learning technique [25,26]. However, waves in ice and/or MIZ are of minor populations in comparison with other categories, such as ocean waves, sea ice, boundary layer rolls, etc. This leads to difficulties in filtering out the relevant images for geophysical analysis. In this study, we focus on documenting the image statistics variations from open water to the waves in ice, and thus, the creation of an automatic classification model is too complicated and beyond the scope of this paper. As an alternative, we manually selected a number of SAR vignettes with clear patches of both waves and waves in ice by visual inspection. To demonstrate the polarization sensitivity of the backscattering variation, the S-1 acquisition database collected between 18 March and 3 July 2017 when S-1A operated at VV polarization and S-1B at HH polarization are included herein.
We start the selection process with all SAR images acquired south of 55 S to reduce the workload. One image is included only if it meets the following criteria. (1) One image must consist of two patches with clear backscattering contrast and visible wave features. (2) Given the known fact that waves under thin frazil ice in the MIZ has a lower radar return than the ocean waves in the adjacent open water, the darker area must be in the south of the brighter area. (3) In general, a WV imagery has approximately 4500 × 4500 px along the range and azimuth direction for both WV1 and WV2. Thus, only the images with both dark and bright patches larger than 1000 × 1000 px are kept to ensure the validity of the subsequent image statistics analysis. Such criteria are also applied as a guarantee of the image spectrum quality calculated using a periodogram size of 512 px. This ends up with 107 images for S-1A and 109 for S-1B. The level-1 single look complex products are systematically calibrated to obtain the Normalized Radar Cross-Section (NRCS) and two regions of interest over the open ocean and the waves in ice are manually marked on each SAR image. Each region of interest covers a domain of at least 1024 × 1024 px to facilitate the spectral analysis. To help interpret the image characteristics, the European Centre for Medium-Range Weather Forecasts (ECMWF) wind speed annotated in the level-2 products is also included here.
The geographical distribution of the manually selected SAR vignettes is given in Figure 1a. The majority of these data points are located at latitudes south of 60 S and almost uniformly scatter around the Antarctic continent. One exception is in the sector between 30 W and 60 W, which might be due to wave blockage by South America. No significant difference in terms of the spatial locations is observed between WV1 and WV2. The vignette count at each incidence angle is shown in Figure 1b. It is clear that WV2 outnumbers WV1 because of the higher backscattering sensitivity to the surface roughness variation at a larger incidence angle. Such a trend holds for both VV and HH polarization.

3. Results and Discussions

In this section, one selected SAR vignette with both waves and waves under ice is first presented along with the estimates of the SAR image spectrum and azimuth cutoff. The NRCS of the open ocean and the thin frazil ice within the same SAR vignette are then compared. Their ratio is quantified and investigated relative to the collocated wind speed. SAR azimuth cutoff representing the variance of wave orbital velocities is examined between these two areas of interest. This section ends with a case study of long ocean waves propagating far into the sea ice field.

3.1. A Case Study

Figure 2 gives an example of SAR imagery acquired by S-1A on 31 March 2017 at UTC 22:57:47. A clear boundary connecting the open ocean (bright area) and frazil ice (dark area) is observed normal to the wave traveling direction from the northwest. ECMWF forecasts the winds coming from 70 clockwise from the North at 2.4 m/s, and thus the waves are remote swells rather than locally generated by the wind or sea. Two dominant wave systems are captured by this SAR image: one at 300 m wavelength propagating to the southeast and the other at 150 m to the east. The wave direction ambiguity is resolved according to the imaginary part of the SAR image cross-spectrum (not shown here for simplicity). Such features mean that these two systems are not produced by the wave refraction on the ice edge. Two regions of interest marked by R1 and R2 are rectangled over the bright and dark sides, respectively, and their detailed NRCS representations are shown in the bottom panel of Figure 2. In this case, each box covers 1024 × 2048 px along the azimuth by the range axis, roughly corresponding to a spatial extent of 5 × 8 km. The mean NRCS averaged over R1 and R2 is 0.042 and 0.028 in linear units, which differs by 1.68 dB. The Bragg waves responsible for SAR backscatter is immediately dampened at the ice edge, causing the decreased radar return relative to the open ocean.
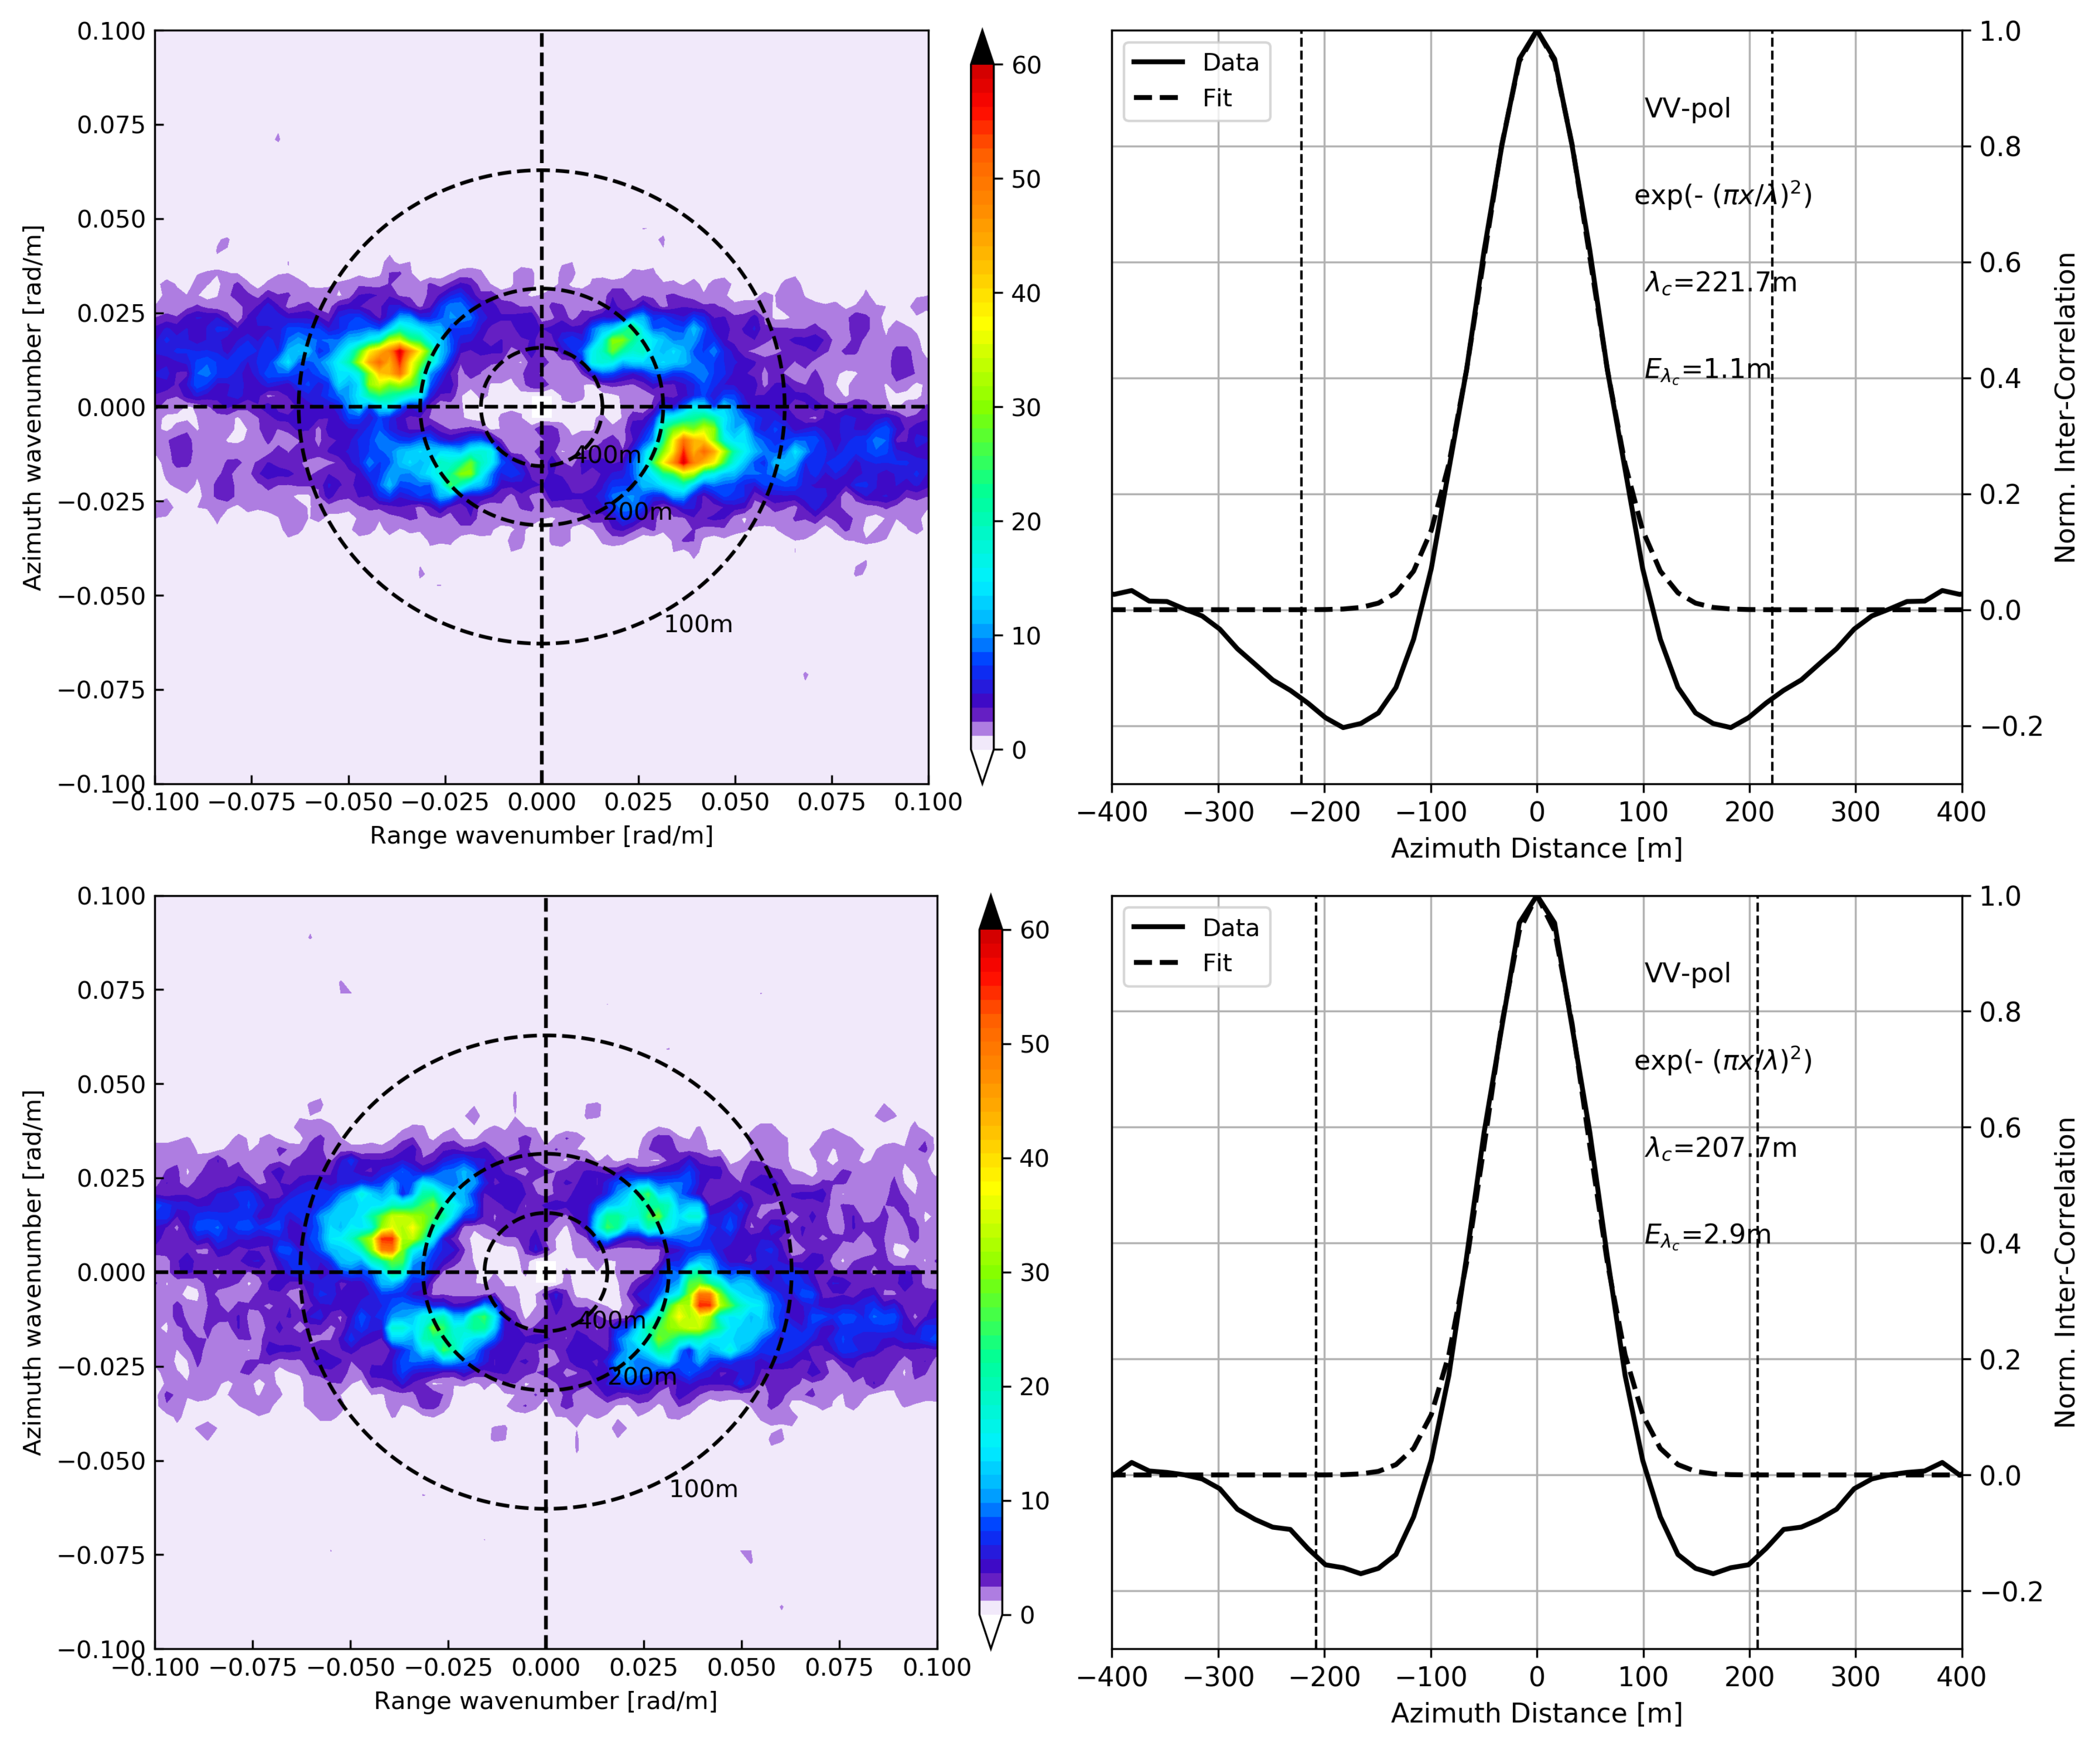
The orbital velocities of ocean surface waves induce an additional Doppler frequency to the satellite motion, distorting the imaging transform. This nonlinear process has been broadly demonstrated to blur the observed wave features [27]. Azimuth cutoff is often used to quantify the nonlinearity, defined by the range-to-distance ratio of the platform as well as the variance of wave orbital velocity. In general, it is inferred from the correlation function of SAR observations, which could be directly derived from the SAR image spectrum. With the advantage of reduced speckle noise and the distinct imaginary part to resolve the wave propagation ambiguity, the SAR cross-spectrum presented in [27] is computed for the selected region of interest. Figure 3 left panel shows the cross-spectral magnitude of the sub-images shown in Figure 2b,c. As analyzed above, two dominant swell systems exist in both the open ocean and the region of waves under sea ice. By comparing these two cross-spectra, it is clear that the waves are rotated towards the range axis as waves penetrate into the ice field. This feature is in good agreement with the previous studies that waves are refracted towards the normal direction to the ice edge [17], which roughly aligns with the range in this case. Another prominent feature is the narrowing of the swell direction spread, consistent with the results in [7]. The broadening of swell spread is then expected; unfortunately, no SAR images are available south of this example, for validation. The right panel of Figure 3 presents the azimuth cutoff estimate from the normalized correlation function derived using the cross-spectrum. As shown, the Gaussian fit to the correlation curve is of good quality with a fit error of 1.1 m and 2.9 m for the azimuth cutoff, which is almost negligible relative to the cutoff magnitude. The azimuth cutoff obtained over the side of the waves in ice is 207.7 m, smaller than that over the open ocean of 221.7 m. This decrease results from the wave damping at the ice edge, as widely acknowledged in the previous studies [13].

3.2. Statistics of NRCS and Azimuth Cutoff

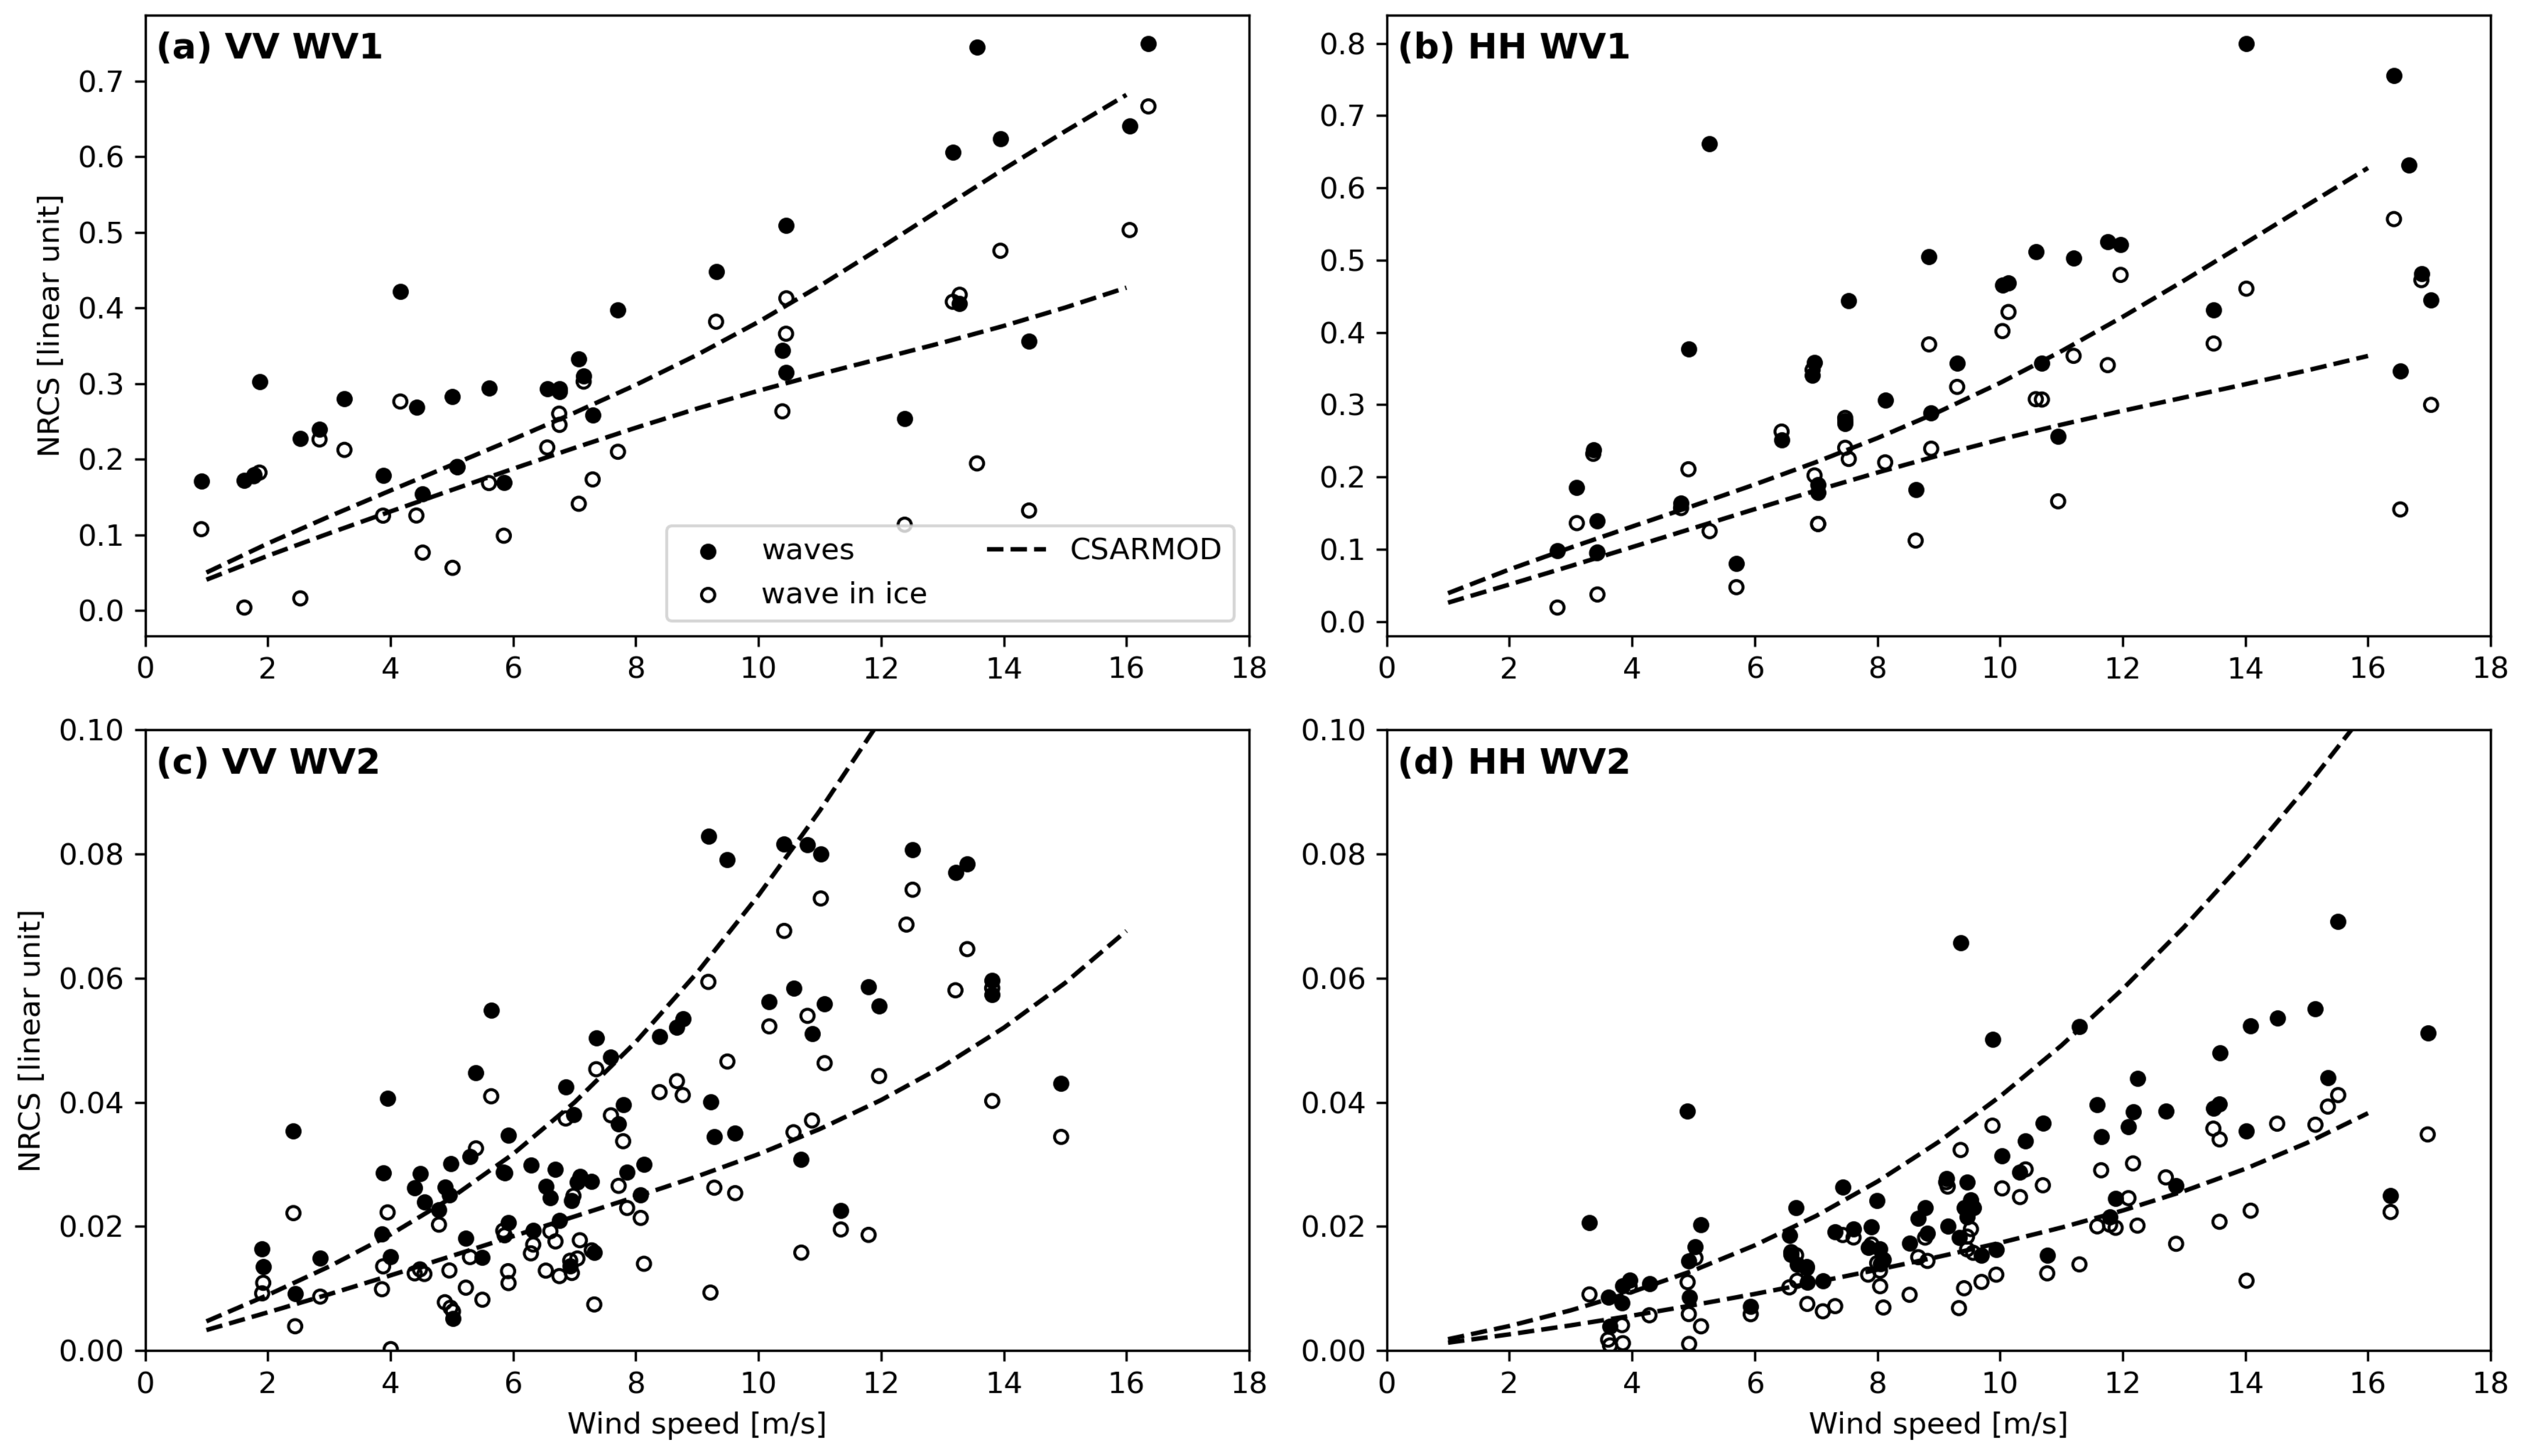
The SAR NRCS of the selected ROIs for waves and waves in ice is plotted against wind speed in Figure 4 for the four combinations of two polarizations and two incidence angles. It should be pointed out that a constant thermal noise value of −22 dB is subtracted from all NRCS observations [28]. Also shown in the figure is the NRCS calculated by CSARMOD for given wind speed and radar parameters IN the wind directions of 0 and 90 relative to the azimuth for demonstration purposes. For WV1 at the top panel, most of the SAR measurement points lie above the CSARMOD estimate, while SAR NRCS lies well within the range defined by CSARMOD for WV2 at the bottom. The smaller CSARMOD is possibly due to the underestimated winds by ECMWF, particularly at high latitudes of the Southern Ocean [29]. The averaged NRCS of waves in ice is consistently lower than that of the pure ocean waves for both polarizations and incidence angles. The ratio of NRCS over the open ocean to that of waves under ice within one given SAR vignette is calculated to quantify the decreasing degree of the radar return. This ratio is plotted relative to the collocated wind speed in Figure 5 as an attempt to diagnose the wind impact. We find that the NRCS ratio for WV1 in Figure 5a barely changes versus the wind speed, around 1.45 with certain standard deviations. The slope of linear regression to all data points is nearly zero for both VV and HH polarization, also illustrating its independence of winds. In contrast, this ratio exhibits a slightly decreasing trend with increasing wind speed for WV2 in Figure 5b. No clear polarization difference exhibits at 36.5 incidence angle, similar to that of WV1. The small slope of linear regression shows that the NRCS ratio of WV2 has a weak dependence on wind speed and is not negligible. For a wind speed change of 5 m/s, the VV and HH ratio change by 0.2 and 0.1, respectively. At a larger incidence angle of WV2, SAR backscattering has enhanced sensitivity on the sea surface roughness that might be dampened slower at high winds, yielding closer NRCS magnitude and a decreasing ratio value. Overall, for the two polarizations and the incidence angles, the NRCS ratio varies around the value of 1.5 with minor variation. In other words, the NRCS decrease between the open ocean and the wave under ice is in the order of 1.76 dB, providing a way to quantify the damping degrees of short Bragg waves used in the analytical models. With the upcoming classification models that could automatically distinguish the SAR scenes of MIZ, relevant studies shall be conducted based on a larger volume of the data set.
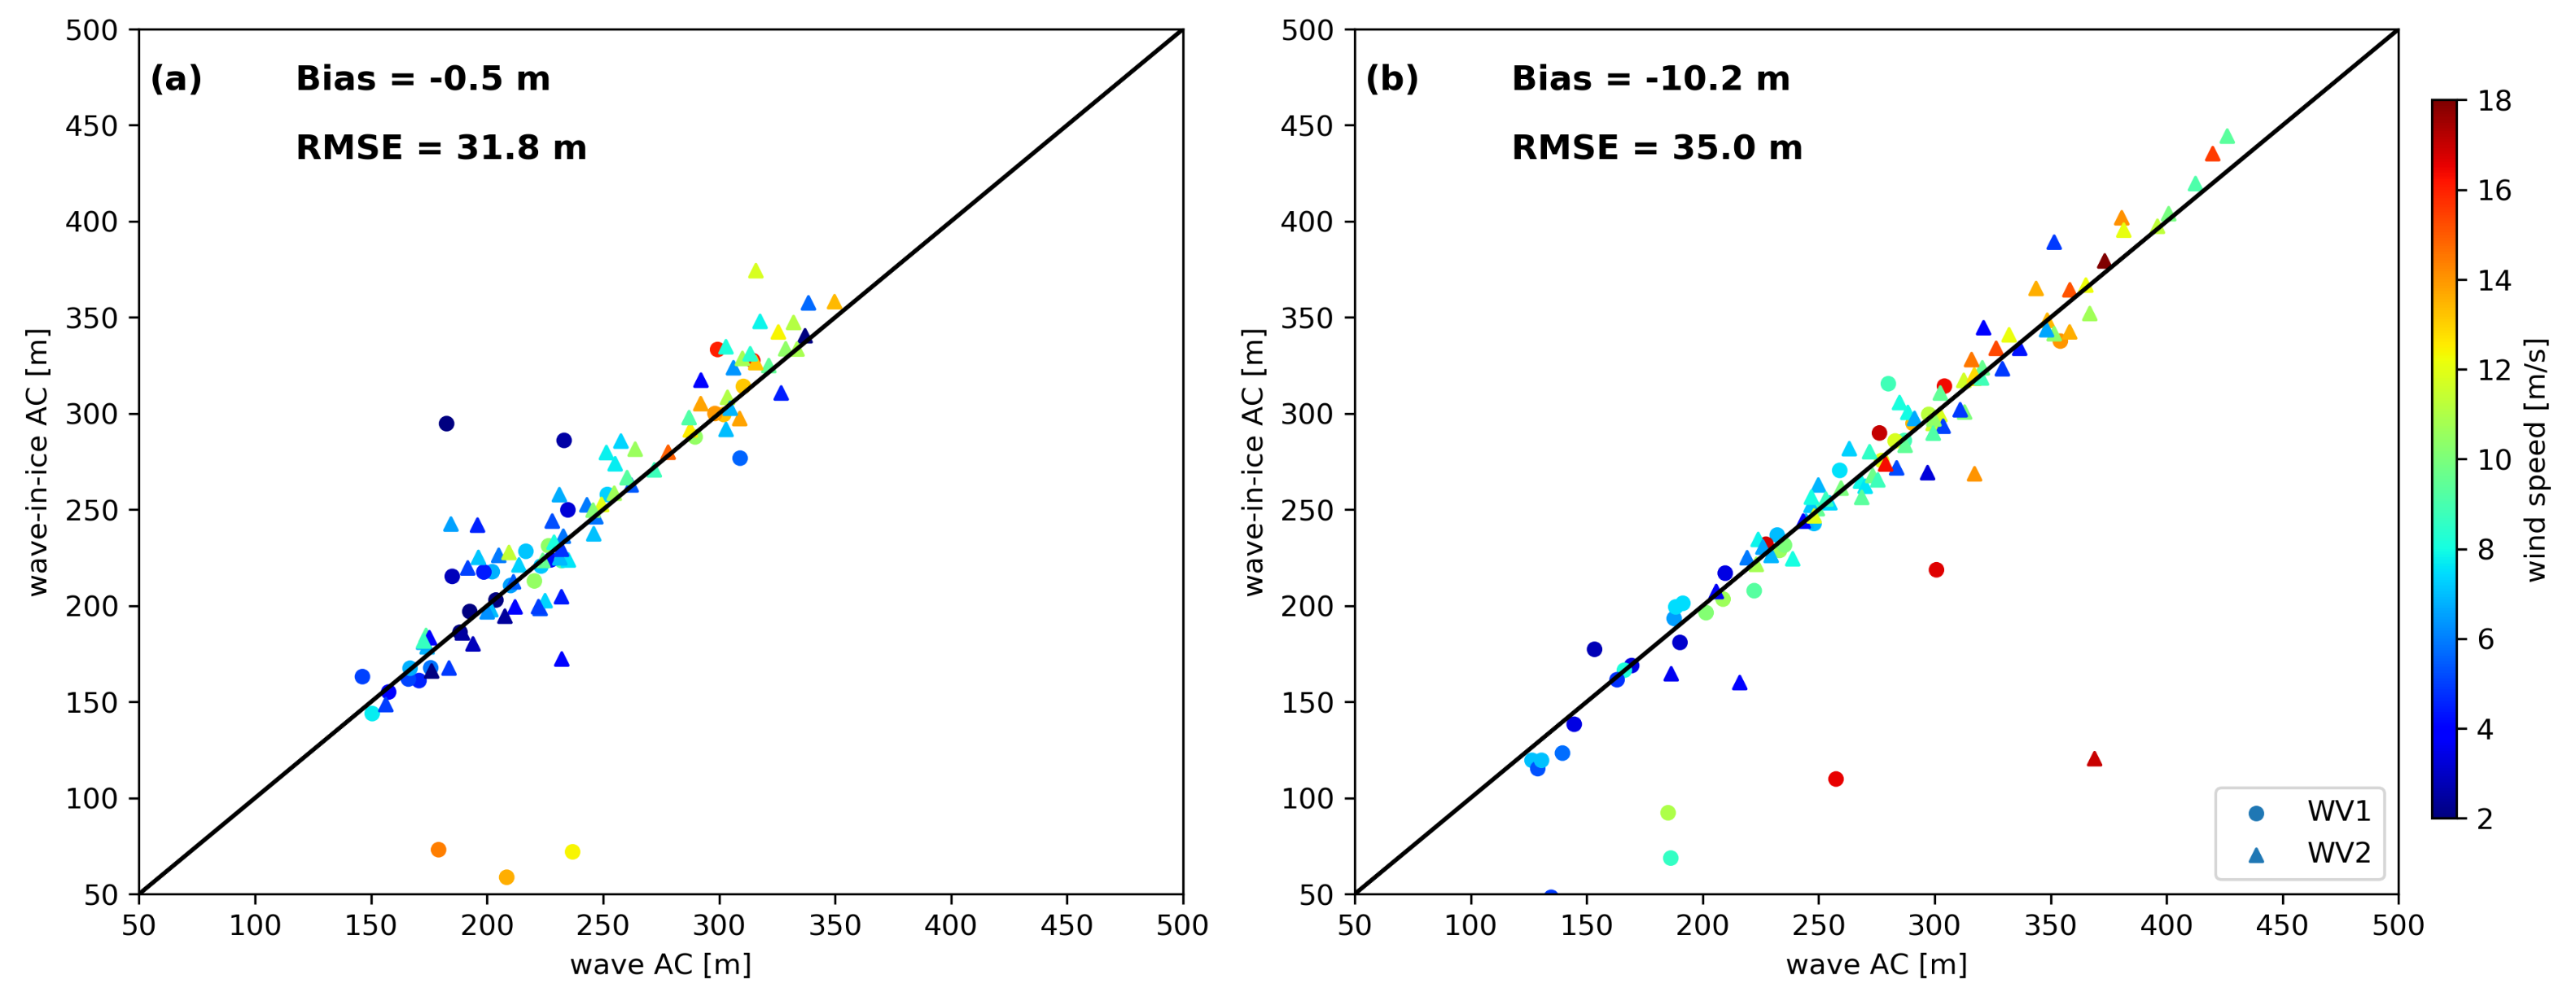
Figure 6 presents the azimuth cutoff comparison between the two kinds of regions of all selected SAR images. In general, the azimuth cutoff of waves in ice is comparable to that of the open waves with most of the data points scattering around the one-to-one line for both VV and HH polarization in Figure 6a,b. The azimuth cutoff bias is close to zero, implying that these two variables are actually equivalent in magnitude. This is reasonable given that the adjacent frazil ice to the open water only dampens very high-frequency waves, while ocean waves contributing to the orbital velocity variance are yet affected. The azimuth cutoff difference is roughly steady versus wind speed, resembling the feature of the NRCS ratio shown in Figure 4.

3.3. Waves Penetrating Far inside Sea Ice

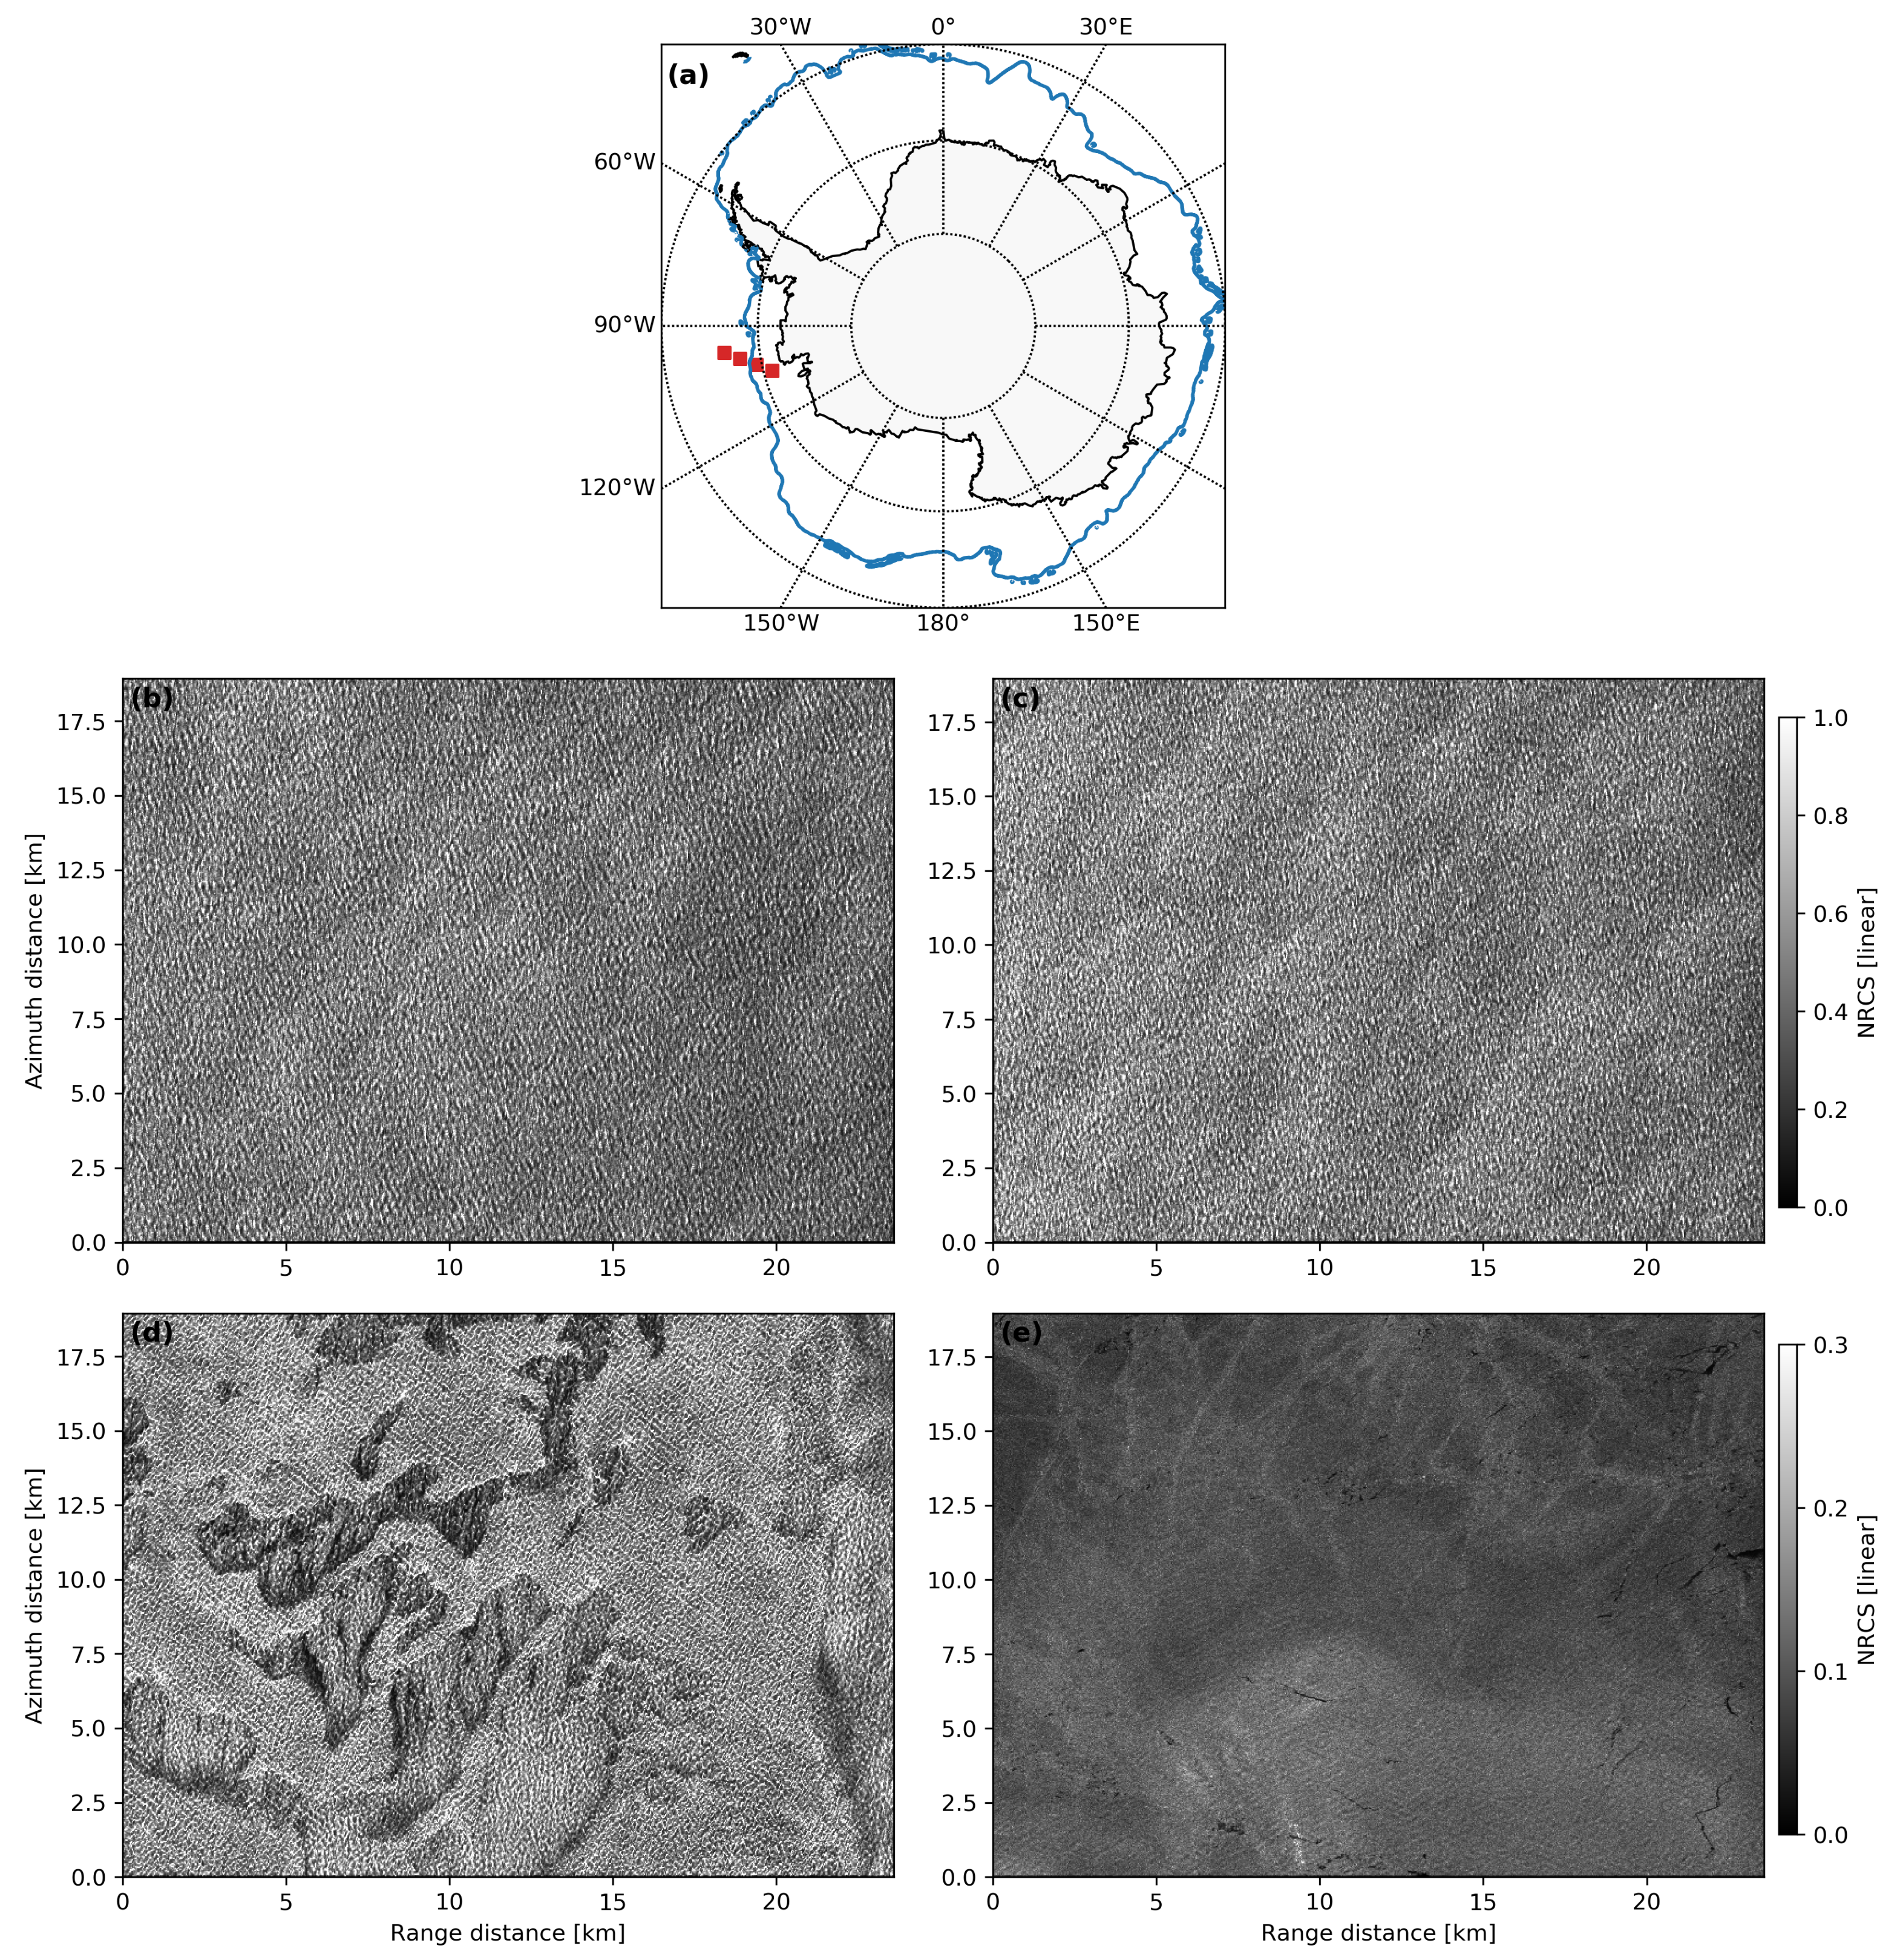
The comparable azimuth cutoff between the open ocean and the initially formed frazil ice in Figure 6 is not representative of the azimuth cutoff change far inside the sea ice. To further illustrate such a trend, a case study consisting of four consecutive WV vignettes acquired by S-1A WV1 on 10 June 2017 at UTC 10:46 is presented. Figure 7a gives the geographical locations of these SAR images with the detailed NRCS representation in (b)–(e) from the north to the south. The overlapped sea ice edge depicted by the contour line in Figure 7a lies between the two middle SAR images plotted in Figure 7c,d, respectively. It can be seen that both subplots (b) and (c) are located in the open ocean with higher radar backscattering. Frazil-to-pancake ice transition is captured in Figure 7d with evident wave strips and lower NRCS in the range of [0.1,0.2] (linear unit) compared to that of [0.4,0.7] over the open ocean. Figure 7e shows even darker patches with weakly visible wave signals in the middle bottom part of this image. Note that these two consecutive SAR vignettes are 200 km apart, implying that the waves are roughly dampened out at 200 km inside the sea ice field. The estimated azimuth cutoff for each SAR scene is listed in Table 1 along with the mean NRCS. Further inside the sea ice, the waves are more dampened with smaller orbital velocity variance and reduced azimuth cutoff. In this case, the azimuth cutoff decreases by approximately 160 m from image (c) to image (d) and 210 m to image (e). This corresponds to a decrease in wave orbital velocities variance by 0.5 m/s from image (c) to image (d). It could be speculated that short waves are gradually dampened out, leaving only long surface waves. Unfortunately, this track ends with the image (e), making it an open question as to whether the waves have penetrated further into the sea ice.

4. Summary

In this study, the NRCS decrease from open water inside the MIZ of waves in ice is quantified based on a manually selected SAR data set. The NRCS ratio between the bright open ocean and the dark sea ice varies around 1.5, equivalent to a 1.76 dB decrease. This trend is found to be independent of polarization and weakly dependent on the incidence angle. In terms of the wave attenuation reflected by the azimuth cutoff variation inside the ice field, long waves are barely dampened on the ice edge based on the comparable azimuth cutoff magnitude between the open water and the waves under the ice. As waves penetrate far into the sea ice, they are gradually dampened out as captured by the decreasing azimuth cutoff shown in the case study. The manual inspection of SAR images can provide insights into the wave attenuation from the sea ice edge far into the field, however, the statistical results are limited. Further investigation of wave damping inside sea ice, such as distances where ocean waves are completely dampened out is only feasible when the automatic classification of SAR images becomes possible. Dedicated efforts in SAR image recognition focusing on marginal ice zones with clear wave patterns shall facilitate such studies in this new direction.

Author Contributions

Conceptualization, H.L.; methodology, H.L. and C.W.; formal analysis, Z.D., D.L. and H.L.; investigation, Z.D., D.L. and H.L.; writing—original draft preparation, Z.D. and H.L.; writing—review and editing, H.L., C.W., L.S. and Y.H.; supervision, Y.H.; funding acquisition, L.S. and Y.H. All authors have read and agreed to the published version of the manuscript.

Funding

This work was supported by the National Key Research and Development Program of China under grants 2021YFC2803301 and 2021YFC2803300, the National Natural Science Foundation of China under grants 42006163 and 42027805, the Natural Science Foundation of Jiangsu Province under grants BK20210666 and the Impact and Response of Antarctic Seas to Climate Change under grant IRASCC2020-2022.

Data Availability Statement

The Sentinel-1 data are publicly available on Copernicus Open Access Hub via https://scihub.copernicus.eu/dhus/ (accessed on 1 August 2022).

Acknowledgments

Copernicus Sentinel data (2017) were used. The ECMWF forecast winds were obtained in the framework of Sentinel-1 A Mission Performance Center and are publicly available (ecmwf.int) (accessed on 1 August 2022).

Conflicts of Interest

The authors declare no conflict of interest.

References

  1. Wadhams, P.; Holt, B. Waves in frazil and pancake ice and their detection in Seasat synthetic aperture radar imagery. J. Geophys. Res. 1991, 96, 8835. [Google Scholar] [CrossRef]
  2. Ito, M.; Ohshima, K.I.; Fukamachi, Y.; Hirano, D.; Mahoney, A.R.; Jones, J.; Takatsuka, T.; Eicken, H. Favorable Conditions for Suspension Freezing in an Arctic Coastal Polynya. J. Geophys. Res. Ocean. 2019, 124, 8701–8719. [Google Scholar] [CrossRef]
  3. Liu, A.K.; Peng, C.Y.; Weingartner, T.J. Ocean-ice interaction in the marginal ice zone using synthetic aperture radar imagery. J. Geophys. Res. 1994, 99, 22391. [Google Scholar] [CrossRef]
  4. Martin, S.; Kauffman, P. A Field and Laboratory Study of Wave Damping by Grease Ice. J. Glaciol. 1981, 27, 283–313. [Google Scholar] [CrossRef] [Green Version]
  5. Johannessen, O.M. Introduction: Summer marginal ice zone experiments during 1983 and 1984 in Fram Strait and the Greenland Sea. J. Geophys. Res. 1987, 92, 6716. [Google Scholar] [CrossRef]
  6. Rottier, P. SPRI participation in the Winter Marginal Ice Zone Experiment, MIZEX-87. Polar Rec. 1989, 25, 33–36. [Google Scholar] [CrossRef]
  7. Wadhams, P.; Squire, V.A.; Ewing, J.A.; Pascal, R.W. The Effect of the Marginal Ice Zone on the Directional Wave Spectrum of the Ocean. J. Phys. Oceanogr. 1986, 16, 358–376. [Google Scholar] [CrossRef]
  8. Stopa, J.E.; Sutherland, P.; Ardhuin, F. Strong and highly variable push of ocean waves on Southern Ocean sea ice. Proc. Natl. Acad. Sci. USA 2018, 115, 5861–5865. [Google Scholar] [CrossRef] [Green Version]
  9. Group, C.D. CEAREX Drift Experiment. Eos Trans. Am. Geophys. Union 1990, 71, 1115–1118. [Google Scholar] [CrossRef]
  10. Johannessen, O.; Sandven, S. SIZEX’89; A Prelaunch ERS-1 Experiment; Technical Report Technical Report 23; NERSC: Berkeley, CA, USA, 1989.
  11. Liu, A.K.; Vachon, P.W.; Peng, C.Y. Observation of wave refraction at an ice edge by synthetic aperture radar. J. Geophys. Res. 1991, 96, 4803. [Google Scholar] [CrossRef]
  12. Liu, A.K.; Holt, B.; Vachon, P.W. Wave propagation in the marginal ice zone: Model predictions and comparisons with buoy and synthetic aperture radar data. J. Geophys. Res. 1991, 96, 4605. [Google Scholar] [CrossRef]
  13. Schulz-Stellenfleth, J. Spaceborne synthetic aperture radar observations of ocean waves traveling into sea ice. J. Geophys. Res. 2002, 107, 3106. [Google Scholar] [CrossRef]
  14. Wadhams, P.; Squire, V.A.; Goodman, D.J.; Cowan, A.M.; Moore, S.C. The attenuation rates of ocean waves in the marginal ice zone. J. Geophys. Res. 1988, 93, 6799. [Google Scholar] [CrossRef]
  15. Shen, H.; Perrie, W.; Hu, Y.; He, Y. Remote Sensing of Waves Propagating in the Marginal Ice Zone by SAR. J. Geophys. Res. Ocean. 2018, 123, 189–200. [Google Scholar] [CrossRef]
  16. Stopa, J.E.; Ardhuin, F.; Thomson, J.; Smith, M.M.; Kohout, A.; Doble, M.; Wadhams, P. Wave Attenuation Through an Arctic Marginal Ice Zone on 12 October 2015: 1. Measurement of Wave Spectra and Ice Features From Sentinel 1A. J. Geophys. Res. Ocean. 2018, 123, 3619–3634. [Google Scholar] [CrossRef]
  17. Wadhams, P.; Parmiggiani, F.; de Carolis, G. The Use of SAR to Measure Ocean Wave Dispersion in Frazil–Pancake Icefields. J. Phys. Oceanogr. 2002, 32, 1721–1746. [Google Scholar] [CrossRef]
  18. Wadhams, P. SAR imaging of wave dispersion in Antarctic pancake ice and its use in measuring ice thickness. Geophys. Res. Lett. 2004, 31, L15305. [Google Scholar] [CrossRef]
  19. Sutherland, P.; Gascard, J. Airborne remote sensing of ocean wave directional wavenumber spectra in the marginal ice zone. Geophys. Res. Lett. 2016, 43, 5151–5159. [Google Scholar] [CrossRef] [Green Version]
  20. Sutherland, P.; Brozena, J.; Rogers, W.E.; Doble, M.; Wadhams, P. Airborne Remote Sensing of Wave Propagation in the Marginal Ice Zone. J. Geophys. Res. Ocean. 2018, 123, 4132–4152. [Google Scholar] [CrossRef]
  21. Horvat, C.; Blanchard-Wrigglesworth, E.; Petty, A. Observing Waves in Sea Ice With ICESat-2. Geophys. Res. Lett. 2020, 47, e2020GL087629. [Google Scholar] [CrossRef]
  22. Collard, F.; Marié, L.; Nouguier, F.; Kleinherenbrink, M.; Ehlers, F.; Ardhuin, F. Wind-Wave Attenuation in Arctic Sea Ice: A Discussion of Remote Sensing Capabilities. J. Geophys. Res. Oceans 2022, 127, e2022JC018654. [Google Scholar] [CrossRef]
  23. Lavergne, T.; Sørensen, A.M.; Kern, S.; Tonboe, R.; Notz, D.; Aaboe, S.; Bell, L.; Dybkjær, G.; Eastwood, S.; Gabarro, C.; et al. Version 2 of the EUMETSAT OSI SAF and ESA CCI sea-ice concentration climate data records. Cryosphere 2019, 13, 49–78. [Google Scholar] [CrossRef] [Green Version]
  24. Mouche, A.; Chapron, B. Global C-Band Envisat, RADARSAT-2 and Sentinel-1 SAR measurements in copolarization and cross-polarization. J. Geophys. Res. Oceans 2015, 120, 7195–7207. [Google Scholar] [CrossRef] [Green Version]
  25. Wang, C.; Tandeo, P.; Mouche, A.; Stopa, J.E.; Gressani, V.; Longepe, N.; Vandemark, D.; Foster, R.C.; Chapron, B. Classification of the global Sentinel-1 SAR vignettes for ocean surface process studies. Remote Sens. Environ. 2019, 234, 111457. [Google Scholar] [CrossRef]
  26. Huang, X.; Zhang, B.; Perrie, W.; Lu, Y.; Wang, C. A novel deep learning method for marine oil spill detection from satellite synthetic aperture radar imagery. Mar. Pollut. Bull. 2022, 179, 113666. [Google Scholar] [CrossRef] [PubMed]
  27. Engen, G.; Johnsen, H. SAR-ocean wave inversion using image cross spectra. IEEE Trans. Geosci. Remote Sens. 1995, 33, 1047–1056. [Google Scholar] [CrossRef]
  28. Torres, R.; Snoeij, P.; Geudtner, D.; Bibby, D.; Davidson, M.; Attema, E.; Potin, P.; Rommen, B.; Floury, N.; Brown, M.; et al. GMES Sentinel-1 mission. Remote Sens. Environ. 2012, 120, 9–24. [Google Scholar] [CrossRef]
  29. Belmonte Rivas, M.; Stoffelen, A. Characterizing ERA-Interim and ERA5 surface wind biases using ASCAT. Ocean Sci. 2019, 15, 831–852. [Google Scholar] [CrossRef]
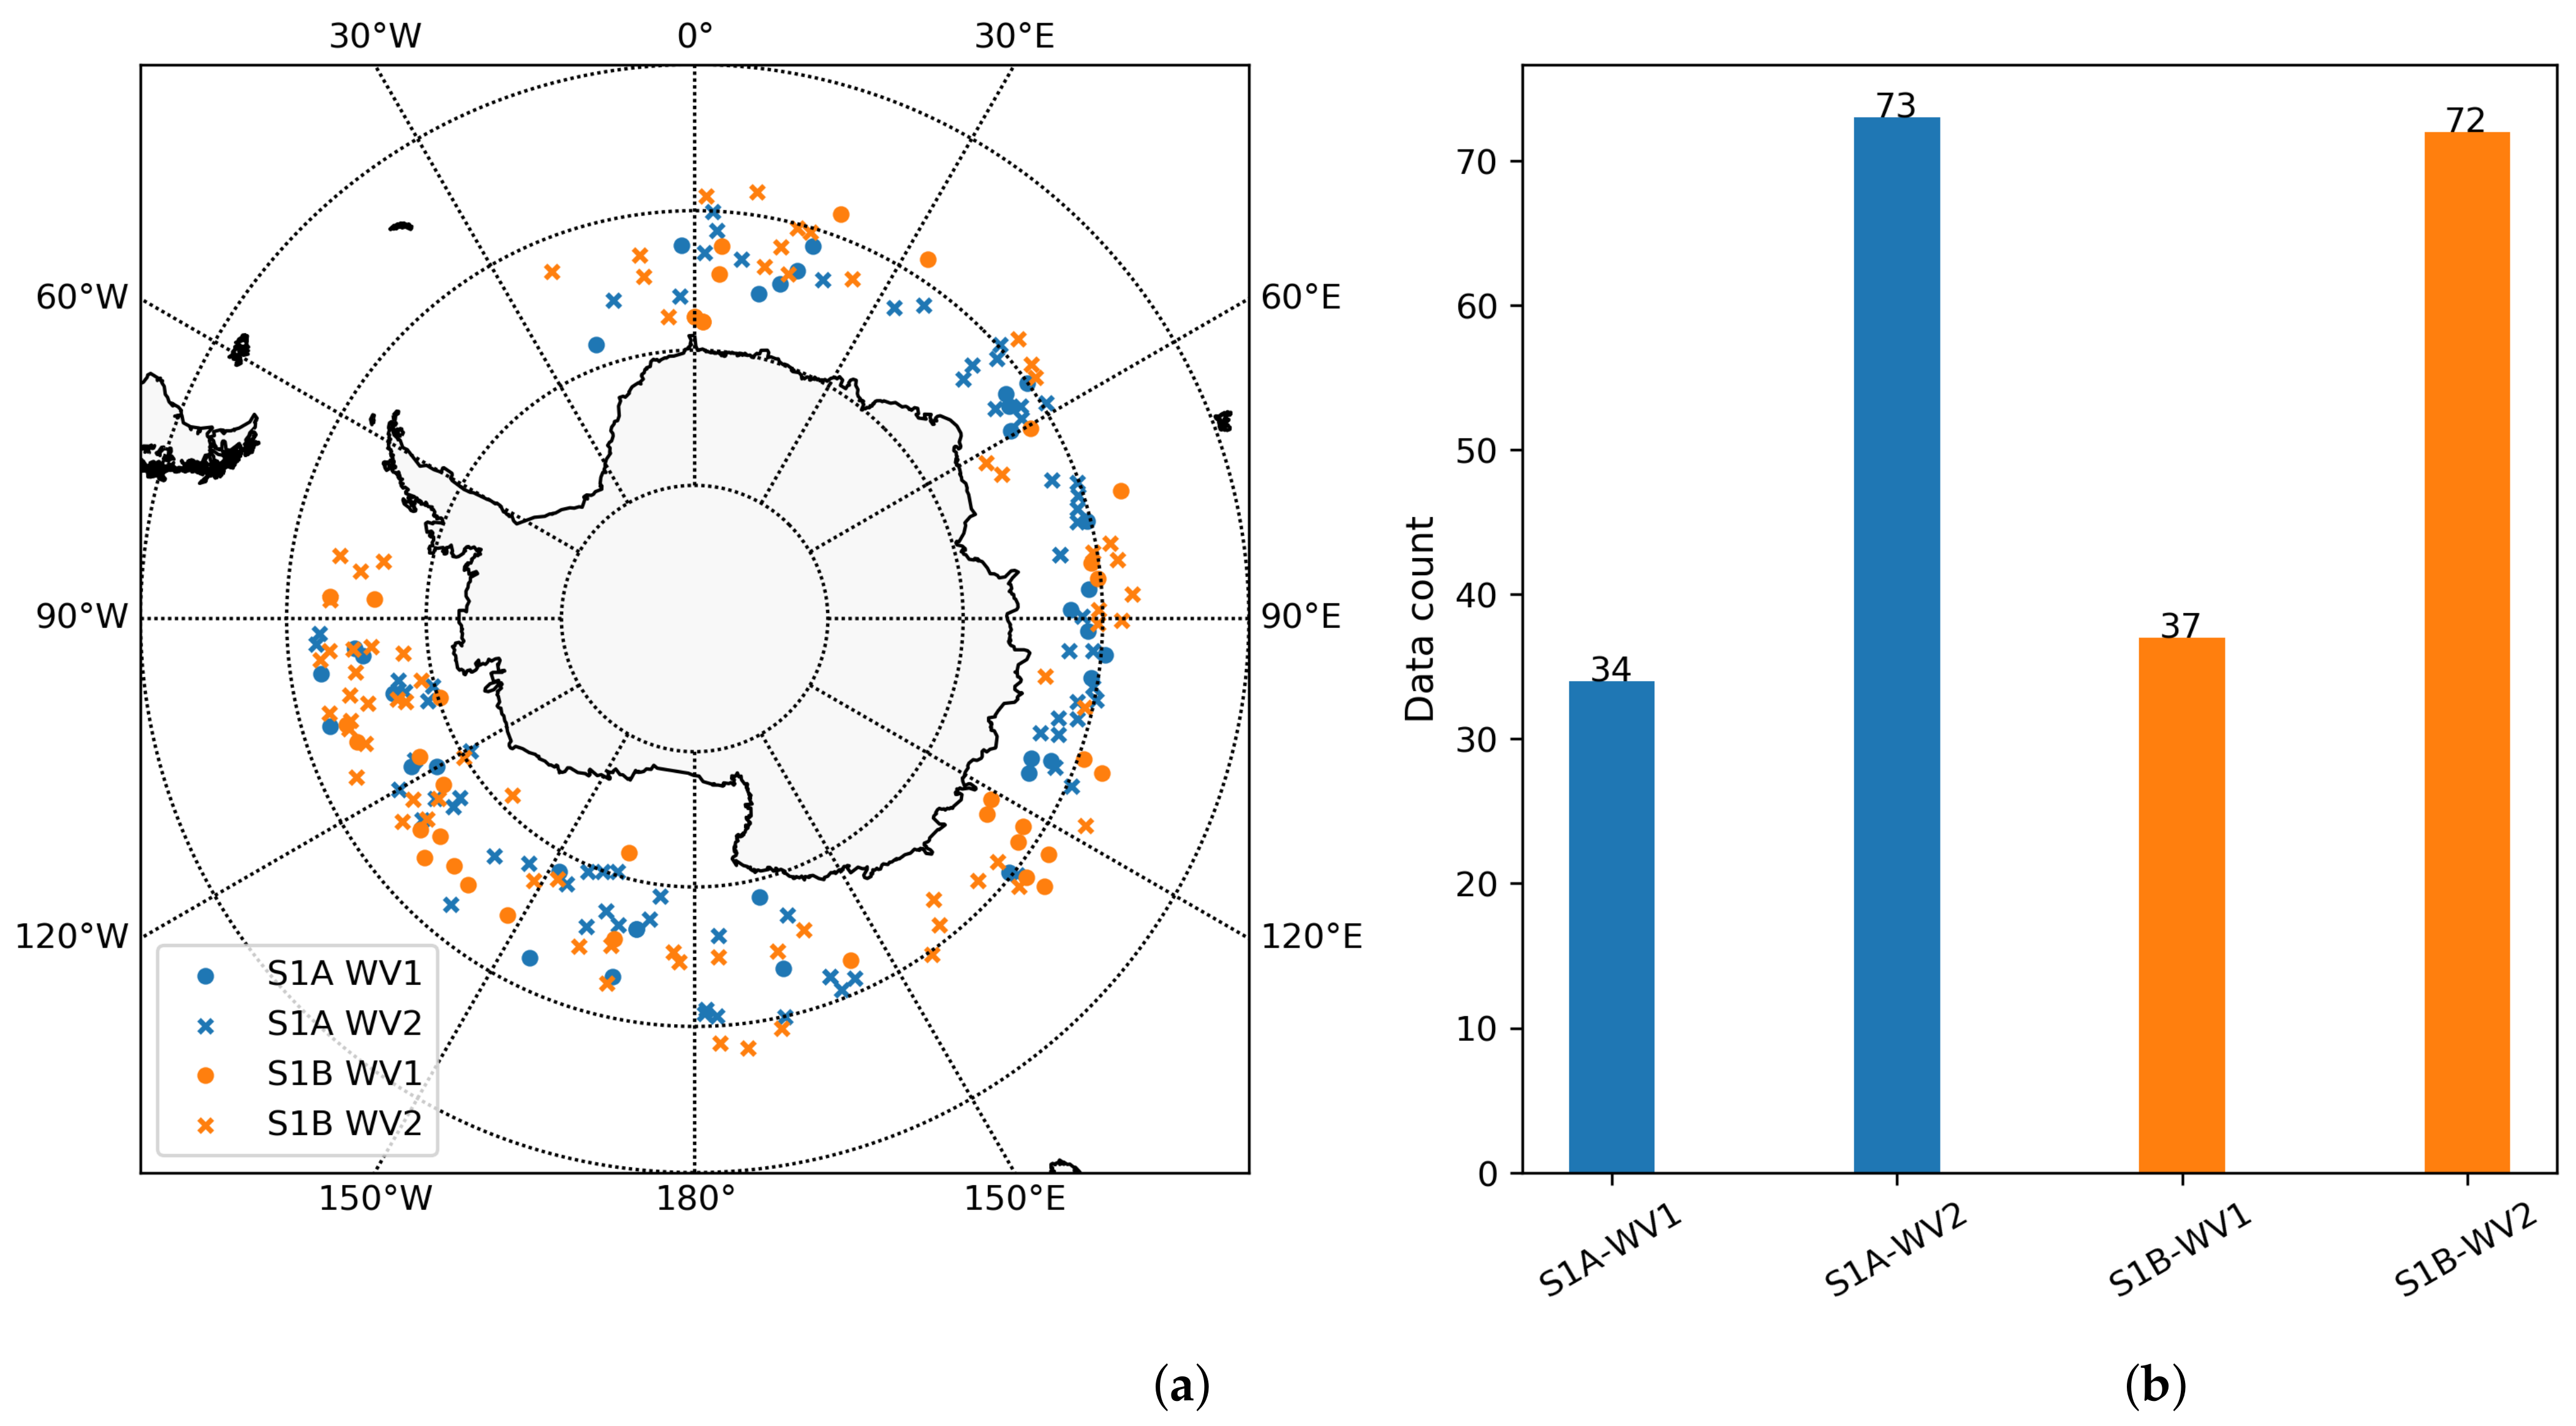
Figure 1. (a) The geographical distribution of the selected SAR cases with both open ocean and wave in ice present within one scene for S-1A (blue) and S-1B (orange). (b) The individual data count of the four combinations for two incidence angles and two polarizations.
Jmse 10 01836 g001
Figure 2. (a) An example case of SAR imagery over the MIZ. Two regions of interest over open water (marked by ‘R1’) and the wave in ice (marked by ‘R2’) are annotated. Zoomed-in images of R1 and R2 are shown in (b) and (c), respectively.
Jmse 10 01836 g002
Figure 3. (Left) Magnitude of SAR cross-spectrum calculated over the regions of interest shown in Figure 2. (Right) The corresponding azimuth cutoff estimate by fitting the normalized correlation function using a Gaussian model with the value and fit error annotated in the subplots.
Jmse 10 01836 g003
Figure 4. SAR NRCS over the open ocean (solid circle) and the waves in sea ice (empty circle) is plotted against the collocated wind speed for (a) VV, WV1; (b) HH, WV1; (c) VV WV2 and (d) HH WV2. The dashed line in each subplot is the CSARMOD NRCS for the given polarization and incidence angle in the wind directions of 0 (upwind) and 90 (cross-wind).
Jmse 10 01836 g004
Figure 5. NRCS ratio of open water to the wave in ice within the same SAR scene for (a) WV1 and (b) WV2. The two polarizations (VV and HH) are shown in blue and orange, respectively. Solid lines represent the line regression with the annotated analytical form and the dashed curves are the 90% prediction interval for each polarization.
Jmse 10 01836 g005
Figure 6. SAR azimuth cutoff of wave in ice versus the open water is shown for (a) VV and (b) HH polarization. Color denotes the wind speed.
Jmse 10 01836 g006
Figure 7. (a) Geographical distribution of four consecutive SAR vignettes acquired by S-1A WV1 on 10 June 2017 at 10:46 UTC. The overlapped contour in blue is the daily ice edge derived from the sea ice concentration. Furthermore, the NRCS is given in (be) for images from the north to the south.
Jmse 10 01836 g007
Table 1. Image statistics of the four SAR images shown in Figure 7.
Latitude ( )−66.33−67.90−69.43−70.92
Longitude ( )−97.00−99.22−101.76−104.68
NRCS0.470.500.160.10
Azimuth cutoff (m)275.24273.66112.3159.95
Publisher’s Note: MDPI stays neutral with regard to jurisdictional claims in published maps and institutional affiliations.