1. Introduction
Worldwide, coastal erosion is a major issue in coastal zones, being estimated that 24% of the world’s sandy beaches are eroding at rates exceeding 0.5 m/year [
1]. In the last decades, artificial nourishments have become one of the main coastal intervention measures to mitigate the shoreline retreat and climate change effects around the world. This measure acts directly on the cause of erosion, trying to circumvent the deficit of sediments in coastal areas. However, artificial nourishments are not a permanent solution, since the removal of sediments by the wave and current actions, which occurs naturally from the deposition site, requires re-nourishment interventions over time to maintain its designed function. Periodic re-nourishment intervals range from 2 to 10 years and depend on several factors related to the initial design, namely wave climate, frequency and type of storms, and sand characteristics [
2,
3,
4].
Artificial nourishments present positive and negative aspects, with different impacts, costs, and benefits; therefore, this evaluation is dependent upon technical and local variables [
5,
6,
7,
8]. Thus, to mitigate coastal erosion based on artificial nourishments in a sustainable long-term perspective, it is necessary to maximize the benefits and reduce the costs of the intervention. The nourishment design defines the volume, frequency of intervention, and placement site and depends on the sediment dynamics at the placement site, etc. An overview of beach nourishment practices around the world shows an increasing tendency to perform more recurrent nourishment interventions with increasing sediments volumes [
9,
10,
11].
Cost–benefit analyses are tools that can be applied to compare costs and benefits, allowing one to take into consideration the economic feasibility of each strategy [
12]. To obtain the balance between costs and benefits, it is necessary to quantify all the effects of the intervention during its life cycle and to convert them to the same unit, obtaining a unique unit that allows for the comparison of costs and benefits [
13].
This work aims to present contributions to analyze and discuss the physical and economic feasibility of artificial nourishments interventions, considering their costs and benefits. For that, COAST software develop at University of Aveiro (version 1) [
7] is applied, allowing an integrated, well-defined, and sequential cost–benefit approach in order to support decision-making for planning and coastal management. The software is applied for two study cases, one considering a hypothetical study area and the other corresponding to a real domain, the coastal stretch Barra-Vagueira, in Portugal. For both study areas, a 20-year time horizon was defined, and the physical and economic performance of artificial nourishment scenarios was evaluated. The obtained modelled results allow for the discussion of the cost–benefit of the nourishments with regard to the functions of different design parameters, such as volume, placement site, placement alongshore extension, and frequency.
2. Methodology
Cost–benefit analysis can be applied to compare nourishment costs and benefits, allowing one to take into consideration the economic feasibility of different scenarios [
12]. In this study, COAST software, developed in the University of Aveiro by Lima, in 2018 [
7], was applied to evaluate the economic performance of the artificial nourishments. This software applies a sequential and integrated methodology to compare the benefits and costs of coastal erosion mitigation measures and is based on three main stages [
7,
14,
15]:
1st—Assessment of the physical performance of the coastal erosion mitigation measures, evaluating the shoreline evolution along time, allowing for the estimation of the benefits of the intervention;
2nd—Definition of the nourishment volume and consequent costs of the intervention, considering its life cycle;
3rd—Cost–benefit assessment of each intervention scenario, based on the analysis of the evolution of the economic parameters NPV (net present value), BCR (benefit–cost ratio) and break-even year (the year where the costs are compensated for by the benefits).
In the first stage is applied a long-term shoreline evolution numerical model (LTC—long-term configuration [
5]) to obtain the physical impacts of the nourishment scenarios. The coastal areas gained and/or not lost due to the intervention are evaluated along time to estimate the benefits. In the second stage, the costs of the nourishments and re-nourishments are considered. Finally, in the third stage, costs and benefits obtained through time in the previous stages are summed (considering a discount rate to address the monetary values to the reference year) and compared, obtaining the net present value (NPV), benefit-cost ratio (BCR), and break-even year.
2.1. Benefits
The main benefits of coastal erosion mitigation measures are linked to their capacity to slow down the erosion trend and, consequently, to reduce the irreversible loss of territory, economic activities, infrastructures, and goods during the life cycle defined for the project [
12,
16]. In the COAST software, the benefits of coastal erosion mitigation measures are obtained as a result of the territory maintained, gained, or lost along time, plus the territory value. Following this approach, the software applies a one-line model (LTC) to obtain the areas of territory maintained or gained, by comparing the results with a non-intervention scenario. Within a specific study area, the software allows the user to define different monetary values for the territory alongshore.
LTC [
5] is a shoreline evolution numerical model for sandy beaches that combines a simple classical one-line model with a rule-based model for erosion/accretion volumes distribution along the beach profile [
17,
18]. The model was designed to support coastal management and planning, allowing one to obtain shoreline projections in a medium- to long-term perspective (decades), considering different coastal erosion mitigation measures without a high computational effort and without a complex calibration and validation process [
18,
19,
20,
21,
22].
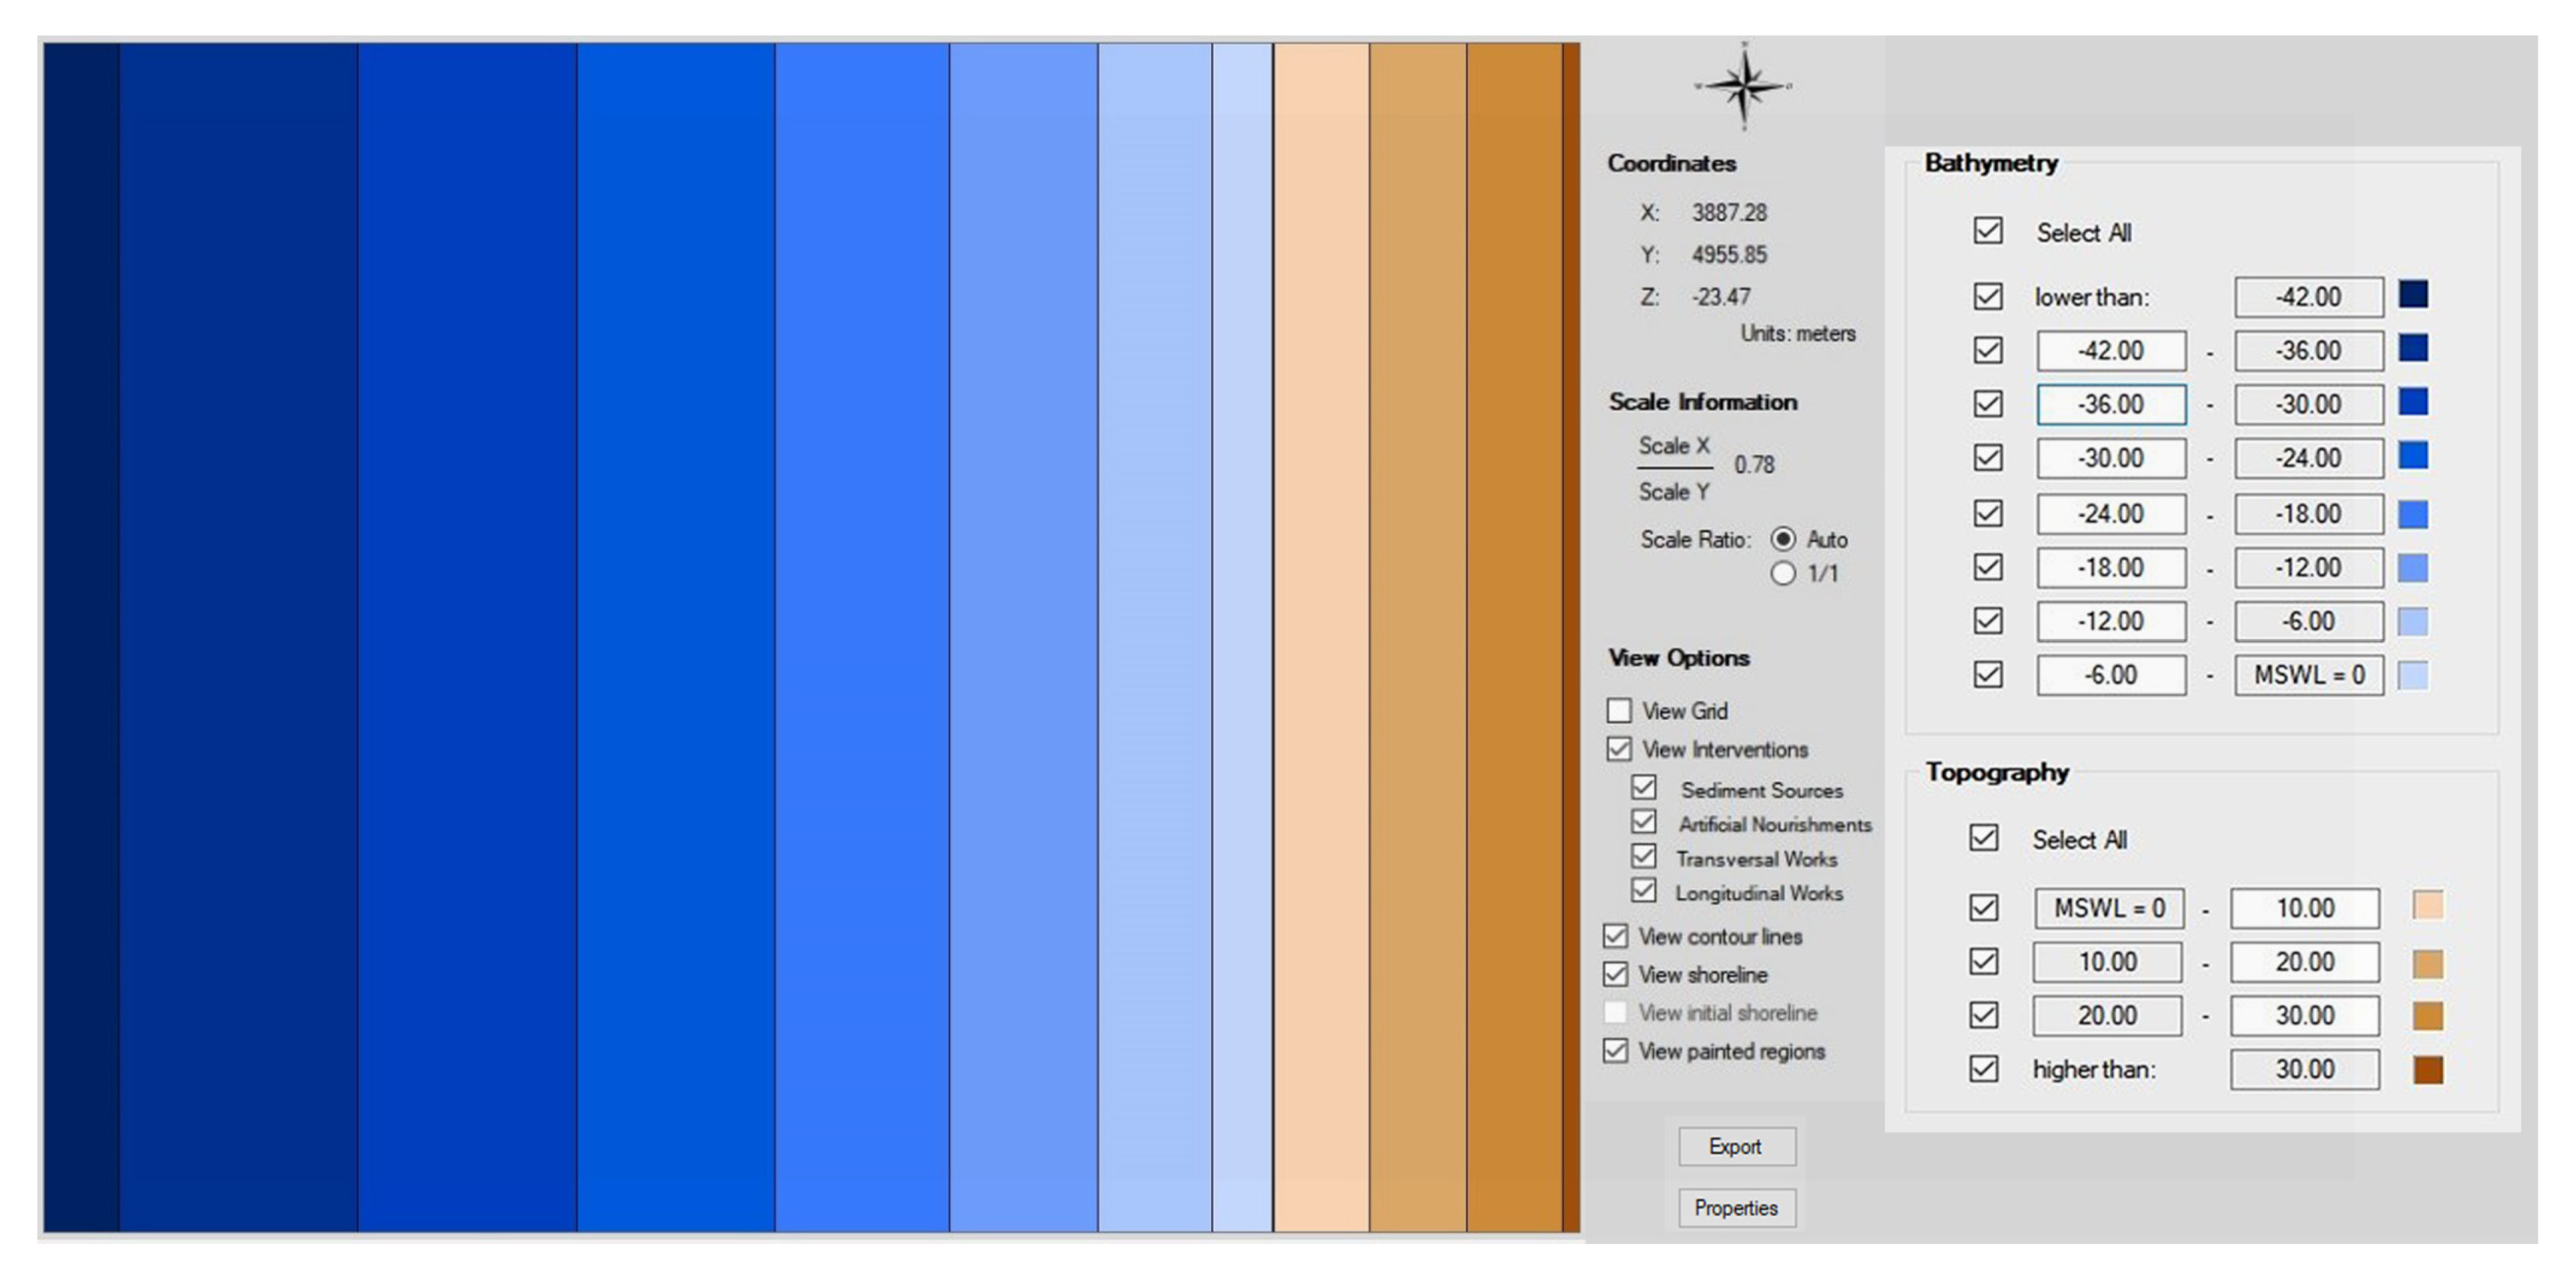
To apply LTC, the user defines the bathymetry and topography of the study area, the wave climate offshore, the domain boundary conditions, water level, and sediment’s properties [
5]. To simulate artificial nourishments, the users define the nourishment volume, starting and ending instants of the intervention, and the deposition area [
5,
22].
A key parameter to obtain the benefits of coastal erosion mitigation measures is the value of the coastal territories that are maintained due to the interventions. Coastal territories provide multiple functions and services, as they merge frequent urban uses and natural ecosystems functions, making it possible to identify, within a range of few kilometers, a high variety of land uses. Those land use values should consider social, environmental, and cultural aspects and require sensitivity analysis prior to its application to adequately characterize the provided services of the territory [
7].
2.2. Costs
The costs of artificial nourishments are related to the means employed to collect, transport, and deposit the sediments on the coast (dredges, trucks, pipelines, boats, etc.) and mainly, the distance between the source and deposition site (beach, dune, or littoral drift).
The sources of nourishment sediments may include extraction from quarries, reprocessing of quarry/mining waste, fossil beach deposits, port and harbor dredging activities, lagoon or barrier island coasts, offshore deposits, or derived from downdrift or updrift sediments and fluvial supplies [
23]. According to Dean [
24], the main advantage of using offshore sources is the ease of being able to find large stretches of adequate sand, usually 1 to 20 km away from the deposition site. However, offshore dredging must be carried out outside the active beach profile, otherwise, the sediments will just be moved from one place to the other, in the same dynamic coastal system. The material dredged from ports and navigation channels represents an economically interesting sediment source, since dredging is imperative in these places to guarantee navigation conditions. In this case, those sediments can be reused downdrift for beach nourishment, which will bring the advantages of relatively short distances and related costs for transportation [
25].
In the present study, it was assumed a unitary sediments nourishment cost equal to 2 EUR/m
3, considering all the nourishment operations (sediments dredging, transport, and deposition). This value was defined on the basis of the unitary costs of sand transposition studies carried out for the Portuguese west coast [
26,
27].
2.3. Cost–Benefit Analysis
Benefit–cost ratio (BCR), net present value (NPV) and break-even year are three economic parameters that compare costs and benefits, allowing one to make considerations about the economic feasibility of a project. The break-even year corresponds to the year in which the benefits are compensated for by the costs.
The NPV evaluation criterion is given as the sum of discounted benefits minus the sum of discounted costs that occur in each period, t, over the lifetime of the project, T [
13], and is given by:
where
r is the time discount rate. The investment is considered economically viable when the NPV > 0, i.e., when the benefits’ present value (first term on right-hand side of Equation (1)) exceeds the costs’ present value (second term on right-hand side).
The BCR evaluation criterion is given by the sum of discounted benefits relative to the sum of discounted costs that occur in each period,
t, over the lifetime of the project,
T [
13], and is given by:
The investment is considered economically viable when the BCR > 1, i.e., when the benefits’ present value (numerator on right-hand side of Equation (2)) exceeds the costs’ present value (denominator on right-hand side). Note that the BCR = 1 when the NPV = 0.
3. Case Studies and Nourishment Scenarios
The cost–benefit of artificial nourishments interventions was discussed using two study areas. The first study focused on discussing the physical and economic performance of nourishment interventions considering a hypothetical study area to better control all the considered parameters. Afterwards, the cost–benefit methodology was applied to study nourishment interventions performed in a real coastal stretch located in the NW coast of Portugal (Barra-Vagueira). For each study area, first, the shoreline projection was obtained for a reference scenario, corresponding to the natural shoreline evolution, without new coastal interventions during the simulation period. Secondly, assuming a baseline scenario for nourishment intervention, alternative scenarios were tested through changes in one of the factors at a time (extension alongshore, placement site, frequency, and volume).
For each nourishment scenario, the benefits were obtained annually by comparison with the shoreline position, considering the reference scenario and the ones in which the artificial nourishments are performed. All the analyses were carried out for a time horizon of 20 years. This time frame was defined in line with the period usually defined by the Portuguese coastal management authorities for the life cycle of coastal interventions projects. Furthermore, the analyzed period is in line with the numerical model assumptions for medium- to long-term projections, and the period of 20 years avoids the effect of additional unpredicted long-term processes and/or anthropogenic and social actions.
3.1. Generic Study Area
The calculation domain of the generic study area in LTC was defined by regular topohydrography with an area of 8 × 10 km
2,
Figure 1, represented by a regular square grid (20 m spaced), with 401 × 501 points (respectively, in the cross-shore and longshore directions). Dean profile,
h = Axm [
28], was considered to define the bathymetry of the study area in which the sediment-dependent scale parameter (
A) was defined to be equal to 0.127, according to Portuguese beaches sediment grain size, and the parameter related to the beach exposure to wave energy (
m) was defined to be equal to 2/3 (value generally considered for intermediate beaches). The topography was defined with a constant slope equal to 2%. The cross-shore active profile was considered constant throughout the simulation period, with a height of 10 m defined by the depth of closure (
DoC = 8 m) and the wave run-up limit (
Ru = 2 m). At the northern boundary, it was defined to be a closed condition, where there are no sedimentary exchanges with the adjacent cell, and at the south boundary, the extrapolation of the longshore sediment transport of nearby conditions was adopted.
The wave characteristics were considered constant along all the numerical modelling simulations, with offshore wave height (
H0) of 2 m, wave period of 9.34 s (
T), and 10 degrees wave direction with the west, clockwise (α
0). The alongshore sediment transport was defined to be calculated according to CERC formula [
29].
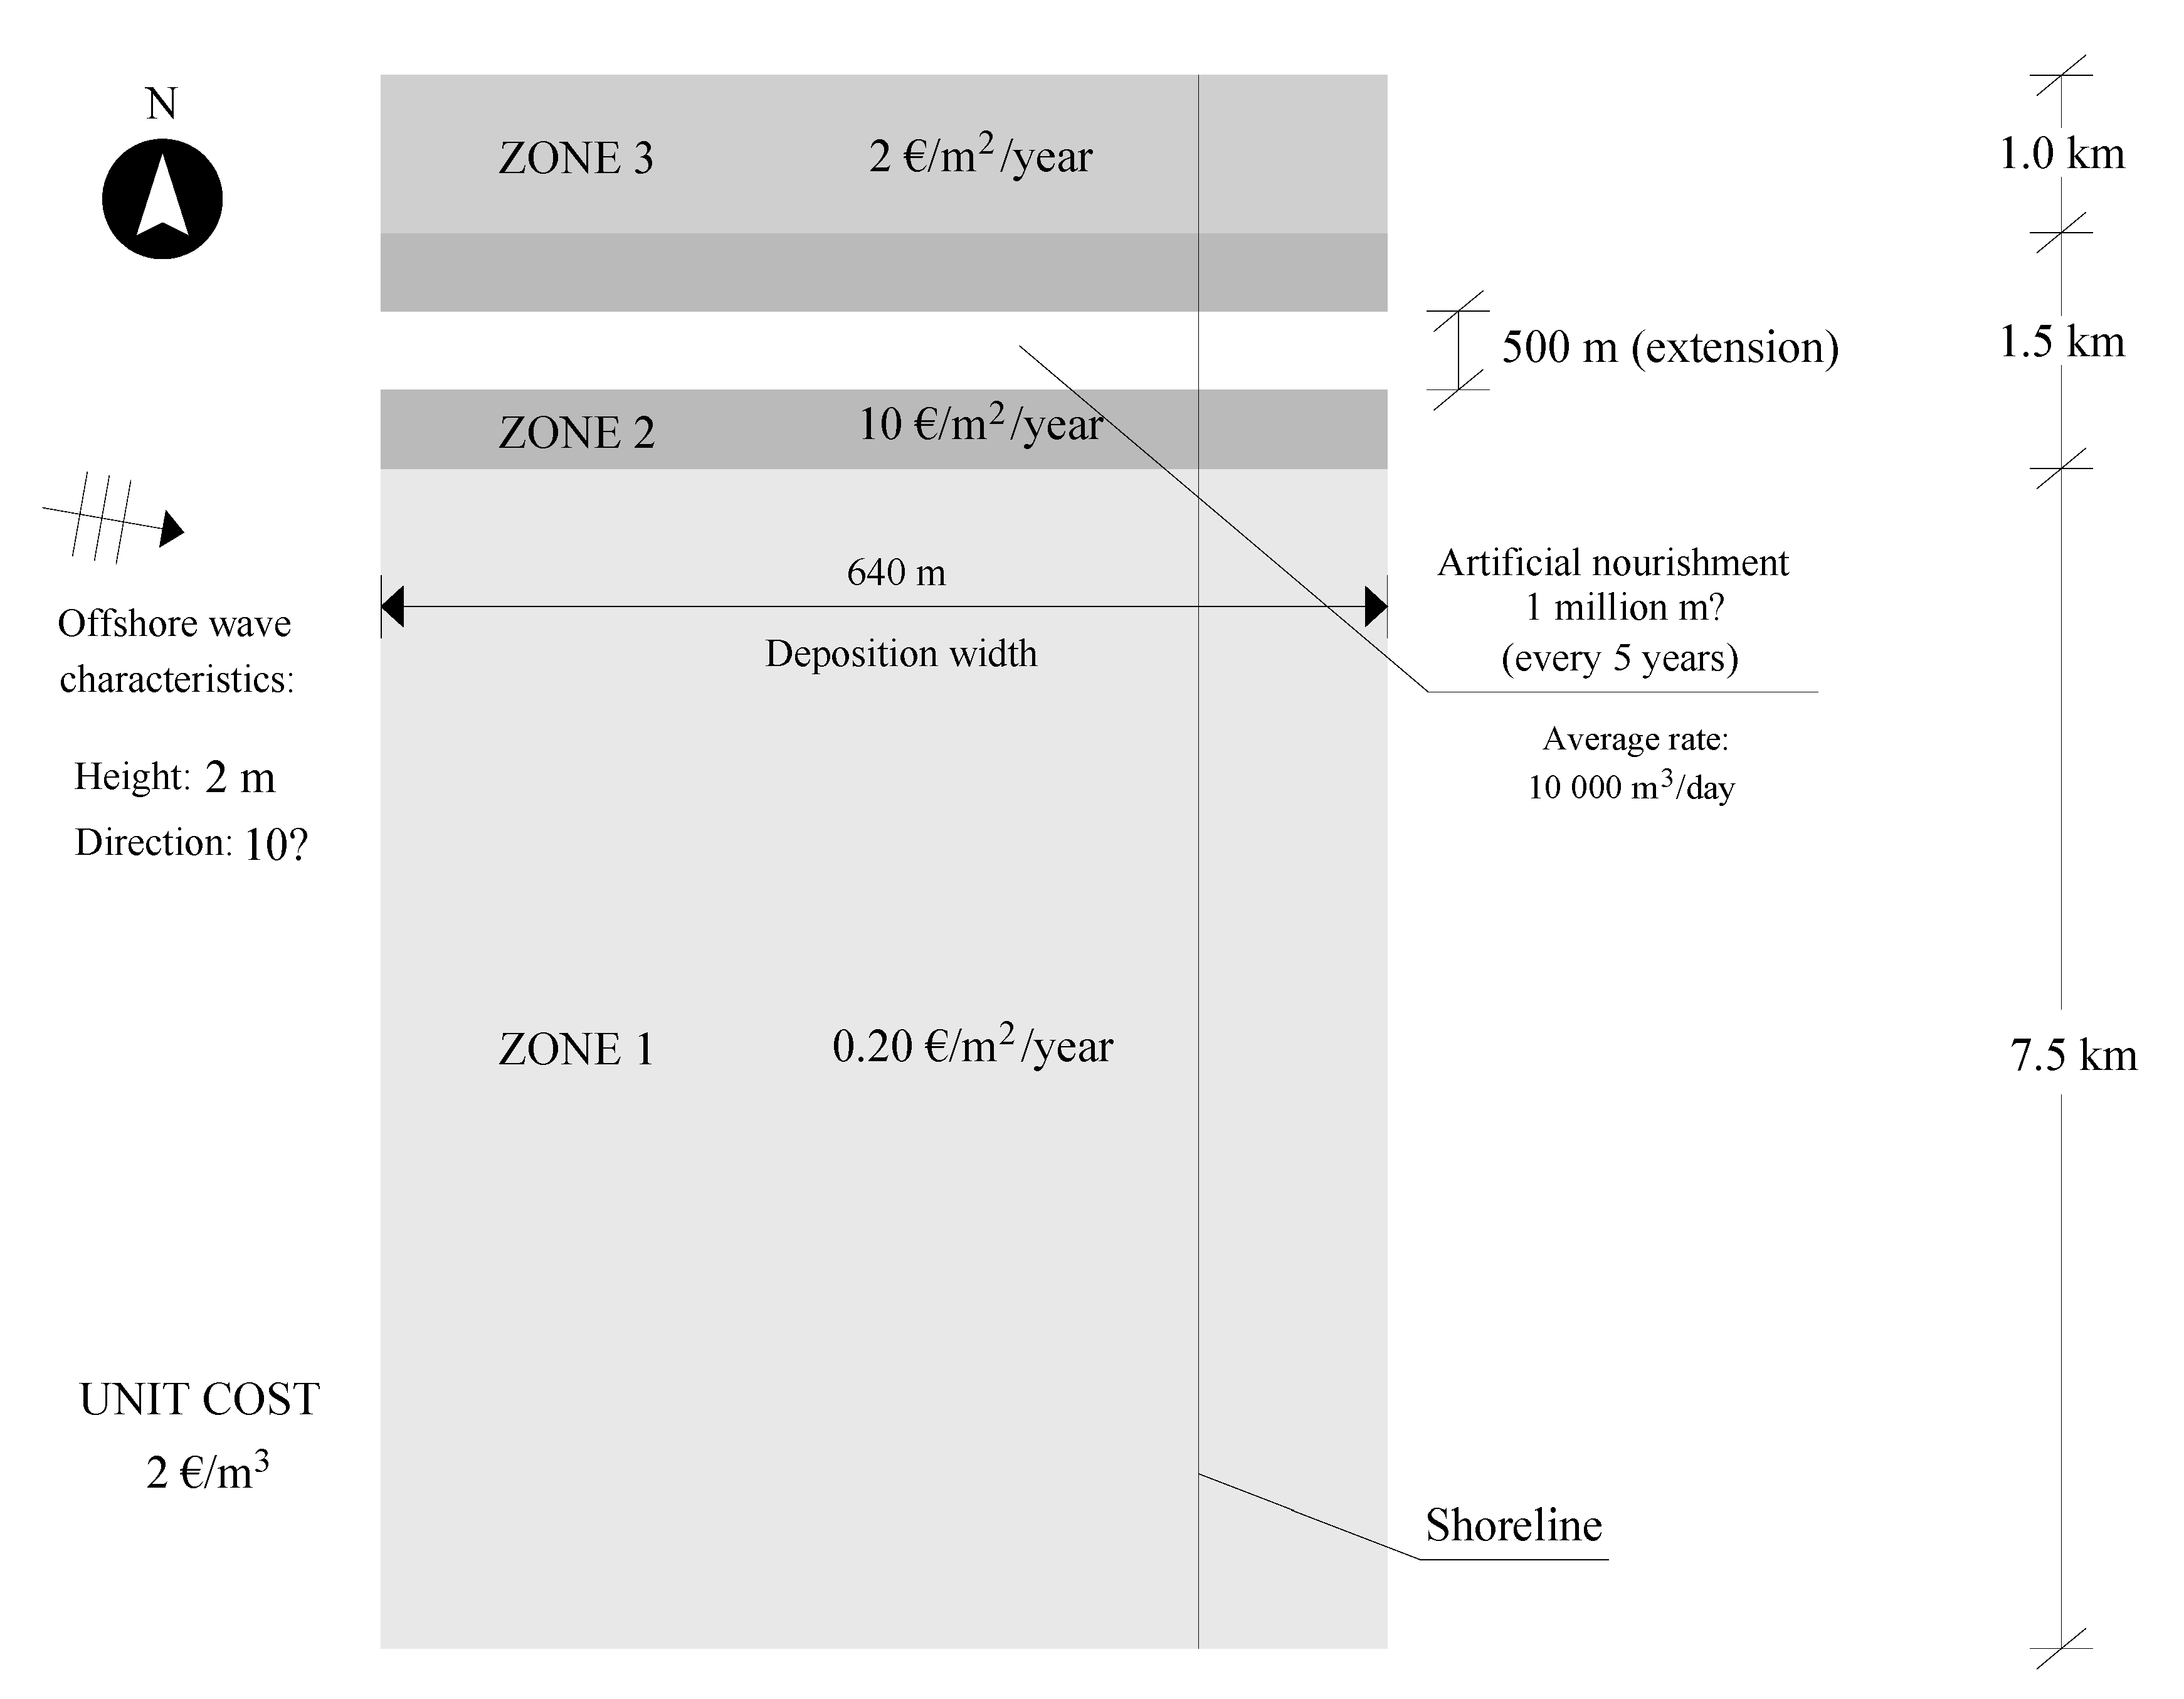
The longshore extension of the generic study area was divided into three different zones. As shown in
Figure 2, from north to south, the northern longshore extension of 1.0 km was defined with beach uses (beach provides coastal protection and recreational uses). Then, an urban area that can support several different activities and uses (restaurants, hotels, economic services, etc.) is defined, measuring 1.5 km in length. The remaining longshore extension was defined as a forest, providing this land use regulation for timber, habitat for biodiversity, erosion control, and many others [
30,
31,
32]. The monetary value attributed to each land use is presented in
Table 1. The time discount rate (
r) was considered to be 3% [
32].
The artificial nourishment baseline scenario considers the nourishment of 1 million m
3 of sediment, every 5 years, at an average deposition rate of 10 thousand m
3 per day. The nourished area is characterized by a longshore extension of 500 m, centered in the urban area, and covering the entire cross shore active profile width, approximately 600 m (
Figure 2).
Table 2 summarizes the nine alternative nourishment scenarios evaluated.
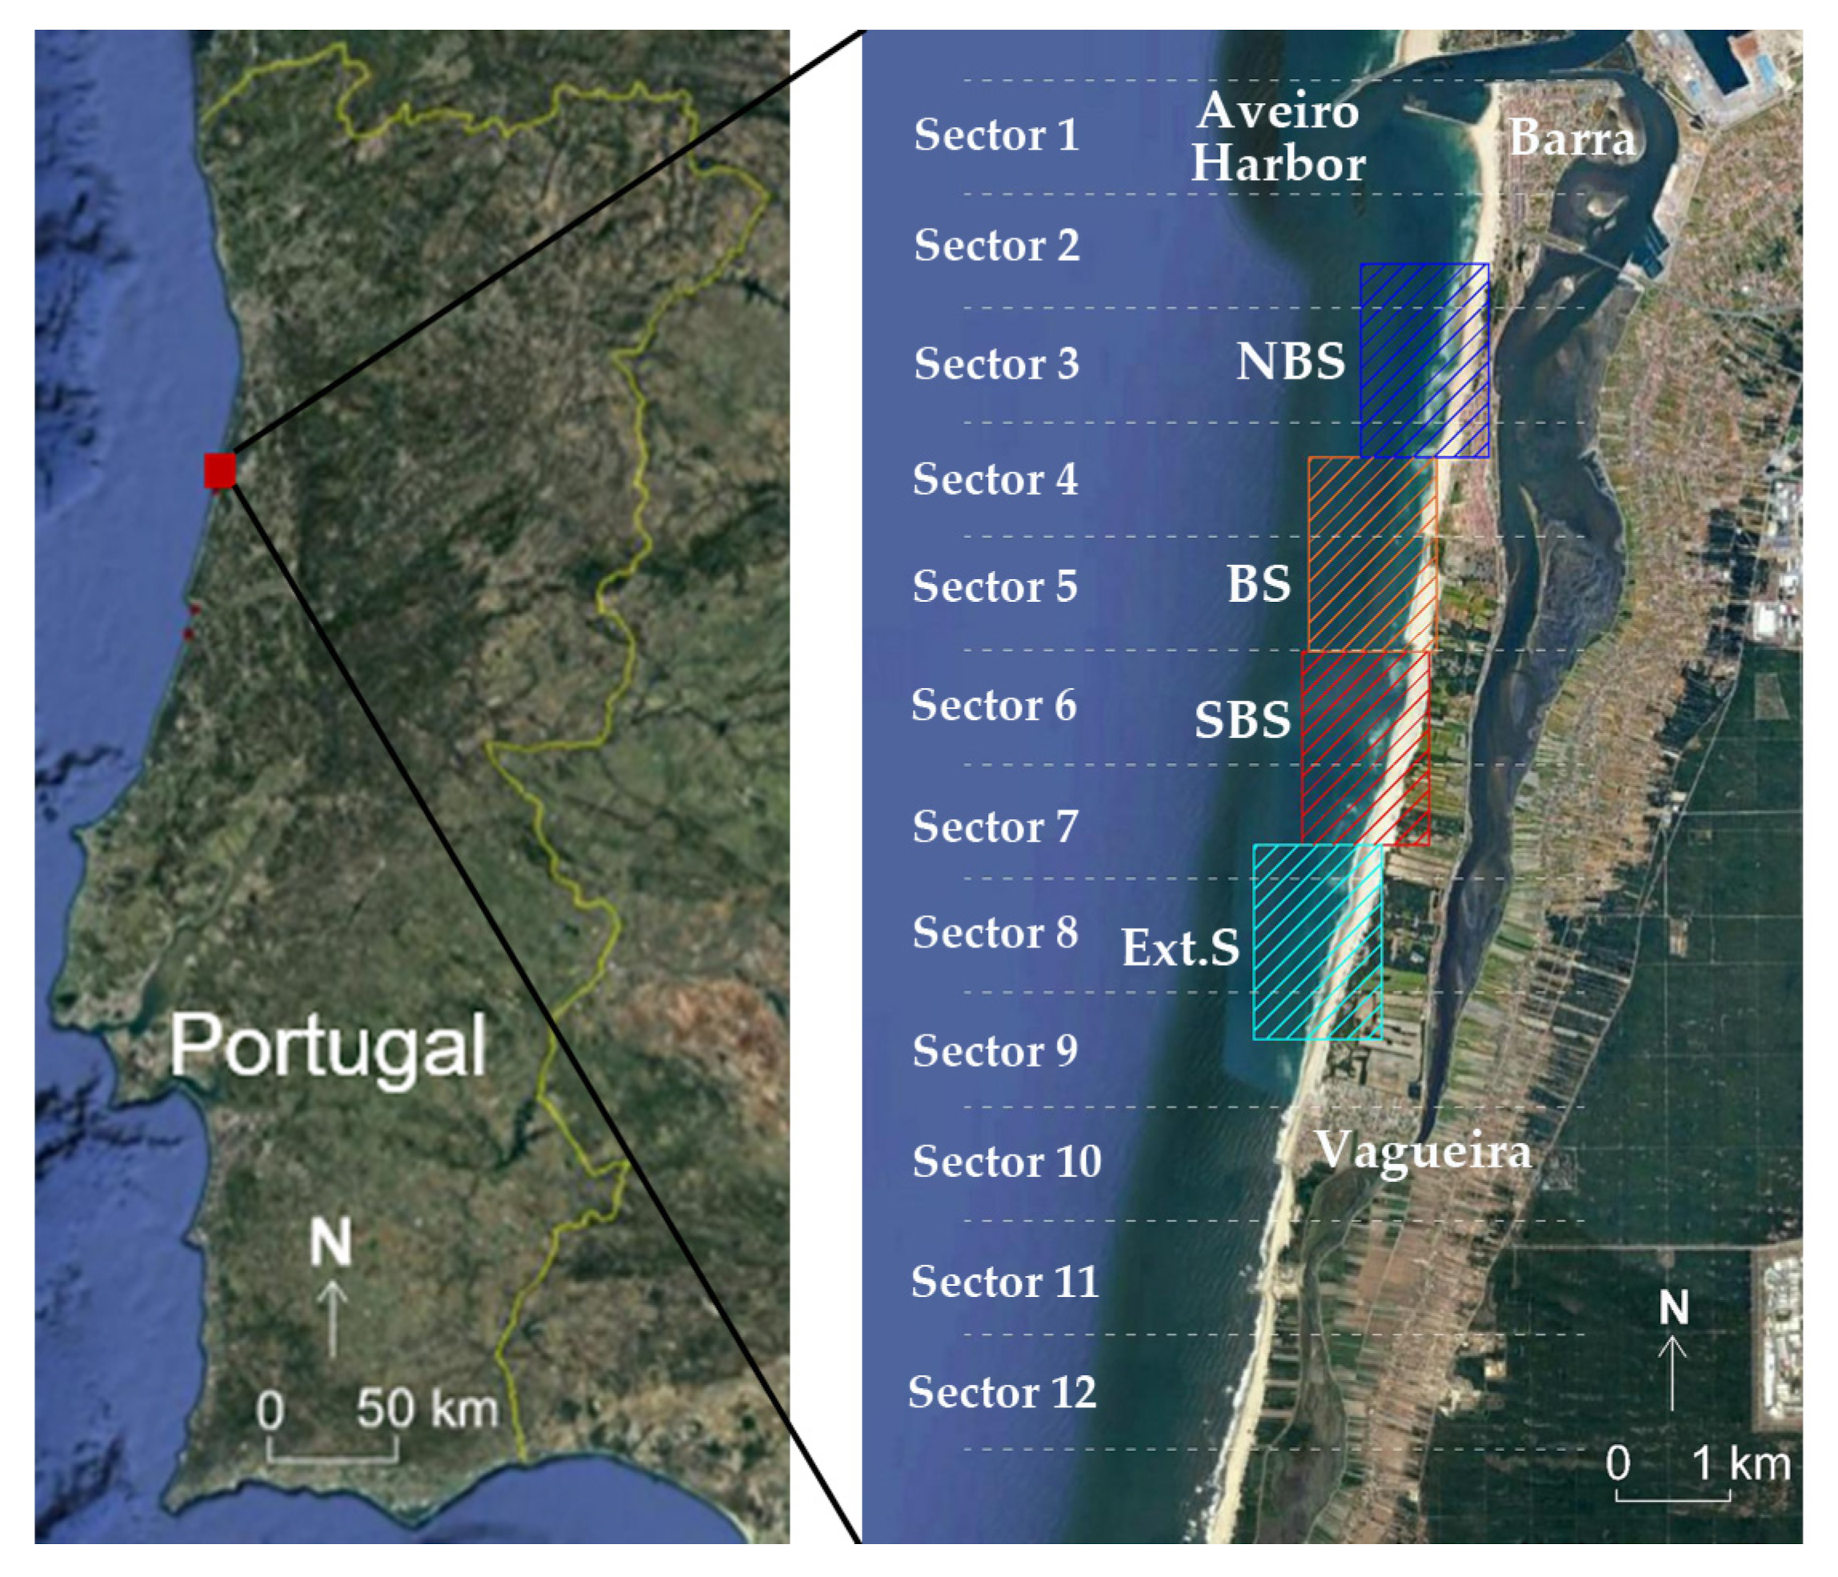
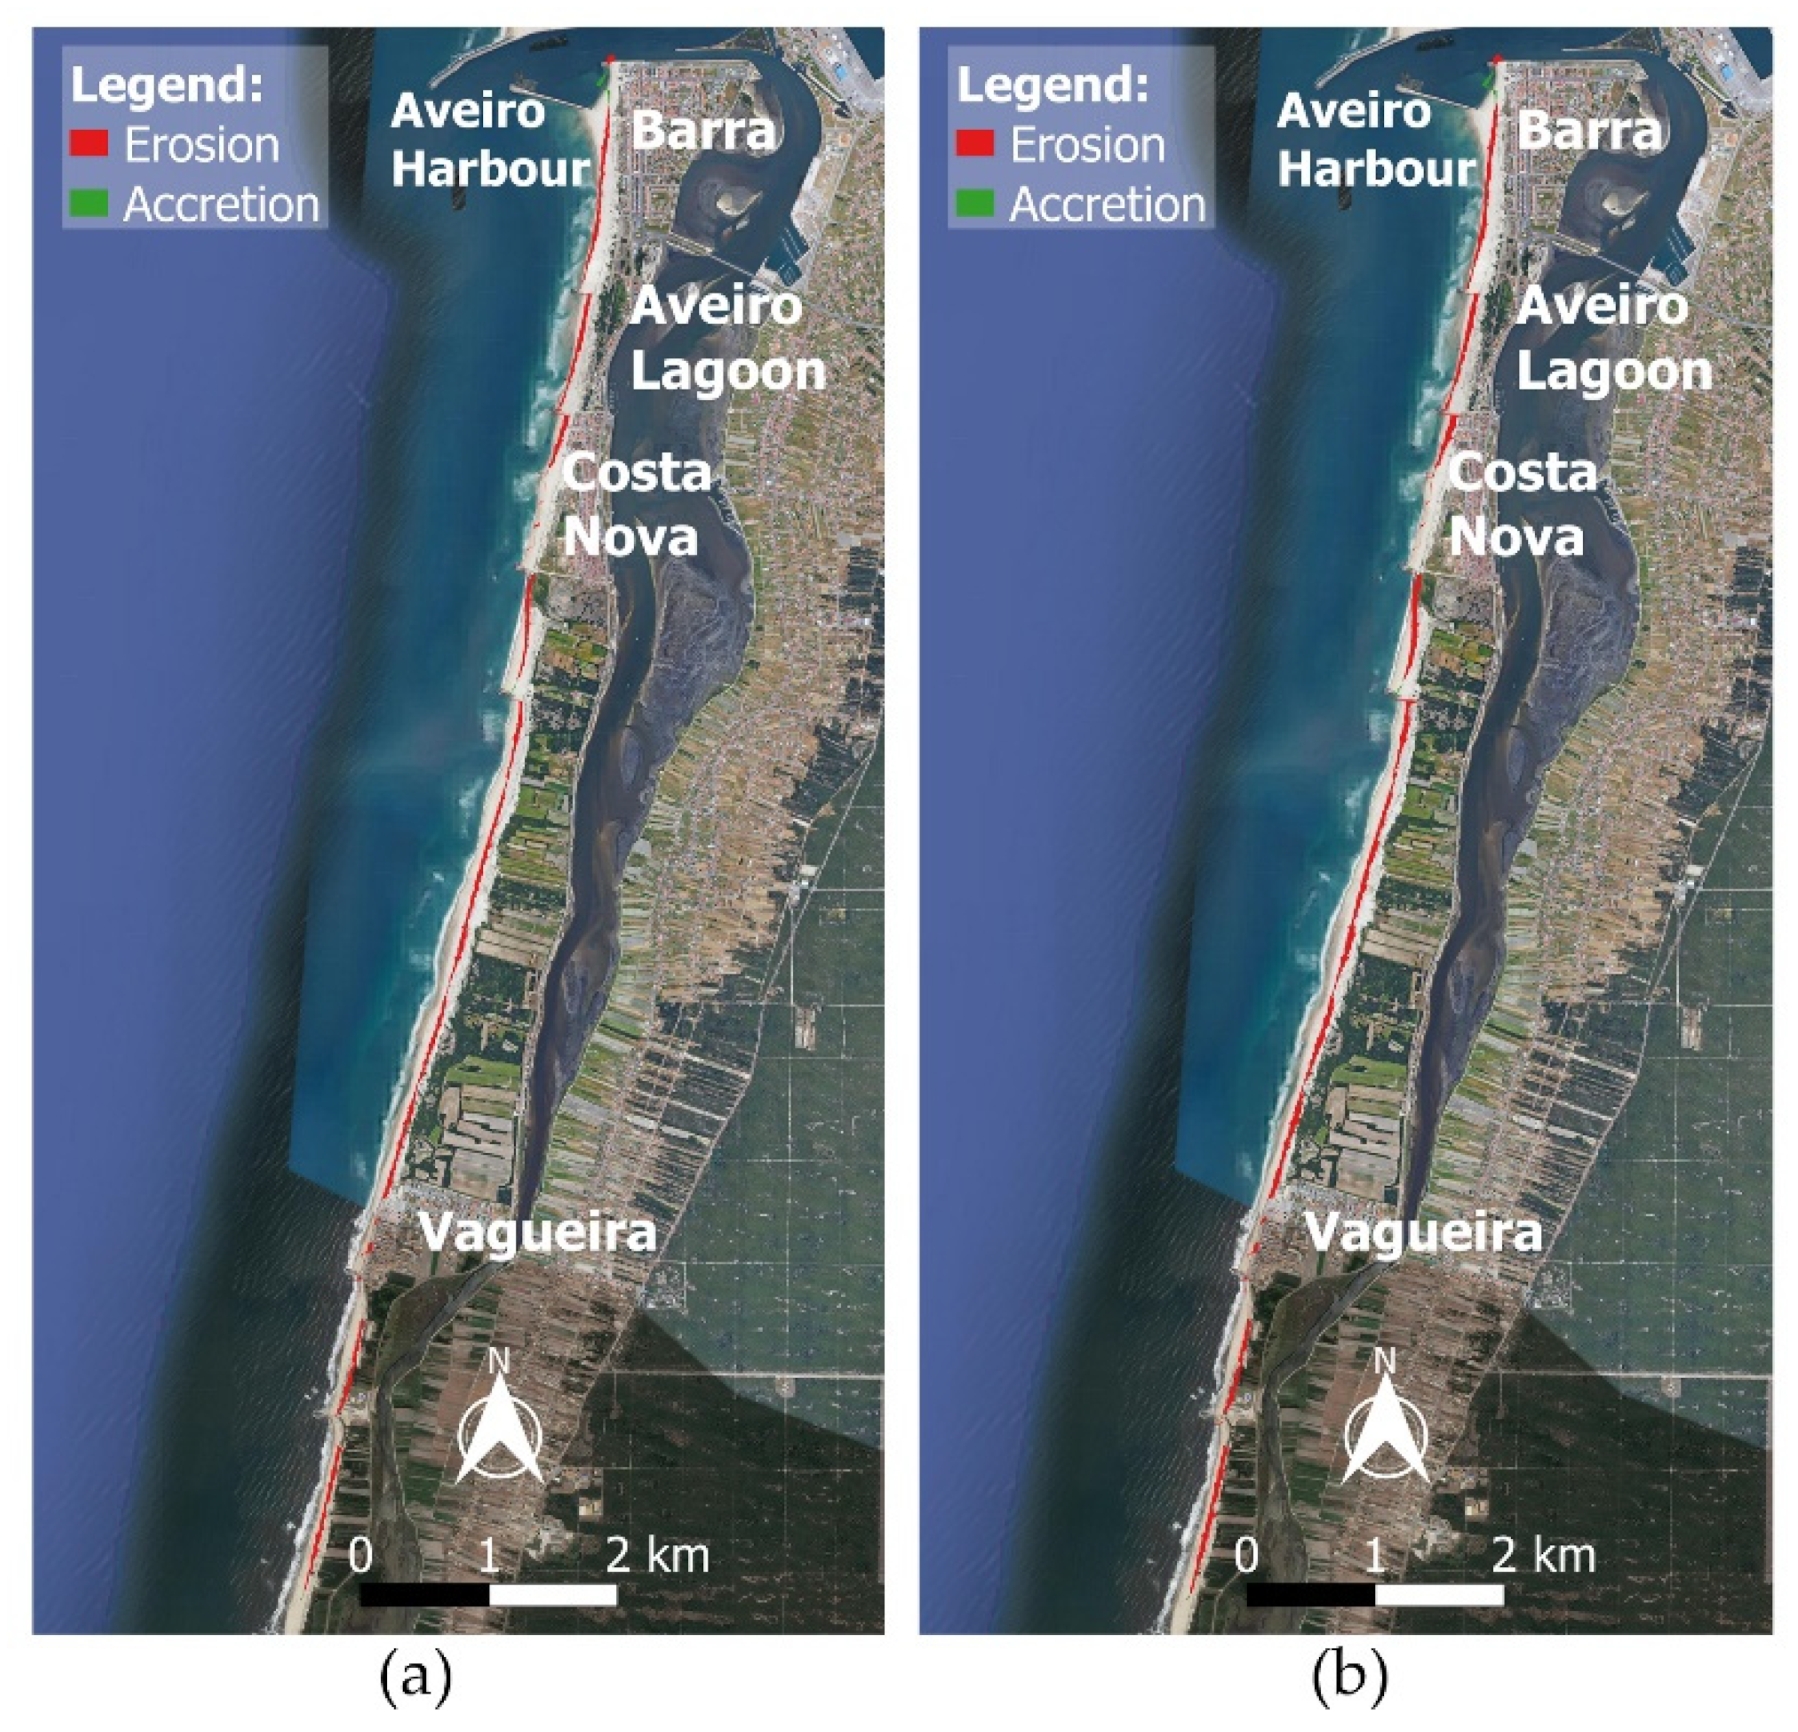
3.2. Barra-Vagueira Coastal Stretch
Barra-Vagueira coastal stretch (
Figure 3), NW coast of Portugal, with an extension of approximately 12 km, is an erosion hotspot, presenting, in the last 50 years, erosion rates that reached 8 m/year [
34,
35]. In the last decades, artificial nourishment has become one of the main coastal interventions to mitigate coastal erosion, being performed in the coastal stretch low frequency interventions of thousands cubic meters of sediments [
36,
37].
The numerical domain of this coastal stretch was defined on the basis of the shoreline position identified through the analysis of the digital elevation model provided by COSMO [
38]. On the basis of the shoreline position, the bathymetry and topography of the stretch was represented by a regular grid of points spaced 20 m in both directions (west–east and north–south), with an extension of 6 × 12 km
2. On the basis of the COSMO surveys [
38], the bathymetry was adjusted to Dean profile’s shape, being considered regular and parallel. The topography was approximated to a constant slope equal to 3%. The numerical domain includes the 19 coastal structures existing on the stretch Barra-Vagueira (8 groins and 11 longitudinal revetments).
The wave climate used as input of the model considered the wave series generated in the scope of the MarRisk research project [
39], and the sediment transport was defined to be calculated according to the CERC formula [
29]. The model was calibrated through the values of the shoreline change rate, comparing the mean shoreline retreat obtained numerically with values described in the bibliography.
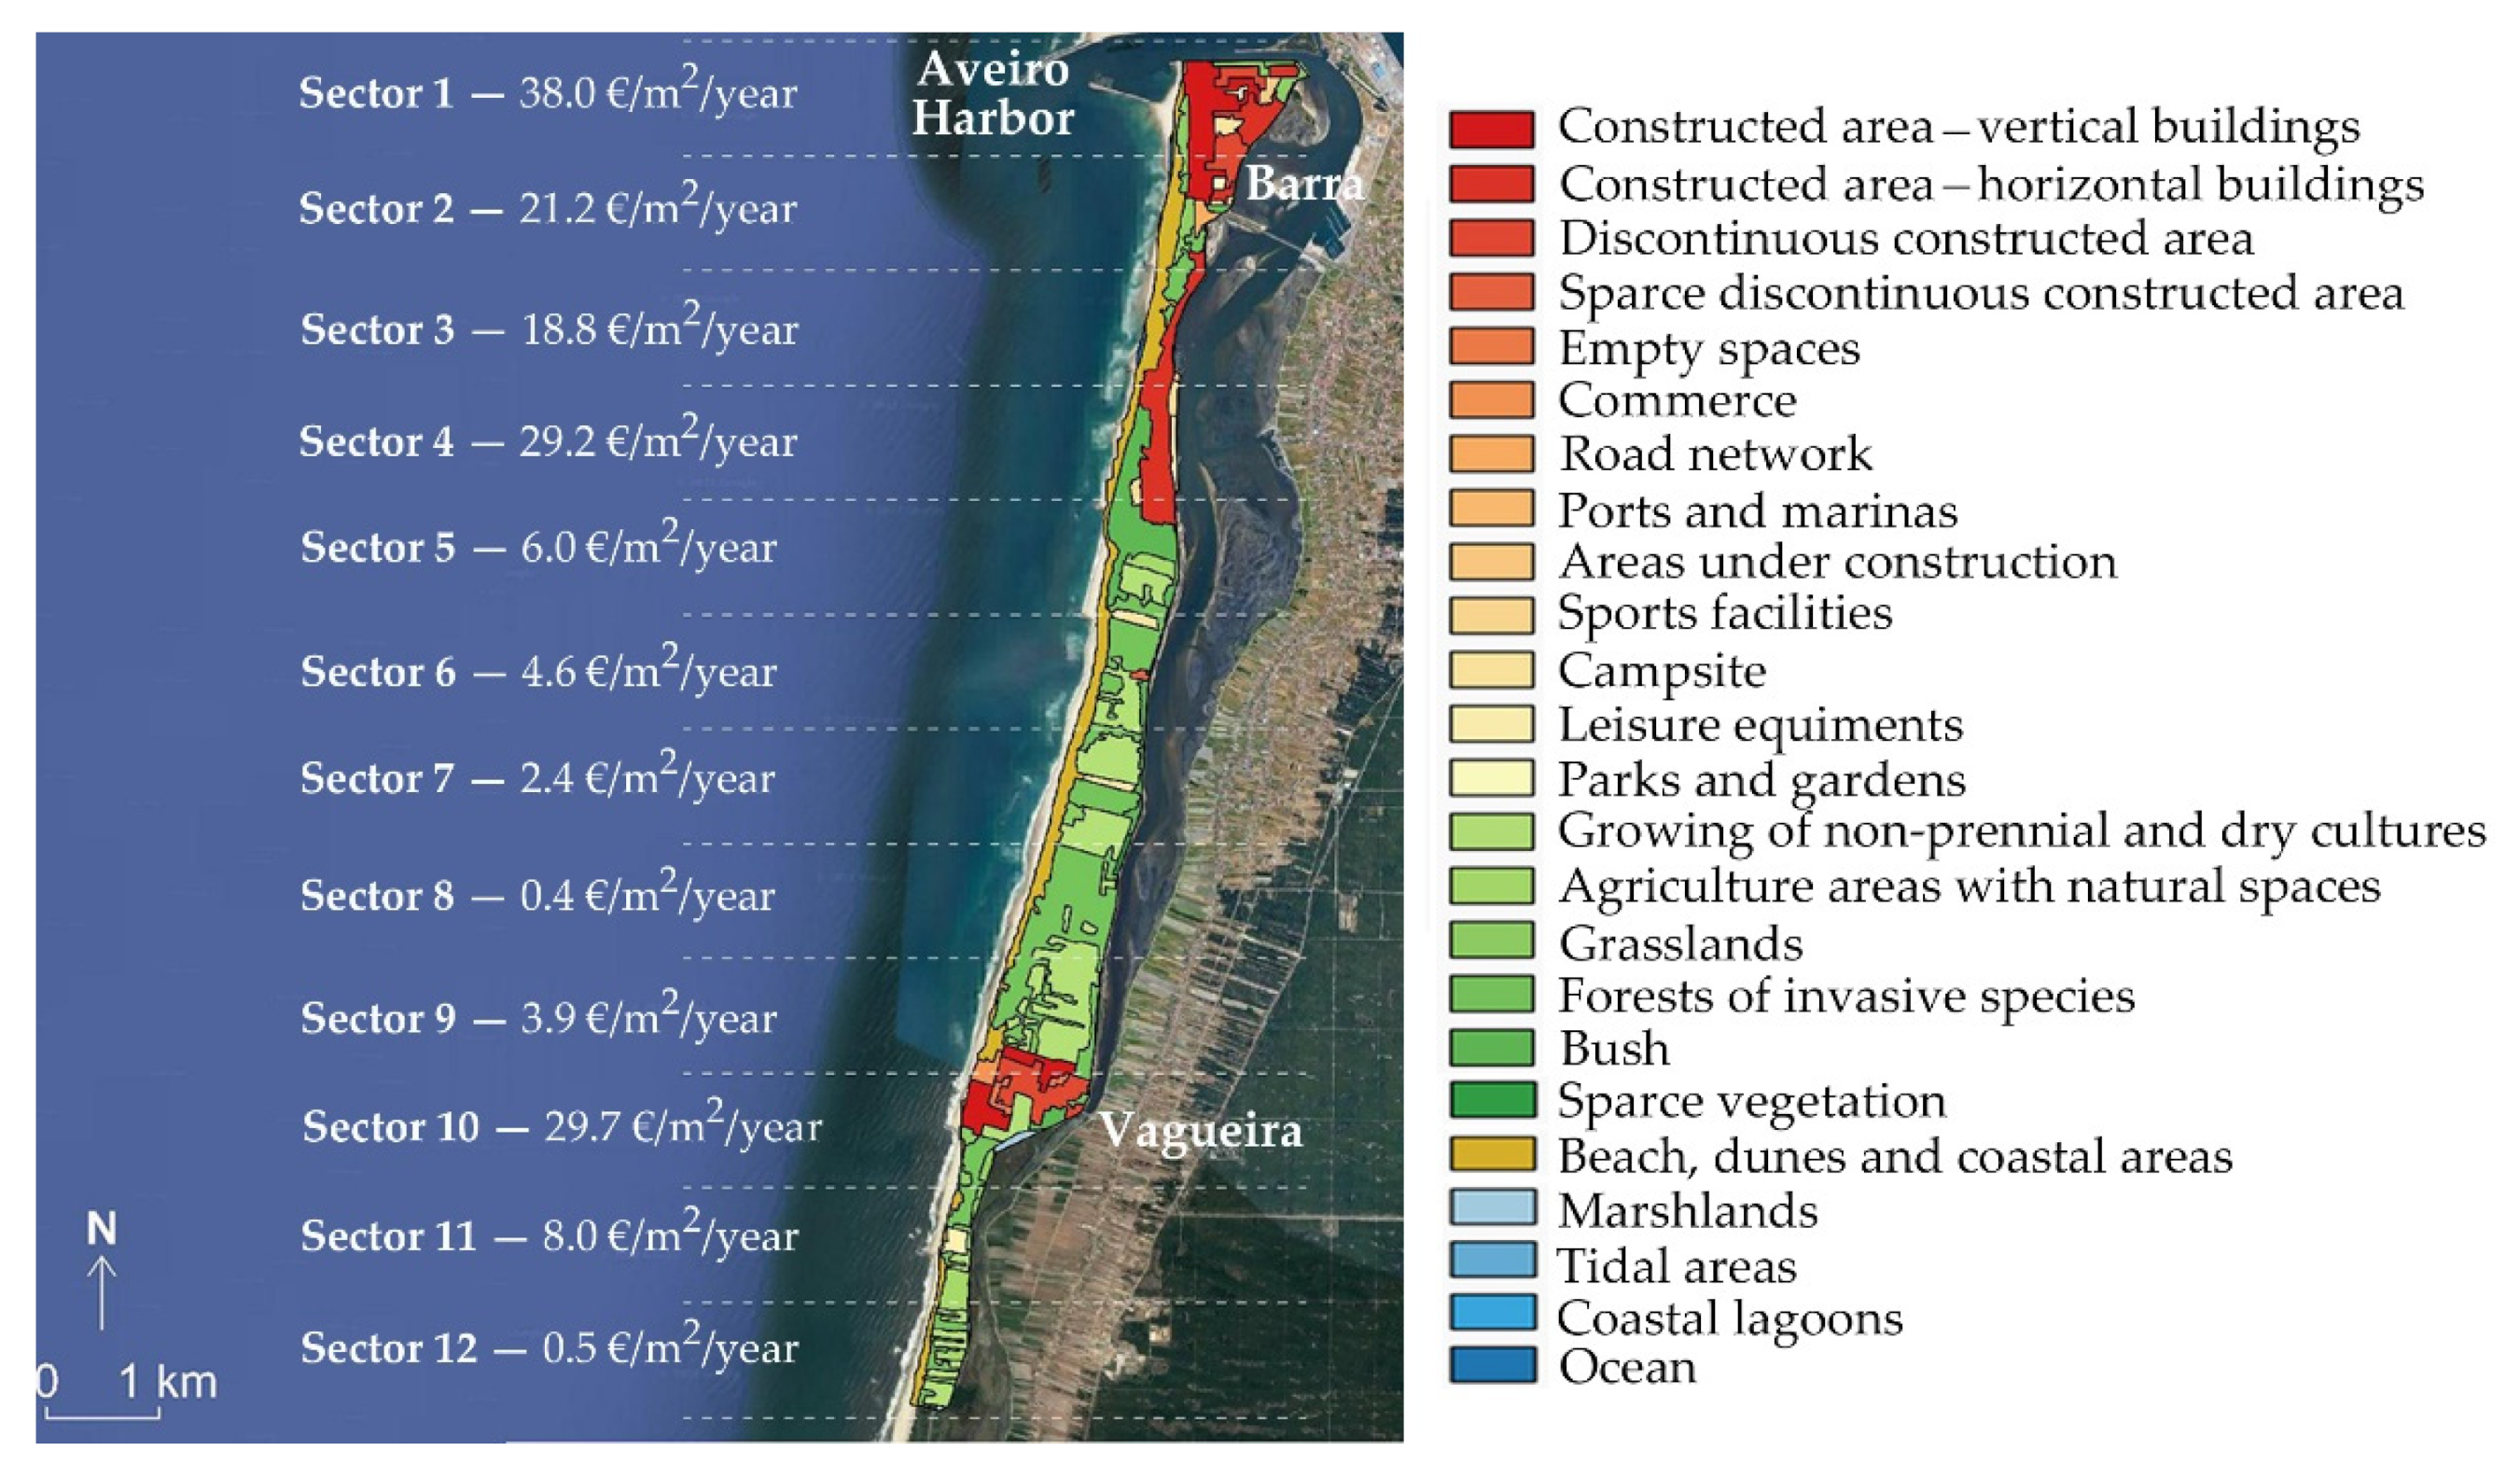
The economic value of the land use was based on several studies [
27,
40,
41]. In these studies, the authors divided the longshore extension of Barra-Vagueira into 12 sectors (
Figure 4), obtaining in each sector the territory value through a methodology that combines land uses, based on the analysis of the Portuguese land cover map [
42] and benefits transfer approaches.
A nourishment baseline scenario (BS) was adopted, considering the annual deposition of 5 × 10
5 m
3 of sediments, in front of a groin field, referred to as BS in
Figure 3. This baseline scenario was defined on the basis of the historical data of artificial nourishments interventions that have been performed in the study area [
36,
37]. Nine alternative scenarios have been defined through changes in one of the factors at a time, considering three alternatives for each of the analyzed parameters, namely volume, frequency, and placement site alongshore (
Table 3).
4. Results
The main results of all the analyzed scenarios are presented and discussed here. For both of the study areas, the results for the reference scenario are presented firstly, following by the physical and economic performance of nourishment interventions scenarios tested. Final remarks highlight the major outlines of the obtained results.
4.1. Generic Study Area
4.1.1. Reference Scenario
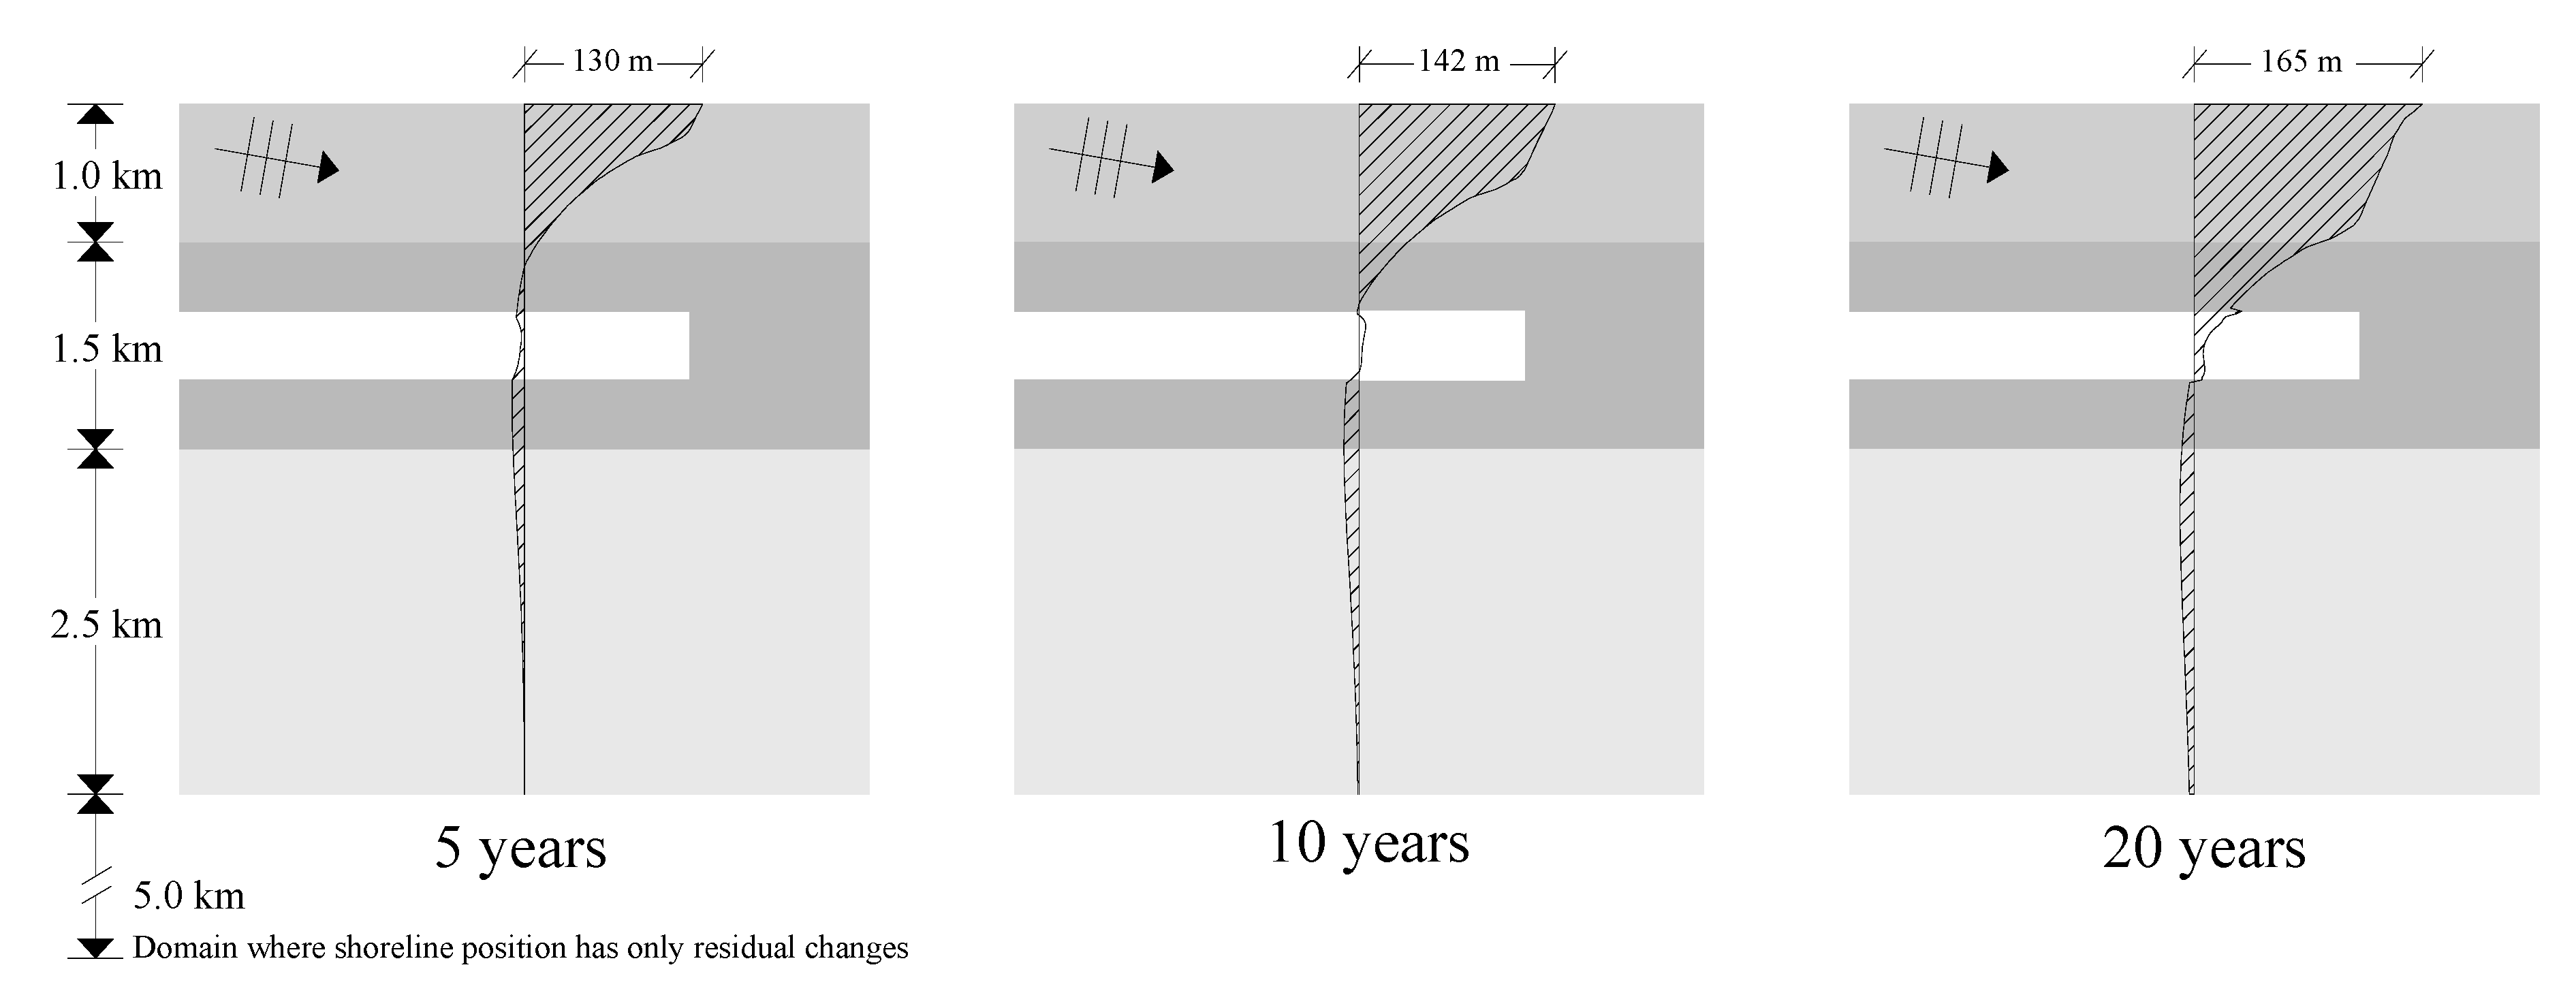
The evolution of the shoreline position after 5, 10, and 20 years is shown in
Figure 5, where substantial erosion problems are observed. Without interventions to mitigate erosion effects, the results suggest a shoreline retreat close to 230 m in the northern boundary of the calculation domain, after 20 years of simulation. In addition, the extension of the stretch defined as urban uses is affected by erosion. In economic terms, through the balance between the areas of territory lost over time (LTC results in the reference scenario) and the valuation of the territory (land use and ecosystems services), it is expected that the shoreline retreat represents a loss of approximately 0.8 million euros, after five years of simulation. After ten years, the costs exceed 3 million euros and at the end of the defined time horizon (20 years), the land loss represents approximately 12 million euros (all values updated to Year 0).
4.1.2. Artificial Nourishment Scenarios
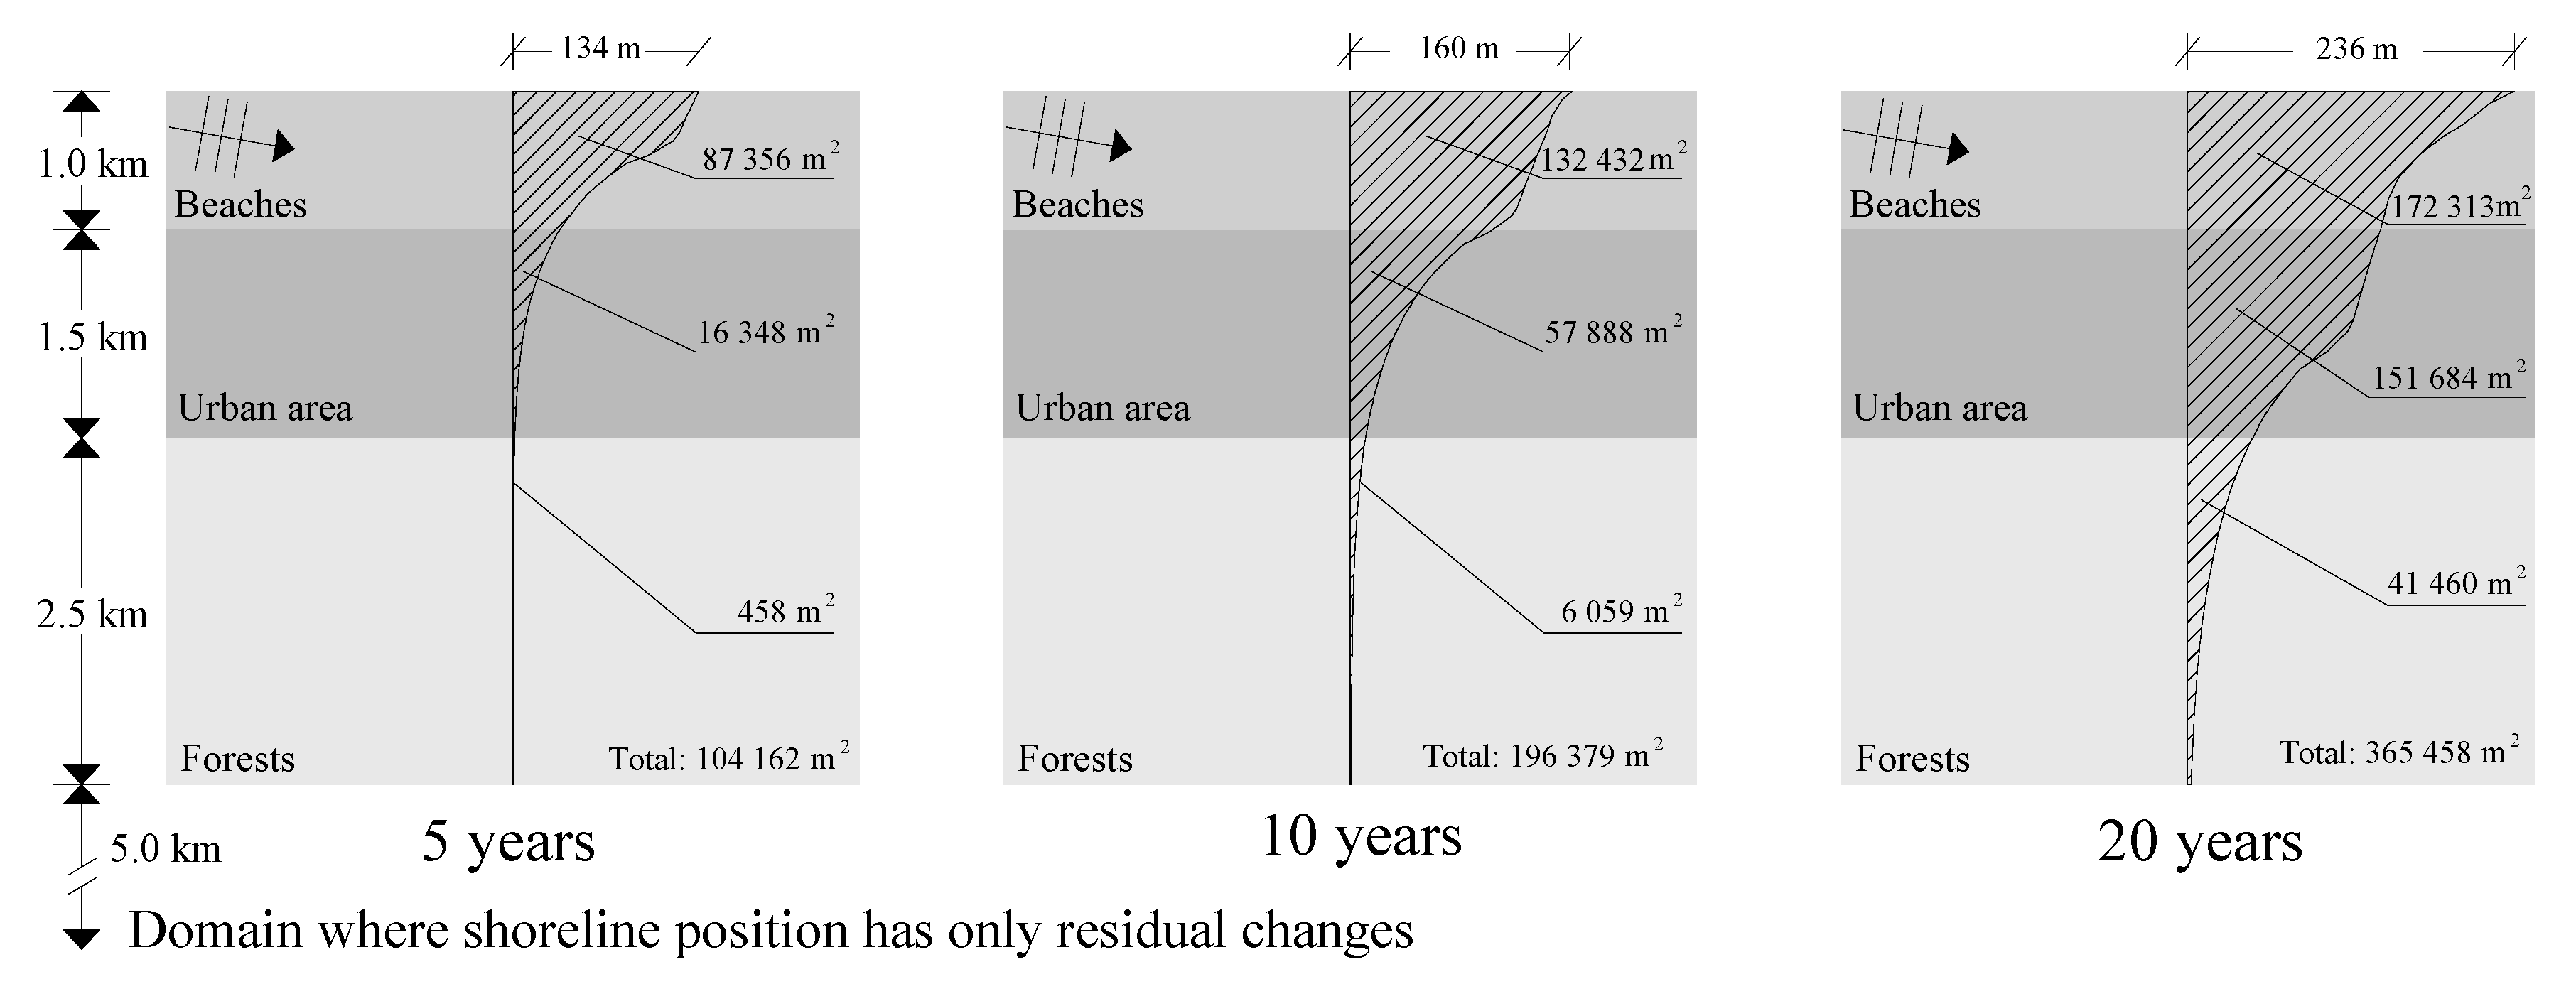
Table 4 summarizes the physical and economic results obtained for the artificial nourishment scenarios. The results show that performing a nourishment project (according to the parameters defined as the baseline scenario) allows for a decrease in the erosion areas in approximately 23 ha over the 20 years of simulation (in comparison with the reference scenario). The total addition of 4 million m
3 of sediments to the coastal system over the 20 years of simulation (four nourishment interventions) represents a total investment of approximately 6.5 million euros (at present values, considering the discount rate). The break-even is achieved after 13 years, and after 20 years, it is verified that the benefits are approximately 70% higher than the total investment costs (BCR = 1.73). Despite the positive physical and economic aspects related to the intervention, based on
Figure 6, it is possible to observe that the nourishment baseline scenario does not ensure the total protection of the urban water front.
In the following sections, changes in artificial nourishment baseline scenario characteristics are analyzed.
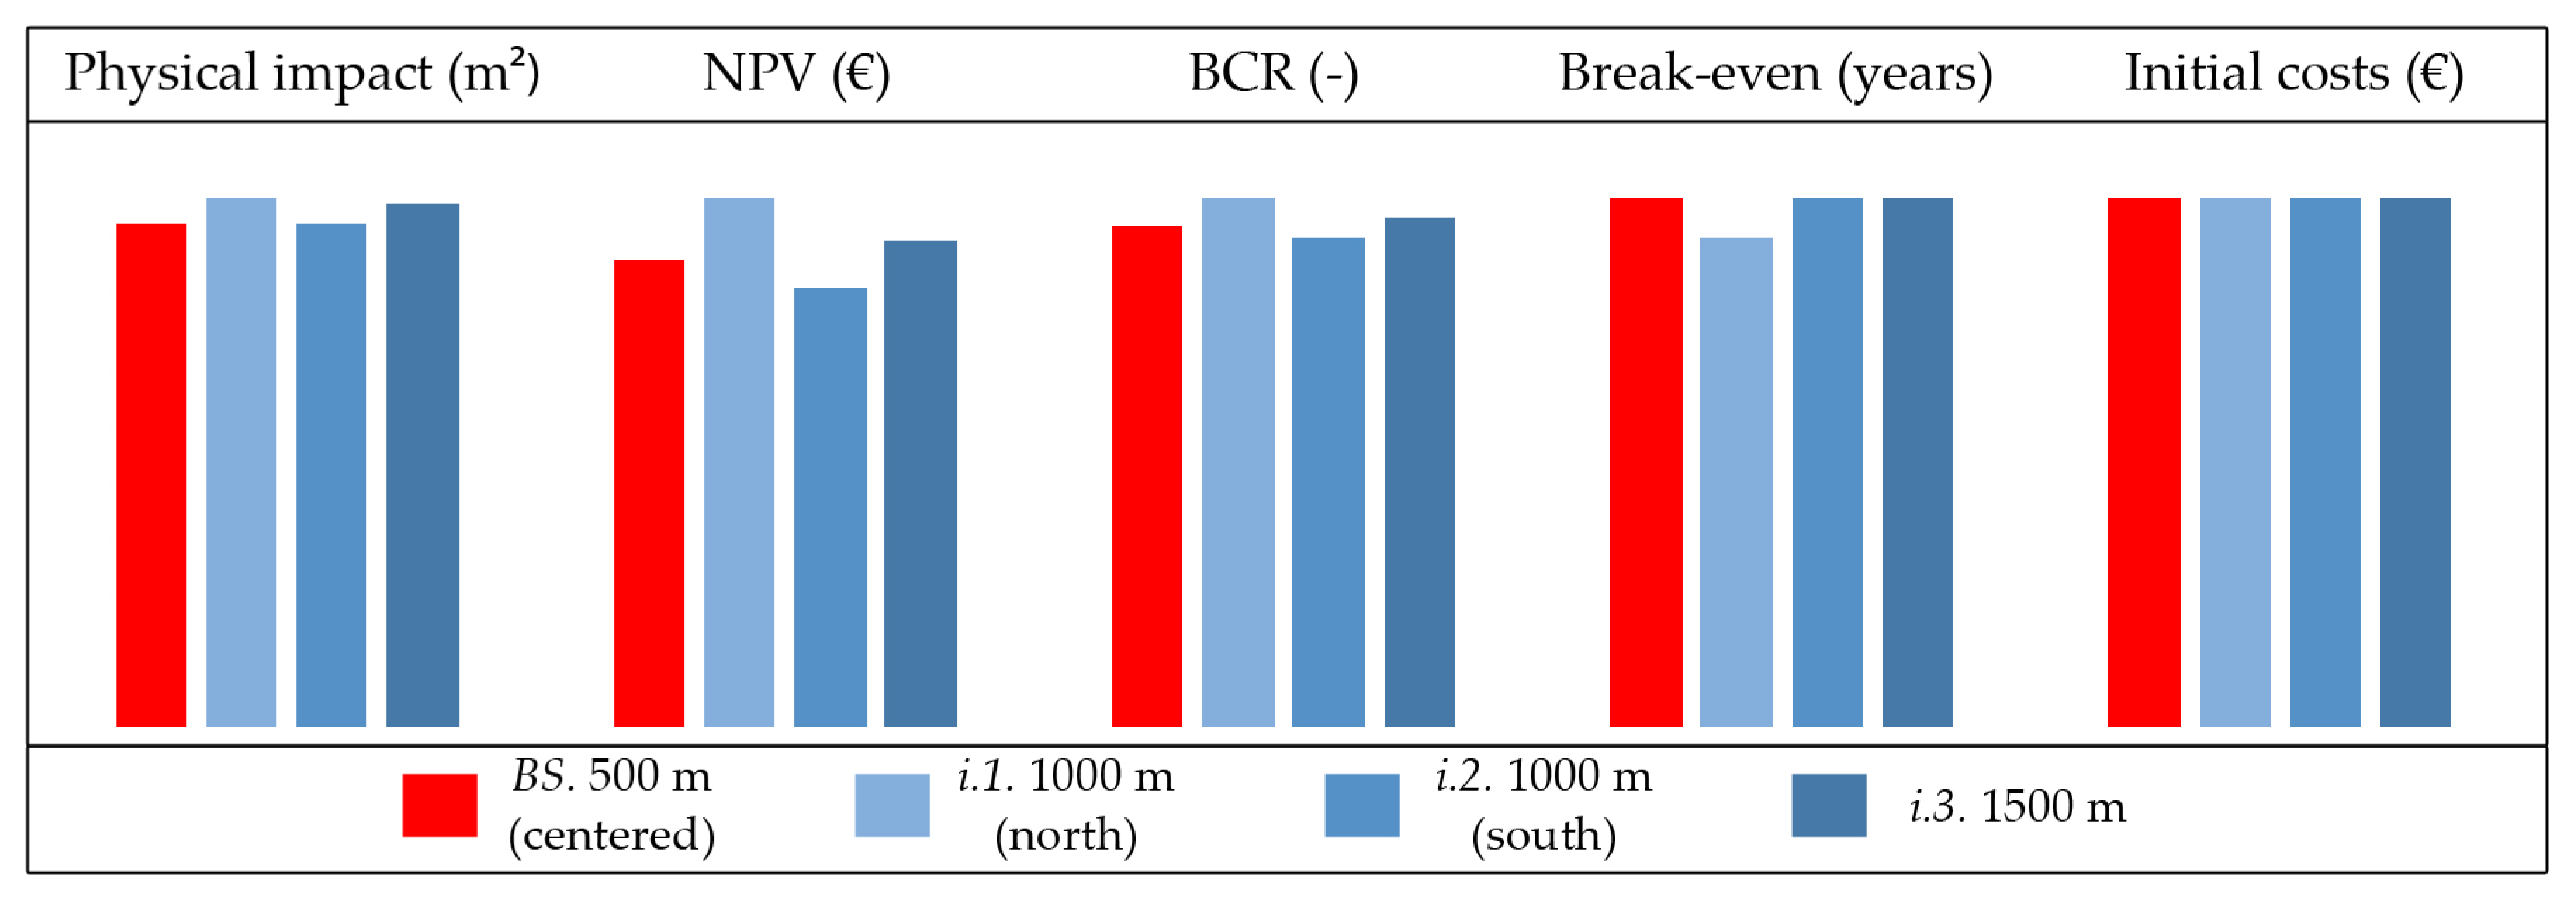
Extension
To assess the impact of the alongshore nourishment extension, three alternatives to the baseline scenario were considered, corresponding to extended nourished areas: (i.1) extending the nourishment area in 500 m in the north direction; (i.2) extending the nourishment area in 500 m in the south direction; and (i.3) 1500 m extension covering all the urban waterfront.
Based on the results presented in
Table 4 and
Figure 7, it is slightly positive to extend the nourishment area 500 m to the north. The three scenarios present similar results, but Scenario
i.1 presents simultaneously better physical and economic performances, reaching the break-even year one year earlier than the remaining scenarios (12 years instead of 13 years).
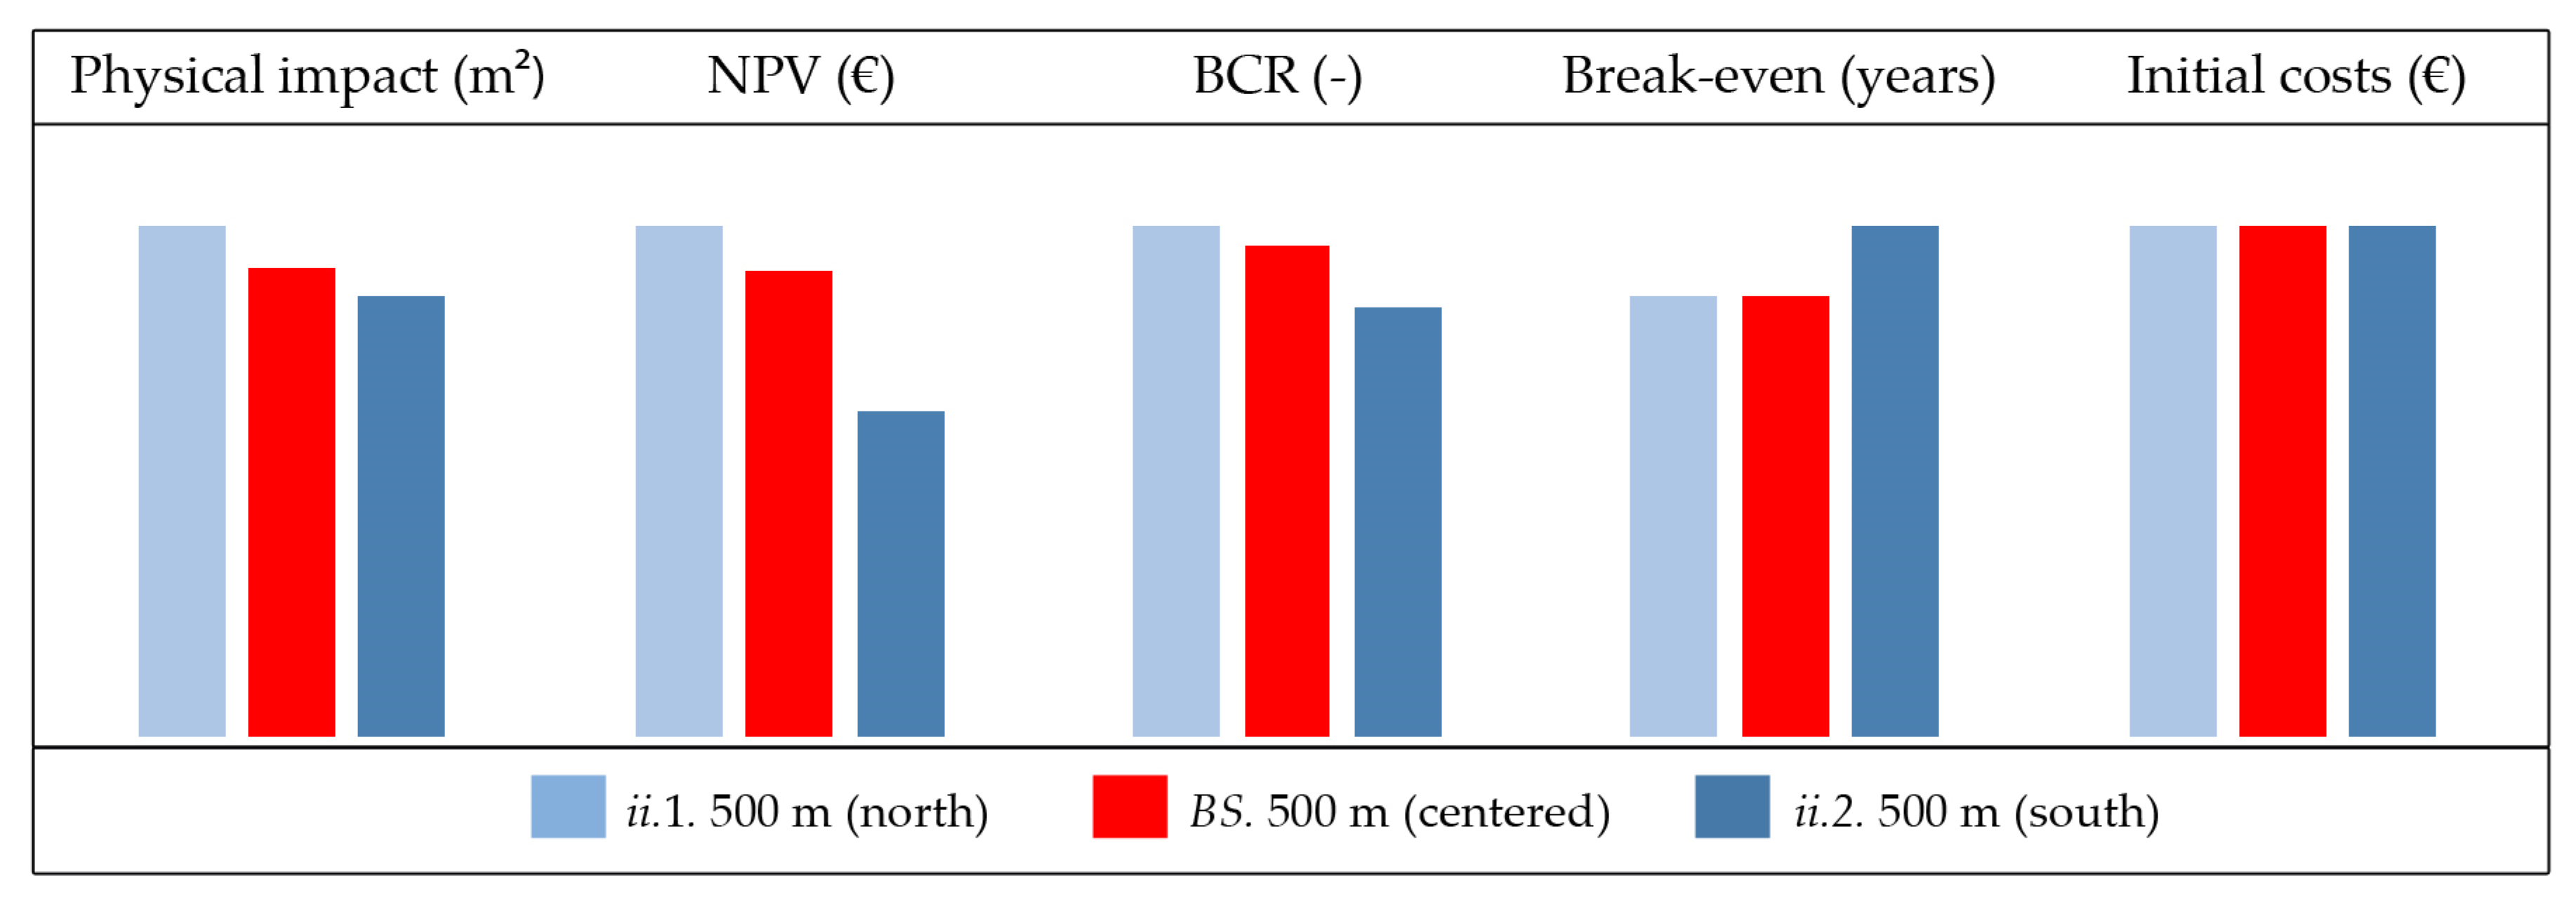
Location
In an attempt to optimize the nourishment impacts in the shoreline evolution, two alternative locations to deposit the sediments were tested: (ii.1) move the nourishment area in 500 m to the north and (ii.2) move the nourishment area in 500 m to the south.
As can be observed from
Table 4 and
Figure 8, the results suggest that the northern nourishment location results in a smaller loss of territory and, simultaneously, it represents the most positive economic result (BCR = 1.80, with the break-even reached after 13 years, as in the baseline scenario).
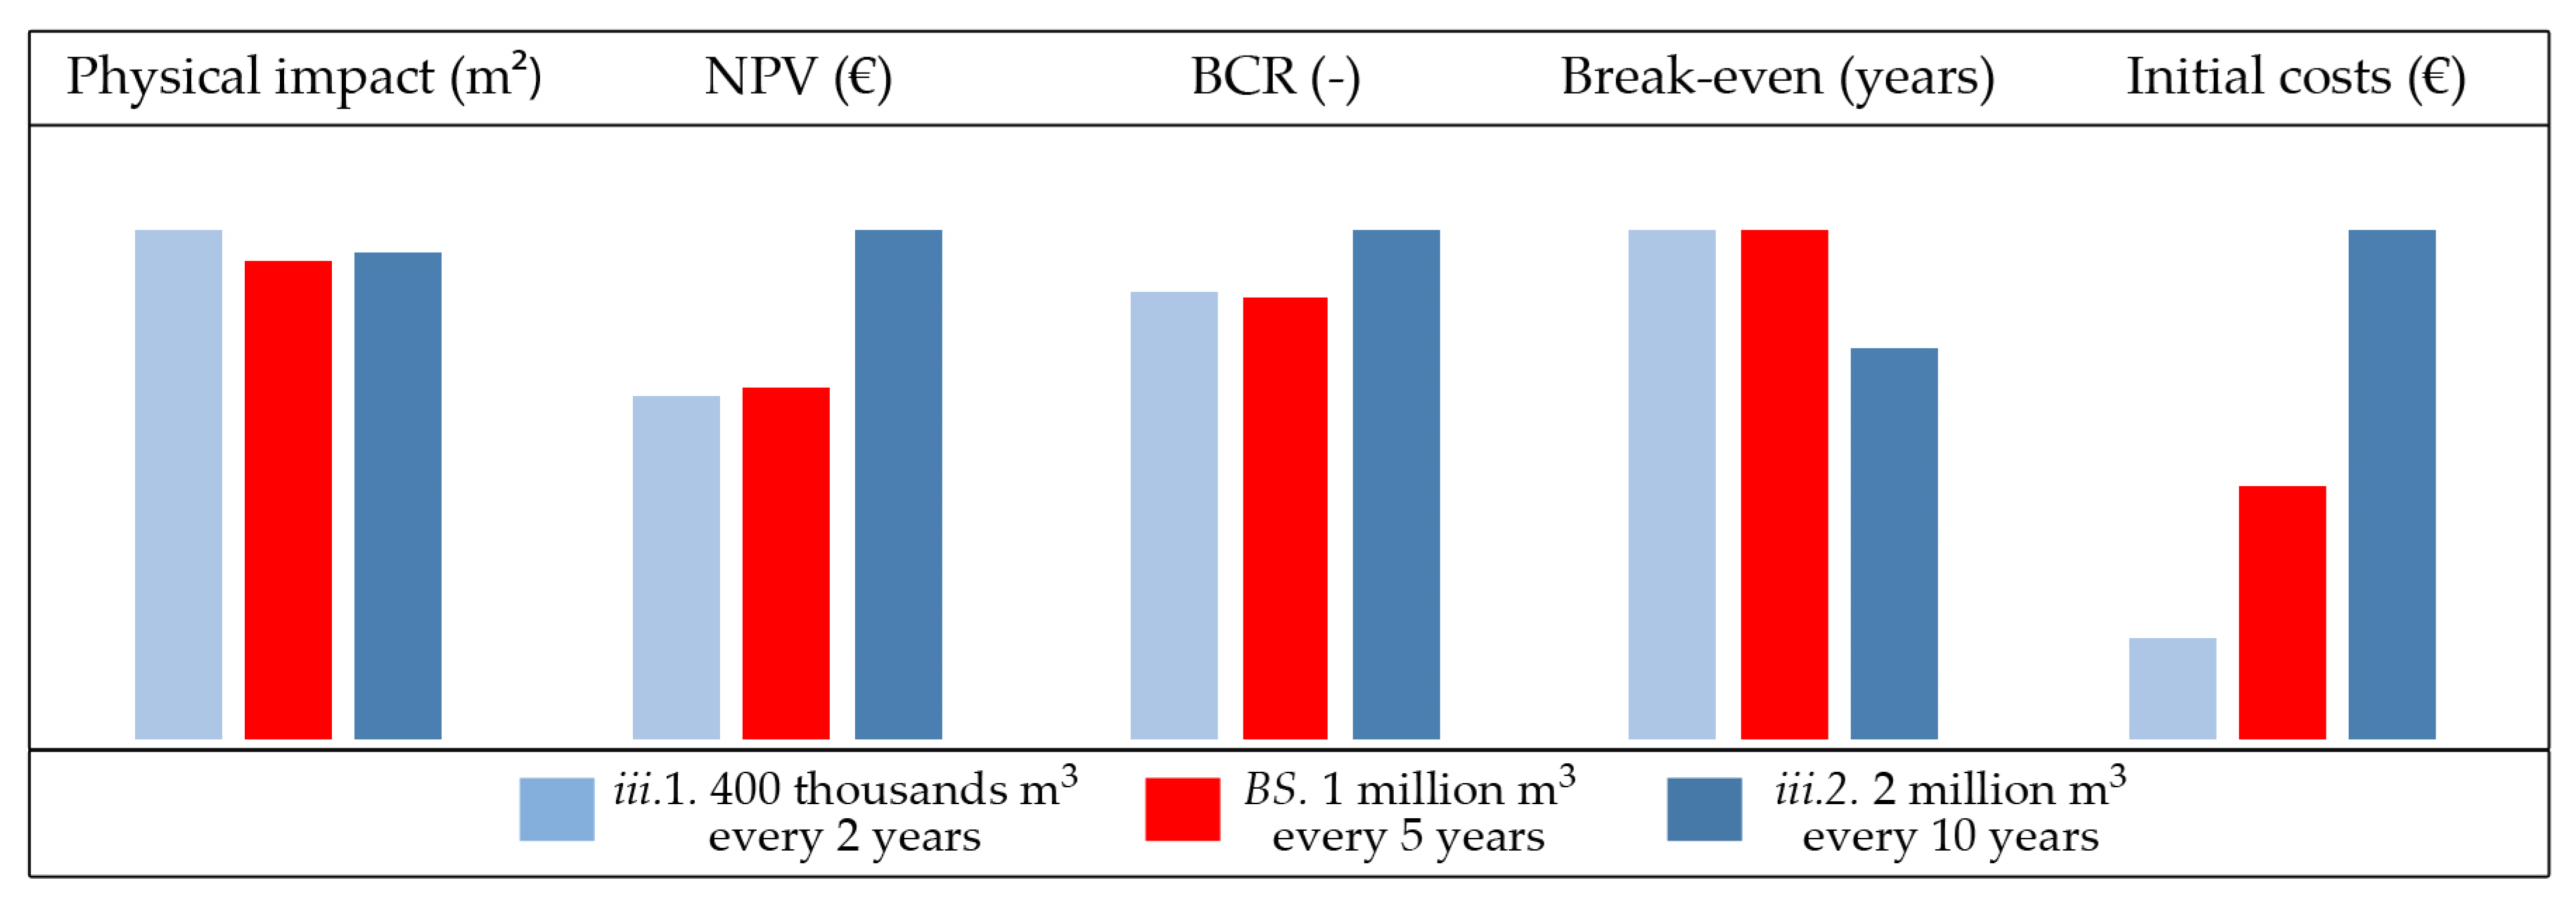
Frequency
The costs and benefits of nourishments frequency were assessed by comparison of two alternative scenarios: (iii.1) 400 thousand m3 of sediments deposited every 2 years; and (iii.2) 2 million m3 of sediments every 10 years. Despite the different volumes considered in each intervention, the cost per m3 was considered always the same.
The scenario with the best physical impact is not the same as the one with the best economic performance (
Table 4 and
Figure 9). Artificial nourishments performed in shorter time intervals (Scenario
iii.1) presents smaller land losses over the 20 years, but the economic benefit is higher if only two interventions of 2 × 10
6 m
3 of sediments each are performed (Scenario
iii.2). Although in Scenario
iii.2 the break-even point is lower and the NPV is higher (after 20 years), this scenario requires a higher initial investment (4 million euros, while in Scenario
iii.1, only 800 thousand euros are needed), which may be a constraint, as the initial financial availability is often a constraining factor in the choice of the coastal intervention.
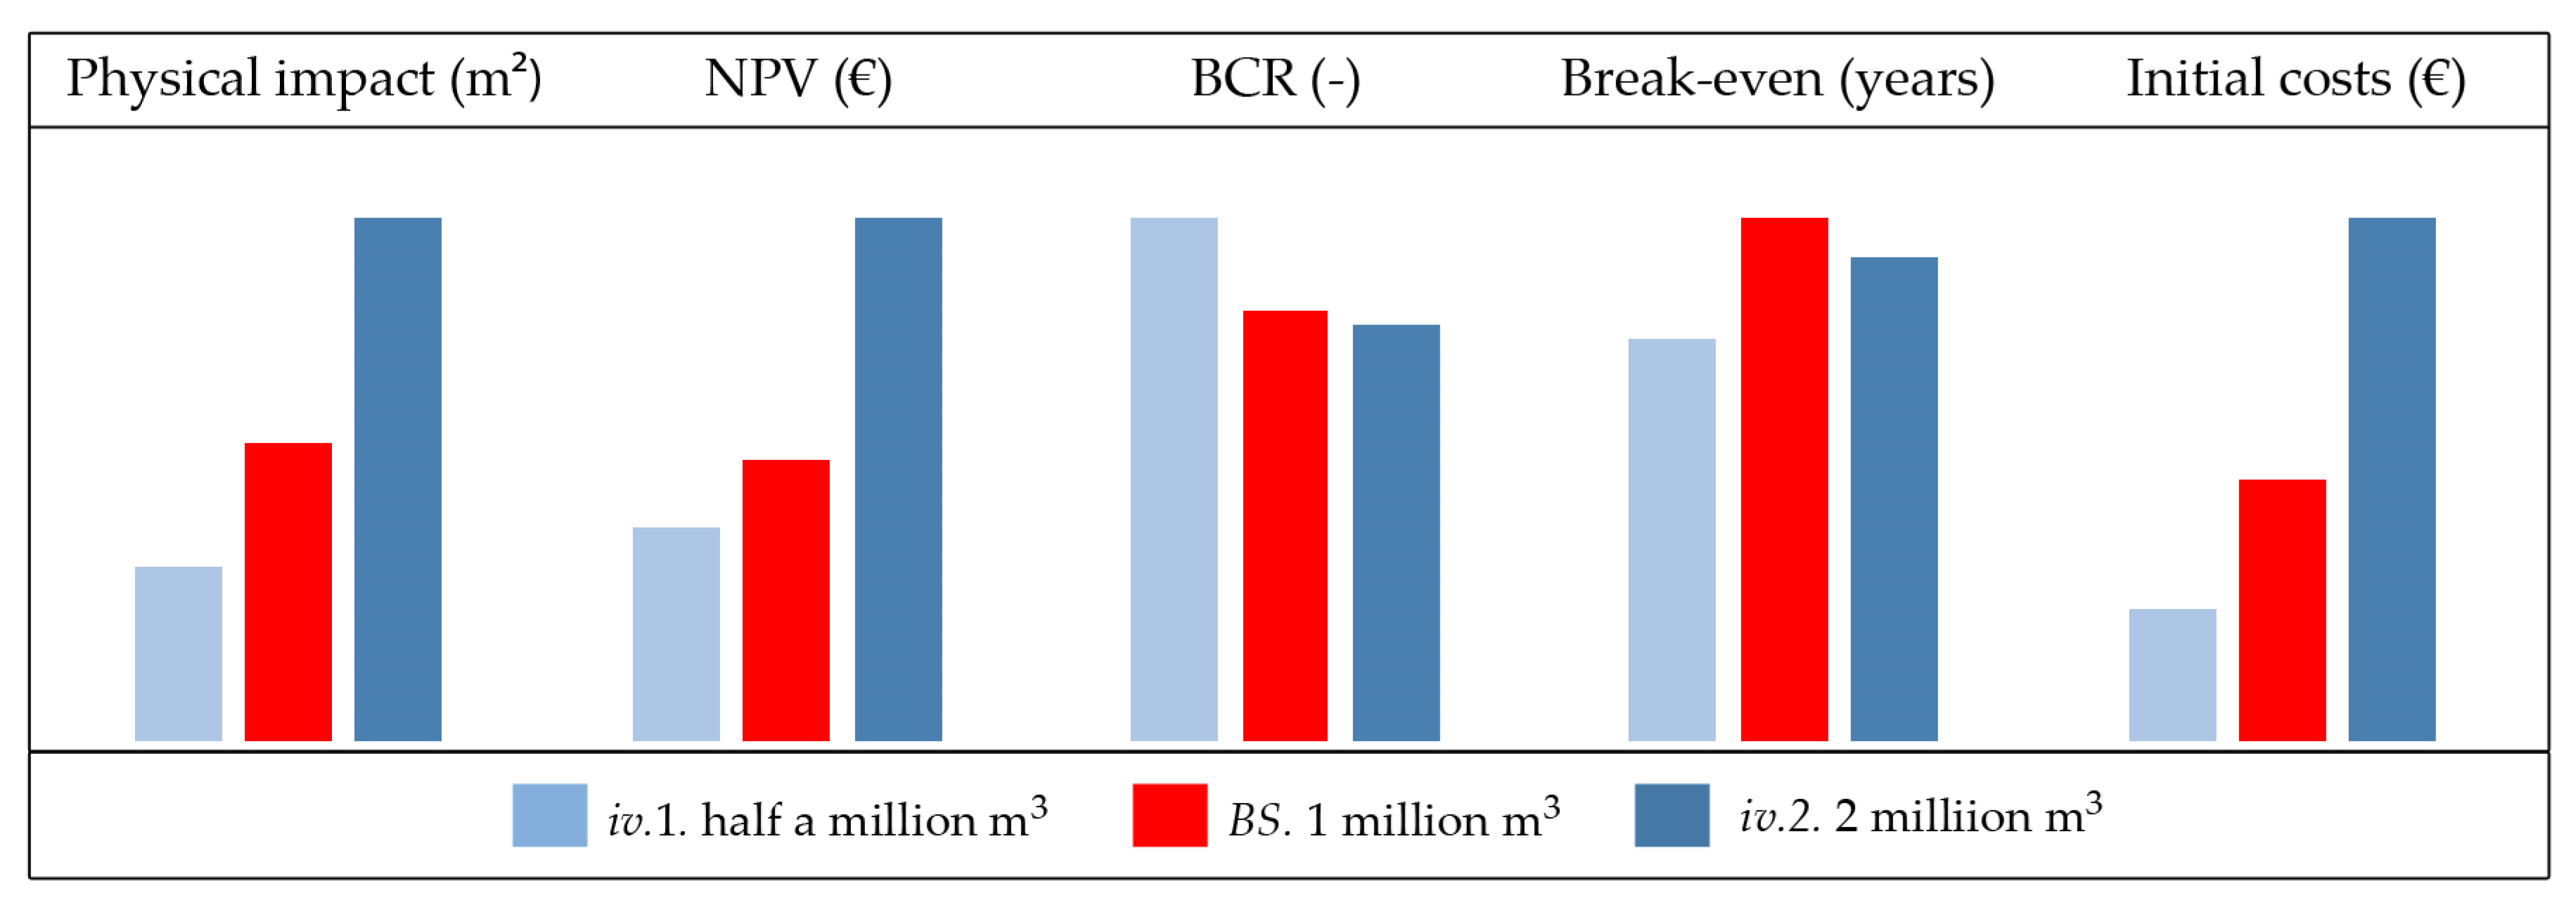
Volume
Regarding the total volume of sediments deposited, two additional artificial nourishment scenarios were analyzed: (
iv.1) 500 thousand m
3 of sediments every 5 years and (
iv.2) 2 million m
3, again, every five years. Naturally, in physical terms, Scenario
iv.2 is more attractive, decreasing the territory loss by approximately 40 ha, in comparison with the reference scenario. After 20 years, this scenario leads to a global accretion when compared with the initial instant (Year 0). Despite the physical benefits of higher nourishment volumes, the BCR shows that Scenario
iv.1 presents a better economic performance (
Table 4 and
Figure 10). Thus, it is highlighted that although Scenario
iv.2 represents a higher initial and total investment cost, it also presents important shoreline evolution benefits.
4.2. Generic Study Area
4.2.1. Reference Scenario
Shoreline projection results show that if no actions are taken to mitigate coastal erosion, the Barra-Vagueira shoreline will continue to retreat (
Figure 11). Considering a time horizon of 20 years, the annual mean shoreline retreat approaches 1.45 m/year, representing a loss of territory of approximately 35 ha. Considering the land uses, this erosion effects represent a loss of approximately 37 million € (
Table 5).
4.2.2. Artificial Nourishments
The nourishments allow for the mitigation of the negative erosion effects expected in the reference scenario, decreasing the shoreline retreat rate. However, the economic viability of the nourishments was achieved for only one of the tested scenarios.
Table 6 summarizes the physical impact by presenting the percentage of territory not lost at the end of 20 years, the economic performance through the benefit–cost ratio (BCR), and net present value (NPV).
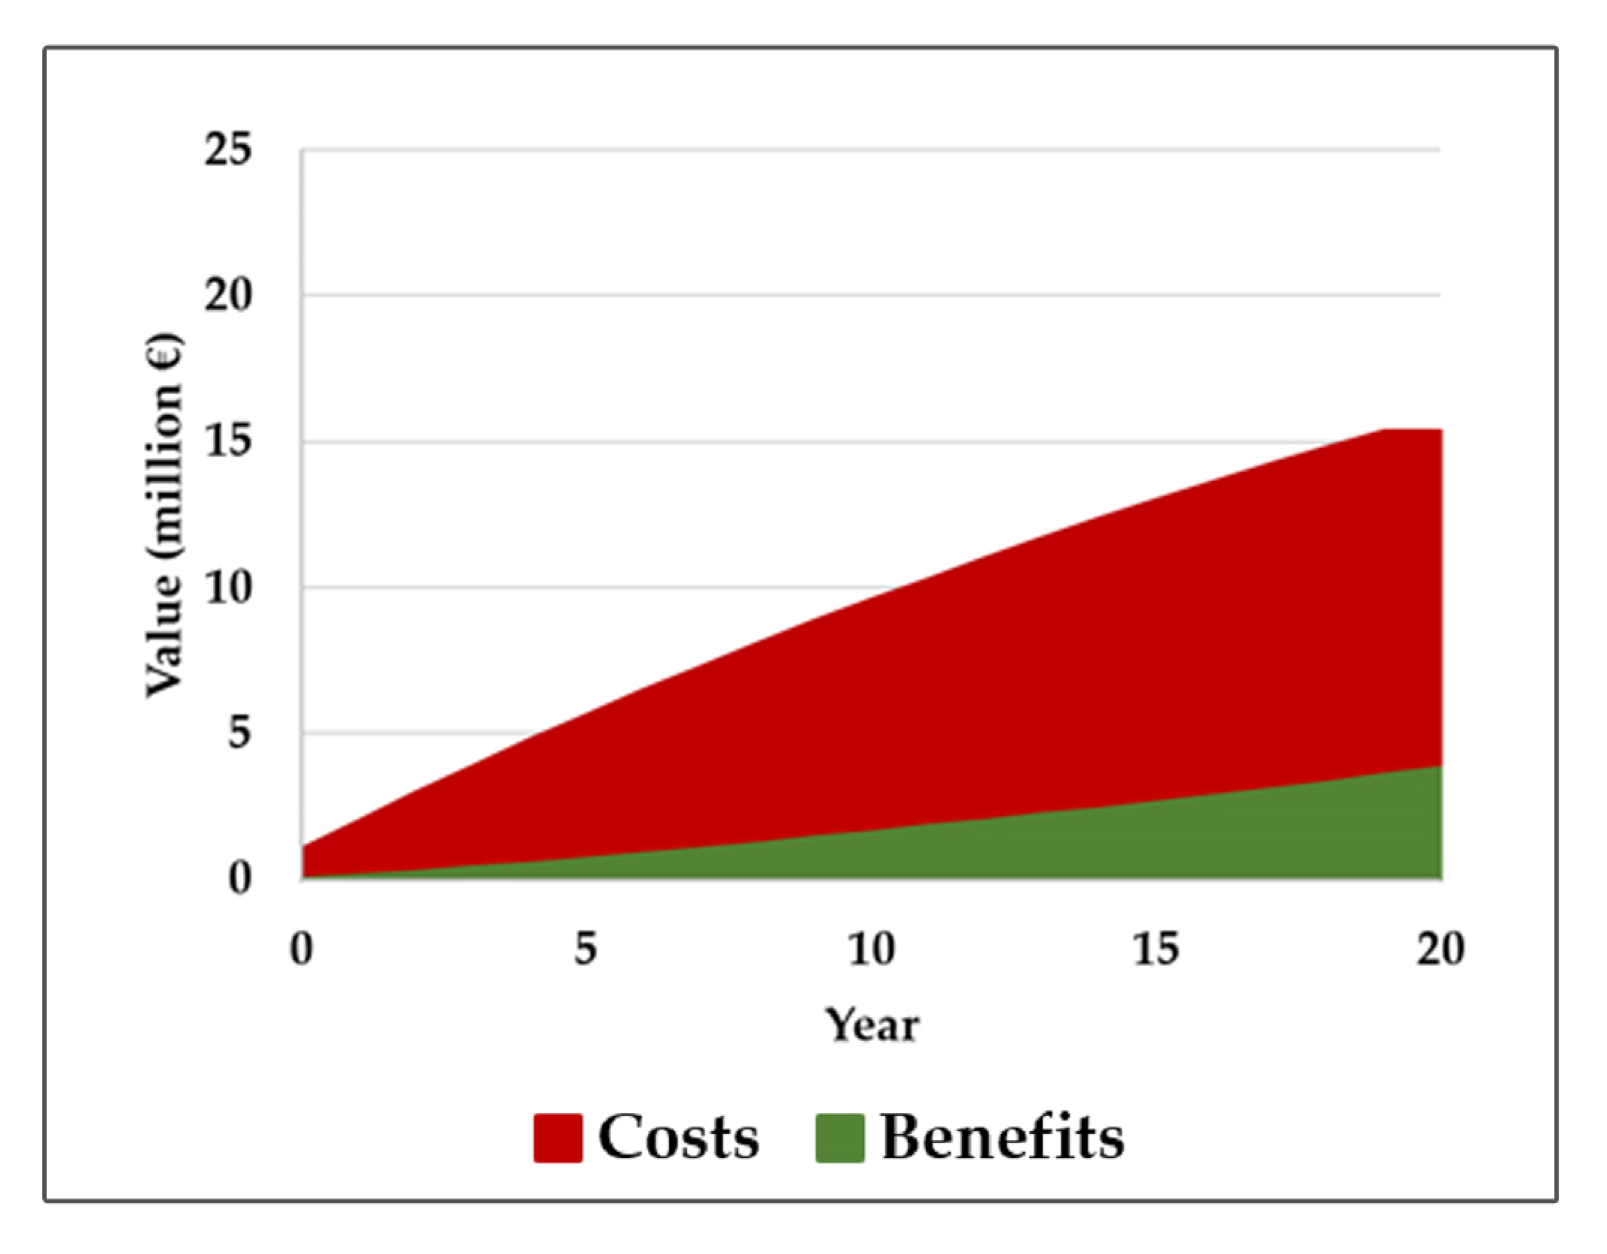
Regarding the nourishment baseline scenario, it is observed that 5 × 10
5 m
3/year of sediment decreases the loss of territory by approximately 15%, but the economic viability of the intervention is not achieved during the 20 years evaluated. The total estimated costs are 15.32 million euros, and the benefits approach 3.79 million euro (
Figure 12).
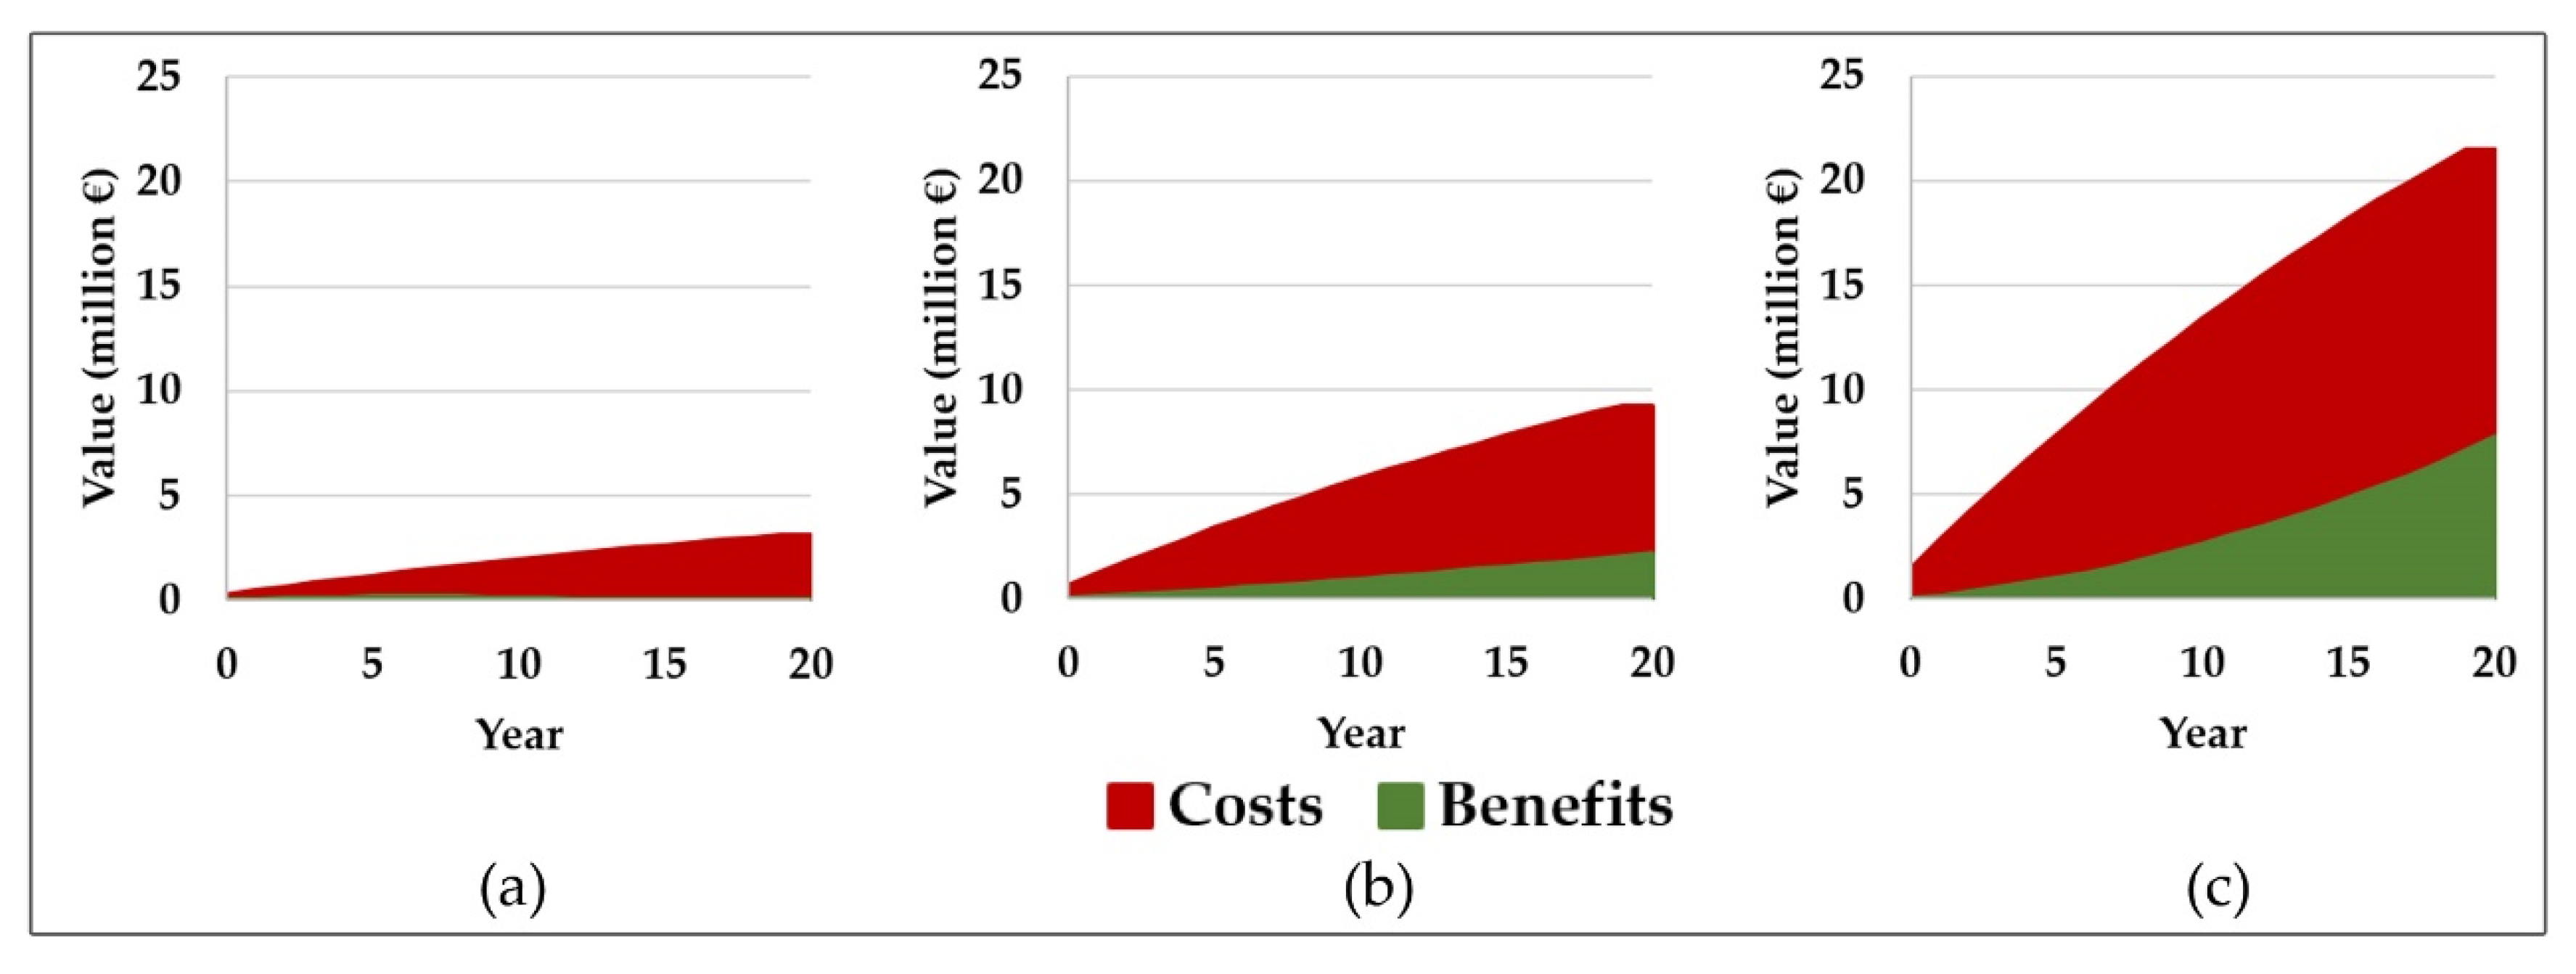
Results of nourishment volume scenarios suggest that both physical and economic performance increases with the deposited volume (
Figure 13). The annual deposition of 1 × 10
5 of sediment presents the lower total costs (3.06 million euros), but the area not lost is also lower, leading to a benefit–cost ratio of approximately 0.03. The deposition of 7 × 10
5 m
3/year of sediment is the scenario that presents the higher total cost (21.45 million euros) but is also the scenario that presents the higher total benefits (7.72 million euros), with a benefit–cost ratio of 0.36.
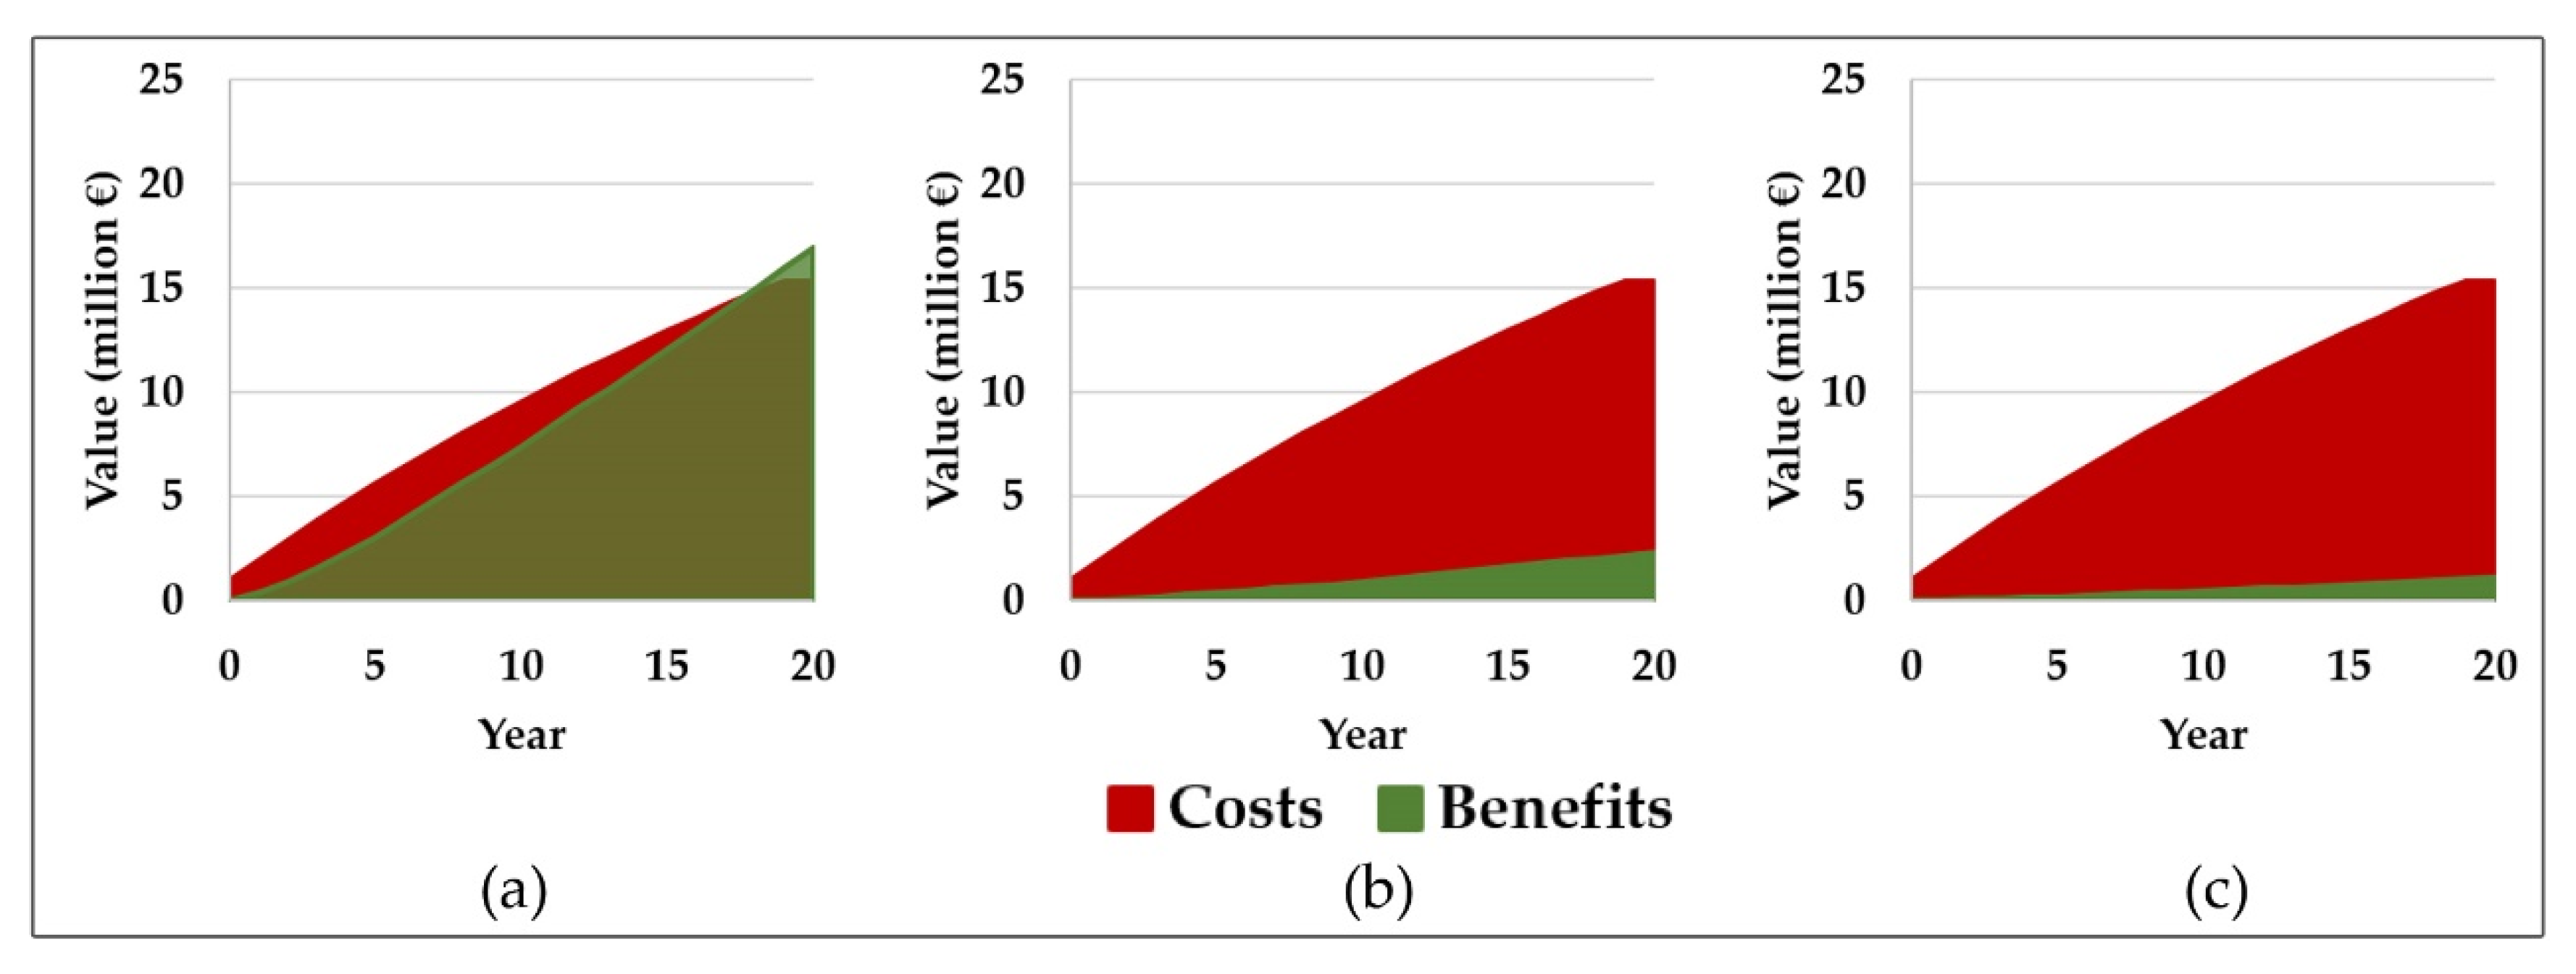
Considering the results that assessed the impact of the deposition site (
Figure 14), it is observed that the northern area deposition (NBS) is the one with the best economic performance, with the costs outweighing by the benefits (BCR = 1.1, with the break-even reached after 17 years). Note that, despite different distances to the deposition site, the unitary cost of dredging/deposition intervention was considered the same in all the scenarios.
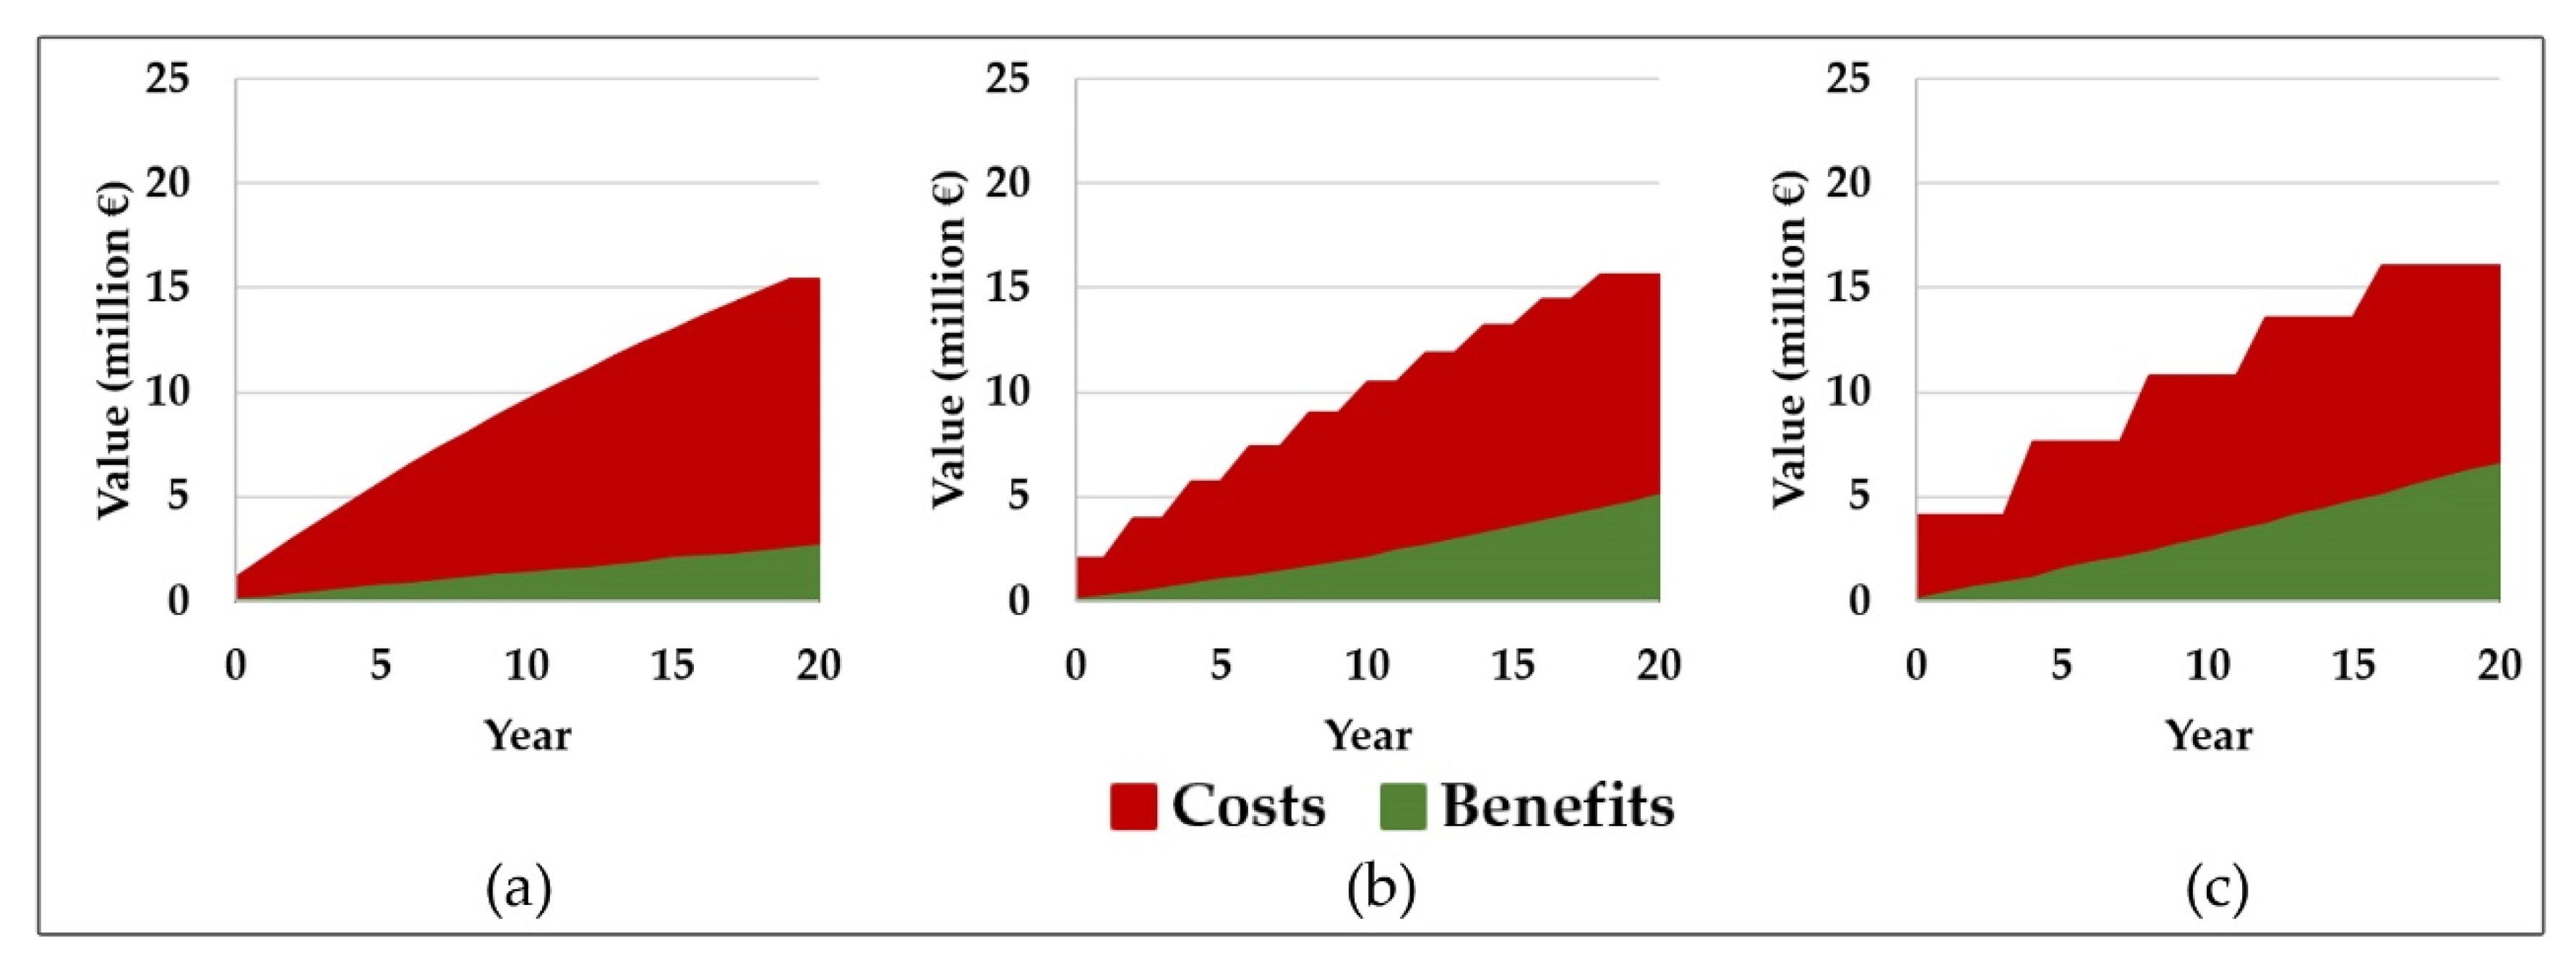
The best economic performance is not necessarily connected with the intervention that produces a greater impact on the reduction of the area lost on the coastal stretch. Although the deposition of sediments in the scenario Ext.S is the intervention that led to a greater reduction on the area not lost (26.75%), this scenario is the one which presents the worst economic performance. These results are due to the accumulative evolution of the benefits based on the relationship between the location of the area not lost and its land value. The total costs for these scenarios are the same (15.32 million euros). Sediment deposition in scenario NBS leads to a better performance, where the higher value of territory was estimated (Sectors 2–4), which significantly increases the benefits, outweighing the total costs. For the same reason, when comparing the deposition in SBS and in BS, it is observed that scenario SBS produces a higher reduction in the area lost, but the best economic performance is obtained for the deposition in BS. Finally, the results indicate that it is more efficient to carry out fewer artificial nourishment interventions, with larger volumes (
Figure 15). According to the results that evaluated the nourishment frequency, the deposition of 2 × 10
6 every 4 years is the one that presents the best physical and economic performance (BCR = 0.4).
On the basis of the comparison of costs and benefits of the interventions (
Figure 15), it is observed that the deposition of 2 × 10
6 each 4 years represents an approximately 5 thousand euros higher cost than the remaining frequency scenarios that were tested. However, the benefits are approximately 2.5 times higher than those obtained for the scenarios that considered the deposition of lower volumes (2.5 × 10
5 every half year and 5 × 10
5/year).
4.3. Final Remarks
The presented study discusses physical and economic performance of artificial nourishments based on the results at two study areas, showing that the proposed approach is applicable to both conceptual research and applied projects. Comparing both studied areas, the higher the volume, the better the BCR for Barra-Vagueira, but the contrary is observed in the hypothetical study. Location of the deposition of the nourishment at northern areas (updrift) is better in both studies, considering the adopted assumptions. The lower the frequency of the interventions, the better the RBC. In fact, these results show that the main goal of the nourishment needs to be very well defined and is site-specific, because a better scenario in one aspect may be worse in another one. However, the main results show that erosion effects represent important economic losses and artificial nourishments allow for the mitigation of shoreline retreat rates, decreasing the land losses. The physical performance and consequent economic evaluation of the nourishments depends on the design parameters and the valuation of the land uses and ecosystem services.
In the generic study area, moving the deposition site and extending its area to the north represents physical and economic advantages. Frequent nourishment interventions with lower volumes will induce larger accretion areas over time, but higher economic gains correspond to a larger volume and lower nourishment frequencies. A higher total volume of nourished sediment in the coastal system provides larger accretion areas over the entire 20-year time period that was analyzed and simultaneously results in a higher net present value. At the Barra-Vagueira coastal stretch, the economic viability of the intervention was achieved for only one of the tested scenarios. Thus, the economic feasibility of the interventions is not necessarily connected with the greater physical impact of the nourishment, but it is also strongly dependent on the monetary value attributed to the territory.
5. Discussion
To mitigate the shoreline retreat rate’s negative effects, the responsible authorities try to identify which is the most effective measure, with lower costs. For that, it is necessary to develop studies regrading coastal erosion mitigation that compromises two dimensions, namely physical effectiveness and economic performance. In the last decades, economical tools, such cost-effectiveness, cost–benefit, and efficiency analyses, have been applied in the scope of coastal management and planning [
43]. These tools provide a more comprehensive and sustainable coastal management. The main outcome is the possibility of comparing solutions considering physical and economical effectiveness, allowing a better management of resources, and the possibility of supporting the planning process. Cost-effectiveness studies provide insight into which interventions achieve coastal protection objectives at the lowest cost [
44,
45]. Cost–benefit studies provide insight into which interventions provide the largest net benefits [
12,
46,
47,
48,
49,
50,
51,
52,
53,
54]. In short, it can be considered that nourishment design should rely on cost–benefit analyses [
55]. Thus, the main relevance of the proposed methodology to design the best nourishment intervention is to follow a well-defined and sequential approach, considering numerical modelling and costs and benefits assessment. All the stages of the proposed methodology may result in discussion due to the inherent uncertainties of each process and required adopted assumptions.
In this study, a simple one-line shoreline evolution model was applied to characterize the territory areas lost, maintained, or gained. According to [
56,
57], simplified models allow for the predication of coastal zone evolution in medium- to long-term scales, avoiding the time demands due to both field data collection and computational time, as well as the time and scale limitations of the three-dimensional models. However, as concluded by Coelho et al. [
58], there are still gaps in the long-term numerical modelling of artificial nourishments, and it is important to increase modelling capabilities, by coupling cross- and longshore processes, aiding the selection of optimal artificial nourishment schemes and the establishment of more efficient coastal management policies. Larson et al. [
59] have highlighted the need for long-term morphological modelling that considered short-term effects, since long-term changes may be influenced by short-term responses. In addition, the long-term impacts of nourishment interventions in the shoreline evolution needs further research. Ferreira and Coelho [
22] report that the changes on the local bathymetry due to the nourishments have consequences in the sediment transport patterns and, therefore, in the shoreline evolution.
The benefits of artificial nourishments are considered as the capacity to slow down the shoreline retreat, allowing the territory to maintain its functions and its monetary value over time. However, further research must also be developed to improve the land use and ecosystems valuation, as this monetary value must represent all the economic, social, and cultural aspects related to the activities developed in the coastal zones and surrounding communities. According to Lima et al. [
60], nourishment interventions may represent ecosystem preservation and maintenance of natural landscapes, may increase the beach demand that leads to economic gains, may promote new economic and tourist activities, allow for decreased costs related to eventual overtopping events, and also reduce the maintenance costs of existing coastal structures. In fact, Noordegraaf [
61] developed a study case in a beach under erosion and reports the intention of people to make more visits when the beach increases; additionally, on the basis of numerical studies, Passeri et al. [
62] suggest that during stronger storms, nourishments reduce dune overtopping.
Additionally, since coastal territories provide multiple functions, the different stakeholders have different interests. The proposed methodology allows a comparison of options, enabling one to assess costs and benefits evolution, considering direct costs and benefits for different groups. Furthermore, since the methodology considers the timing of each of the costs and benefits associated with particular options and converts future costs and benefits into today’s prices, all impacts can be meaningfully compared, regardless of timing.
Finally, as previously indicated, the territory value is extremely dependent on the land uses, and, thus, an adequate sensitivity analysis should be performed to well characterize the land use value. An important part of the studies regarding land use and economic value of the territories is focused on estimating the demand curve, thus trying to identify changes in the consumers behavior due to a specific intervention. According to Parson et al. [
63], artificial nourishment effects in the beach width have consequences on the consumption of the users. On the basis of a study conducted at Delaware beaches (USA) to estimate the value of beach width and artificial nourishments for recreational purposes by its users, the authors concluded that reducing of the beach width to a quarter of the current width would lead to a loss of approximately USD 5.00 per day at the beach, per visitor. Widening to twice the current beach width would lead to an increase per day and per visitor at the beach of USD 2.75. Landry et al. [
64] performed a study in North Carolina to estimate the demand curve and the ‘willingness to pay’ by users and non-users, for coastal management measures. On the basis of the results, it was estimated that the marginal value of incremental beach width for users and non-users ranges from USD 0.23 to USD 0.48 per meter. Thus, the proposed approach makes it easier to assess the benefit evolution of artificial nourishments as a function of the territory value that, as demonstrated by the two study cases discussed previously, can be extremely dependent on the user’s evaluation and may be dependent on local aspects.
6. Conclusions
This work aimed to present a well-defined and sequential approach to evaluate the costs and benefits of different artificial nourishment scenarios. A hypothetical study area and a real domain (Barra-Vagueira) were considered, and the nourishment scenarios were defined to discuss the impact of the design parameters that conditioned the costs and benefits of the interventions.
Cost–benefit analysis gives important insights for better design of nourishment interventions. In this evaluation, benefits are related to the shoreline evolution and are dependent on the numerical assumptions defined to develop the study. They are also functions of the valuation of the coastal territory that must include social, environmental, and cultural aspects, which are difficult to estimate. The costs estimation requires the prediction of the evolution of all costs of the project during its life cycle, which should consider the dredging operations, the transport (highly dependent of the oil prices), and the deposition processes along the time.
Overall, the findings show that in coastal areas susceptible to erosion (where the sediments volume available for the littoral drift are below the potential sediment transport capacity), important economic losses will occur if no decisions are adopted. Artificial nourishments allow for the mitigation of erosion problems, but the physical and economic performance of the intervention is site-specific and dependent upon design parameters. The results highlight the importance of a good definition of the objectives to be reached when an artificial nourishment is proposed, as the scenarios that present higher positive physical impacts are not necessarily the same as those that present the best economic performance.
The application of the presented results to other coastal areas is naturally limited by the specific conditions of each site (land use values, wave climate conditions, existing coastal intervention characteristics, nourishment scenarios, etc.) However, the easy approach defined by the methodology allows for a quick sensitivity analysis to those conditions, permitting its general worldwide application. Thus, it is considered that the proposed methodology and the COAST software represents one step toward a well-supported decision-making process, aiding in coastal management and planning.
Author Contributions
Conceptualization, C.C., M.L. and M.F.; methodology, C.C. and M.L.; software, C.C. and M.L.; validation, M.L. and M.F.; formal analysis, M.L. and M.F.; investigation, M.L. and M.F.; resources, C.C.; data curation, C.C., M.L. and M.F.; writing—original draft preparation, M.L. and M.F.; writing—review and editing, C.C., M.L. and M.F.; visualization, M.L. and M.F.; supervision, C.C.; project administration, C.C.; funding acquisition, C.C. All authors have read and agreed to the published version of the manuscript.
Funding
This research received no external funding.
Institutional Review Board Statement
Not applicable.
Informed Consent Statement
Not applicable.
Data Availability Statement
Not applicable.
Acknowledgments
This work was financially supported by the project “Integrated Coastal Climate Change Adaptation for Resilient Communities”, INCCA—POCI-01-0145-FEDER-030842, funded by FEDER, through “Programa Operacional Competividade e Internacionalização” in its ERDF component and by national funds (OE), through FCT/MCTES. Ferreira, M. is supported by the doctoral Grant 2021.07269.BD financed by the Portuguese Foundation for Science and Technology (FCT).
Conflicts of Interest
The authors declare no conflict of interest.
References
- Luijendijk, A.; Hagenaars, G.; Ranasinghe, R.; Baart, F.; Donchyts, G.; Aarninkhof, S. The state of the world’s beaches. Sci. Rep. 2018, 6641, 11. [Google Scholar] [CrossRef] [PubMed]
- NRC. National Research Council: Beach Nourishment and Protection; The National Academic Press: Washington, DC, USA, 1995; p. 334. [Google Scholar]
- ASBPA. Shore Protection Assessment: How Beach Nourishment Projects Work; Shore Protection Assessment; US Army Corps of Engineers: Vicksburg, MA, USA, 2007; p. 9. [Google Scholar]
- De Schipper, M.; de Vries, S.; Ruessink, G.; de Zeeuw, R.; Rutten, J.; van Gelder-Maas, C.; Stive, M. Initial Spreading of a Mega Feeder Nourishment: Observations of the Sand Engine Pilot Project. Coast. Eng. 2016, 111, 23–38. [Google Scholar] [CrossRef] [Green Version]
- Coelho, C. Riscos de Exposição de Frentes Urbanas para Diferentes Intervenções de Defesa Costeira. PhD Thesis, University of Aveiro, Aveiro, Portugal, 2005; p. 404. (In Portuguese). [Google Scholar]
- ANCORIM. Overview of Soft Coastal Protection Solutions; BRGM/ONF: Bordeaux, France, 2017; p. 54. [Google Scholar]
- Lima, M. Ferramenta Numérica de Análise do Impacto de Intervenções de Defesa Costeira na Evolução da Linha de Costa: Custos e Benefícios. Ph.D. Thesis, University of Aveiro, Aveiro, Portugal, 2018; p. 336. (In Portuguese). [Google Scholar]
- Coelho, C.; Narra, P.; Marinho, B.; Lima, M. Coastal management software to support the decision-makers to mitigate coastal erosion. J. Mar. Sci. Eng. 2018, 8, 37. [Google Scholar] [CrossRef] [Green Version]
- Adapt. European Climate Adaptation Platform Climate. European Commision and European Environment Agency. Available online: https://climate-adapt.eea.europa.eu (accessed on 10 January 2022).
- Hamm, L.; Capobianco, M.; Dette, H.; Lechuga, A.; Spanhoff, R.; Stive, M. A summary of European experience with shore nourishment. Coast. Eng. 2002, 47, 237–264. [Google Scholar] [CrossRef]
- Zandmotor Monitoring. Rijkswaterstaat Ministerie van Infrastructuur en Waterstaat. Available online: https://dezandmotor.nl/ (accessed on 23 January 2022).
- Roebeling, P.; Coelho, C.; Reis, E. Coastal erosion and coastal defense interventions: A cost-benefit analysis. J. Coast. Res. 2011, Special Issue 64, 1415–1419. [Google Scholar]
- Zerbe, R.; Dively, D. Benefit-Cost Analysis in Theory and Practice; Harper Collins College Publishers: New York, NY, USA, 1994; p. 557. [Google Scholar]
- Lima, M.; Coelho, C.; Veloso-Gomes, F.; Roebeling, P. An integrated Physical and Cost Benefit Approach to Assess Groins as a Coastal Erosion Mitigation Strategy. Coast. Eng. 2020, 156, 103614. [Google Scholar] [CrossRef]
- Lima, M.; Coelho, C.; Cachim, P. Programing methods for pre-design of coastal structures. In Proceedings of the V International Conference on Computational Methods in Marine Engineering, Hamburg, Germany, 29–31 May 2013; pp. 868–879. [Google Scholar]
- Penning-Rowsell, E.; Green, C.; Thompson, P.; Coker, A.; Tunstall, S.; Richards, C.; Parker, D. The Economics of Coastal Management: A Manual of Benefit Assessment Techniques, 1st ed.; Belhaven Press: London, UK; Boca Raton, FL, USA, 1992; ISBN 1-85293-161-2. [Google Scholar]
- Coelho, C.; Taveira Pinto, F.; Veloso Gomes, F.; Pais-Barbosa, J. Coastal Evolution and Coastal Works in the Southern Part of Aveiro Lagoon Inlet, Portugal. In Proceedings of the 29th International Conference on Coastal Enginnering, Lisbon, Portugal, 19–24 September 2004. [Google Scholar]
- Coelho, C.; Veloso-Gomes, F.; Silva, R. Shoreline coastal evolution model: Two Portuguese case. Coast. Eng. 2007, Volume 5, 3430–3441. [Google Scholar]
- Coelho, C.; Lima, M.; Veloso-Gomes, F. Relationship between cross-shore active profile and one-line shoreline evolution models performance. J. Coast. Res. 2013, 2, 2107–2112. [Google Scholar] [CrossRef]
- Guimarães, A.; Lima, M.; Coelho, C.; Silva, R.; Veloso-Gomes, F. Groin impacts on updrift morphology: Physical and numerical study. Coast. Eng. 2016, 109, 63–75. [Google Scholar] [CrossRef]
- Lima, M.; Coelho, C. LTC shoreline evolution model: Assumptions, evolution, validation and application. J. Integr. Coast. Zone Manag. 2017, 17, 5–17. [Google Scholar]
- Ferreira, M.; Coelho, C. Artificial nourishments effects on longshore sediments transport. J. Mar. Sci. Eng. 2021, 9, 240. [Google Scholar] [CrossRef]
- French, P. Coastal Defences: Processes, Problems and Solutions; Routledge: London, UK, 2001; 306p, ISBN 0-415-19845-3. [Google Scholar]
- Dean, R. Beach Nourishment Theory and Practise; Advanced Series on Ocean Engineering 18; World Scientific: Singapore, Singapore, 2002; p. 403. [Google Scholar]
- Haney, R.; Kouloheras, L.; Malkoski, V.; Mahala, J.; Unger, Y. Beach Nourishment MassDEP’s Guide to Best Management Practices for Projects in Massachusetts; Massachusetts Department of Environmental Protection and Massachusetts Office of Coastal Zone Management: Boston, MA, USA, 2007; p. 32. [Google Scholar]
- Carvalho, R.; Afonso, C.; Figueira, P.; Pound, M.; Coelho, C.; Silva, P.; Afonso, A. Estudo de Viabilidade de Transposição Aluvionar das Barras de Aveiro e da Figueira da Foz–Relatório Intercalar 3, Tarefa 6; University of Aveiro: Aveiro, Portugal, 2021; p. 31. (In Portuguese) [Google Scholar]
- Coelho, C.; Silva Afonso, A.; Bernardes, C.; Silva, P.A.; Baptista, P.; Roebeling, P.; Férnadez Fernández, S.; Abreu, T.; Oliveira, T.; Ferreira, M.; et al. Estudo de Viabilidade de Transposição Aluvionar das Barras de Aveiro e da Figueira da Foz–Sumário Executivo; University of Aveiro: Aveiro, Portugal, 2021; p. 26. (In Portuguese) [Google Scholar]
- Dean, R.G. Equilibrium beach profiles: Characteristics and applications. J. Coast. Res. 1991, 7, 53–84. [Google Scholar]
- CERC. Shore Protection Manual; U.S. Army Corps of Engineers. Coastal Engineering and Research Center. U.S. Government Printing Office: Washington DC, USA, 1984; Volume 1. [Google Scholar]
- Costanza, R.; d’Arge, R.; De Groot, R.; Farber, S.; Grasso, M.; Hannon, B.; Limburg, K.; Naeem, S.; Oneill, R.V.; Paruelo, J.; et al. The value of the world’s ecosystem services and natural capital. Nature 1997, 387, 253–260. [Google Scholar] [CrossRef]
- Costanza, R.; De Groot, R.; Sutton, P.; Van Der Ploeg, S.; Anderson, S.J.; Kubiszewski, I.; Farber, S.; Turner, R.K. Changes in the global value of ecosystem services. Glob. Environ. 2014, 26, 152–158. [Google Scholar] [CrossRef]
- Roebeling, P.; d’Elia, E.; Coelho, C.; Alves, T. Efficiency in the design of coastal erosion adaptation strategies: An environmental-economic modelling approach. Ocean. Coast. Manag. 2018, 160, 175–184. [Google Scholar] [CrossRef]
- Lima, M.; Coelho, C. Improvement of an existing shoreline evolution numerical model. In Proceedings of the VIII International Conference on Computational Methods in Marine Engineering, Goteborg, Sweden, 13–15 May 2019; pp. 502–513. [Google Scholar]
- Santos, F.; Lopes, A.; Moniz, G.; Ramos, L.; Taborda, R. Gestão da zona costeira: O desafio da mudança. Relatório Grupo Trab. Litoral 2014, 1, 237. (In Portuguese) [Google Scholar]
- Lira, C.; Silva, A.; Taborda, R.; de Andrade, C. Coastline evolution of Portuguese low-lying sandy coast in the last 50 years: An integrated approach. Earth Syst. Sci. Data Discuss. 2016, 8, 22. [Google Scholar]
- Pinto, C.; Silveira, T.; Teixeira, S. Alimentação artificial de praias na faixa costeira de Portugal continental: Enquadramento e retrospetiva das intervenções realizadas (1950–2017). Relatório Técnico. APA–Port. Environ. Agency 2018, 1, 66. (In Portuguese) [Google Scholar]
- Pinto, C.; Silveira, T.; Teixeira, S. Beach nourishment practice in mainland Portugal (1950-2017): Overview and retrospective. Ocean. Coast. Manag. 2020, 192, 105211. [Google Scholar] [CrossRef]
- COSMO. Coastal Monitoring Programme of Continental Portugal: COSMO. APA–Portuguese Environment Agency. Available online: https://cosmo.apambiente.pt/ (accessed on 20 January 2022).
- Ferreira, M.; Fernández-Fernández, S.; Coelho, C.; Silva, P.A. Caracterização de tempestades e da deriva litoral no litoral de Aveiro, em cenários de alterações climáticas. In Proceedings of the XV Congresso Da Água, Lisbon, Portugal, 22–26 March 2021; pp. 1–4. (In Portuguese). [Google Scholar]
- Ferreira, M.; Coelho, C.; Lima, M.; Bernardes, C.; Baptista, P.; Silva, P.A.; Carvalho, R.; Pound, M.; Pinto, C. Feasibility study of sand bypass at Aveiro and Figueira da Foz inlets. In Proceedings of the 37th International Conference on Coastal Engineering, Sydney, Australia, 4–9 December 2022; p. 3. [Google Scholar]
- Ferreira, M.; Lima, M.; Coelho, C.; Nolasco, A.; Cardoso, A.; Rocha, B.; Narra, P.; Silva, P.; Carvalho, R.; Pound, M.; et al. Análise custo-benefício de soluções de transposição de sedimentos. In Proceedings of the 10as Jornadas de Engenharia Costeira e Portuária, Sines, Portugal, 7–8 April 2022; p. 12. (In Portuguese). [Google Scholar]
- COS: Carta de Uso e Ocupação do Solo–2018. Direção-Geral do Território. Available online: http://mapas.dgterritorio.pt/DGT-ATOM-download/COS_Final/COS2018_v1/COS2018_v1.zip (accessed on 5 February 2021).
- Breil, M.; Catenacci, M.; Travisi1, C. Impatti del Cambiamento Cimatico Sulle Zone Costiere: Quantificazione Economica di Ompatti e di Misure di Sdattamento–Sintesi di Risultati e Indicazioni Metodologiche per la Ricerca Futura. In In Proceedings of the APAT Workshop on “Cambiamenti Climatici e Ambiente Marino-Costiero: Scenari Futuri per un Programma Nazionale di Adattamento", Palermo, Italy, 27–28 June 2007 ; 27–28 June 2007. [Google Scholar]
- Taborda, R.; Magalhães, F.; Ângelo, C. Evaluation of Coastal Defence Strategies in Portugal. In Environmentally Friendly Coastal Protection; Springer: Dordrecht, Netherlands, 2005. [Google Scholar]
- Chu, M.L.; Guzman, J.A.; Muñoz-Carpena, R.; Kiker, G.A.; Linkov, I. A simplified approach for simulating changes in beach habitat due to the combined effects of long-term sea level rise, storm erosion, and nourishment. Environ. Model. Softw. 2014, 52, 111–120. [Google Scholar] [CrossRef]
- Alexandrakis, G.; Manasakis, C.; Kampanis, N.A. Valuating the effects of beach erosion to tourism revenue. A management perspective. Ocean. Coast. Manag. 2015, 111, 1–11. [Google Scholar] [CrossRef]
- Bosello, F.; Roson, R.; Tol, R. Economy-wide Estimates of the Implications of Climate Change: Sea Level Rise. Environ. Resour. Econ. 2007, 37, 549–571. [Google Scholar] [CrossRef] [Green Version]
- Costa, L.; Tekken, V.; Kropp, J. Threat of sea level rise: Costs and benefits of adaptation in European union coastal countries. J. Coast. Res. 2009, SI 56, 223–227. [Google Scholar]
- Darwin, R.F.; Tol, R. Estimates of the Economic Effects of Sea Level Rise. Environ. Resour. Econ. 2001, 19, 113–129. [Google Scholar] [CrossRef] [Green Version]
- Martínez, M.L.; Intralawan, A.; Vázquez, G.; Pérez-Maqueo, O.; Sutton, P.; Landgrave, R. The coasts of our world: Ecological, economic and social importance. Ecol. Econ. 2007, 63, 254–272. [Google Scholar] [CrossRef]
- Martino, S.; Amos, C.L. Valuation of the ecosystem services of beach nourishment in decision-making: The case study of Tarquinia Lido, Italy. Ocean. Coast. Manag. 2015, 111, 82–91. [Google Scholar] [CrossRef]
- Neumann, J.; Hudgens, D.; Herter, J.; Martinich, J. The economics of adaptation along developed coastlines. Wiley Interdiscip. Rev. Clim. Change 2011, 2, 89–98. [Google Scholar] [CrossRef]
- Turner, R.K.; Burgess, D.; Hadley, D.; Coombes, E.; Jackson, N. A cost–benefit appraisal of coastal managed realignment policy. Glob. Environ. Change 2007, 17, 397–407. [Google Scholar]
- Roebeling, P.C.; Rocha, J.; Alves, F.; Vizinho, A. Cost-Benefit Analysis of Coastal Erosion Adaptation Pathways along the Barra-Vagueira Coastal Stretch; Technical Report Prepared in the Context of the Project BASE (Bottom-Up Climate Adaptation Strategies for a Sustainable Europe); Department of Environment and Planning, University of Aveiro: Aveiro, Portugal, 2015. [Google Scholar]
- Nicholls, R.J.; Tol, R.S.J. (2006). Impacts and responses to sea-level rise: A global analysis of the SRES scenarios over the twenty-first century. Philos. Trans. R. Soc. A Math. Phys. Eng. Sci. 2006, 364, 1073–1095. [Google Scholar] [CrossRef]
- Larson, M. Numerical modelling. In Encyclopedia of Coastal Science; Schwartz, M.L., Ed.; Springer: Dordrecht, Netherlands, 2005; pp. 730–733. [Google Scholar]
- Burcharth, H.; Hawkins, S.; Zanuttigh, B.; Lamberti, A. Environmental Design Guidelines for Low Crested Coastal Structures: Design Tools Related to Engineering; Elsevier Science: Amsterdam, The Netherlands, 2007; pp. 203–333. ISBN 978-0-08-044951-7. [Google Scholar]
- Coelho, C.; Ferreira, M.; Marinho, B. Numerical modelling of artificial sediment nourishment impacts. J. Coast. Res. 2020, 95, 209–213. [Google Scholar] [CrossRef]
- Larson, M.; Palalane, J.; Fredriksson, C.; Hanson, H. Simulating cross shore material exchange at decadal scale. Theory and model component validation. Coast. Eng. 2016, 116, 57–66. [Google Scholar] [CrossRef]
- Lima, M.; Coelho, C.; Alves, F.; Marto, M. Base de Dados #2–Impactos de Medidas de Mitigação e Adaptação à Erosão Costeira e às Alterações Climáticas; Technical Report Prepared in the Scope of the Research Project INCCA–INtegrated Coastal Climate Change Adaptation for Resilient Communities (POCI-01-0145-FEDER-030842); University of Aveiro: Aveiro, Portugal , 2021; 174p, (In Portuguese). Available online: http://incca.web.ua.pt/index.php/base-de-dados-2/ (accessed on 31 October 2022).
- Noordegraaf, I. Economic Valuation of Increased Beach Width at Praia da Vagueira (Central Portugal). Master’s Thesis, University of Aveiro, Aveiro, Portugal, 2020; p. 80. [Google Scholar]
- Passeri, D.; Bilskie, M.; Hagen, S.; Mickey, R.; Dalyander, P.; Gonzales, V. Assessing the effectiveness of nourishments in decadal barrier island morphological resilience. Water 2021, 13, 944. [Google Scholar] [CrossRef]
- Parson, G.; Chen, Z.; Hidrue, M.; Standing, N.; Lilley, J. Valuing beach width for recreational use: Combining revealed and stated preference data. Mar. Resour. Econ. 2013, 28, 221–241. [Google Scholar] [CrossRef]
- Landry, C.; Shonkwiler, J.; Whitehead, J. Economic values of coastal erosion management: Joint estimation of use and existence values with recreation demand and contingent valuation data. J. Environ. Econ. Manag. 2020, 103, 102364. [Google Scholar] [CrossRef]
Figure 1.
LTC numerical model representation of the study area obtained with COAST software interface, developed by Lima, in 2018 [
33].
Figure 1.
LTC numerical model representation of the study area obtained with COAST software interface, developed by Lima, in 2018 [
33].
Figure 2.
Schematization of the study area: land uses and artificial nourishment baseline scenario.
Figure 2.
Schematization of the study area: land uses and artificial nourishment baseline scenario.
Figure 3.
Coastal stretch Barra-Vagueira (the rectangles represent the nourishment location scenarios: BS—baseline; NBS—North of BS; SBS—South of BS; and Ext.S—Extreme South).
Figure 3.
Coastal stretch Barra-Vagueira (the rectangles represent the nourishment location scenarios: BS—baseline; NBS—North of BS; SBS—South of BS; and Ext.S—Extreme South).
Figure 4.
Monetary value of the coastal sectors [
27,
40,
41] with overlay of the land use map on the study area [
42].
Figure 4.
Monetary value of the coastal sectors [
27,
40,
41] with overlay of the land use map on the study area [
42].
Figure 5.
Shoreline position in the reference scenario, along the time (cross-shore scale equal to 10 times the longitudinal scale).
Figure 5.
Shoreline position in the reference scenario, along the time (cross-shore scale equal to 10 times the longitudinal scale).
Figure 6.
Shoreline position in the artificial nourishment baseline scenario along time (cross-shore scale equal to 10 times the longitudinal scale).
Figure 6.
Shoreline position in the artificial nourishment baseline scenario along time (cross-shore scale equal to 10 times the longitudinal scale).
Figure 7.
Normalized representation of physical and economic impacts of the artificial nourishment extension scenarios.
Figure 7.
Normalized representation of physical and economic impacts of the artificial nourishment extension scenarios.
Figure 8.
Normalized representation of physical and economic impacts of the artificial nourishment location scenarios.
Figure 8.
Normalized representation of physical and economic impacts of the artificial nourishment location scenarios.
Figure 9.
Normalized representation of physical and economic impacts of the artificial nourishment frequency scenarios.
Figure 9.
Normalized representation of physical and economic impacts of the artificial nourishment frequency scenarios.
Figure 10.
Normalized representation of physical and economic impacts of the artificial nourishment volume scenarios.
Figure 10.
Normalized representation of physical and economic impacts of the artificial nourishment volume scenarios.
Figure 11.
Barra-Vagueira shoreline evolution if no new coastal interventions are adopted: (a) 10 years; (b) 20 years.
Figure 11.
Barra-Vagueira shoreline evolution if no new coastal interventions are adopted: (a) 10 years; (b) 20 years.
Figure 12.
Accumulated costs and benefits evolution for the baseline scenario.
Figure 12.
Accumulated costs and benefits evolution for the baseline scenario.
Figure 13.
Accumulated costs and benefits evolution for the nourishment volume scenarios: (a) 1 × 10⁵ m3/year; (b) 3 × 10⁵ m3/year; and (c) 7 × 10⁵ m3/year.
Figure 13.
Accumulated costs and benefits evolution for the nourishment volume scenarios: (a) 1 × 10⁵ m3/year; (b) 3 × 10⁵ m3/year; and (c) 7 × 10⁵ m3/year.
Figure 14.
Accumulative costs and benefits evolution, for the placement site scenarios: (a) NBS; (b) SBS; and (c) Ext.S.
Figure 14.
Accumulative costs and benefits evolution, for the placement site scenarios: (a) NBS; (b) SBS; and (c) Ext.S.
Figure 15.
Accumulative costs and benefits evolution for the scenarios that assessed the nourishment frequency: (a) 2.5 × 10⁵ m3 every half year; (b) 1 × 10⁶ m3 every 2 years; and (c) 2 × 10⁶ m3 every 4 years.
Figure 15.
Accumulative costs and benefits evolution for the scenarios that assessed the nourishment frequency: (a) 2.5 × 10⁵ m3 every half year; (b) 1 × 10⁶ m3 every 2 years; and (c) 2 × 10⁶ m3 every 4 years.
Table 1.
Economic land value defined in the case study based on [
32].
Table 1.
Economic land value defined in the case study based on [
32].
| | Description (km) | Location | Extension (km) | Value (€/m2/Year) |
|---|
| Zone 3 | Beaches | North limit | 1.0 | 2.00 |
| Zone 2 | Urban area | Intermediate | 1.5 | 10.00 |
| Zone 1 | Forests | South limit | 7.5 | 0.20 |
Table 2.
Artificial nourishments scenarios characteristics.
Table 2.
Artificial nourishments scenarios characteristics.
| Design Parameter | | 1 | 2 | 3 |
|---|
| Extension | i | 1000 m (north) | 1000 m (south) | 1500 m |
| Location | ii | 500 m (north) | 500 m (south) | - |
| Frequency | iii | 400 thousand m3
every 2 years | 2 million m3 every 10 years | - |
| Volume | iv | one-half million m3 | 2 million m3 | - |
Table 3.
Alternative nourishment scenarios for the coastal stretch Barra-Vagueira (nourishment placement sites are shown in
Figure 3).
Table 3.
Alternative nourishment scenarios for the coastal stretch Barra-Vagueira (nourishment placement sites are shown in
Figure 3).
| Design Parameter | 1 | 2 | 3 |
|---|
| Volume (m3/year) | 1 × 10⁵ | 3 × 10⁵ | 7 × 10⁵ |
| Placement site | NBS | SBS | Ext.S |
| Frequency | 2.5 × 10⁵ m3 each half year | 1 × 10⁶ m3 each 2 years | 2 × 10⁶ m3 each 4 years |
Table 4.
Summary of the physical and economic results of the artificial nourishments scenarios.
Table 4.
Summary of the physical and economic results of the artificial nourishments scenarios.
| Scenario | Territory Area (ha) | BCR20 yr | NPV20 yr | Costs | Break-Even |
|---|
| Accretion | Erosion | Impact | (−) | (€) | Initial (€) | Total * (€) | (Years) |
|---|
| BS | Figure 2 | 2.6 | 16.6 | 22.6 | 1.73 | 4,733,343 | 2,000,000 | 6,497,129 | 13 |
| i.1 | 1000 m (north) | 2.1 | 15.0 | 23.7 | 1.82 | 5,356,332 | 2,000,000 | 6,497,129 | 12 |
| i.2 | 1000 m (south) | 3.5 | 17.5 | 22.5 | 1.68 | 4,441,918 | 13 |
| i.3 | 1500 m | 2.9 | 16.0 | 23.4 | 1.76 | 4,917,737 | 13 |
| ii.1 | 500 m (north) | 1.3 | 13.4 | 24.5 | 1.80 | 5,167,493 | 2,000,000 | 6,497,129 | 13 |
| ii.2 | 500 m (south) | 3.6 | 19.0 | 21.2 | 1.51 | 3,311,101 | 14 |
| iii.1 | 400 thousand m3every 2 years | 2.9 | 15.5 | 24.0 | 1.75 | 4,643,467 | 800,000 | 6,220,104 | 12 |
| iii.2 | 2 million m3 every 10 years | 3.3 | 16.9 | 23.0 | 1.98 | 6,856,026 | 4,000,000 | 6,976,376 | 8 |
| iv.1 | one-half million m3 | 0.4 | 23.8 | 13.2 | 2.11 | 3,606,909 | 1,000,000 | 3,248,565 | 9 |
| iv.2 | 2 million m3 | 11.9 | 8.9 | 39.6 | 1.68 | 8,842,361 | 4,000,000 | 12,994,259 | 12 |
Table 5.
Physical and economic losses at Barra-Vagueira coastal stretch, after 10 and 20 years of simulation.
Table 5.
Physical and economic losses at Barra-Vagueira coastal stretch, after 10 and 20 years of simulation.
| | Area Lost
(ha) | Mean Shoreline Retreat
(m/Year) | Economic Loss *
(Million €) |
|---|
| 10 years | 27.05 | 2.25 | 16.67 |
| 20 years | 34.71 | 1.45 | 36.96 |
Table 6.
Physical and economic performance at the end of 20 years: percentage of coastal area not lost; benefit–cost ratio and net present value.
Table 6.
Physical and economic performance at the end of 20 years: percentage of coastal area not lost; benefit–cost ratio and net present value.
| Scenario | Physical Impact | BCR20 yr | NPV20 yr |
|---|
| (%) | (−) | (€) |
|---|
| Volume (m3/year) | 1 × 10⁵ | 0.20 | 0.03 | −3,145,364 |
| 3 × 10⁵ | 8.99 | 0.23 | −7,096,792 |
| 5 × 10⁵ | 15.66 | 0.25 | −11,530,765 |
| 7 × 10⁵ | 29.00 | 0.36 | −13,731,977 |
| Placement site | NBS | 23.73 | 1.10 | 1,583,142 |
| BS | 15.66 | 0.25 | −11,530,765 |
| SBS | 20.22 | 0.15 | −12,987,722 |
| Ext.S | 26.75 | 0.07 | −14,185,279 |
| Frequency | 2.5 × 10⁵ every half year | 10.59 | 0.17 | −12,773,599 |
| 5 × 10⁵ every year | 15.66 | 0.25 | −11,530,765 |
| 1 × 10⁶ every 2 years | 17.49 | 0.32 | −10,594,789 |
| 2 × 10⁶ every 4 years | 20.07 | 0.40 | −9,557,717 |
| Publisher’s Note: MDPI stays neutral with regard to jurisdictional claims in published maps and institutional affiliations. |
© 2022 by the authors. Licensee MDPI, Basel, Switzerland. This article is an open access article distributed under the terms and conditions of the Creative Commons Attribution (CC BY) license (https://creativecommons.org/licenses/by/4.0/).


