
Evaluation of Coastal Protection Strategies at Costa da Caparica (Portugal): Nourishments and Structural Interventions


Abstract
:1. Introduction
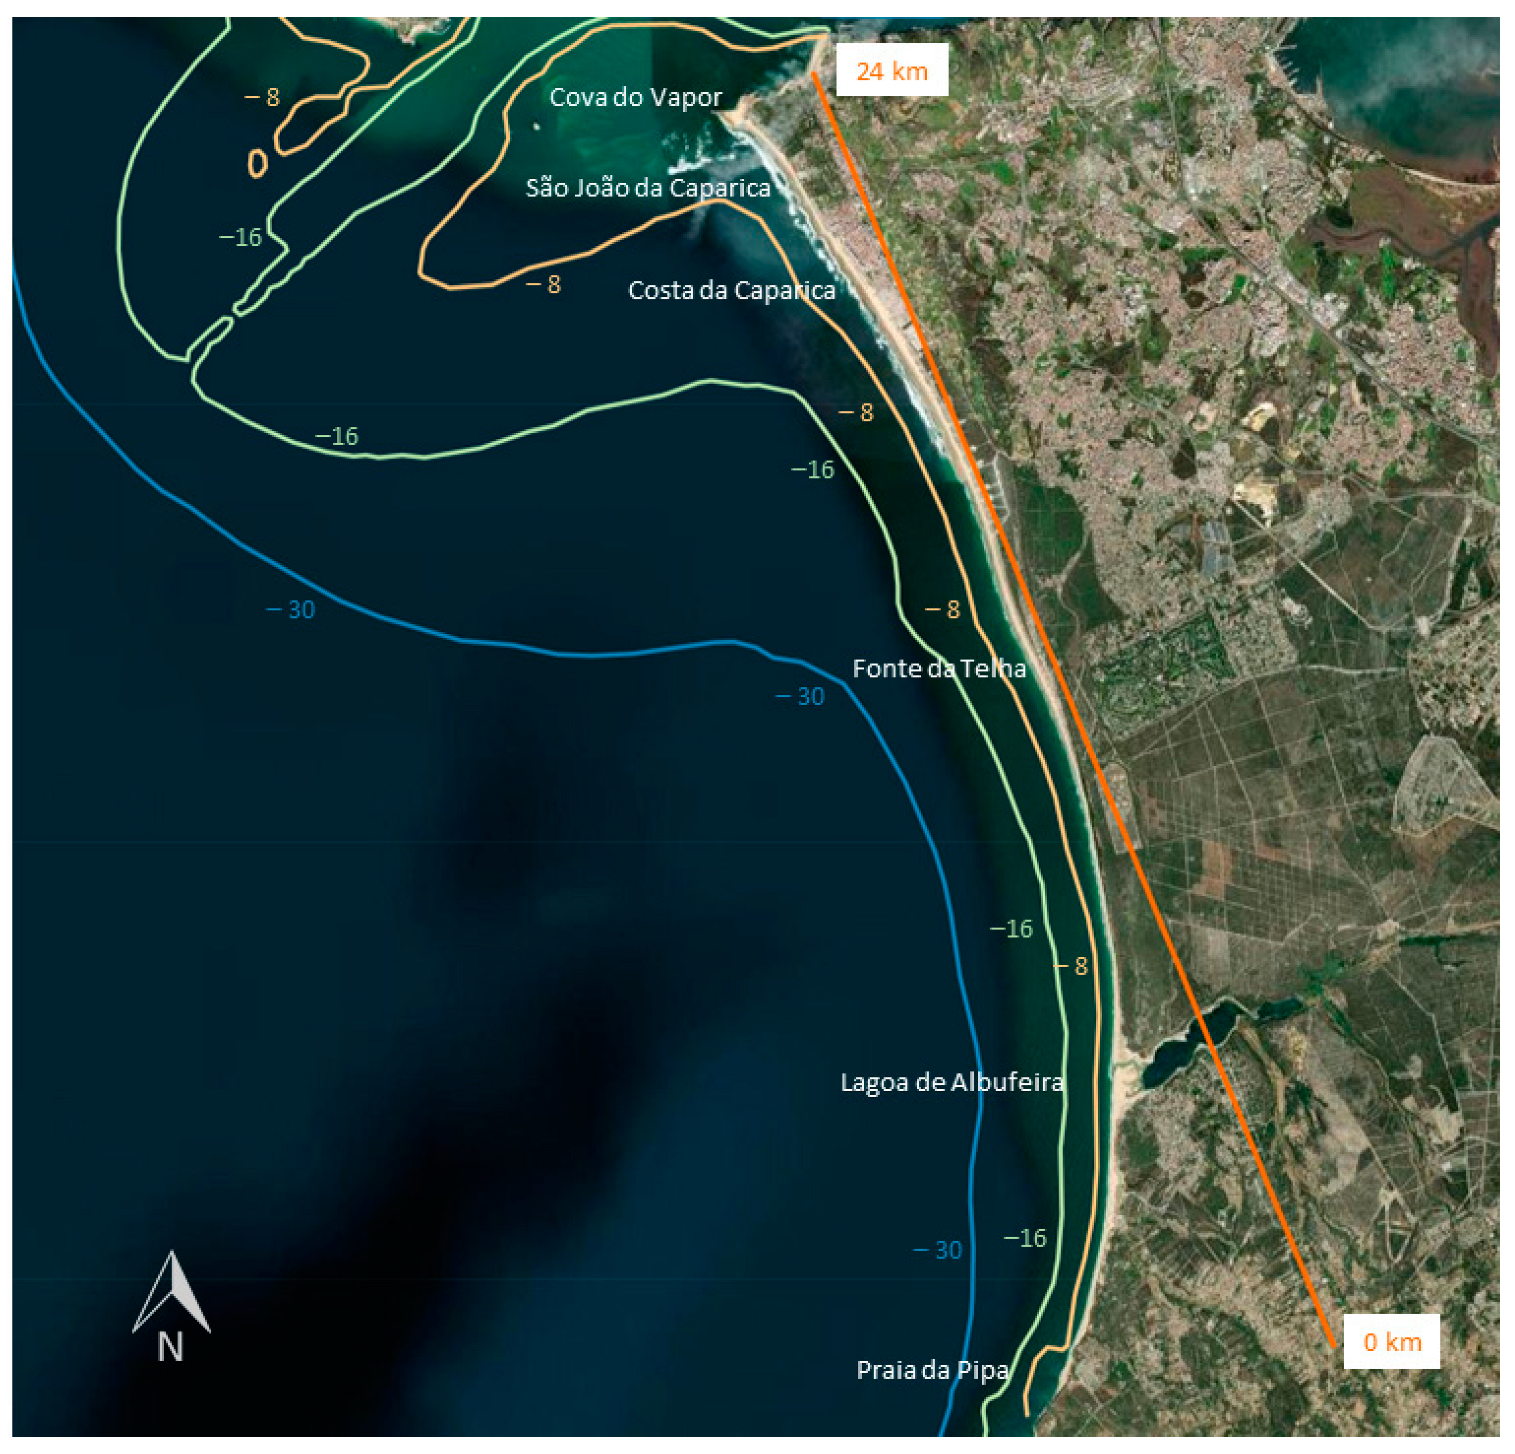
2. Study Area
3. Data and Methods
3.1. Data
3.2. Methods
3.2.1. Shoreline Identification
3.2.2. Local Wave Climate
3.2.3. Shoreline Modelling
3.2.4. Local Coastal Protection Strategies
4. Results
4.1. Calibration and Verification
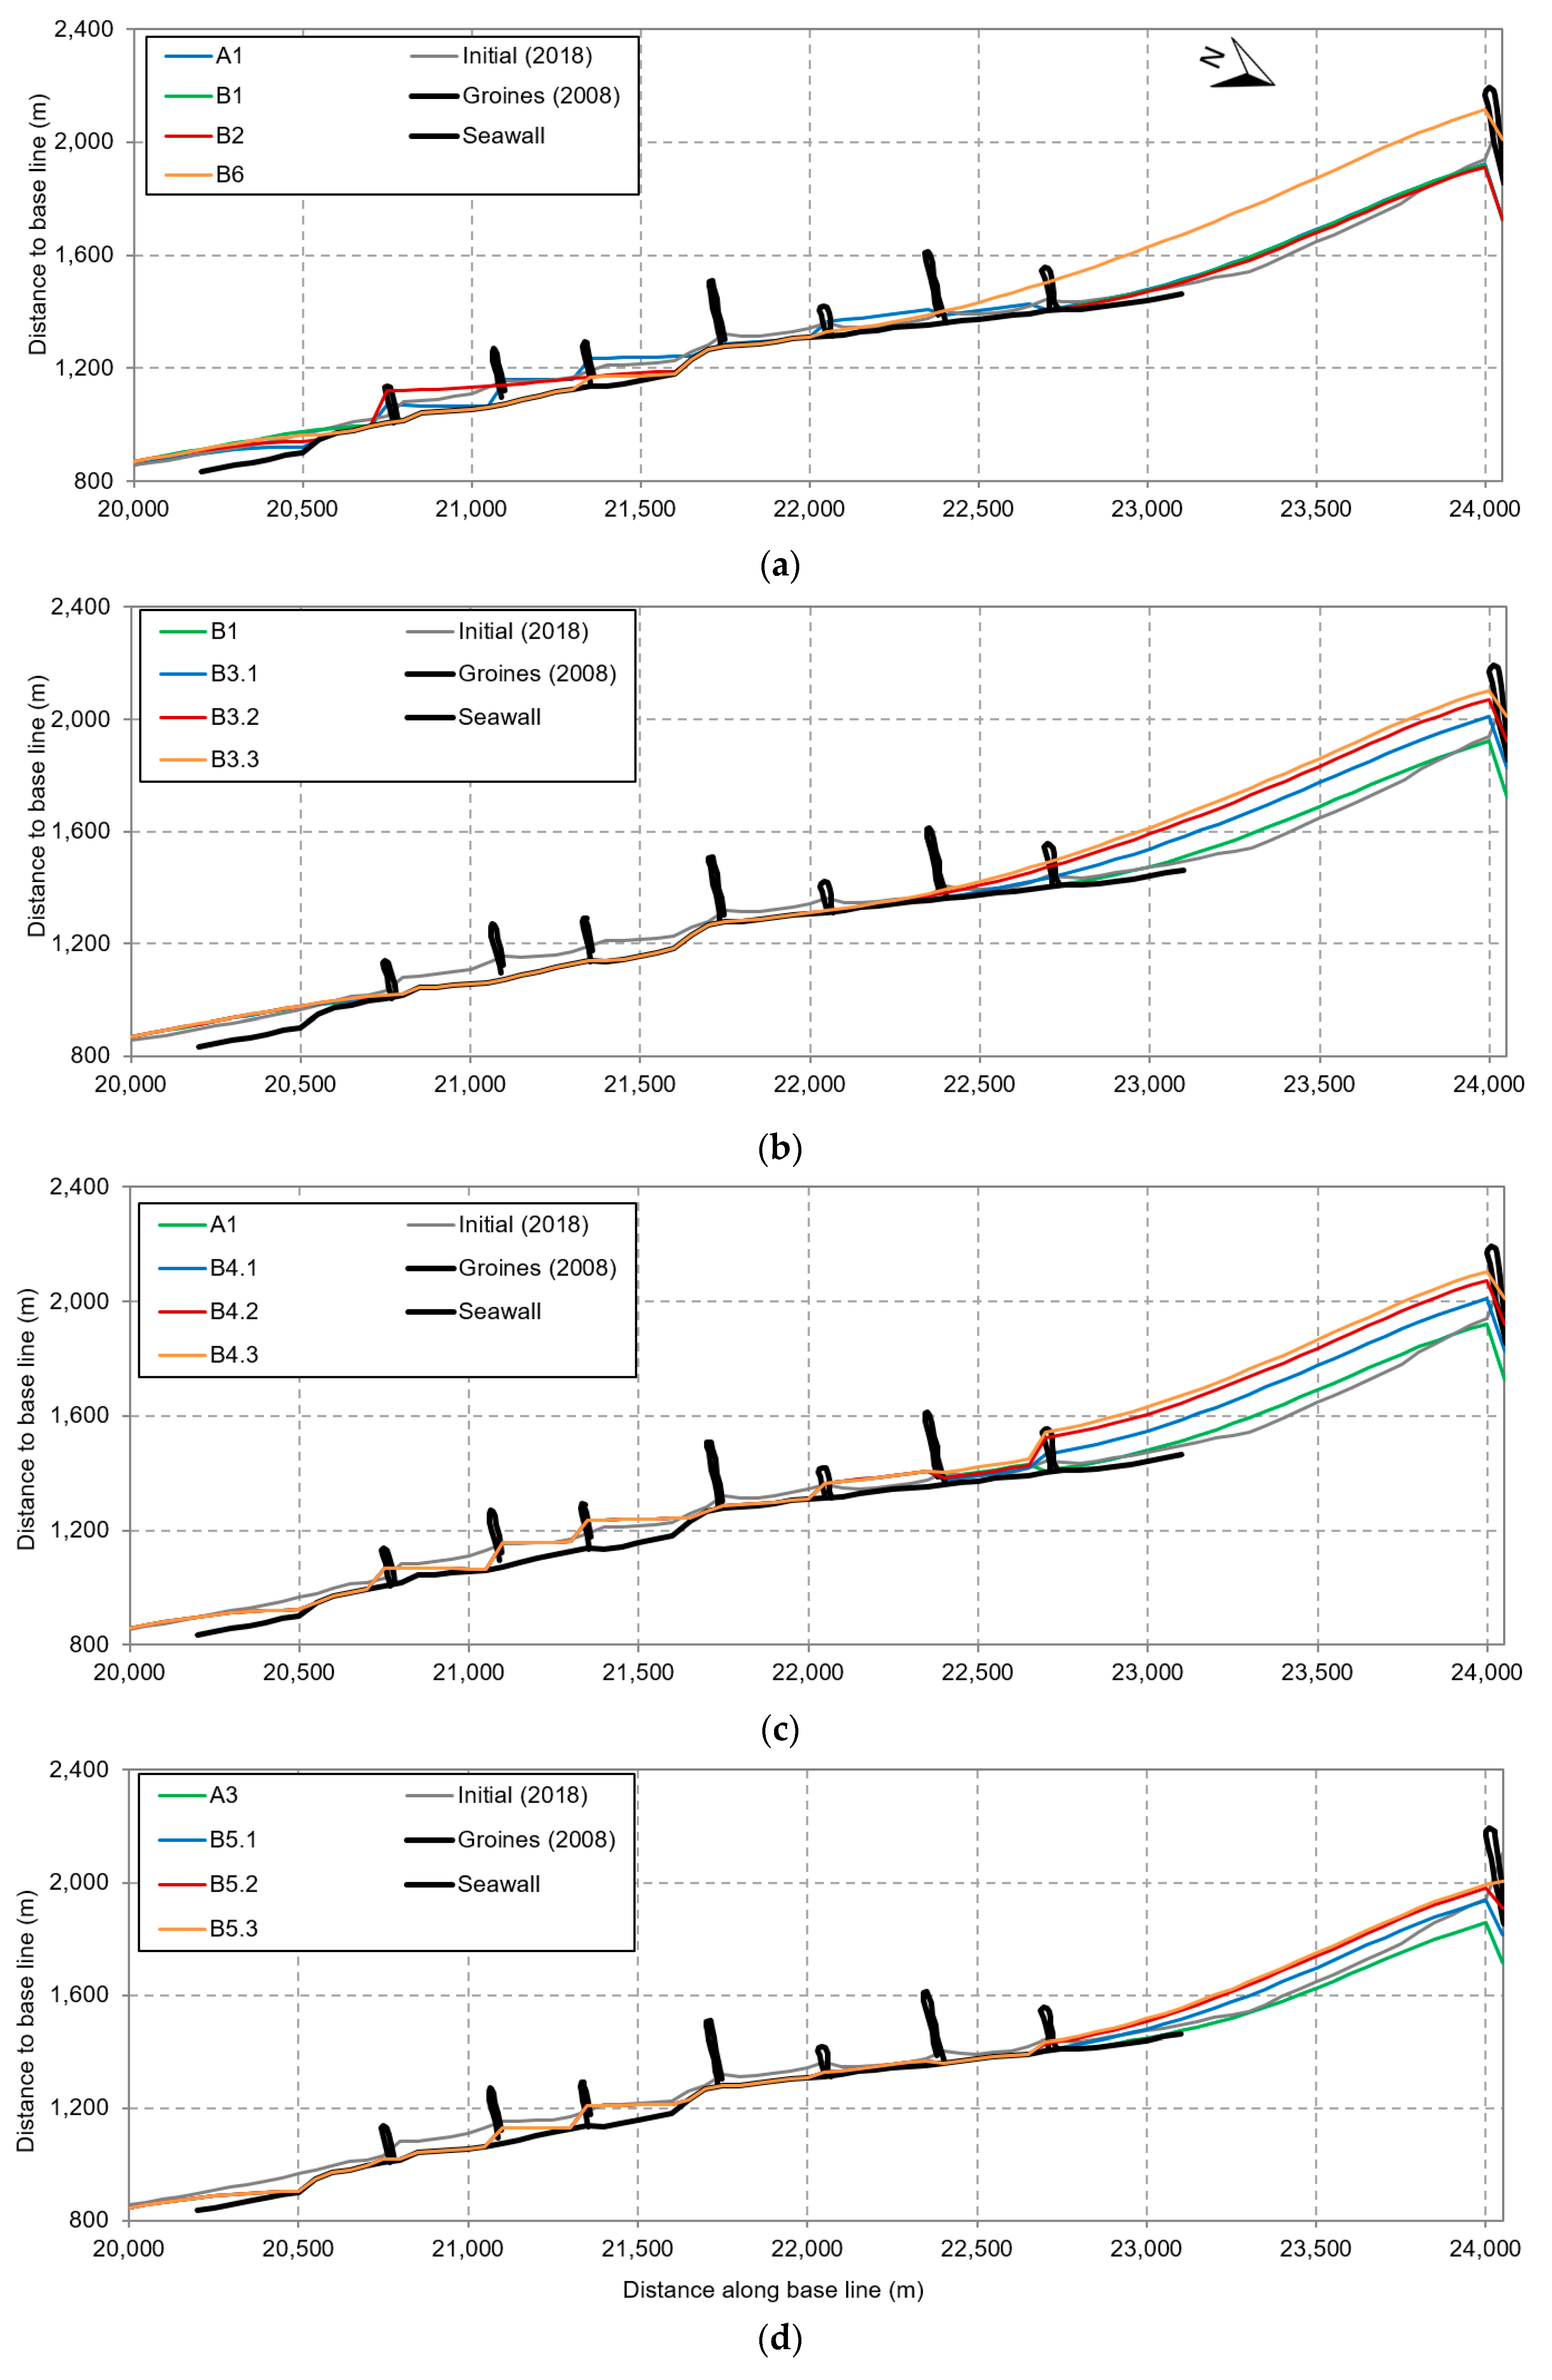
4.2. Coastal Intervention Scenario Simulations
4.2.1. Soft Solutions Plus Present Coastal Structures (Group A)
4.2.2. Structural Interventions, with or without Soft Solutions (Group B)
5. Discussion
5.1. One-Line Model Calibration Data and Setup
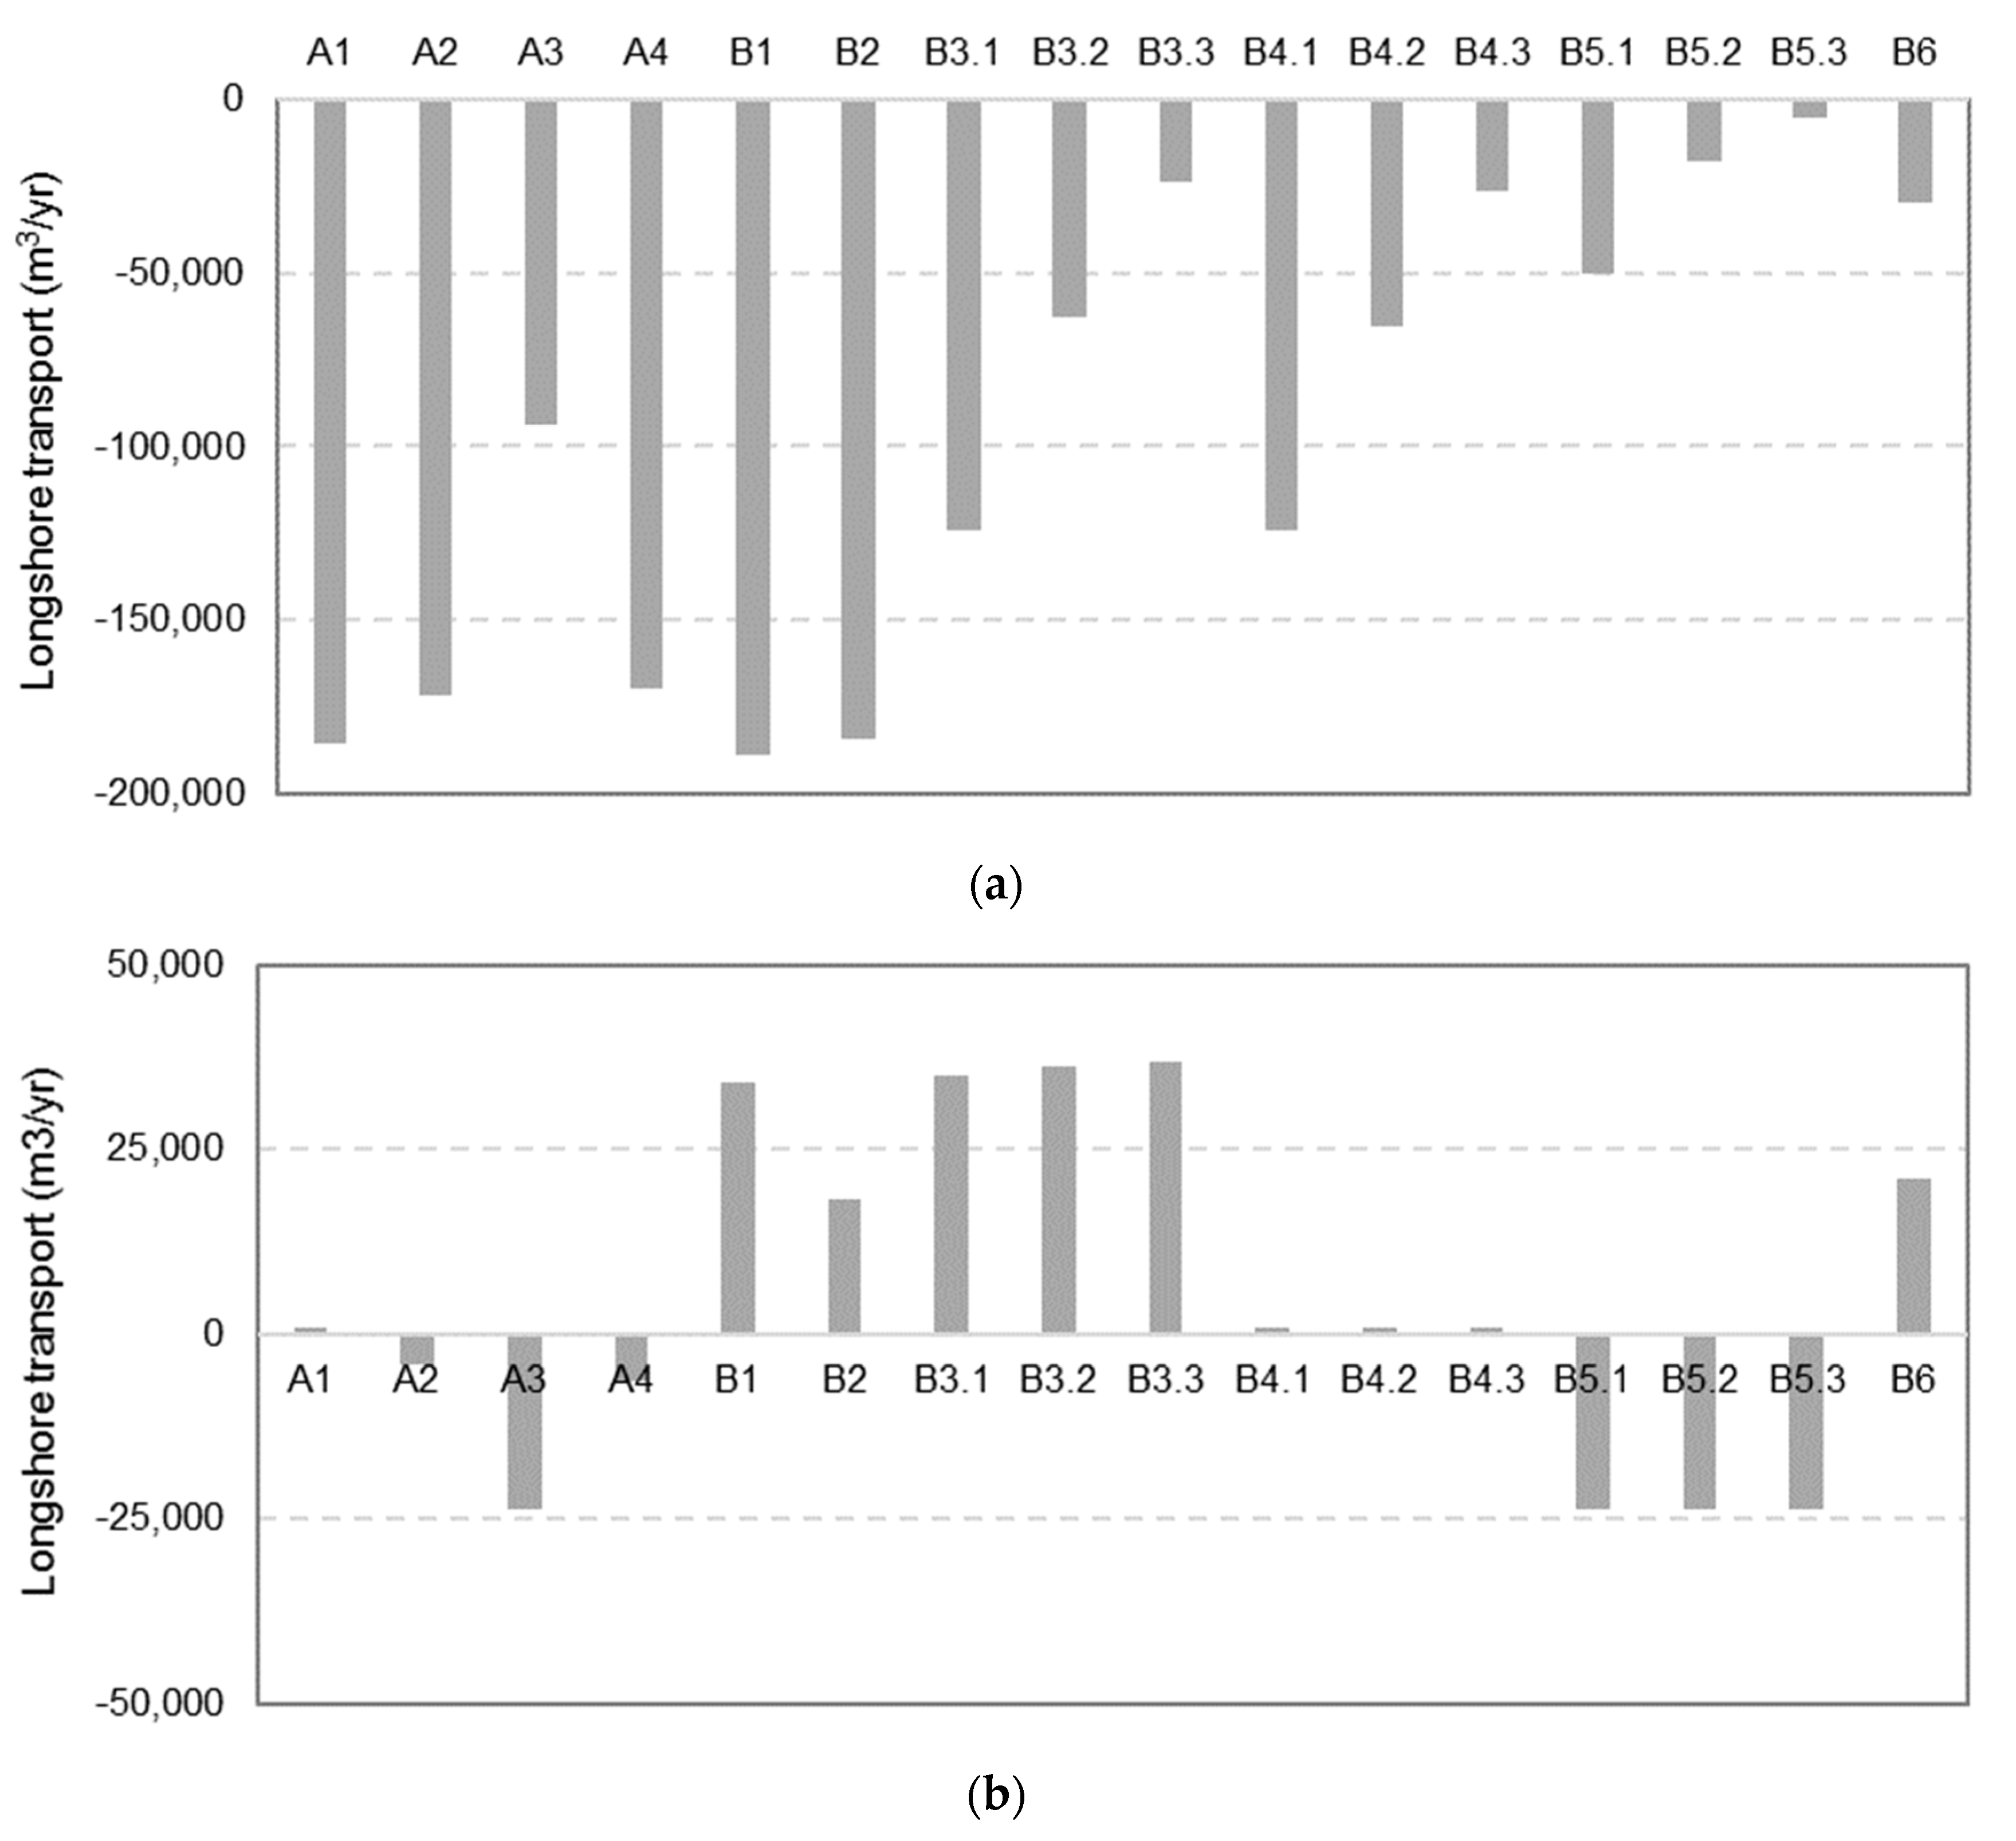
5.2. Alongshore Sediment Fluxes
5.3. Sediment Volume Budget
6. Conclusions
Funding
Data Availability Statement
Acknowledgments
Conflicts of Interest
References
- Pranzini, E. Coastal erosion and shore protection: A brief historical analysis. J. Coast. Conserv. 2018, 22, 827–830. [Google Scholar] [CrossRef]
- Mentaschi, L.; Vousdoukas, M.I.; Pekel, J.; Voukouvalas, E.; Feyen, L. Global long-term observations of coastal erosion and accretion. Sci. Rep. 2018, 8, 12876. [Google Scholar] [CrossRef]
- Vousdoukas, M.I.; Ranasinghe, R.; Mentaschi, L.; Plomaritis, T.A.; Athanasiou, P.; Luijendijk, A.; Feyen, L. Sandy coastlines under threat of erosion. Nat. Clim. Chang. 2020, 10, 260–263. [Google Scholar] [CrossRef]
- Petropoulos, A.; Kapsimalis, V.; Evelpidou, N.; Karkani, A.; Giannikopoulou, K. Simulation of the Nearshore Sediment Transport Pattern and Beach Morphodynamics in the Semi-Enclosed Bay of Myrtos, Cephalonia Island, Ionian Sea. J. Mar. Sci. Eng. 2022, 10, 1015. [Google Scholar] [CrossRef]
- Hinkel, J.; Lincke, D.; Vafeidis, A.T.; Perrette, M.; Nicholls, R.J.; Tole, R.S.J.; Marzeiong, B.; Fettweish, X.; Ionescu, C.; Levermann, A. Coastal flood damage and adaptation costs under 21st century sea-level rise. Proc. Natl. Acad. Sci. USA 2014, 111, 3292–3297. [Google Scholar] [CrossRef]
- Gracia, A.; Rangel-Buitrago, N.; Oakley, J.A.; Williams, A.T. Use of ecosystems in coastal erosion management. Ocean. Coast. Manag. 2018, 156, 277–289. [Google Scholar] [CrossRef]
- Sánchez-Arcilla, A.; García-León, M.; Gracia, V.; Devoy, R.; Stanica, A.; Gault, J. Managing coastal environments under climate change: Pathways to adaptation. Sci. Total Environ. 2016, 572, 1336–1352. [Google Scholar] [CrossRef]
- Ferreira, J.C.; Cardona, F.S.; Jóia-Santos, C.; Tenedório, J.A. Hazards, vulnerability, and risk analysis on wave overtopping and coastal flooding in low-lying coastal areas: The case of Costa da Caparica, Portugal. Water 2021, 13, 237. [Google Scholar] [CrossRef]
- Veloso-Gomes, F.; Costa, J.; Rodrigues, A.; Taveira-Pinto, F.; Pais-Barbosa, J.; Neves, L. Costa da Caparica artificial sand nourishment and coastal dynamics. J. Coast. Res. 2009, 56, 678–682. [Google Scholar]
- Silva, R.; Veloso-Gomes, F.; Pais-Barbosa, J. Morphological Behaviour of Costa da Caparica Beaches Monitored during Nourishment Operations. J. Coast. Res. 2013, 65, 1862–1867. [Google Scholar] [CrossRef]
- Silva, S.F.; Martinho, M.; Capitão, R.; Reis, T.; Fortes, C.J.; Ferreira, J.C. An index based method for coastal-flood risk assessment in low-lying areas (Costa de Caparica, Portugal). Ocean. Coast. Manag. 2017, 144, 90–104. [Google Scholar] [CrossRef]
- Santos, Â.; Mendes, S.; Corte-Real, J. Impacts of the storm Hercules in Portugal. Finisterra 2014, XLiX 98, 197–220. [Google Scholar] [CrossRef]
- Brown, J.M.; Phelps, J.J.C.; Barkwith, A.; Hurst, M.-D.; Ellis, M.A.; Plater, A.J. The effectiveness of beach mega-nourishment, assessed over three management epochs. J. Environ. Manag. 2016, 184, 400–408. [Google Scholar] [CrossRef]
- Stripling, S.; Panzeri, M.; Blanco, B.; Rossington, K.; Sayers, P.; Borthwick, A. Regional-scale probabilistic shoreline evolution modelling for flood-risk assessment. Coast. Eng. 2017, 121, 129–144. [Google Scholar] [CrossRef]
- Pereira, C.; Coelho, C. Mapping erosion risk under different scenarios of climate change for Aveiro coast, Portugal. Nat. Hazards 2013, 69, 1033–1050. [Google Scholar] [CrossRef]
- Chataigner, T.; Yates, M.L.; Le Dantec, N.; Harley, M.D.; Splinter, K.D.; Goutal, N. Sensitivity of a one-line longshore shoreline change model to the mean wave direction. Coast. Eng. 2022, 172, 104025. [Google Scholar] [CrossRef]
- Fortunato, A.B.; Freire, P.; Mengual, B.; Bertin, X.; Pinto, C.; Martins, K.; Guérin, T.; Azevedo, A. Sediment dynamics and morphological evolution in the Tagus Estuary inlet. Mar. Geol. 2021, 440, 106590. [Google Scholar] [CrossRef]
- Lira, C.P.; Nobre-Silva, A.; Taborda, R.; Andrade, C.F. Coastline evolution of Portuguese low-lying sandy coast in the last 50 years: An integrated approach. Earth Syst. Sci. Data 2016, 8, 265–278. [Google Scholar] [CrossRef]
- Pinto, C.A.; Gomes, E.; Rodrigues, A. Dredging and beach nourishment: A sustainable sediment management approach in Costa da Caparica beach (Portugal). In Proceedings of the Dredging 2015 Conference Moving and Managing Sediments, Savannah, GA, USA, 19–22 October 2015. [Google Scholar]
- Freire, P.; Fortunato, A.; Oliveira, F.S.B.F. Modelação Para Apoio às Intervenções nas Praias da Costa da Caparica–Almada. Estudo IV–Avaliação do Comportamento e Longevidade das Alimentações Artificiais. Efeito do Forçamento; Report 223/2019–DHA/NEC; LNEC: Lisbon, Portugal, 2019. (In Portuguese) [Google Scholar]
- Veloso-Gomes, F.; Taveira-Pinto, F.; Pais-Barbosa, J. Rehabilitation study of coastal defense works and artificial sand nourishment at Costa da Caparica, Portugal. In Proceedings of the 29th International Conference of Coastal Engineering 2004, Lisboa, Portugal, 19–24 September 2004; pp. 3429–3440. [Google Scholar]
- Raposeiro, P.D.; Fortes, C.J.E.M.; Capitão, R.; Reis, M.T.; Ferreira, J.C.; Pereira, M.T.S.; Guerreiro, J. Preliminary phases of the HIDRALERTA system: Assessment of the flood levels at S. João da Caparica beach, Portugal. In Proceedings of the 12th International Coastal Symposium 2013, Plymouth, UK, 9–12 April 2013; pp. 808–813. [Google Scholar] [CrossRef]
- Garzon, J.L.; Ferreira, A.M.M.; Ferreira, Ó.; Fortes, C.J.; Reis, M.T. Beach State Report: Quarteira, Praia de Faro and Costa da Caparica. EW-Coast Project-Early Warning System for Coastal Risks Induced by Storms. 2020. ALG-LISBOA-01-145-FEDER- 028657. Available online: https://www.cima.ualg.pt/EW-COAST/ (accessed on 16 April 2023).
- Sancho, F.; Silva, J.; Neves, M.G. Avaliação e quantificação da intensidade da agitação marítima no arco Caparica-Espichel. In Proceedings of the 9as Jornadas Portuguesas de Engenharia Costeira e Portuária 2017, Lisboa, Portugal, 23–24 November 2017. [Google Scholar]
- Dodet, G. Morphodynamic Modelling of a Wave-Dominated Tidal Inlet: The Albufeira Lagoon. Ph.D. Thesis, La Rochelle University, École Doctorale Sciences pour L’Environnement Gay-Lussac, La Rochelle, France, 2013; 181p. [Google Scholar]
- Fortunato, A.B.; Baptista, A.M.; Luettich, R.L., Jr. A three-dimensional model of tidal currents in the mouth of the Tagus estuary. Cont. Shelf Res. 1997, 17, 1689–1714. [Google Scholar] [CrossRef]
- Taborda, R.; Andrade, C. Morfodinâmica do Estuário Exterior do Tejo e Intervenção na Região da Caparica–v1. In Report Contributo para o Grupo de Trabalho do Litoral; Lisbon, Portugal, 2014. (In Portuguese) [Google Scholar]
- Sancho, F. Modelação Para Apoio às Intervenções Nas Praias da Costa da Caparica–Almada; Estudo II–Modelação da Evolução Morfológica para Diferentes Cenários de Intervenção. Aplicação do Modelo; Report 111/2020–DHA/NEC; LNEC: Lisbon, Portugal, 2020. (In Portuguese) [Google Scholar]
- Diogo, Z.S.; Silveira, T.M.; Sousa, H.; Carapuço, A.M.; Silva, A.N.; Taborda, R.; Andrade, C. Estudo de Caso da Costa da Caparica; Caracterização da Variabilidade Morfodinâmica Sazonal e Pós-Temporal das Praias da Costa da Caparica–Entregável 2.2.c; FCUL: Lisbon, Portugal, 2013; 119p. (In Portuguese) [Google Scholar]
- Freire, M.E.F. A planície litoral entre Trafaria e a Lagoa de Albufeira-estudo de geomorfologia litoral. Estudos (SNPRCN) 1989, 3, 1–204. [Google Scholar]
- Hallermeier, R. Uses for a calculated limit depth to beach erosion. In Coastal Engineering Proceedings; ASCE: Hamburg, Germany, 1978; Volume 1, p. 88. [Google Scholar] [CrossRef]
- Programa COSMO. Available online: https://cosmo.apambiente.pt (accessed on 20 March 2023).
- Boak, E.H.; Turner, I.L. Shoreline definition and detection: A review. J. Coast. Res. 2005, 21, 688–703. Available online: http://www.jstor.org/stable/4299462 (accessed on 30 March 2023). [CrossRef]
- Buccino, M.; Di Paola, G.; Ciccaglione, M.C.; Del Giudice, G.; Rosskopf, C.M. A Medium-Term Study of Molise Coast Evolution Based on the One-Line Equation and “Equivalent Wave” Concept. Water 2020, 12, 2831. [Google Scholar] [CrossRef]
- Silva, A.N.; Lira, C.; Matildes, R.; Andrade, C.; Taborda, R.; Freitas, M.C. Utilização de Ortofotomapas e Fotografias Aéreas Para a Delimitação da Linha de Costa–Entregável 1.2.2.2.c; FCUL: Lisbon, Portugal, 2013; 59p. (In Portuguese) [Google Scholar]
- Hapke, C.J.; Himmelstoss, E.A.; Kratzmann, M.; List, J.H.; Thieler, E.R. National Assessment 528 of Shoreline Change: Historical Shoreline Change Along the New England and Mid-Atlantic 529 Coasts. Open-File Report 2010-1118; U.S. Geological Survey: Reston, VA, USA, 2010; p. 57. [Google Scholar]
- Booij, N.; Ris, R.C.; Holthuijsen, L.H. A third-generation wave model for coastal regions, Part I, Model description and validation. J. Geophys. Res. 1999, 104, 7649–7666. [Google Scholar] [CrossRef]
- Dodet, G.; Bertin, X.; Taborda, R. Wave climate variability in the North-East Atlantic Ocean over the last six decades. Ocean. Model. 2010, 31, 120–131. [Google Scholar] [CrossRef]
- Rusu, L.; Bernardino, M.; Guedes-Soares, C. Wave forecast at the entrance of the Tagus estuary. In Proceedings on the Third International Conference on the Application of Physical Modelling to Port and Coastal Protection, COASTLAB-2010; Black Sea Coastal Research Association: Varna, Bulgaria, 2014. [Google Scholar]
- Fortunato, A.B.; Nahon, A.; Dodet, G.; Pires, A.R.; Freitas, M.C.; Bruneau, N.; Azevedo, A.; Bertin, X.; Benevides, P.; Andrade, C.; et al. Morphological evolution of an ephemeral tidal inlet from opening to closure: The Albufeira inlet, Portugal. Cont. Shelf Res. 2014, 73, 49–63. [Google Scholar] [CrossRef]
- Vicente, C.; Clímaco, M. Evolução de Linhas de Costa. Desenvolvimento e Aplicação de um Modelo Numérico; Report ICT-ITH 42; LNEC: Lisbon, Portugal, 2003. (In Portuguese) [Google Scholar]
- Oliveira, F.S.B.F.; Freire, P.; Sancho, F.; Vicente, C.M.; Clímaco, C. Rehabilitation and protection of Colwyn Bay beach: A case study. In Proceedings of the 11th International Coastal Symposium 2013, Szczecin, Poland, 9–13 May 2011; pp. 1272–1276. [Google Scholar]
- Hanson, H. Genesis: ‘A generalized shoreline change numerical model’. J. Coast. Res. 1989, 5, 1–27. [Google Scholar]
- Kamphuis, J.W. Alongshore Sediment Transport Rate. J. Waterw. Coast. Ports Ocean. Eng. 1991, 11, 624–640. [Google Scholar] [CrossRef]
- Dean, R.G. Equilibrium Beach Profiles: U.S. Atlantic and Gulf Coasts; Ocean Engineering Technical Report No. 12; Department of Civil Engineering and College of Marine Studies, University of Delaware: Newark, DE, USA, 1977. [Google Scholar]
- Duarte-Santos, F.; Mota-Lopes, A.; Moniz, G.; Ramos, L.; Taborda, R. Grupo de Trabalho do Litoral: Gestão da zona Costeira. O desafio da Mudança; Duarte Santos, F., Penha-Lopes, G., Mota Lopes, A., Eds.; Agência Portuguesa do Ambiente: Lisboa, Portugal, 2018; 368p, ISBN 978-989-99962-1-2. (In Portuguese) [Google Scholar]
- Mota-Oliveira, I.B. Port of Lisbon improvement of the access conditions through the Tagus estuary entrance. Coast. Eng. Proc. 1992, 1, 2745–2757. [Google Scholar] [CrossRef]
- Silva, A.N.; Lira, C.; Sousa, H.; Silveira, T.M.; Andrade, C.; Taborda, R.; Freitas, M.C. Análise da Evolução da Linha de Costa nos Últimos 50 Anos–Caso Especial da Costa da Caparica–Entregável 1.2.2.2.b. FCUL: Lisbon, Portugal, 2013; 24p. (In Portuguese) [Google Scholar]
- Canelas, S.T.; Sancho, F.; Trigo-Teixeira, A. A Coastal Defense Work Plan 40 Years Later: Review and Evaluation of the Espinho Case Study in Portugal. J. Waterw. Port Coast. Ocean. Eng. 2022, 148, 05022004. [Google Scholar] [CrossRef]
- Hanson, H.; Larson, M.; Kraus, N.C. A new approach to represent tidal currents and bathymetric features in the oneline model concept. Proc. Coast. Dyn. 2001, 1, 172–181. [Google Scholar]
- Hanson, H.; Kraus, N.C. GENESIS-Generalized Model for Simulating Shoreline Change. Vol. 1: Reference; Manual and Users Guide Technical Report CERC-89-19; Coastal Engineering Research Center, U.S. Army Corps of Engineers: Washington, DC, USA, 1989; 247p. [Google Scholar]
- Antolínez, J.A.A.; Méndez, F.J.; Anderson, D.; Ruggiero, P.; Kaminsky, G.M. Predicting climate-driven coastlines with a simple and efficient multiscale model. J. Geoph. Res. Earth Surf. 2019, 124, 1596–1624. [Google Scholar] [CrossRef]
- Mil-Homens, J.; Ranasinghe, R.; van Thiel de Vries, J.S.M.; Stive, M.J.F. Re-evaluation and improvement of three commonly used bulk longshore sediment transport formulas. Coast. Eng. 2013, 75, 29–39. [Google Scholar] [CrossRef]
- Pilkey, O.; Cooper, A. Longshore transport volumes: A critical view. J. Coast. Res. 2002, 36, 572–580. [Google Scholar] [CrossRef]
- Barceló, J.P. Esporões Marítimos–Funcionamento Hidráulico de Unidades Fisiograficamente Independentes; LNEC: Lisboa, Portugal, 1966; 115p. (In Portuguese) [Google Scholar]
- TECHINT. Estudo do Aproveitamento Turístico da Área da Cova do Vapor; Compagnia Tecnica Internazionale: Castellanza, Italy, 1966. (In Portuguese) [Google Scholar]
- Taborda, R.; Andrade, F.C.; Silva, N.A.; Silveira, M.T.; Lira, C.; Freitas, C.M.; Pinto, C. Caparica-Espichel Longshore Sediment Transport Model. In Proceedings of the IX Congresso Nacional de Geologia, Comunicações Geológicas, Porto, Portugal, 18–24 July 2014; Volume 101, pp. 641–644. Available online: http://www.lneg.pt/iedt/unidades/16/paginas/26/30/185 (accessed on 30 March 2023). (In Portuguese).
- Pinto, C.; Silveira, T.; Teixeira, S. Alimentação Artificial de Praias na Faixa Costeira de Portugal Continental: Enquadramento e Retrospetiva das Intervenções Realizadas (1950–2017); Relatório técnico; Departamento do Litoral e Proteção Costeira. Núcleo de Monitorização Costeira e Risco: Amadora, Portugal, 2018; 61p. (In Portuguese) [Google Scholar]
- Pais, D.; Andrade, C.; Pinto, C. Evolution of a beach-dune system after artificial nourishment: The case of São João da Caparica (Portugal). In Proceedings of the Building Coastal Resilience 2022, Dune in Front of a Dike International Conference, KU Leuven Bruges Campus, Bruges, Belgium, 12–13 April 2022. [Google Scholar]


| Data Type | Time and Date (dd/mm/yy) | Scale and Resolution (If Available) | Spatial Range | Tidal Level (m C.D.) |
|---|---|---|---|---|
| Aerial photo | 7 April 1979; 11 h 00–12 h 00 (UTC + 1) | 1:10,000 | Entire sector | 2.46–2.65 |
| Topo-hydrograpic survey | September and October 1979 | 1:5000 | “Praia da Mata” to “Lagoa de Albufeira” | - |
| Topo-hydrograpic survey | September 1980 | 1:2000 | “Costa da Caparica” | - |
| Aerial photo | 9 March 1989, 11 h 00–11 h 10 (UTC), 14 March 1989; 15 h 10 (UTC), 22 March 1989; 11 h 05 (UTC) | 1:15,000 | “Costa da Caparica” to “Lagoa de Albufeira” | 0.74–0.85 1.67 1.66 |
| Orthophotomap (False colour) | 29 August 1995, (low-tide) | 1:40,000 1 m resolution | Entire sector | 1.0 |
| Orthophotomap | 9 November 2004, (high tide) 13 November 2004, (high tide) 14 November 2004, (high tide) | - 0.1 m resolution | Entire sector | 3.2 3.7 3.5 |
| Orthophotomap | 6–7 September 2008, 15 September 2008, 10 October 2008 | - 0.1 m resolution | Entire sector | - |
| Orthophotomap | 24 October 2014, (high tide) 26 October 2014, (high tide) | - 0.1 m resolution | Entire sector | 3.44 3.50 |
| Orthophotomap | 17 September 2018, (high tide) | - 0.03 m resolution | “Cova do Vapor” to “Praia da Cornélia” | 2.7 |
| Scenario | Description |
|---|---|
| A | Without hard engineering interventions |
| A1 | 1 × 10⁶ m3 beach nourishments, every 5 years, distributed alongshore over 3800 m |
| A2 | One large (3 × 10⁶ m3) beach nourishment “shot”, at project beginning lifetime |
| A3 | No intervention |
| A4 | 1 × 10⁶ m3 beach nourishments, every 5 years, distributed alongshore over 1900 m |
| B | With hard engineering interventions |
| B1 | Similar to A1; removal of all groins from EC1 to EC7 |
| B2 | Similar to A1; removal of groins EC2, EC3, EC5, EC6 and EC7 |
| B3.1 | Similar to B1; EV1 groin length increase of 100 m |
| B3.2 | Similar to B1; EV1 groin length increase of 200 m |
| B3.3 | Similar to B1; EV1 groin length increase of 300 m |
| B4.1 | Similar to A1; EV1 groin length increase of 100 m |
| B4.2 | Similar to A1; EV1 groin length increase of 200 m |
| B4.3 | Similar to A1; EV1 groin length increase of 300 m |
| B5.1 | Similar to A3; EV1 groin length increase of 100 m |
| B5.2 | Similar to A3; EV1 groin length increase of 200 m |
| B5.3 | Similar to A3; EV1 groin length increase of 300 m |
| B6 | Similar to A1; removal of groins EC1, EC2, EC4, EC6 and EC7; EV1 groin length increase of 300 m |
| A 1500 < x ≤ 2000 (m) | B 2000 < x ≤ 7000 (m) | C 7000 < x ≤ 14,000 (m) | D 14,000 < x ≤ 17,000 (m) | E 17,000 < x ≤ 20,700 (m) | F 20,700 < x ≤ 24,000 (m) | |
|---|---|---|---|---|---|---|
| Simulated | −159.6 | −29.8 | 3.5 | 11.5 | −25.2 | −14.7 |
| Measured | −33.8 | 2.0 | 4.7 | 17.2 | 4.9 | −19.4 |
Disclaimer/Publisher’s Note: The statements, opinions and data contained in all publications are solely those of the individual author(s) and contributor(s) and not of MDPI and/or the editor(s). MDPI and/or the editor(s) disclaim responsibility for any injury to people or property resulting from any ideas, methods, instructions or products referred to in the content. |
© 2023 by the author. Licensee MDPI, Basel, Switzerland. This article is an open access article distributed under the terms and conditions of the Creative Commons Attribution (CC BY) license (https://creativecommons.org/licenses/by/4.0/).
Share and Cite
Sancho, F. Evaluation of Coastal Protection Strategies at Costa da Caparica (Portugal): Nourishments and Structural Interventions. J. Mar. Sci. Eng. 2023, 11, 1159. https://doi.org/10.3390/jmse11061159
Sancho F. Evaluation of Coastal Protection Strategies at Costa da Caparica (Portugal): Nourishments and Structural Interventions. Journal of Marine Science and Engineering. 2023; 11(6):1159. https://doi.org/10.3390/jmse11061159
Chicago/Turabian StyleSancho, Francisco. 2023. "Evaluation of Coastal Protection Strategies at Costa da Caparica (Portugal): Nourishments and Structural Interventions" Journal of Marine Science and Engineering 11, no. 6: 1159. https://doi.org/10.3390/jmse11061159
APA StyleSancho, F. (2023). Evaluation of Coastal Protection Strategies at Costa da Caparica (Portugal): Nourishments and Structural Interventions. Journal of Marine Science and Engineering, 11(6), 1159. https://doi.org/10.3390/jmse11061159