Article

A Nonlinear Phase Transition Dynamic Model for Shape Memory Alloys Based Deep Sea Actuators

1
College of Marine Sciences, Shanghai Ocean University, Shanghai 201306, China
2
School of Engineering, Westlake University, Hangzhou 310024, China
3
Shanghai OceanHome Technology Co., Ltd., Shanghai 201306, China
*
Author to whom correspondence should be addressed.
J. Mar. Sci. Eng. 2022, 10(12), 1951; https://doi.org/10.3390/jmse10121951
Submission received: 17 October 2022 / Revised: 24 November 2022 / Accepted: 5 December 2022 / Published: 8 December 2022
(This article belongs to the Special Issue Frontiers in Deep-Sea Equipment and Technology II)

Abstract

:
A constitutive relation for shape memory alloys (SMAs) that is simple, accurate, and effective is the basis for deep-sea intelligent actuators used in marine engineering applications. The existing kinetic models of phase transition all have common drawbacks, such as sharp change at the turning point of the phase transition, constant phase transition rate, and many variable parameters. In this study, the one-dimensional thermodynamic constitutive equation for SMAs is extended based on the thermodynamic framework of the Boyd–Lagoudas constitutive model. In addition, the traditional phase transition function is replaced by an improved logistic nonlinear function in order to construct the relation for the macroscopic variable-speed phase transition that constitutes deep-sea actuator driving wires. The logistic model is compared to other models and verified by the numerical fitting results of the traditional constitutive model and the experimental data for two scenarios: (1) constant load and (2) constant temperature. The results show that the improved constitutive model has more advantages and better adaptability than the traditional models. Consequently, it can accurately describe the slow and gradual phase transitions in the initial and final regions of the phase transition with fewer variable parameters and has the ability to flexibly adjust the rate of change of the phase transition rate. These results provide important theoretical support for the design of SMA deep-sea actuators used in marine engineering applications.

1. Introduction

The deep sea is located at a depth of more than 1000 m below the ocean’s surface, and it accounts for about 90% of the ocean system. Due to its extreme environment of high pressure, low temperature, and no light, humans have minimal understanding of this part of the ocean. Nevertheless, the deep sea is the most important area for gathering oil, gas, minerals, and biological resources [1], and it also forms the core of what is called the “smart ocean.” In recent years, with the development of emerging technologies, such as artificial intelligence and network cloud computing, in marine fields, the smart ocean has become another “peak” in the strategy for “caring about the ocean, understanding the ocean, and managing the ocean” [2]. The application of smart ocean engineering to the deep sea has revealed the limitations of traditional deep-sea drive systems, and new actuators based on smart materials are urgently required for new marine equipment that is miniaturized, intelligent, and refined.
Shape memory alloys (SMAs) are suitable for fulfilling these requirements. They are a new type of biofunctional material that integrate sensing, actuation, and control. At present, they are the most suitable smart material useful for practical applications of marine engineering [3,4]. In particular, titanium-nickel (Ti-Ni) SMAs are the most widely used and have the best thermomechanical properties. Accordingly, they have significant application potential not only in marine fields, but in aerospace, national defense, automotive, electromechanical, biomedical, and other fields as well [5]. Furthermore, Ti-Ni SMAs possess excellent shape memory effect (the maximum shrinkage strain of their one-way and two-way shape memory effects can reach 8% and 4.1%, respectively), superelasticity, corrosion resistance, and biocompatibility [6]. Moreover, the special phase composition (martensite phase and austenite phase) and crystal structure (crystalline martensite, detwinned martensite, and austenite) of SMAs results in a complex thermomechanical response to external stimulation. This structural relationship also exhibits nonlinear coupling. Currently, the mainstream SMA constitutive models are divided into macroscopic phenomenological models, microscopic mechanical models, and microscopic thermodynamic models. The macroscopic phenomenological models are considered to be the most valuable models for SMA structural analysis and engineering design because they have fewer parameters and their fitting and calculation methods are simple [7,8]. The most widely used models in this category are exponential function macromodels (e.g., the Tanaka and Boyd-Lagoudas models) and cosine function macromodels (e.g., the Liang–Rogers and Brinson models) [8,9,10]. The Brinson model subdivides martensite transformation into temperature-induced and stress-induced parts, which more accurately describes the relationship between stress, strain, temperature and martensite volume fraction, and effectively describes the martensite reorientation process. At present, it is a relatively complete phenomenological theory based constitutive model for actual engineering application. The main difference between these models is the assumed phase transition kinetic function. These traditional phase transition functions still have many common drawbacks, even though their fitting methods are simple [11,12,13]. On the one hand, the predicted thermomechanical responses at the beginning and end of the phase transition change abruptly, which is inconsistent with the smooth and gradual changes that are actually exhibited at the beginning and end of the phase transition. On the other hand, traditional phase transition kinetic models only focus on the phase transition and ignore the variable nature of its intermediate process. In order to avoid the fitting errors caused by these common drawbacks, it is necessary to improve the existing model in order to build a simple, accurate, and effective constitutive model that is useful for engineering applications, such as deep-sea actuators.
The logistic function is often used to describe the dynamic processes of systems to elucidate the “slow-fast-slow” system evolution law, and it has been improved many times to adapt to nonlinear growth modeling applications in different fields [14]. The logistic function is characterized by typical sigmoid nonlinear growth, which is consistent with the thermodynamic response characteristics of the SMA phase transition process [15]. In this study, based on the thermodynamic framework of the Boyd–Lagoudas constitutive model, the thermodynamic constitutive equation is extended to replace the traditional phase transition function with an improved logistic function. This serves to facilitate the construction of an SMA constitutive relation that can describe the slow and asymptotic phase in the initial and final regions of the entire phase transition as well as the transition rate variability. By comparing the numerical fitting results of the traditional Brinson model and the logistic constitutive model, the superior performance of the improved logistic function is verified. Lastly, the validity of the model is verified with experimental data.
The rest of this paper is organized as follows. Section 2 details the hydrostatic pressure dependence of the SMA phase transition process. In Section 3, the macroscopic phenomenological variable speed constitutive model is explained. Section 4 describes and discusses the results, and Section 5 draws the conclusions.

2. Hydrostatic Pressure Dependence of SMA Phase Transition Process

Hydrostatic pressure is an omnidirectional force that is exerted by a homogeneous fluid on an object, and it acts on all surfaces of the object with an equal vertical compressive stress. An increase in hydrostatic pressure reduces the volume of the object subject to that pressure but does not change its shape. The effect of omnidirectional hydrostatic pressure on SMA behavior is primarily reflected in the change of the material’s elastic volume and does not involve plasticity [16]. When the volume of the SMA changes reversibly during the phase transition, the amount by which the hydrostatic pressure changes the phase transition temperature is independent of the phase transition mechanism and the distribution of the two phases at the phase transition temperature [17]. According to the Clausius–Clapeyron equation, the relationship between the omnidirectional hydrostatic pressure and the phase transition temperature can be expressed as
d P d T = Δ H T 0 Δ V = Δ S Δ V
where P is the hydrostatic pressure, T is the phase transition temperature that occurs under the hydrostatic pressure; T0 is the equilibrium temperature of the two phases, T 0 = ( M s + A s ) / 2 , where A s and M s are the characteristic temperatures of the SMA phase transition, respectively; Δ V is the change in volume that occurs during the SMA phase transition, Δ H is the latent heat of the phase transition, and Δ S is the change in entropy of the phase transition.
The temperature of the SMA phase transformation depends linearly on the external stress, and changes in the phase transition temperature do not depend on the macroscopic direction of the stress [18,19]. The rate of change of the equivalent hydrostatic stress as a function of phase transition temperature under multidimensional loading can be expressed as
d P d T = C i
where Ci is the rate of change of the stress of the martensite (i = M) or austenite (i = A) transformation (which is the slope of the stress-transition temperature curve). Integrating Equation (2) results in
T = P C i + T 0
where T 0 is the transformation temperature under normal pressure.
Because the thermoelastic phase transition of dense solid SMA wire is almost volume-conserved, the percentage of the volume change caused by the phase transition under an external force is very small and almost negligible. Therefore, the effect of hydrostatic pressure on the transformation strain of solid SMA wire is negligible, i.e., the influence of omnidirectional hydrostatic pressure on the solid SMA constitutive model can be ignored [20,21].

3. Constitutive Model of Nonlinear Phase Transition

SMAs have special thermodynamic properties that are different from the general properties of metals, and their constitutive model exhibits a coupled nonlinear stress–strain–temperature relationship. Most of the engineering applications of deep-sea actuators are based on SMA wire [22,23]. The macroscopic phenomenological constitutive model based on thermodynamics and phase transition dynamics can facilitate simple and efficient simulations and predictions of the macroscopic thermodynamic behavior of SMAs, which is relevant for the design of intelligent actuators used in marine engineering applications.

3.1. Thermodynamic Constitutive Equations of SMAs in the Deep Sea Environment

In the deep sea environment, fully dense SMA wire is constrained by a multidimensional stress tensor, which is composed of two parts: the omnidirectional hydrostatic pressure tensor and the deviatoric stress tensor. As the elastic volume changes, the deviatoric stress tensor primarily causes the deformation of the material. Small-diameter and dense SMA wire used in deep-sea actuators undergoes very minimal volume changes due to the omnidirectional hydrostatic pressure, and the effect of the hydrostatic pressure on the phase transformation strain in SMAs is negligible [20,21]. Assuming SMA wire is isotropic, the multidimensional load state of the SMA wires in the deep sea environment can be simplified to one dimension.
According to Hartl et al. [24], the total strain in an SMA is the sum of the elastic strain, phase transformation strain, and thermal expansion strain. This can be expressed as
ε = ε e + ε t + ε α
where ε is the total strain, ε e is the elastic strain, ε t is the phase transformation strain, and ε α is the thermal expansion strain.
Differentiating Equation (4), the Green–Lagrange strain increment form can be expressed as
d ε = d ε e + d ε t + d ε α
where d ε e is the elastic strain increment, d ε t is the transformation strain increment (which is related to the martensite volume fraction), and d ε α is the thermoelastic strain increment.
According to the principles of elasticity and thermodynamics,
d ε e = d σ / D ( ξ ) d ε α = α d T
where σ is the stress, T is the temperature, ξ is the volume fraction of martensite, D ( ξ ) is the elastic modulus of the SMA, and α is the thermal expansion coefficient of the SMA material.
Given that the transformation strain varies linearly with the volume fraction of the detwinned martensite, the maximum transformation strain is reached in the state in which 100% of the martensite is detwinned [25]. This can be expressed as
ε t = ε L ξ DM
where ε L is the maximum recoverable residual strain of the SMA.
Combining Equations (5)–(7), the SMA constitutive equation can be expressed as
d ε = d σ D ( ξ ) + ε L d ξ DM + α d T
Based on the crystal phase structure composition of SMAs, and the fact that the martensite contains twinned martensite and detwinned martensite variants, the total martensite volume fraction and elastic modulus of SMAs can be expressed as
ξ = ξ DM + ξ TM D ( ξ ) = D A + ξ ( D M D A ) = D A + ξ ( D TM D A ) + ξ DM ( D DM D TM )
where ξ TM and ξ DM are the volume fractions of the twinned and detwinned martensite, respectively; D M and D A are the elastic moduli of the complete martensite and austenite phases, respectively, and D TM and D DM are the elastic moduli of the twinned and detwinned martensite, respectively.
Integrating Equation (8), the SMA constitutive equation in full form can be expressed as
ε ε 0 = σ D ( ξ ) σ 0 D ( ξ 0 ) + ε L ( ξ DM ξ DM 0 ) + α ( T T 0 )
where ε 0 , σ 0 , ξ DM 0 , and T 0 represent the initial values of the corresponding variables.

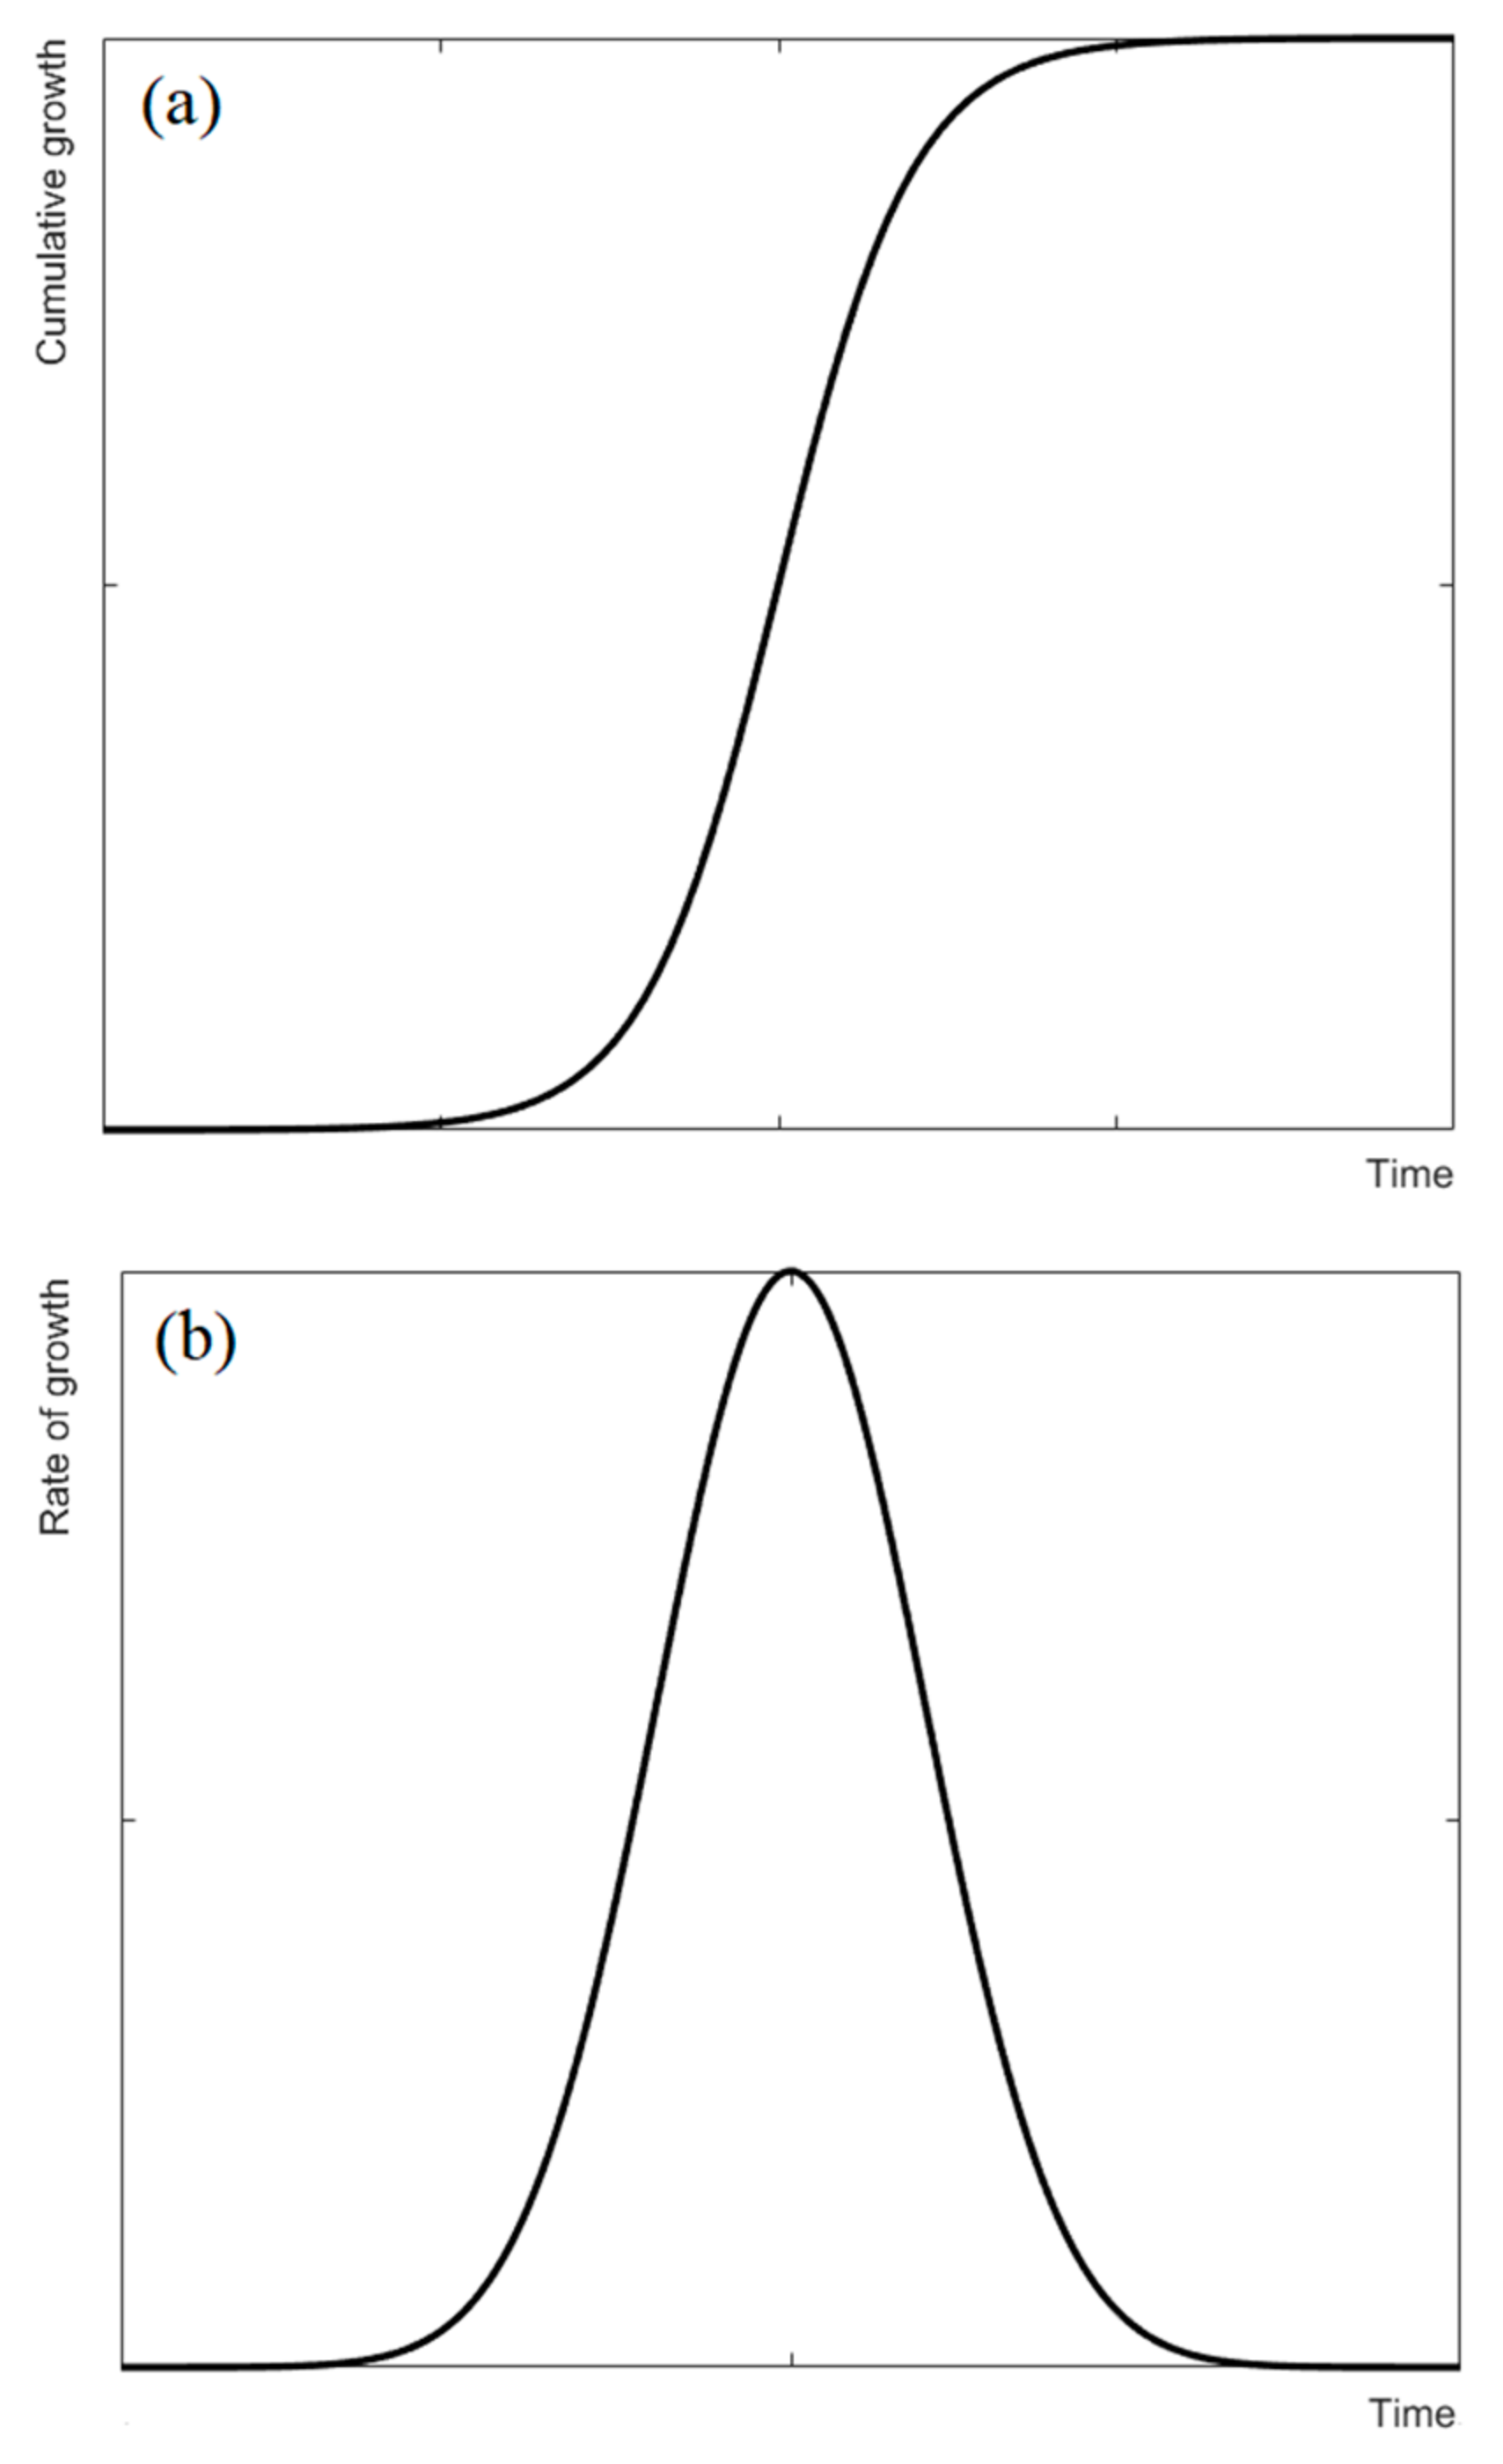
3.2. Dynamic Equation of Phase Transition Based on Logistic Function

The kinetic equation of the phase transformation characterizes the dependence of the martensite volume fraction on changes in the external loads (e.g., temperature and stress), and is the basis for the construction of the SMA constitutive model. The logistic function is a continuous, smooth, and strictly monotonic threshold function, and its mathematical formula is defined as [26]
f ( x ) = 1 1 + e x
where x is the independent variable.
The logistic function is characterized by typical sigmoid nonlinear growth [14]. The bell-shaped curve of its natural growth rate corresponds to the rate of change of the peak of the heat flow-temperature curve of SMAs, and the cumulative growth curve is very similar to the rate of change of the martensite volume fraction as a function of temperature, as shown in Figure 1. Figure 1a shows the curve of logistic function, and Figure 1b shows the derivative of logistic function.
According to the differential scanning calorimetry (DSC) test curve of Ikuta et al. [19], the rate of change of the martensite volume fraction is a typical S-shaped nonlinear growth curve. On the basis of the phase transition kinetic model constructed by Ikuta et al., the description of the intermediate variable process using the phase transition rate coefficient was added. By replacing the traditional phase transition kinetic equation with the improved logistic function, the slow and gradual phase transition in the initial and final regions of the entire phase transition process could be described and the thermodynamic behavior of SMA with different phase transition rates could be expressed. This generated numerical simulation results that were more consistent with the experimental results. The shape memory effect has different transformation kinetic equations in the process of martensite forward and reverse transformation.
When T > 0 , the martensite volume fraction can be expressed as
ξ M A = 1 1 + e ab A f A s ( T T A σ C A )
T A = A s + A f 2
and when T < 0 , the martensite volume fraction can be expressed as
ξ A M = 1 1 + e ab M s M f ( T T M σ C M )
T M = M s + M f 2
where T M and T A are the average characteristic temperatures of the martensite and austenite phases under zero stress, respectively. M s and M f are martensite start and finish temperature, respectively, during cooling. A s and A f are austenite start and finish temperature, respectively, during heating. C M and C A are the rates of change of the stress of the forward and reverse martensite transformations (which are the slopes of the stress-transformation temperature curve), respectively, a is the phase transition rate coefficient, and b is a material constant related to the atomic ratio of Ni-Ti alloys (which can be obtained via a DSC test). When T = 0 , the SMA transforms from twinned martensite to detwinned martensite due to the stress. The detwinned martensite volume fraction can be expressed as
ξ DM = 0 σ σ s 1 1 + e ab σ s σ f ( σ σ d ) σ s < σ < σ f 1 σ σ f
σ d = σ s + σ f 2
where σ s and σ f are the critical stresses at the beginning and end of the martensite detwinning, respectively, and σ d is the average value of the critical stress of the detwinned martensite phase in the zero stress state.

4. Results and Discussion

Based on the improved SMA constitutive model of the logistic function, the dynamic process of the SMA phase transition was fitted and analyzed. Numerical fitting and prediction were carried out through the shape memory effect under the two scenarios of a constant load and constant temperature, and the model was compared and verified by traditional constitutive data as well as literature test data.

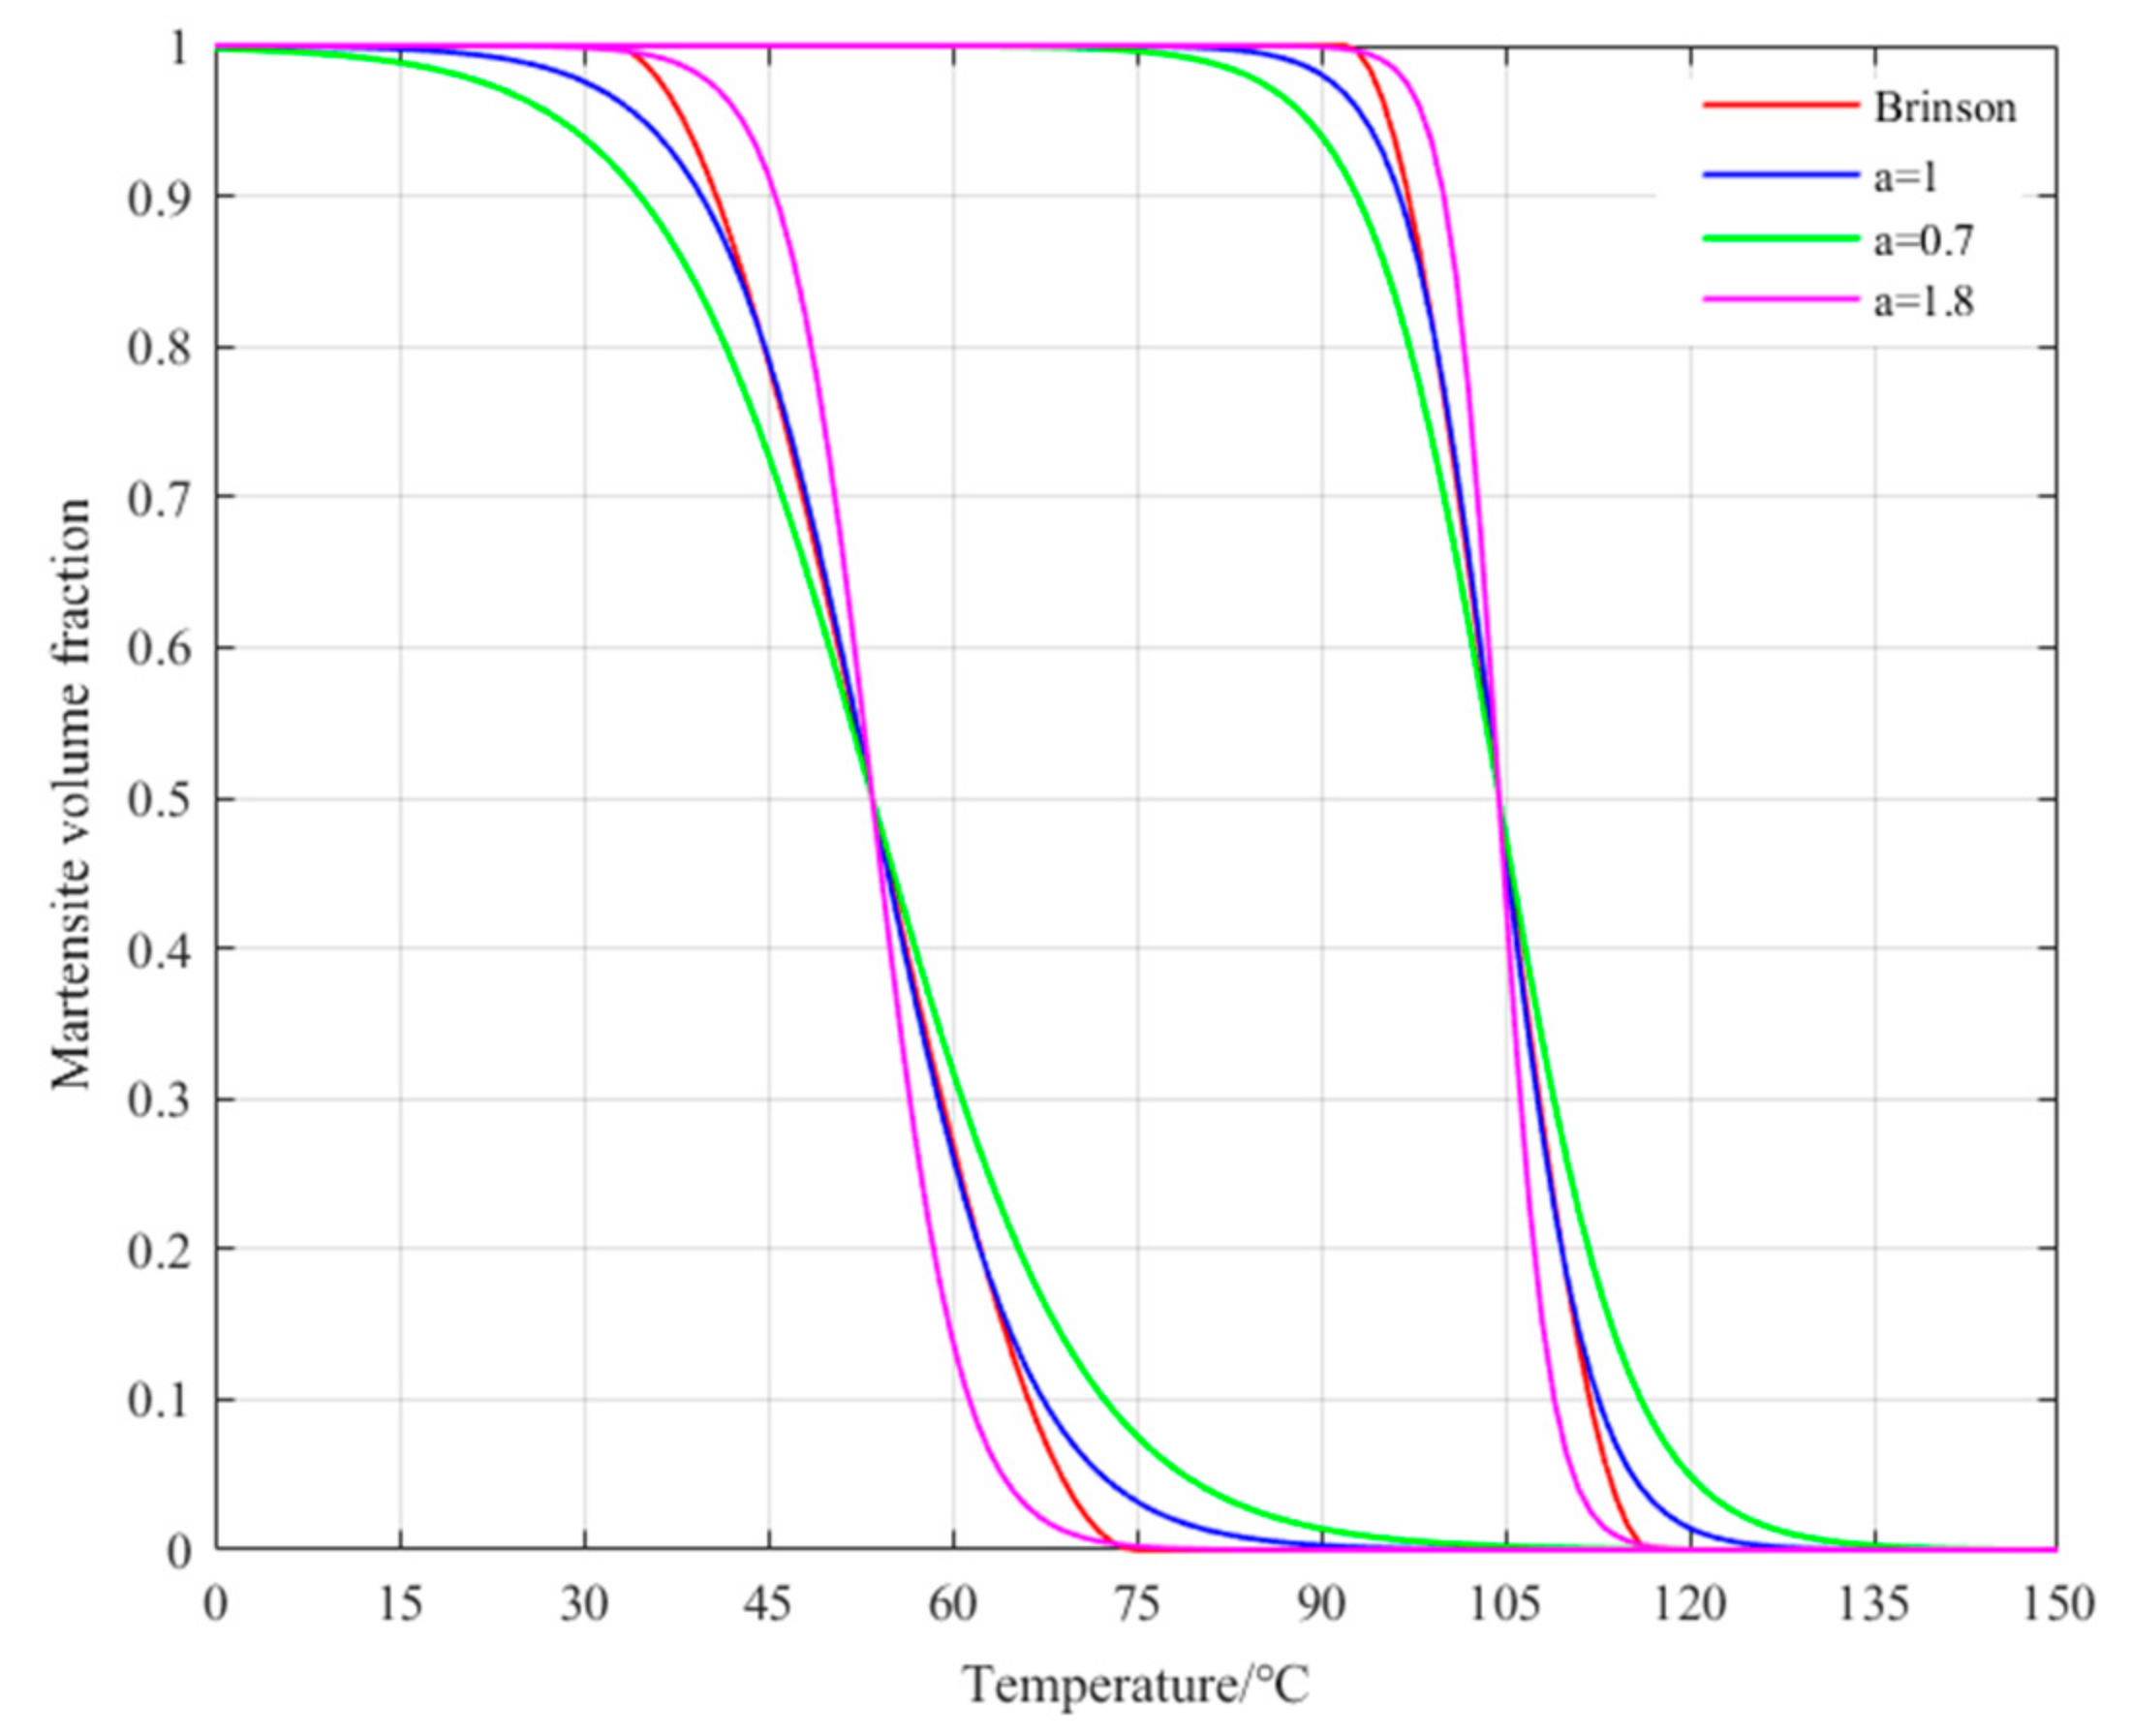
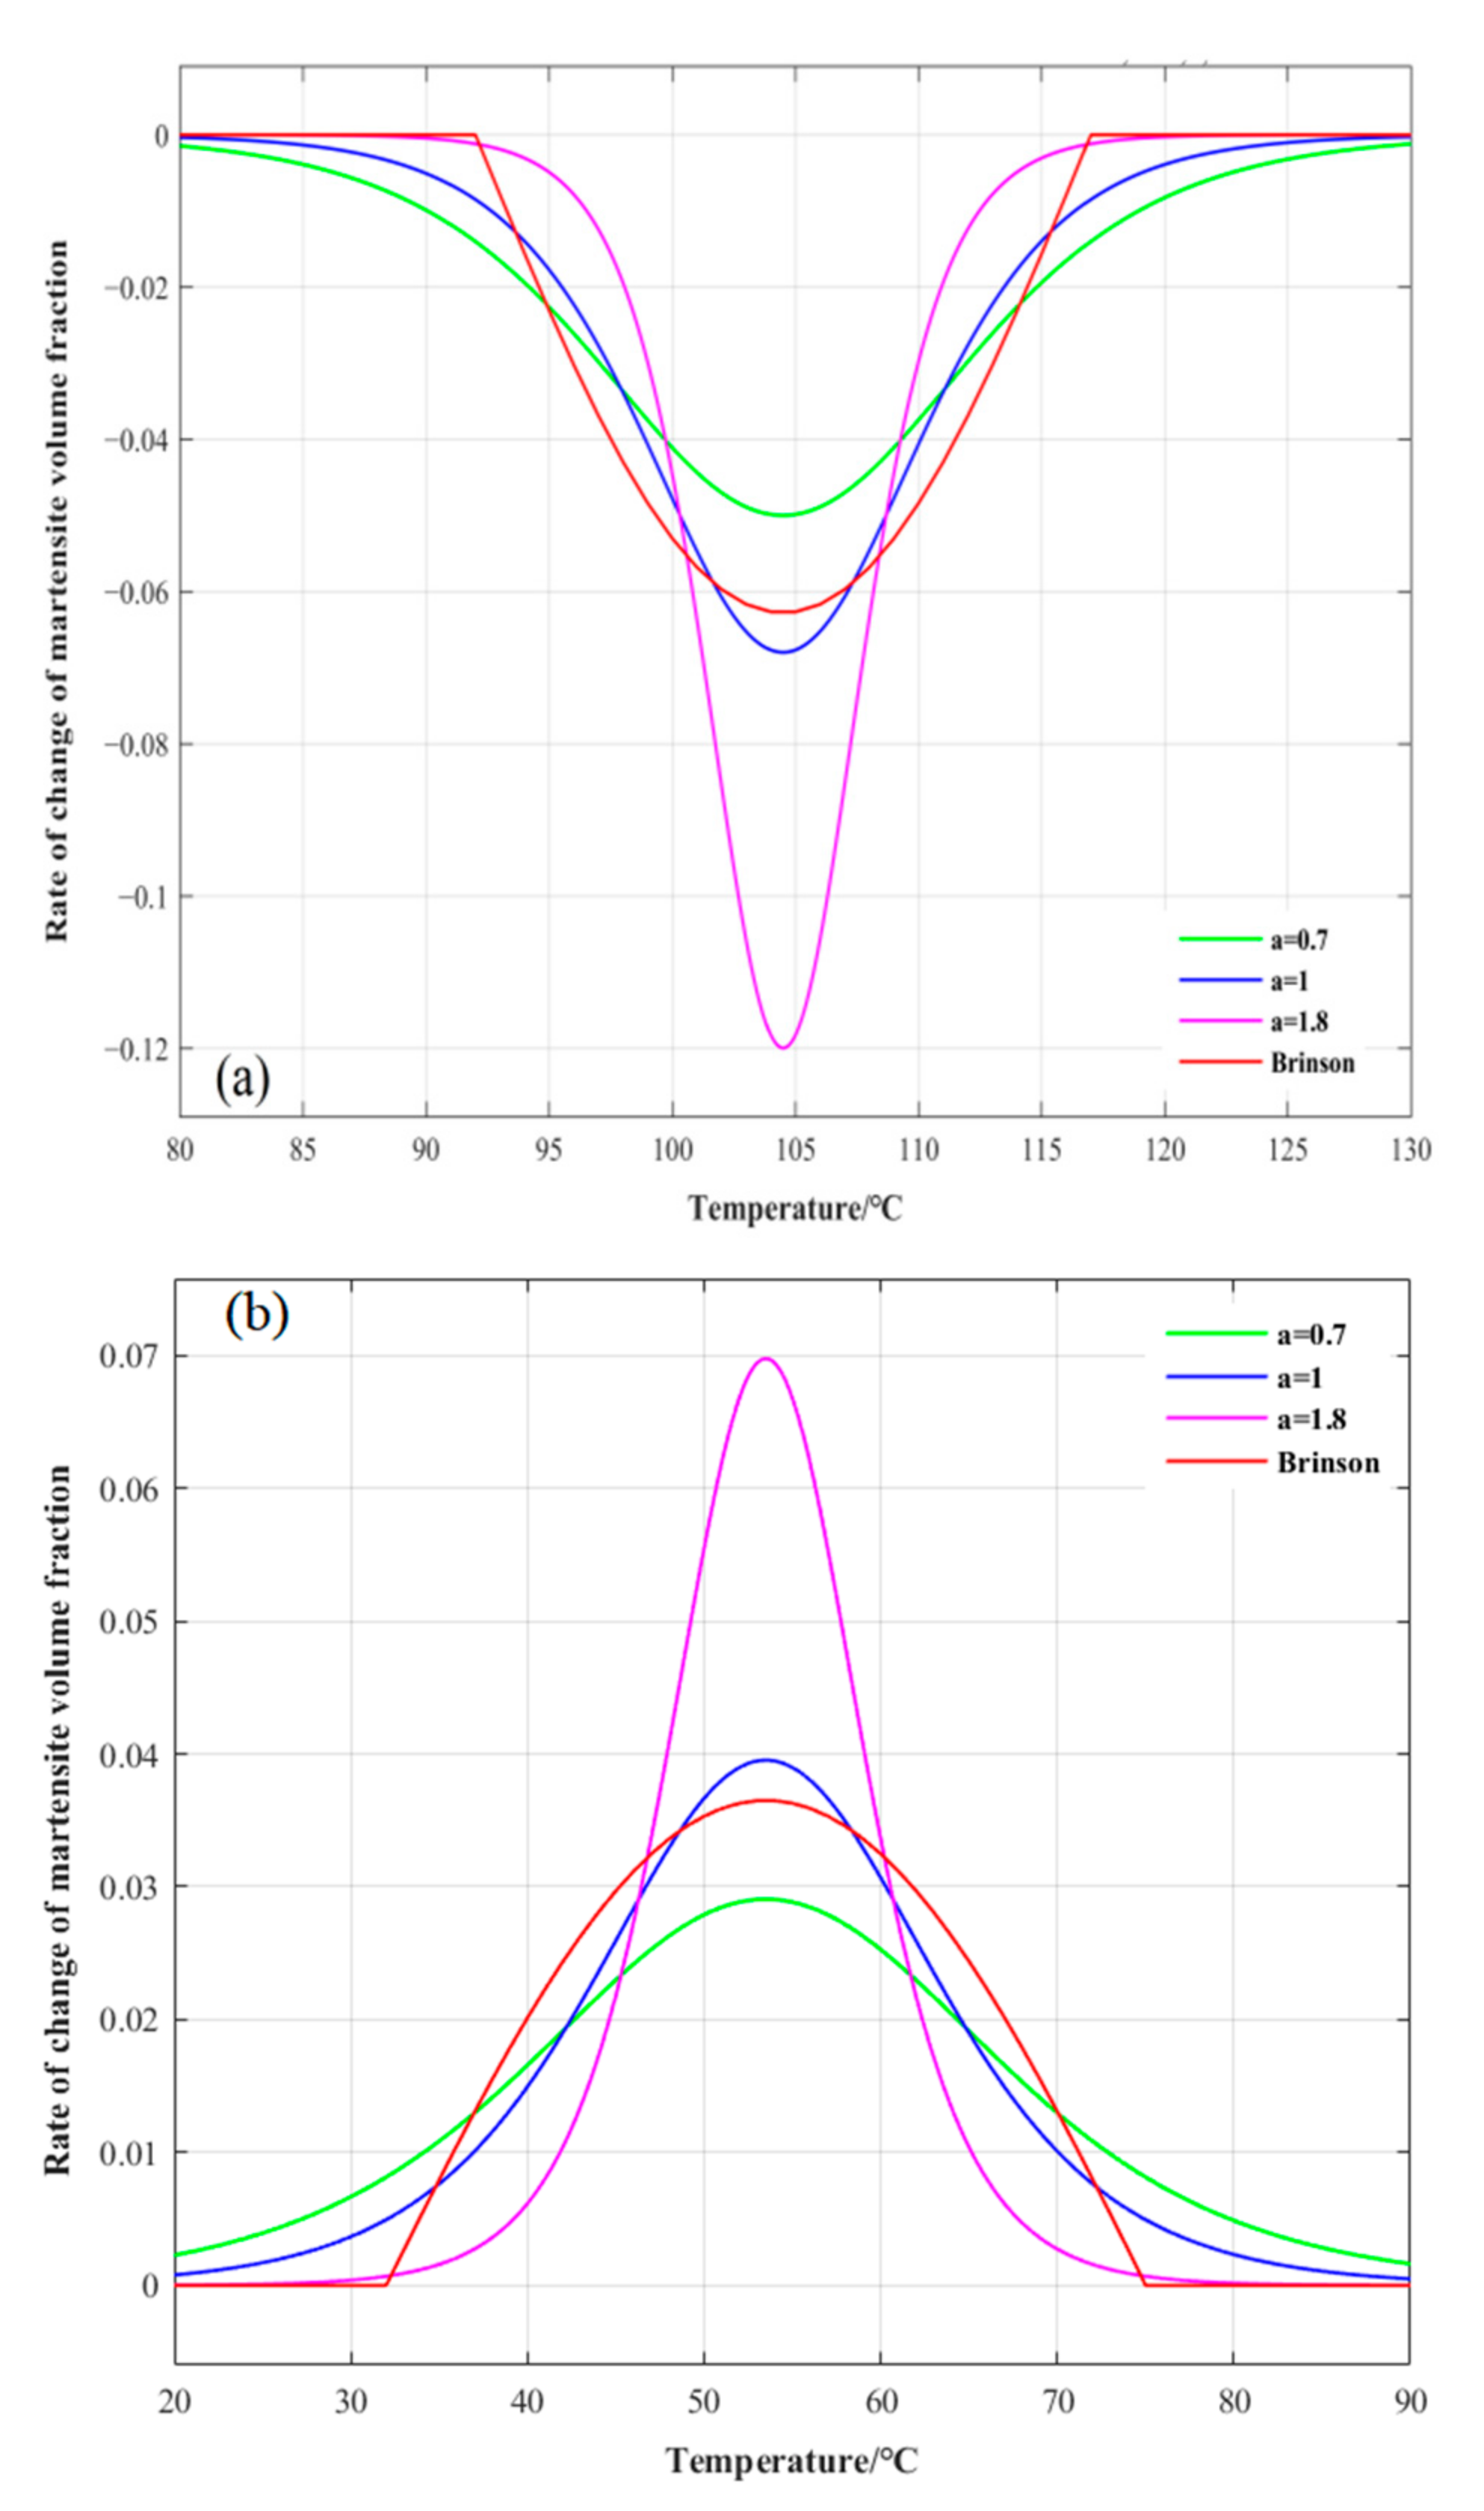
4.1. Logistic Variable Speed Phase Transition Kinetics Fitting and Analysis

Under the constant load scenario, the initial stress was assumed to be 50 MPa and the temperature cycling range was 0–150 °C. The relationship between the martensite volume fraction and the temperature was numerically fitted using the Brinson model and the logistic variable speed constitutive model, and the results are shown in Figure 2. The fitted curves show that the dynamic equation of the logistic variable-speed transformation adjusted the shape of the curve using a single coefficient, and that it could flexibly adjust the rate of change of the transformation rate. The rate of change of the martensite volume fraction at a given temperature was not unique. However, for a given material parameter in the Brinson model, the rate of change of the martensite volume fraction was unique, the phase transformation rate was constant, and the intermediate process could not be flexibly adjusted. In contrast, the thermomechanical responses in the initial and final regions of the phase transition represented by the logistic variable-speed phase transition kinetic equation were completed in a smooth and gradual manner, while the phase transition region represented by the Brinson model was relatively sharp and abrupt. When the transformation rate coefficient was a = 1, the rates of change of the martensite volume fraction fitted by the logistic variable-speed transformation kinetic equation and the Brinson model were essentially the same except for the beginning and end of the transformation. As the phase transition coefficient increased, the curve became steeper in the phase transition region, and the phase transition responded more sharply in the initial and final regions. In summary, the improved variable-speed phase transition kinetic equation based on the logistic function could flexibly adjust the intermediate process of the phase transition and had superior adaptability compared to the traditional model.
Figure 3 shows the numerical fitting results for the volume fraction rates of change for martensite and austenite with temperature cycling under a constant stress of 50 MPa. During the process of martensite forward and reverse transformation, the rate of change of the martensite volume fraction initially increased and then decreased as the temperature changed. The change was relatively gradual at the beginning and end of the phase transition, and it reached a peak in the central region of the phase transition. This was generally consistent with the trends in the rates of change of the endothermic and exothermic peaks in the heat flow-temperature curve measured by the DSC test. When the transformation rate coefficient a = 1, the logistic function basically agreed with the rate of change of the martensite volume fraction curve described by the transformation control equation in the form of a cosine function. As the phase transition rate coefficient increased, the range of the rate of change gradually increased, and the peak value that appeared increased gradually.

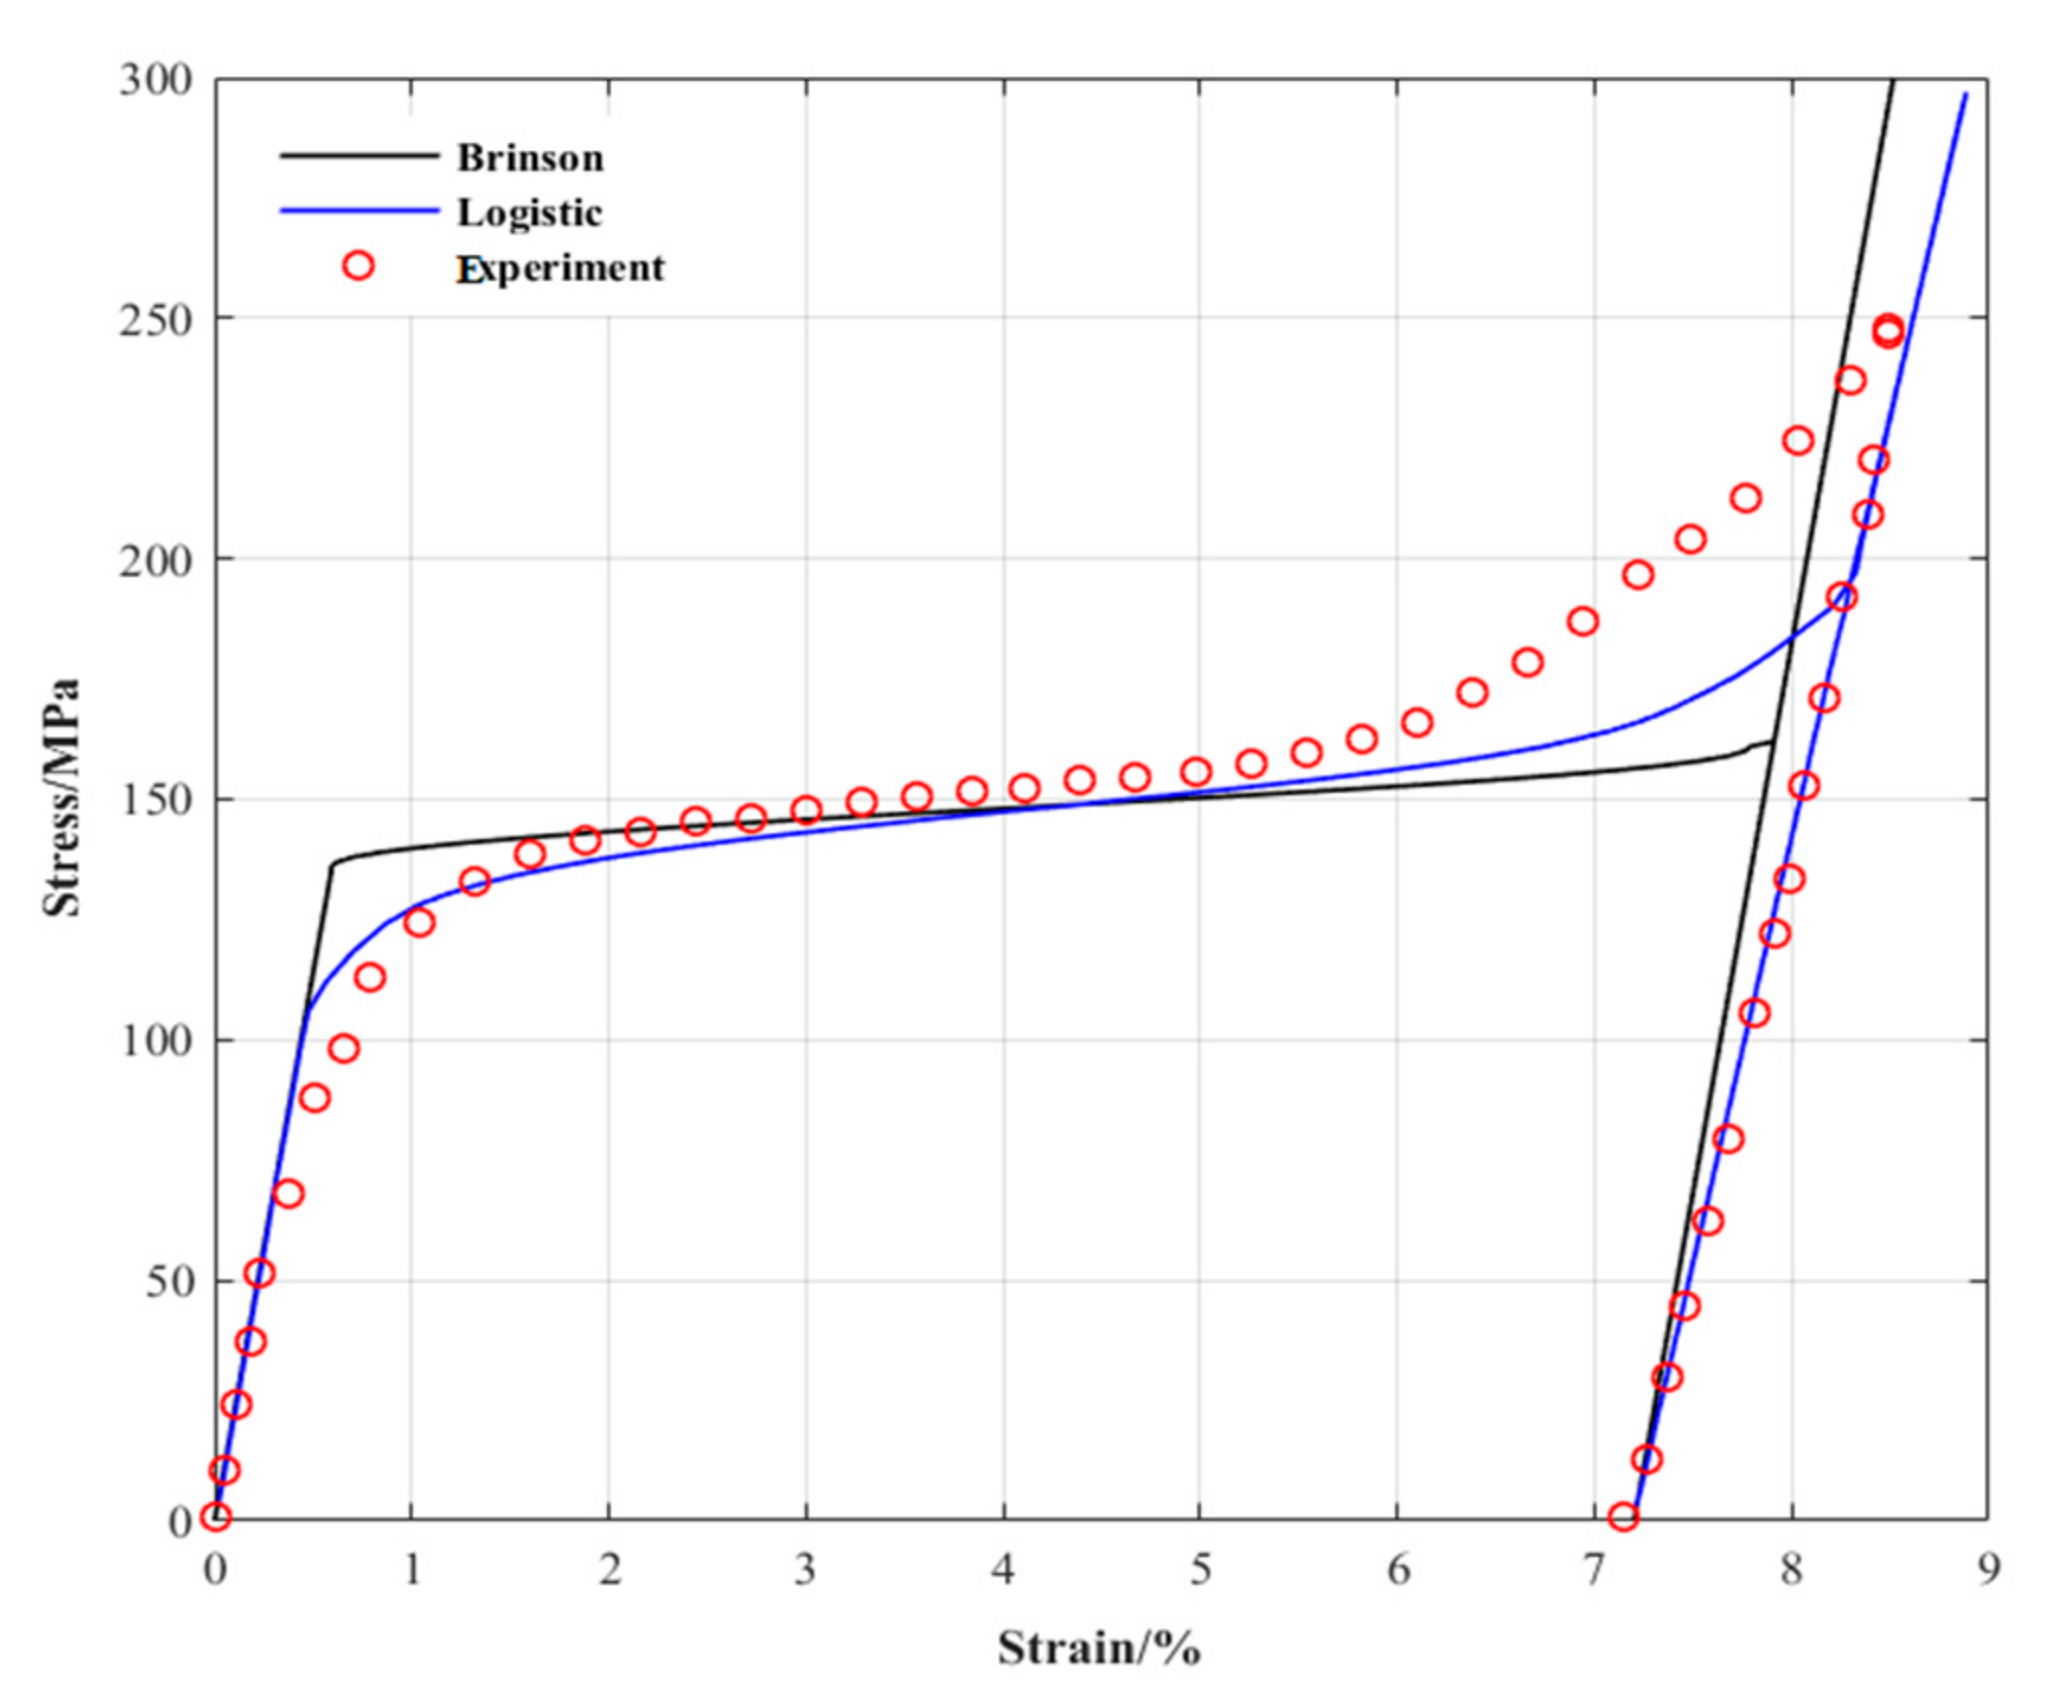
4.2. Numerical Fitting and Analysis of Phenomenological Constitutive Model

The constitutive model improved by the logistic function could completely describe the thermodynamic response characteristics of the beginning, ending, and intermediate processes of the SMA phase transition. In order to verify the accuracy and validity of the model, the SMA shape memory effect under constant load and constant temperature was numerically fitted and predicted using MATLAB, and the fitting results were compared to the Brinson model and the experimental data. The material parameters involved in the fitting are shown in Table 1. The thermomechanical performance parameters refer to the data in [25].

4.2.1. Different Load Cycles at Constant Temperature

Under different load conditions at constant low temperature, the initial crystal phase structure of the SMA was completely twinned martensite, and its initial conditions were T0 = −10 °C, σ 0 = 0 MPa, ε 0 = 0, ξ DM 0 = 0, ξ 0 = 1, and a = 0.5. When the twinned martensite was completely transformed into detwinned martensite, the end conditions were ξ DM = 1, ξ = ξ DM . Combining Equations (10) and (16), we can get the complete stress–strain relationship in the detwinning process. Figure 4 shows the numerical fitting of the stress–strain relationship of the SMA wire at constant temperature performed by the logistic variable-speed constitutive model and the Brinson model; this was also verified by the experimental data taken from the literature [25]. At constant temperature, the stress–strain relationship of the SMA under different loads presented three different response regions during the loading process. In the initial elastic region, the stress increased linearly with the strain. When the stress reached the critical stress, it entered the phase transformation plateau region; the twinned martensite began to transform into detwinned martensite, the strain increased significantly, and the stress remained stable. When the stress reached the critical stress, it entered the linear elastic region again, the twinned martensite was completely transformed into detwinned martensite, and the stress increased linearly with the strain again. During the unloading process, the martensite existed as a completely detwinned variant, and the stress decreased linearly with the strain. When the stress dropped to zero, a small part of the elastic strain recovered, and most of the transformation strain remained. When the temperature was raised again, the residual transformation strain recovered, thus realizing the shape memory effect. Figure 4 shows that the elastic moduli of the twinned martensite and detwinned martensite structures were not equal, and the fitting results of the Brinson model exhibited a certain deviation in the initial and final stages of the transformation and the unloading stage. The rate of change of the structural model at the beginning and end of the phase transition was relatively smooth and slow, and the fitted curve was more similar to the experimental data.

4.2.2. Different Temperature Cycles under a Constant Load

Under a constant load, the initial crystal phase structure of the SMA was fully twinned martensite, the temperature range was −20–200 °C, and the initial conditions were T0 = −20 °C, σ 0 = 100 MPa ( σ 0 < σ s ), ε 0 = 0, ξ DM 0 = 0, ξ 0 = 1, and a = 0.5. Combining Equations (10), (12) and (14), we can get the relationship between strain and temperature of the complete temperature cycle. Figure 5 shows the numerical fitting of the strain-temperature relationship of the SMA wire under constant stress for the logistic model and the Brinson model. The logistic model was verified by the experimental data in the literature [25]. The results show that the strain–temperature relationship of the SMA under constant load had three different response regions: the pure martensite state, pure austenite state, and mixed transformation state. The SMA strain in the non-transition region slowly decreased and increased with increasing and decreasing temperature, respectively, until it became stable. The mixed phase transition region presented a nonlinear mutation, and the mutation point was basically consistent with the four phase transition temperature characteristic points (Ms, Mf, As, and Af). The strain–temperature curves did not coincide during heating and cooling, and there was an obvious strain difference. Figure 5 shows that the strains of the three different response regions were all nonlinear with temperature, while the curves fitted by the Brinson model were all linear in the non-transition region and their transitions were too sharp at the beginning and end of the phase transition. Furthermore, they deviated by a certain amount from the test results. The fitting results of the improved phase transition model based on the logistic function were in good agreement with the experimental results. The nonlinear relationships in different regions were fitted completely, and the slow and gradual phase transition processes at the initial and final stages of the phase transition were accurately described. The small deviation between the heating fitting results and the experimental data was due to the fact that the temperature obtained from the experiment was 2 °C lower than the parameter value used in the numerical fitting.

4.3. Consideration of Marine Engineering Application

In addition to limit factors of traditional SMA actuators, there are very special aspects that need to be considered when SMA actuators are applied in deep sea extreme environment, including the conductivity of seawater, strong corrosion, low temperature, and high hydrostatic pressure.

4.3.1. Conductivity of Seawater

The biggest advantage of SMA is that it can integrate execution and sensing. Moreover, it can feedback the execution of the driver through its own resistance change. However, seawater is a multicomponent electrolyte solution, and the conductivity of different sea areas will be different due to the difference of temperature, salinity, and pressure, which will lead to a deviation of the closed-loop control method based on resistance feedback. Additionally, the conductivity of seawater will also cause the leakage of the SMA and connecting wires, which will inevitably lead to a loss of energy efficiency of the driver.

4.3.2. Strong Corrosive

Seawater is an excellent alkaline environment that can promote the formation of an electrochemical mechanism of corrosion and hydrolysis. When SMA is not energized, the stable and discontinuous adhesive passivation film formed on its surface can keep good corrosion resistance and biocompatibility of SMA. When the SMA is energized underwater, the seawater will be electrolyzed by electrical signals and hydrogen is produced. Ti based SMA are very sensitive to hydrogen, and sudden failure which is known as hydrogen embrittlement will happen. Therefore, anti-corrosion protection must be considered for deep sea SMA actuators, including soft sealing, oil-filled sealing, and insulating coating.

4.3.3. High Hydrostatic Pressure

The maximum hydrostatic pressure in an extreme deep-sea environment can reach 113 MPa, and the phase transformation strain of SMA with small diameter and compact structure is small under the hydrostatic pressure of 113 MPa. However, the damage to the porous structure caused by long-term electrolysis will gradually increase the influence of hydrostatic pressure on the SMA, which cannot be ignored.

4.3.4. Low-Temperature Environment

The thermodynamic performance of SMA is closely related to the ambient temperature. The maximum difference between the temperature of the deep seabed and the normal temperature is 10 times. The low temperature will accelerate the surface heat dissipation of SMA, which requires more driving thermal power. The thermodynamic performance parameters in the air can no longer be applied to the underwater environment. Therefore, the driving thermodynamic properties of SMA in deep-sea applications need to be further explored.

5. Conclusions

The traditional phenomenological model used to describe SMAs has the common drawbacks of abrupt transitions at the beginning and ending of the phase transition and an invariable speed in the phase transition process. The traditional phase transition models with constant phase transition speed, such as cosine functions, linear functions, and exponential functions, are suitable for single crystal SMAs, while polycrystalline SMAs require a more flexible variable speed phase transition function. The improved logistic function developed in this study is an excellent substitute for the traditional phase transition function.
The phenomenological variable-speed constitutive model expanded the thermodynamic constitutive equation through the decomposition of the phase transition strain, replaced the traditional phase transition function with an improved logistic nonlinear function, and increased the phase transition rate coefficient to systematically describe the variability of the intermediate phase transition process. Compared to the traditional model, this model has more advantages and better flexibility, and is more consistent with actual test results. Through an analysis of the fitting performance in multiple scenarios, it was found that the dynamic model of the variable-speed phase transition improved by the logistic function could adjust the shape of the curve through a single coefficient, and it could also perform simple and efficient fitting and prediction of the SMA shape memory effect with fewer parameters. Additionally, it accurately modeled the gradual changes in the initial and final regions of the phase transition and had the ability to flexibly adjust the rate of change of the phase transition rate. These results can be used to lay a theoretical foundation for the design of SMA deep-sea actuators used in marine engineering applications.

Author Contributions

Conceptualization, J.G., B.P. and W.C.; methodology, J.G.; validation, J.G., B.P., W.C. and S.H.; formal analysis, J.G. and B.P.; writing—original draft preparation, J.G.; writing—review and editing, J.G., B.P. and W.C.; project administration, S.H. All authors have read and agreed to the published version of the manuscript.

Funding

This research was funded by the Science and Technology Research Project of Social Development of Shanghai Science and Technology Commission, grant number 21DZ1205503.

Institutional Review Board Statement

Not applicable.

Informed Consent Statement

Not applicable.

Data Availability Statement

Not applicable.

Conflicts of Interest

The authors declare no conflict of interest.

References

  1. Li, C. The potential and challenges of China’s marine science and technology development. People’s Forum Acad. Front. 2017, 18, 37–43. [Google Scholar]
  2. Li, J.; Liu, F.; Ma, W. Development status of intelligent equipment industry for marine unmanned systems at home and abroad. Ship Eng. 2020, 42, 25–31. [Google Scholar]
  3. Guo, J.; Pan, B.; Cui, W.; Hu, S.; Han, Z. Review of deep-sea actuators and marine bionic robots based on intelligent materials. Ship Mech. 2022, 26, 13. [Google Scholar]
  4. Bai, Z. Summary of research progress and application of smart materials. Mil. Civ. Dual-Use Technol. Prod. 2020, 3, 15–20. [Google Scholar]
  5. Guo, K.; Xia, P. Research progress of smart composite materials. Funct. Mater. 2019, 50, 4017–4022, 4029. [Google Scholar]
  6. Hao, L. Research on Mechanical Properties of Shape Memory Alloy Bulge. Ph.D. Thesis, Nanjing University of Aeronautics and Astronautics, Nanjing, China, 2018. [Google Scholar]
  7. Moumni, Z.; Zaki, W.; Nguyen, Q.S. Theoretical and Numerical Modeling of Solid–Solid Phase Change: Application to the Description of the Thermomechanical Behavior of Shape Memory Alloys. Int. J. Plast. 2008, 24, 614–645. [Google Scholar] [CrossRef]
  8. Yang, J.; Huang, B.; Gu, X.; Wang, J.; Zhang, Y.; Zhu, J.; Zhang, W. Review of Mechanical Behavior and Application of Shape Memory Alloys. J. Solid Mech. 2021, 42, 345–375. [Google Scholar]
  9. Liu, K. Design and Control Technology of Underwater Vector Deflection Actuator Based on Ni-Ti Shape Memory Alloy. Master’s Thesis, South China University of Technology, Guangzhou, China, 2020. [Google Scholar]
  10. Cisse, C.; Zaki, W.; Zineb, T.B. A review of constitutive models and modeling techniques for shape memory alloys. Int. J. Plast. 2016, 76, 244–284. [Google Scholar] [CrossRef]
  11. Lagoudas, D.; Hartl, D.; Chemisky, Y.; Machado, L.; Popov, P. Constitutive model for the numerical analysis of phase transformation in polycrystalline shape memory alloys. Int. J. Plast. 2012, 32–33, 155–183. [Google Scholar] [CrossRef]
  12. He, J.; Toi, Y. Improved constitutive modeling for phase transformation of shape memory alloys. J. Solid Mech. Mater. Eng. 2013, 7, 11–26. [Google Scholar] [CrossRef] [Green Version]
  13. Lagoudas, D.C.; Entchev, P.B.; Popov, P.; Patoor, E.; Catherine Brinson, L.; Gao, X. Shape memory alloys, Part II: Modeling of polycrystals. Mech. Mater. 2006, 38, 430–462. [Google Scholar] [CrossRef]
  14. Kucharavy, D.; Guio, R.D. Application of S-shaped curves. Procedia Eng. 2011, 9, 559–572. [Google Scholar] [CrossRef] [Green Version]
  15. Guan, J.H.; Pei, Y.C.; Wu, J.T. A driving strategy of shape memory alloy wires with electric resistance modeled by logistic function for power consumption reduction. Mech. Syst. Signal Process. 2021, 160, 107839. [Google Scholar] [CrossRef]
  16. Ding, Y. Research on the Multidimensional Constitutive Relation of Shape Memory Alloys. Master’s Thesis, Xi’an University of Architecture and Technology, Xi’an, China, 2005. [Google Scholar]
  17. Johari, G.P.; McAnanama, J.G.; Sartor, G. Effect of hydrostatic pressure on the thermoelastic transformation of Ni-Ti alloy and the entropy of transformation. Philos. Mag. B 1996, 74, 243–257. [Google Scholar] [CrossRef]
  18. Wan, J.L.; Chen, Z.B.; Qin, S.J.; Shang, J. Effect of hydrostatic pressure on thermally induced phase transformation in NiTi alloy: A molecular dynamics study. Comput. Mater. Sci. 2018, 153, 119–125. [Google Scholar] [CrossRef]
  19. Ikuta, K.; Tsukamoto, M.; Hirose, S. Mathematical model and experimental verification of shape memory alloy for designing micro actuator. In Proceedings of the IEEE Micro Electro Mechanical Systems, Nara, Japan, 30–2 January 1991; pp. 103–108. [Google Scholar]
  20. Liu, B. Study on the Phase Transformation Mechanism and Mechanical Properties of Porous Shape Memory Alloys. Ph.D. Thesis, Beijing Jiaotong University, Beijing, China, 2013. [Google Scholar]
  21. Zhu, X.; Dui, G. Modeling of superelastic–plastic behavior of porous shape memory alloys incorporating void shape effects. Acta Mech. Solida Sin. 2021, 34, 632–644. [Google Scholar] [CrossRef]
  22. Sumoto, H.; Yamaguchi, S. A study on a control meth- od of artificial muscle using segmented binary control for an up-scaled fish type robot. In Proceedings of the 21st International Offshore and Polar Engineering Conference, Maui, HI, USA, 19–24 June 2011; pp. 223–229. [Google Scholar]
  23. Angilella, A.J.; Gandhi, F.S.; Miller, T.F. Design and testing of a shape memory alloy buoyancy engine for unmanned underwater vehicles. Smart Mater. Struct. 2015, 24, 115018. [Google Scholar] [CrossRef]
  24. Hartl, D.J.; Lagoudas, D.C. Thermomechanical Characterization of Shape Memory Alloy Materials. In Shape Memory Alloys: Modeling and Engineering Applications; Springer: Boston, MA, USA, 2008. [Google Scholar]
  25. Li, J.; Yang, Z. Numerical analysis and modification of thermodynamic empirical constitutive model for shape memory alloys. Mater. Rev. 2021, 35, 18116–18123. [Google Scholar]
  26. Kudryashov, N.A. Logistic function as solution of many nonlinear differential equations. Appl. Math. Model. 2015, 39, 5733–5742. [Google Scholar] [CrossRef]
Figure 1. Typical (a) logistic function for the cumulative martensite volume fraction and (b) bell curves for the rate of change martensite volume fraction.
Jmse 10 01951 g001
Figure 2. Relationship between the martensite volume fraction and the temperature for different transformation rate coefficients.
Jmse 10 01951 g002
Figure 3. Relationship between the rate of change of the martensite volume fraction and the temperature for different transformation rate coefficients: (a) reverse martensitic transformation, (b) martensitic transformation.
Jmse 10 01951 g003
Figure 4. Comparison between the simulation and experimental results of the stress-strain relationship at −10 °C.
Jmse 10 01951 g004
Figure 5. Comparison between the simulation and experimental results of the relationship between strain and temperature at 100 MPa.
Jmse 10 01951 g005
Table 1. The transformation temperatures and thermomechanical properties of SMA.
Phase Transition TemperatureThermal CoefficientElastic ModulusPhase Transition ParametersMaximum Residual Strain
Mf = 22 °C α = 1 × 10⁻⁵ °C−1DTM = 22,800 MPaCM = 5 MPa/°C ε L = 0.072
Ms = 65 °Cb = 6.8DDM = 17,600 MPaCA = 5 MPa/°C
As = 82 °C DA = 42,800 MPa σ s = 136 MPa
Af = 107 °C σ f = 161 MPa
Publisher’s Note: MDPI stays neutral with regard to jurisdictional claims in published maps and institutional affiliations.

