Next Article in Journal
Sea Level Fluctuations
Previous Article in Journal
Underwater Sound Characteristics of a Ship with Controllable Pitch Propeller
 
 
jmse-logo
Article Menu

Article Menu

Article

The Hellenic Marine Observing, Forecasting and Technology System—An Integrated Infrastructure for Marine Research

by
Evi Bourma
1,*,
Leonidas Perivoliotis
1,
George Petihakis
2,
Gerasimos Korres
1,
Constantin Frangoulis
2,
Dionysios Ballas
1,
Vassilis Zervakis
3,
Elina Tragou
3,
Petros Katsafados
4,
Christos Spyrou
4,
Manos Dassenakis
5,
Serafim Poulos
6,
Persefoni Megalofonou
7,
Sarantis Sofianos
8,
Theodora Paramana
5,
Georgios Katsaounis
9,
Aikaterini Karditsa
6,10,
Stelios Petrakis
6,
Apostolia-Maria Mavropoulou
8,
Vasiliki Paraskevopoulou
5,
Niki Milatou
7,
Paris Pagonis
1,
Spyros Velanas
1,
Manolis Ntoumas
2,
Ioannis Mamoutos
1,
Manos Pettas
2,
Sylvia Christodoulaki
2,
Dimitris Kassis
1,
Maria Sotiropoulou
1,
Aspasia Mavroudi
1,
Antigoni Moira
1,
Dimitra Denaxa
1,
Gerasimi Anastasopoulou
1,
Emmanuel Potiris
3,
Vassilis Kolovogiannis
3,
Agisilaos-Alexandros Dimitrakopoulos
3,
Stamatios Petalas
3 and
Nikos Zissis
1
add Show full author list remove Hide full author list
1
Institute of Oceanography, Hellenic Centre for Marine Research, GR-19013 Anavyssos, Greece
2
Institute of Oceanography, Hellenic Centre for Marine Research, GR-71003 Heraklion, Greece
3
Department of Marine Sciences, University of the Aegean, GR-81100 Mytilene, Greece
4
Department of Geography, Harokopio University of Athens, GR-17676 Kallithea, Greece
5
Laboratory of Environmental Chemistry, Faculty of Chemistry, National and Kapodistrian University of Athens, GR-15784 Athens, Greece
6
Laboratory of Physical Geography, Faculty of Geology & Geoenvironment, National and Kapodistrian University of Athens, GR-15784 Athens, Greece
7
Section of Zoology-Marine Biology, Faculty of Biology, National and Kapodistrian University of Athens, GR-15784 Athens, Greece
8
Section of Environmental Physics and Meteorology, Department of Physics, National and Kapodistrian University of Athens, GR-15784 Athens, Greece
9
Laboratory of Ship and Marine Hydrodynamics, National Technical University of Athens, GR-15773 Athens, Greece
10
Department of Port Management and Shipping, National and Kapodistrian University of Athens, Evripos Campus, GR-34400 Evia, Greece
*
Author to whom correspondence should be addressed.
J. Mar. Sci. Eng. 2022, 10(3), 329; https://doi.org/10.3390/jmse10030329
Submission received: 19 December 2021 / Revised: 26 January 2022 / Accepted: 10 February 2022 / Published: 25 February 2022
(This article belongs to the Special Issue Frontiers in Coastal Observing Systems)

Abstract

:
Research infrastructures have been established throughout Europe in order to create robust organizations that will facilitate and enhance research and innovation processes and will advance society with innovative products and services. The Hellenic Integrated Marine Observing, Forecasting and Technology System (component of HIMIOFoTS RI) has been implemented in the framework of the National Roadmap for Research Infrastructures to form a large-scale infrastructure for the marine environment in Greece. It links together ocean observing and forecasting systems, coastal zone monitoring and management practices, as well as ocean engineering testing facilities. The overarching framework of the system supports the coordination of five organizations with expertise in the field of marine science and technology, the central management of research activities, and the common development of services and products. It comprises facilities and resources while it provides open access to research communities (academia, industry) to support the scientific advancements and innovation in their fields. The Hellenic Marine Observing, Forecasting and Technology System was further enhanced during its implementation through significant upgrades and developments in order to extend its observing capacity and the forecasting and technological abilities, while advancing the provided services and products.

1. Introduction

The Hellenic Marine Observing, Forecasting and Technology System is an integrated research infrastructure for the marine environment. It is one of the two distinct components of the National Research Infrastructure for the water resources in Greece, HIMIOFoTS (Hellenic Integrated Marine Inland water Observing, Forecasting and offshore Technology System). The HIMIOFoTS was developed by a wide research community of 14 bodies (universities and research institutions), led by the Hellenic Centre for Marine Research, and is dedicated to the scientific research and management both of the inland waters and the marine environment. The vision of the national research infrastructure is to establish coordination and to build synergies between the work of institutes and laboratories on the marine environment and inland waters in Greece and provide integrated services and products to both the scientific community and society. The present work focuses on the marine component of HIMIOFoTS, which is consolidating five different entities specialized in various fields of marine science and technology—observing and forecasting systems, coastal zone management and offshore technology—to a centralized marine research infrastructure.
The Hellenic marine research infrastructure was developed following the overarching concept of bringing together various research organizations, with expertise in different domains of marine science, under the umbrella of the national research infrastructure HIMIOFoTS, thus attaining the coordination and central management of their actions aimed at promoting and enhancing marine research in Greece. Each of the individual components that have joined forces are mature scientific organizations with long and well-recognized work and advancements in their fields. The Hellenic Centre for Marine Research is contributing with the POSEIDON System, the Harokopio University of Athens by implementing the Weather Forecast System, the University of the Aegean with the “Dardanos” observing system, the University of Athens with a monitoring system for coastal zone management and the National Technical University of Athens with a land-based facility for testing and marine engineering. During the implementation of the first phase of the national research infrastructure, all these systems were put under joint coordination and at the same time were upgraded and enhanced in order to improve their recording capacity, forecasting, and technological abilities.
The present work is structured following four parts: A short presentation of the national research infrastructure HIMIOFoTS, the description of the Hellenic Marine Observing, Forecasting and Technology System and the upgrades made during its implementation, and finally the roadmap for its future development.

2. HIMIOFoTS, a Large-Scale Integrated Research Infrastructure for the Management of the National Water Resources

The Hellenic Integrated Marine Inland water Observing, Forecasting and offshore Technology System is a large-scale national research infrastructure that includes two distinct components for the management of water resources in Greece: the marine and the surface waters. The integrated research infrastructure of HIMIOFoTS supports the continuous monitoring of the water environment together with the production of forecasting products for the marine environment through well-established hydrodynamic, wave and ecosystem numerical models using state-of-the-art techniques for the assimilation of data collected from satellite and in situ observations. Open access is provided to the data from the marine and surface water monitoring networks as well as to the related forecasting products. Moreover, the HIMIOFoTS infrastructure promotes the development of added value products and integrated services for the scientific community and society, based on the needs of multidisciplinary stakeholders. These products and services can constitute valuable tools for policy makers involved in the management of the national water resources, a crucial issue for the future of the marine and inland water environments. Targeted tools can also provide guidance and support to competent authorities in order to combat risks and hazards in the marine environment, thus preventing or mitigating natural disasters. Furthermore, access to the nodes of the interdisciplinary infrastructure gives the opportunity for research and academic institutions to design and implement their own related research activities.
The two distinct HIMIOFoTS components are the marine and the surface water, namely the Hellenic Integrated Marine Observing and Forecasting System (HIMOFS) which supports ocean research, monitoring and forecasting for the Greek seas and the coastal environment, and the Open Hydrosystem Information Network (Openhi.net) for the collection, management, and dissemination of inland hydro-environmental information. In the present paper, the marine component is presented.
The National Roadmap for Research Infrastructures (2014–2020) (RIs3) was designed and implemented by the General Secretariat for Research and Technology (GSRT) in the framework of the ESFRI roadmaps (European Strategy Forum on RIs). The roadmap describes the national strategic framework for research and innovation in Greece, along with the national strategy for research infrastructures, highlighting the country’s priorities for long-term investment in large-scale research infrastructures. The clear and momentous role of research infrastructures are declared to have a pivotal role in the advancement of scientific and technological knowledge forming “building blocks of innovation”, whereas their contribution to the European Research Area is vital [1].
The HIMIOFoTS RI is building upon the capitalization of its partners’ expertise but also using gained know-how by long-term running of operational systems such as the PO-SEIDON operational oceanography system (https://poseidon.hcmr.gr, accessed on 18 December 2021). POSEIDON has established extensive collaboration through EU projects and initiatives with relevant marine infrastructures in other European countries such as MOOSE (France), SOCIB (Spain), RITMARE (Italy) and COSYNA (Germany), acquiring scientific knowledge and experience in the management of research infrastructures. Promoting collaboration and synergies are the major driving forces behind the establishment of every RI, while in most cases products and services are open and free. Moreover, related RIs both at national and inter-national scale actively seek collaboration in all possible fields (data, equipment, management) as evidenced by a number of initiatives (ENVRI, BEERI) and projects (ENVRI-FAIR). The HIMIOFoTS RI is already linked to the ESFRI-EU facilities of EMSO and Euro-Argo with the relevant Greek nodes (Hellenic EMSO, Greek Argo), and the I3 facilities of JERICO and FixO3 through the POSEIDON system, while it is also connected with the Copernicus Marine Service and the European Data Banks such as the EMODnet and SeaDataNet. However, the European picture in terms of NRIs in the marine and surface water domain is characterized by a high degree of fragmentation with many actors operating in each country, each of them with overlapping activities and mandates, creating a rather confusing and inefficient landscape. Despite the efforts towards organization and integration through initiatives such as EuroGOOS, I3 projects (JERICO, FixO3), and the establishment of EU RIs, there is significant ground still to be covered at the national level in all EU Member States.
Since the HIMIOFoTS RI is going to merge two different sectors of the water re-sources domain under a common coordination, it will be developed as a system of systems, and a number of international RIs such as IMOS (https://imos.org.au/, accessed on 18 December 2021), IOOS (https://ioos.noaa.gov/, accessed on 18 December 2021) and ONC (https://www.oceannetworks.ca/, accessed on 18 December 2021) can act as reference role models. The HIMIOFoTS RI can effectively support sustained observations of the marine environment coordinating a continuous and long-term system of observations in the Greek Seas. Thus, it can have a significant contribution to the protection of the marine environment in regard to climate change and biodiversity, implementing EU policies and their specific requirements such as Horizon Europe, WFD (Water Framework Directive), MSFD (Marine Strategy Framework Directive) and ICZM (Integrated Coastal Zone Management system).

3. The Hellenic Marine Observing, Forecasting and Offshore Technology System

Open Ocean Observing and Forecasting Systems came as an answer to the scientific demands of the 21st century to further understand and explore ocean processes using a holistic approach of data collection, analysis, and reliable predictions. Such systems can effectively contribute to the protection of the marine environment, the mitigation of the risks due to the increasing pressure on the coastal zones and the intensive human activities to exploit marine resources. Operational oceanographic systems comprise multi-platform observation networks, data management, data assimilative forecasting and dissemination/accessibility systems. These four entities are interdependent, ensuring the communication and interchange between them, providing the mechanism through which a clear picture of ocean conditions, in the past, present, and future, can be captured [2]. The Marine Forecasting and Information System for the Greek Seas was established with the foundation of the POSEIDON system during the first implementation phase in 1997–2000 [3], which became the first operational oceanography system that was fully implemented in the Mediterranean Sea. Being in operation for over two decades and through continuous upgrades, the POSEIDON system has been established as a research operational system for the Eastern Mediterranean basin and evolved through the years adjusting to the leading trends of marine science and technology, in accordance with the policy frameworks suggested by IOC/GOOS, EuroGOOS, MonGOOS and GEO.
In 2017, the implementation of the first phase of the national scale research infrastructure HIMIOFoTS for the management of the Greek national water resources was launched. In this framework, the synergies were built and the coordination of five marine entities established with the overarching objective to form the Hellenic marine research infrastructure, namely the Hellenic Marine Observing, Forecasting and Technology System.
The Hellenic Marine Observing, Forecasting and Technology System links together ocean observing and forecasting systems, coastal zone monitoring and management practices as well as ocean engineering testing facilities. The observing system enfolds different observing platforms, providing atmospheric and oceanographic data in near real time. The forecasting system combines numerical models to produce short-term forecasts for atmospheric, wave and hydrodynamic conditions of the marine environment, using state-of-the-art techniques for the assimilation of data collected from satellite and in situ observations. The research infrastructure embraces the coastal zone monitoring system as well, and a land-based facility for metrology, testing and marine engineering. During the implementation of the marine research infrastructure several actions were performed towards the coordination and the integration of all these systems under the same umbrella, as well as the strengthening and extension of their observing capacity, forecasting and technological abilities. A conceptual representation of the system and its links to the end users, European infrastructures and initiatives is presented in Figure 1.
Five research and academic institutions are the pillars of the marine component, which links ocean observing and forecasting systems, coastal zone monitoring and management practices as well as ocean engineering testing facilities.
  • The Hellenic Centre for Marine Research (HCMR) provides the observing platforms and the forecasting systems of the POSEIDON system, the operational monitoring, forecasting and information system for the Greek Seas;
  • The University of the Aegean provides the HF radar installed in Lemnos Island to monitor the Black Sea water outflow in the Aegean;
  • The Harokopio University of Athens upgraded the weather forecasting system;
  • The National and Kapodistrian University of Athens contributes with the infrastructure for coastal zone monitoring and management;
  • The National Technical University of Athens supports testing and ocean engineering through a land-based facility.

3.1. The Observing System

The observing system incorporates an effective network of various operational platforms for the sustained observation of the marine environment. The Institute of Oceanography of HCMR and the University of Aegean have brought together the multi-node POSEIDON observing network and the Coastal Surface Circulation Monitoring System “Dardanos’’ to form the integrated observing system of the Hellenic marine research infrastructure. In addition to the coordination of the existing observing systems, several actions and upgrades were performed in order to enhance their recording capabilities and provide a robust monitoring network for the Greek Seas. The fixed stations’ network was upgraded with new sensors and materials required for its maintenance and operational support. Six Argo floats, one underwater glider, and a ferry box system were purchased and integrated into the system, while the “Dardanos” system was also improved with several upgrades.

3.1.1. The POSEIDON Observing Network

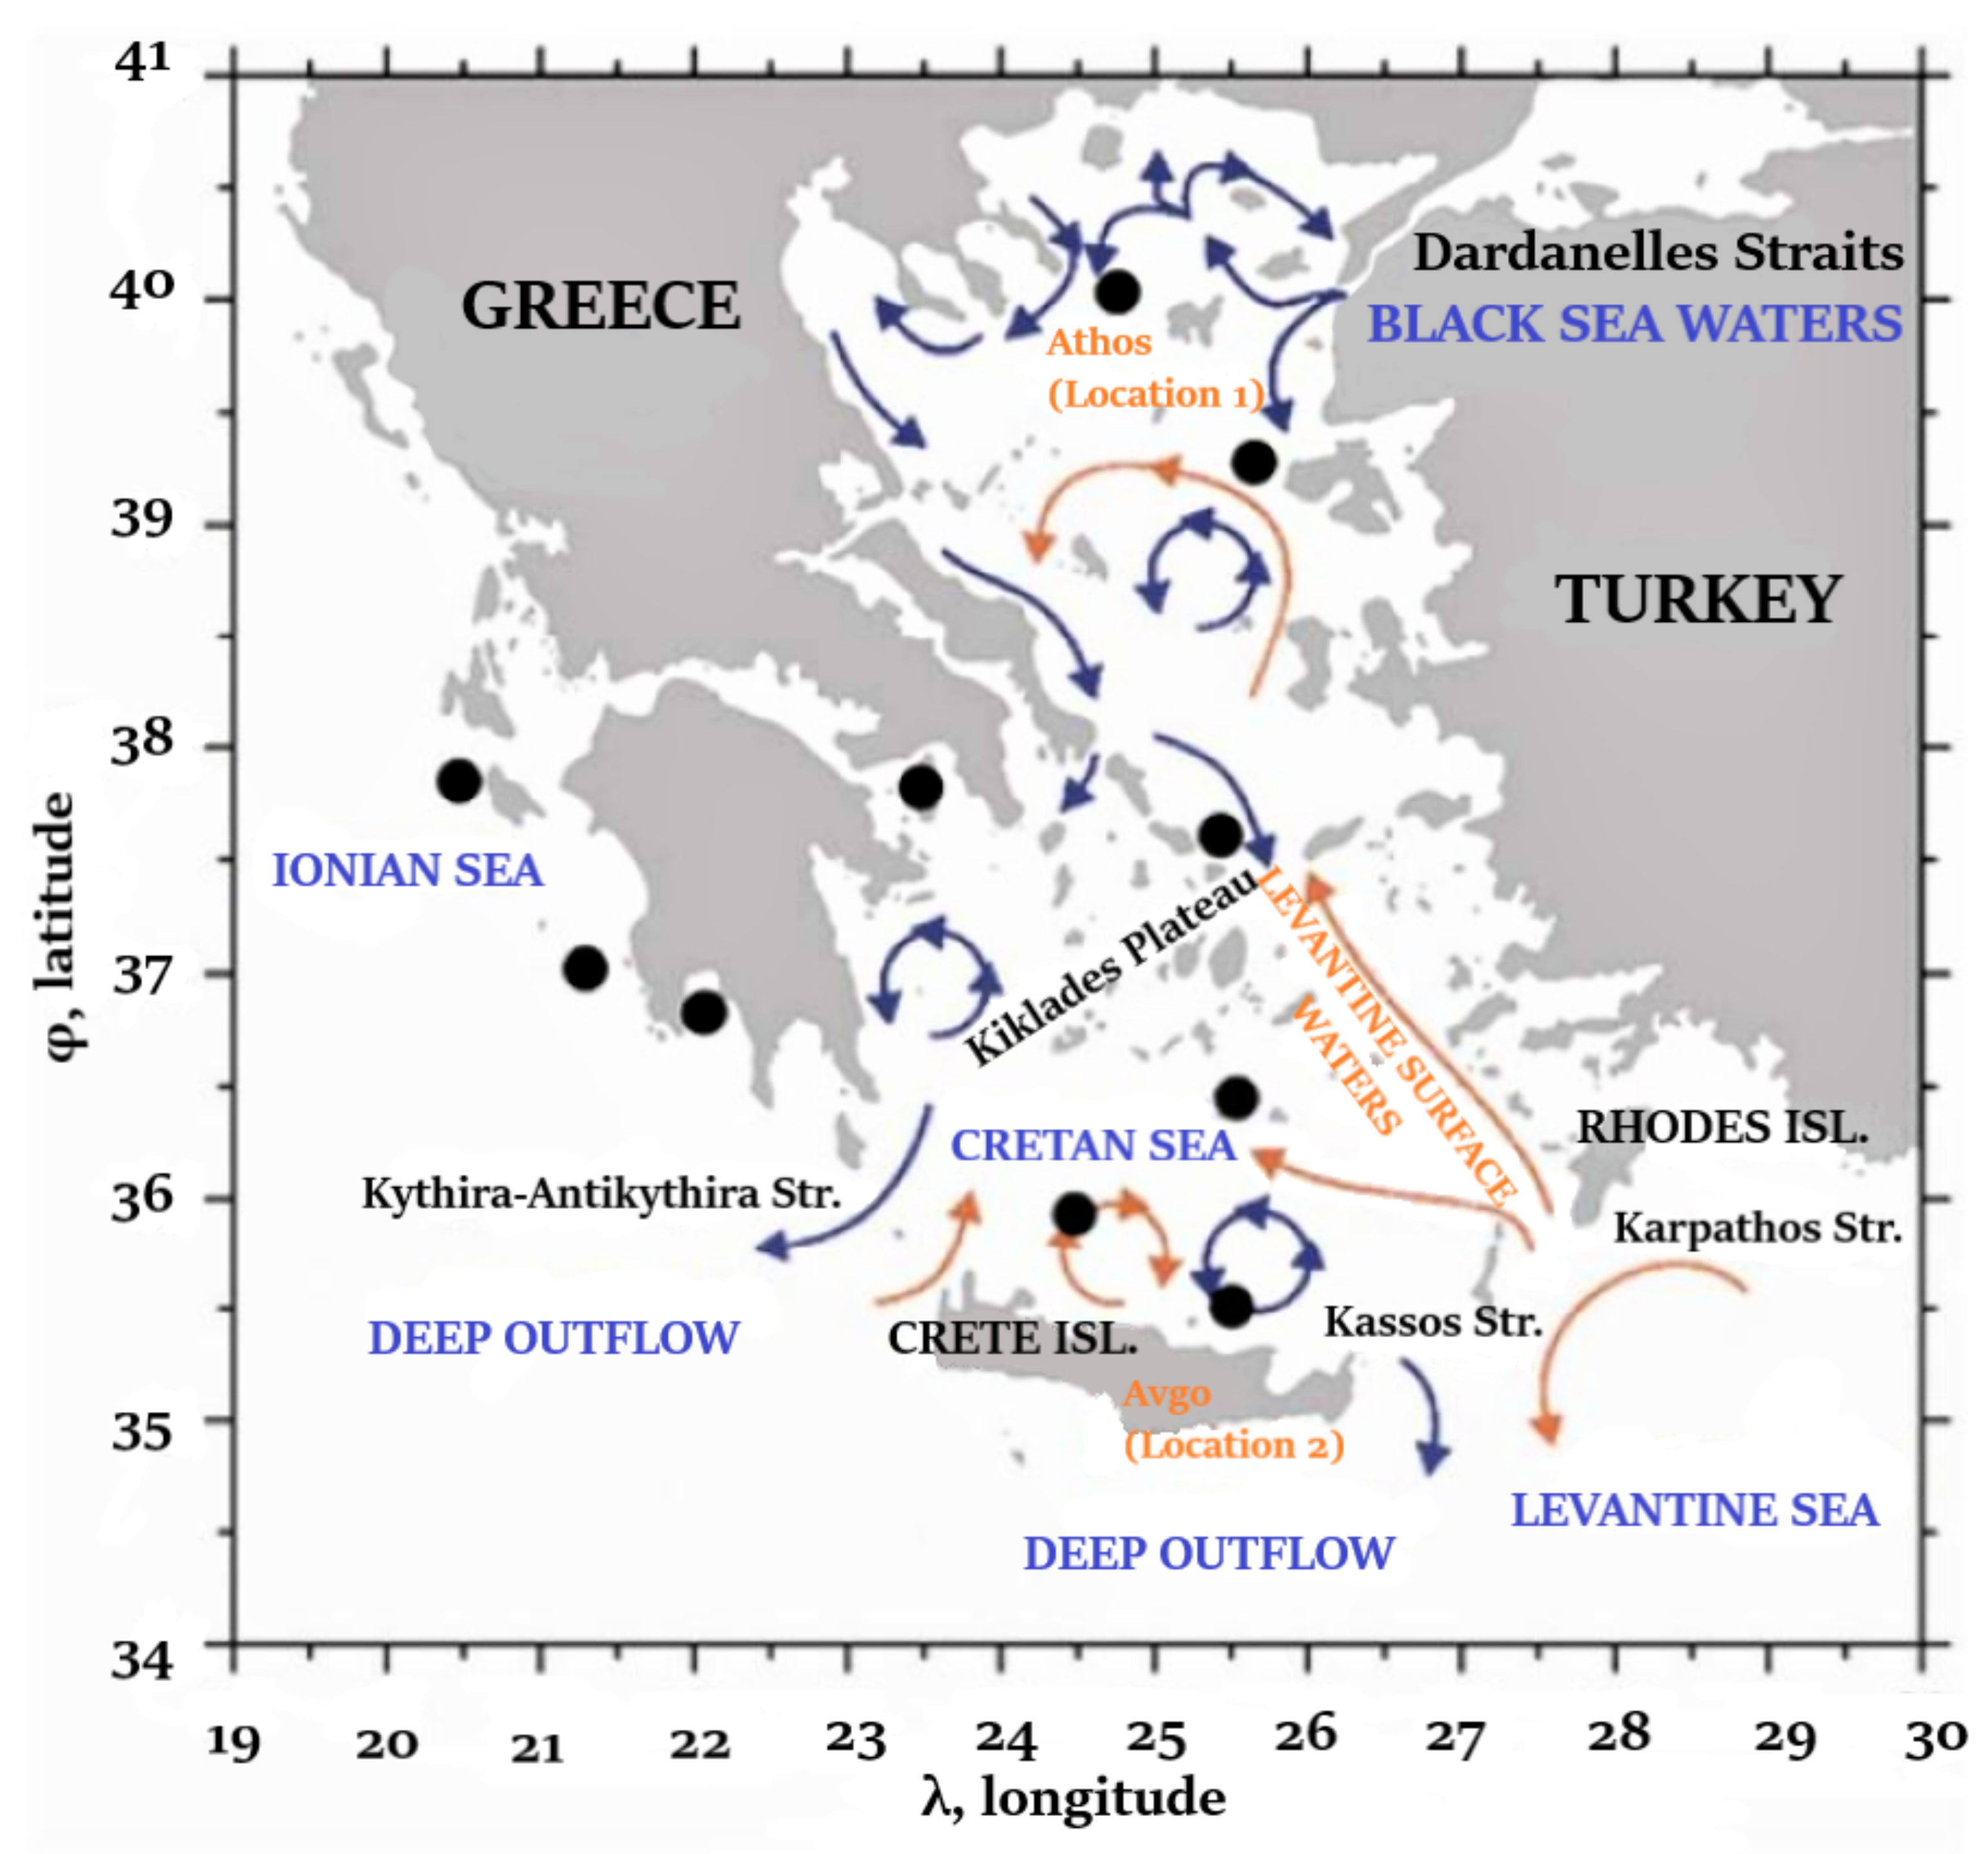
The POSEIDON observing system initially was developed back in 2000 to fulfil the ambition of the innovative operational oceanography system as regards its observational component. The initial observing system consisted of eight moored buoys deployed in the Aegean Sea, while during its first major upgrade (period 2005–2007) three multi-parametric stations were also deployed in key positions—Athos basin, Cretan Sea and SE Ionian—for the continuous recording of the water column down to 1000 m. In Figure 2, the POSEIDON mooring network as it was configured in 2010 is shown together with a sketch of the main circulation features of the Aegean Sea [4]. Adjusting to the leading trends of marine science, the system has been evolved to a multi-node observatory providing in near real time data from several platforms, expanding the capabilities of ocean monitoring on multiple scales. Currently, the POSEIDON operational nodes available to the infrastructure include the oceanographic buoys network, profiling floats (Argos, gliders), cabled seabed platform, the ferry box system and tide gauges.
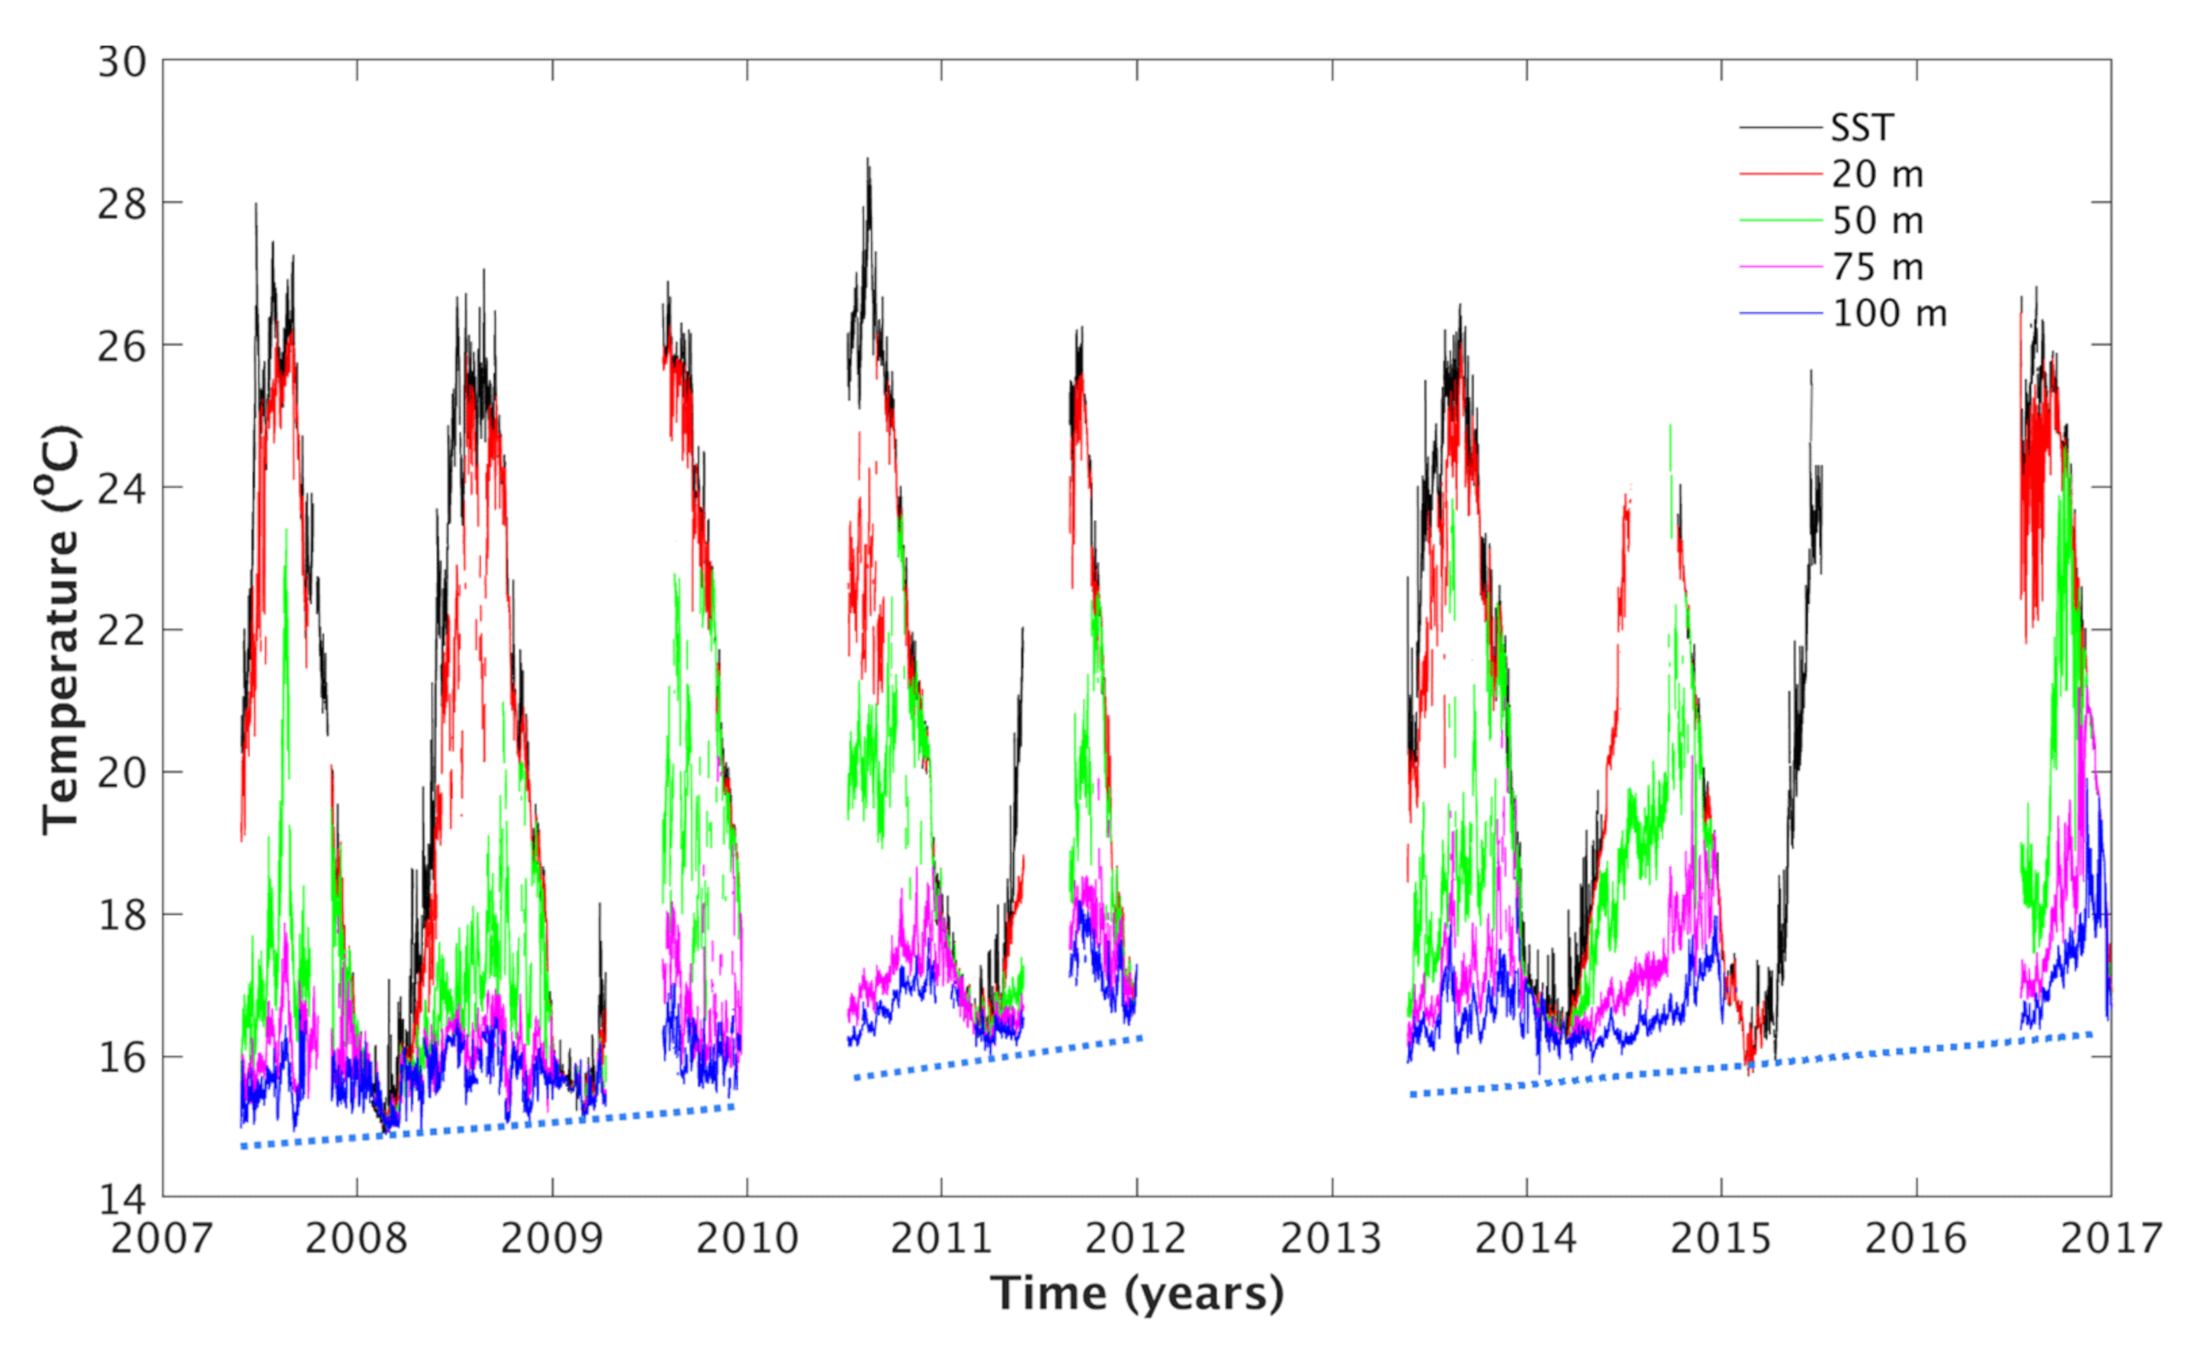
The fixed mooring buoys (one of the POSEIDON buoys is shown in Figure 3a) collect multi-parametric data both in coastal and open sea environments. These long-term recordings provide information on the ocean state and variability, allow a better understanding on the ocean processes and support the calibration and the verification of the marine and weather forecasting systems. The current network of the POSEIDON system includes six moorings deployed at key locations in the Aegean and Ionian seas (Pylos, Athos, Mykonos, Saronikos and Cretan Sea, Figure 3b). The seasonal and interannual variability in the first 100 m in the Cretan Sea as recorded by the E1-M3A station during a ten-year period (2007–2017) is given in Figure 4 [5]. Some key information about the fixed mooring stations is presented in Table 1: the scientific parameters which are recorded by the sensors installed in every station, the maximum sampling depth and sampling frequency, its activity status and the deployment date of each station. The percentages of missing data for three basic parameters are also reported, which are due to sensor malfunctions, power outage, data quality control, or even the station destruction or loss.
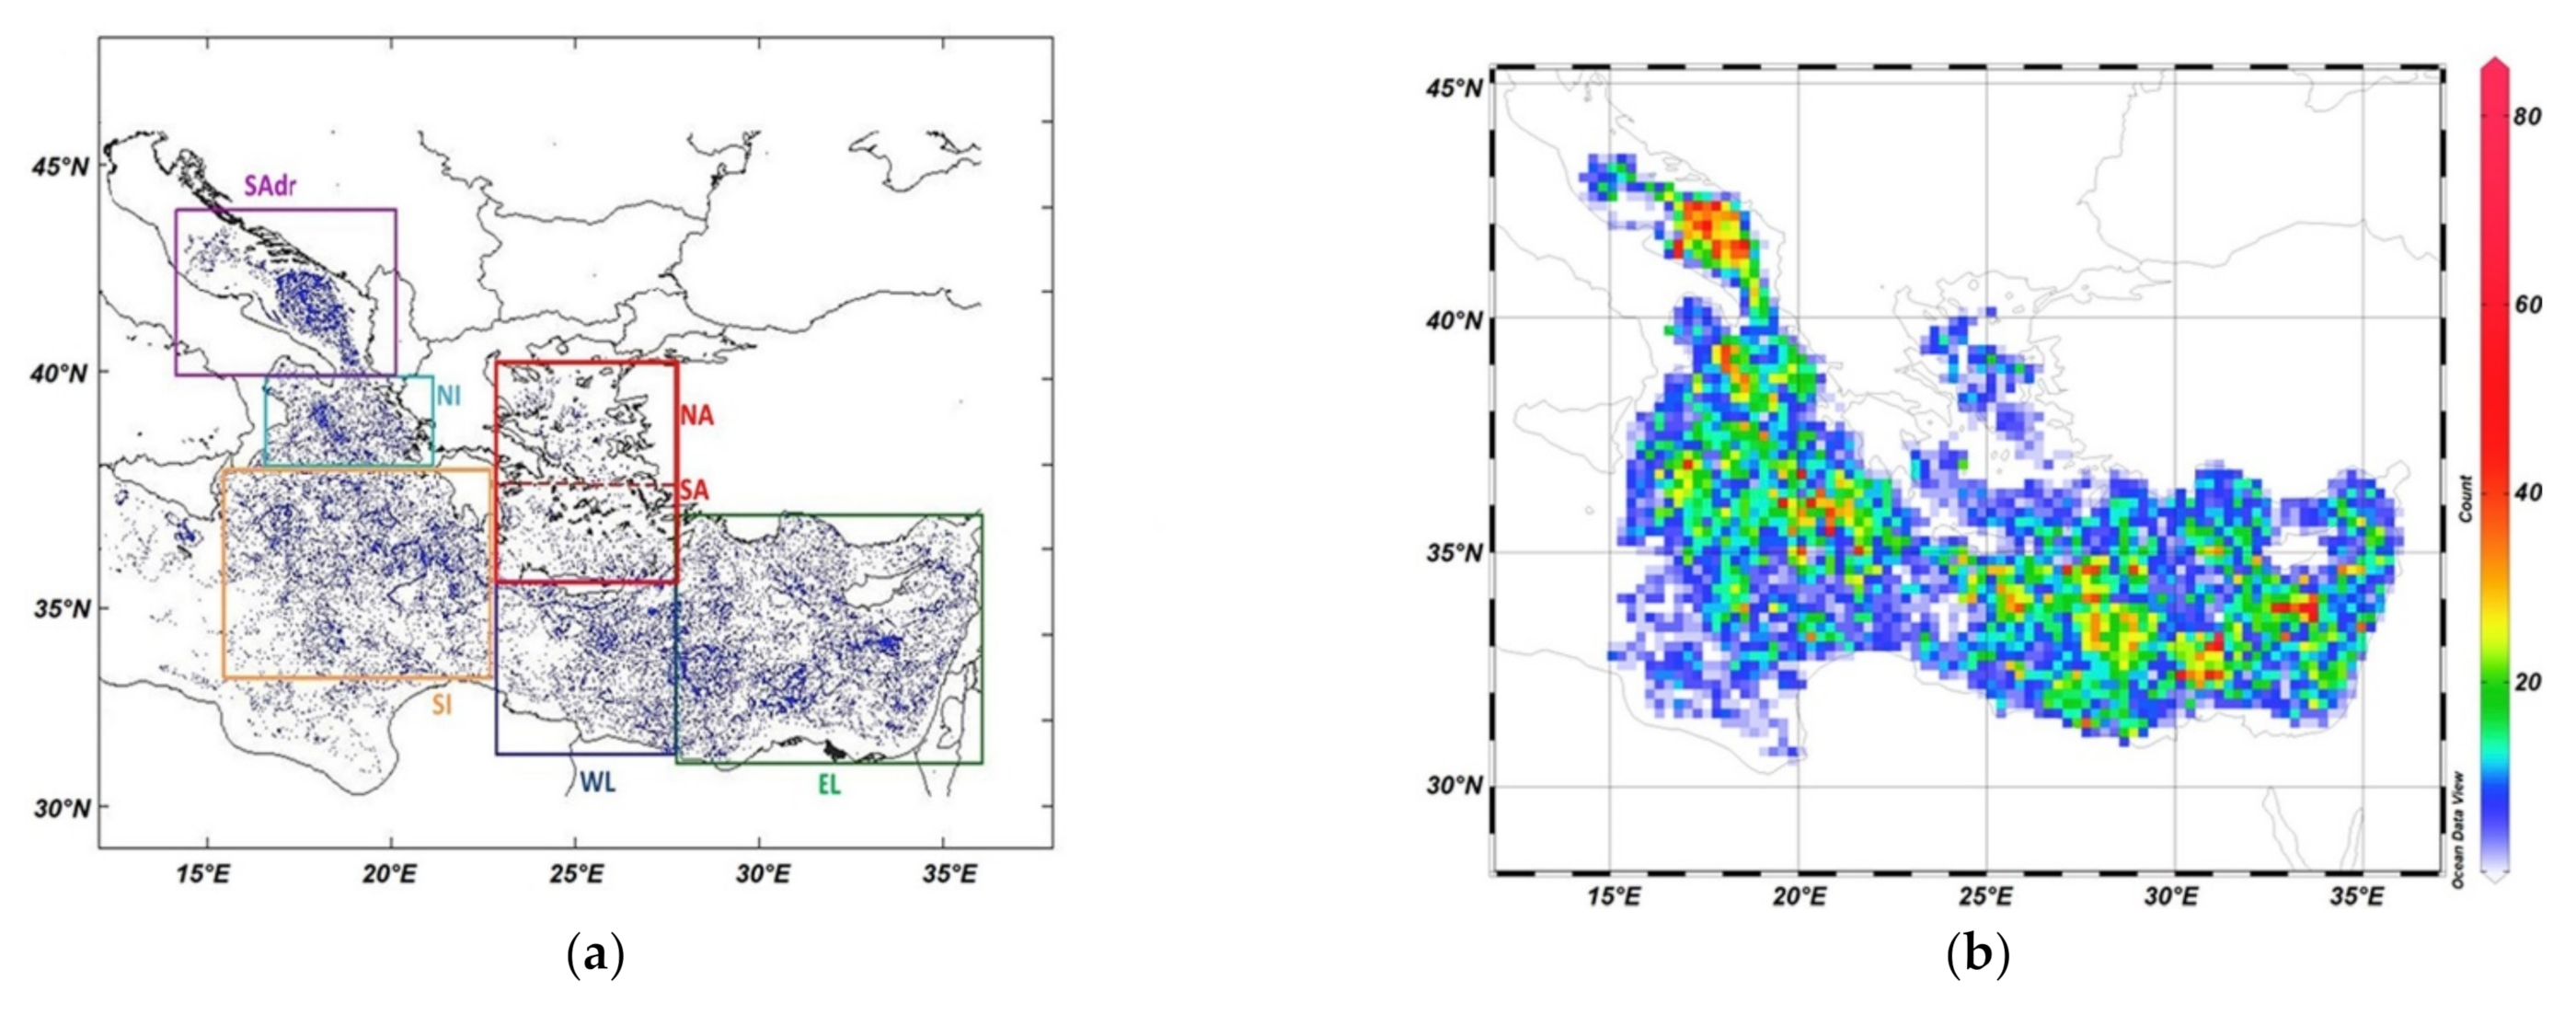
The Argo floats are autonomous free-drifting profiling floats for sampling ocean physical and biogeochemical parameters. Today the global Argo Network (www.argo.net, accessed on 18 December 2021) consists of approximately 4000 floats and has become a global, in situ ocean-observing network. The Greek Argo activities, coordinated by HCMR, contribute to the Euro-Argo Research Infrastructure (www.euro-argo.eu, accessed on 18 December 2021), with more than 2500 profiles acquired so far in sub-basins of the Aegean, Ionian, Libyan, and Levantine Seas. In Figure 5 the Argo float profiles are presented over the years 2004–2017 in the sub-regions of the Eastern Mediterranean Sea: South Adriatic (SAdr), North Ionian (NI), South Ionian (SI), North and South Aegean (NA and SA), Western Levantine (WL), and Eastern Levantine (EL). The data analysis on the different sub-regions reveals the contribution of each area towards the T-S long-term distribution in the Eastern Mediterranean shown in Figure 6 [6]. Since 2010, 34 Argo floats have been deployed from the Greek Argo team in the Aegean, Ionian, and Levantine Seas. In Table 2, we present the number of floats deployed, and the number of floats operated in certain sub-basins. Furthermore, the total number of mission days and profiles acquired by these floats are provided along with the average profile number per float in the South and North Ionian, South and North Aegean, Levantine, and Adriatic Seas (Table 2).
Ocean gliders are autonomous underwater vehicles that move in the sea water by changing their buoyancy and attitude, ascending and descending repeatedly in a saw tooth pattern, sampling the water column up to 1000 m depth. A glider waiting in the sea surface to start its dive is shown in Figure 7a. Gliders may be equipped with a wide variety of sensors to monitor temperature, salinity, currents, biochemical ocean conditions as well as marine mammals (sound), advancing the sustained monitoring from the coastal environment to the open seas. They are also used for applications in the oil and gas industry, being able to detect hydrocarbons and methane as well as in defense and security using passive acoustic sensors. Three underwater gliders have been integrated into the POSEIDON network since 2017 in order to enhance the sustained observations of the Greek Seas, starting with the establishment of the endurance line operating in the Cretan Sea up to 1000 m depth (the dotted red line in Figure 7b). The repeated monitoring that started in late 2017 is expected to contribute to the further knowledge of the seasonal variability of the flow field and to collect evidence of the intermediate or deep-water formation events that are known to occur in the area. Some first results are shown in Figure 8, the vertical distribution of temperature (Figure 8a) and salinity (Figure 8b), which are reasonably consistent with the sea-surface height distribution depicted in Figure 7b [5]. Since 2017, 11 glider missions have been conducted to support the Cretan endurance line: 4 missions during winter, 4 missions during spring, and 3 missions during summer, with the optimal objective of three seasonal missions per year. In Table 3 the glider missions are presented in regard to their duration, deployment date, recorded parameters, maximum sampling depth, and number of vertical profiles collected through the total horizontal distance covered during each mission.
The ferry box system is integrated on board ships of opportunity (ferry, cargo or research vessels) providing oceanographic parameters in near real time, collected along the ship’s transect. The sensors installed on a ferry box system are measuring physical, chemical and biological parameters, while the data collected are stored in a computer and transmitted to the POSEIDON operation center through GSM.
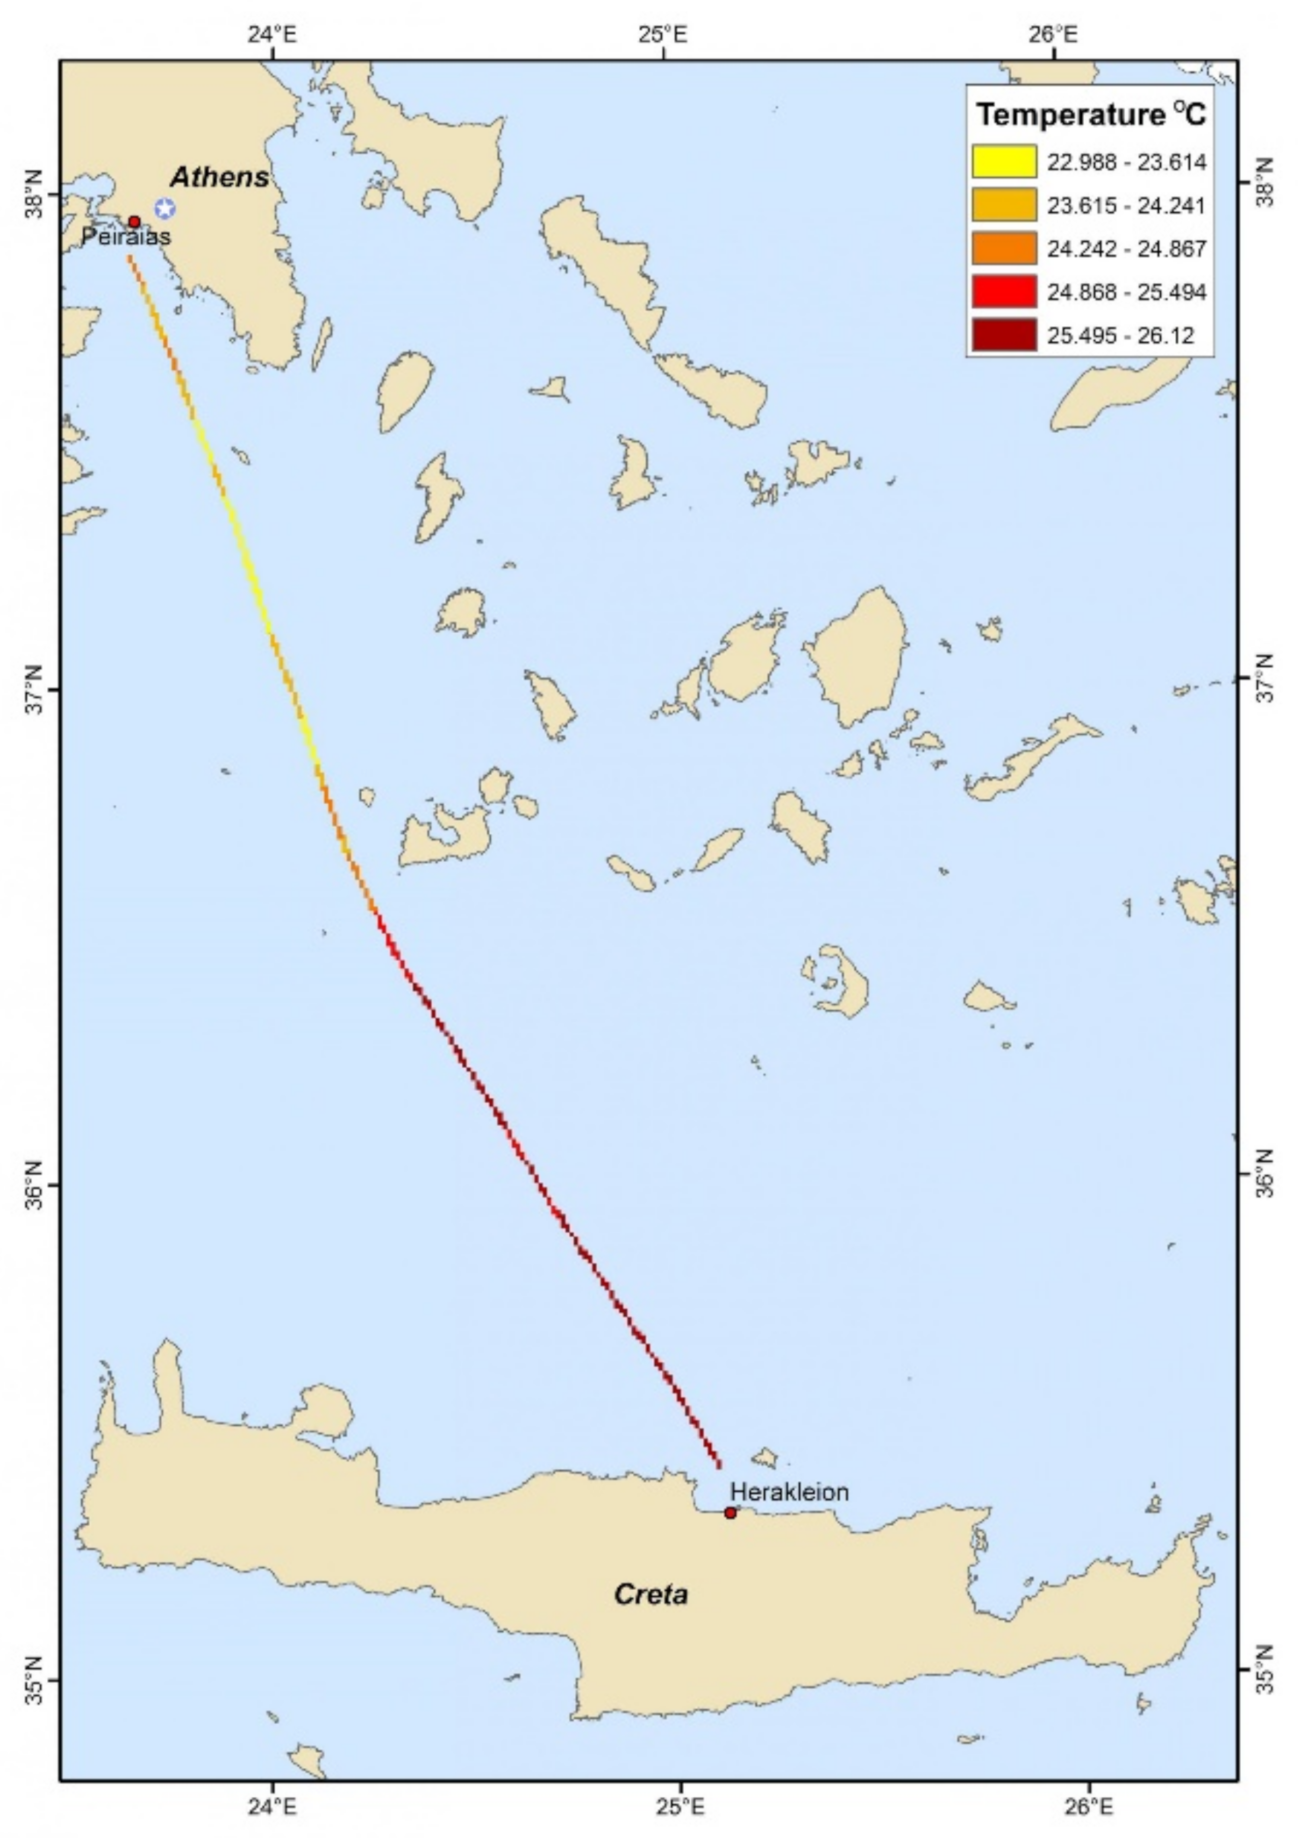
A ferry box system is in operation on the route connecting the ports of Piraeus (Athens) and Heraklion (Crete)—the first line established in the Mediterranean—sampling the South Aegean Sea on a daily basis (Figure 9). During the implementation of the infrastructure, a second ferry box system was established to collect data along a ship route in the North Aegean Sea. The three operational periods of the ferry box system on the route Piraeus–Heraklion are listed in Table 4, in terms of the operating duration, the number of cruises, the recorded parameters and the sampling frequency.
The cabled seabed observatory is a fixed deep-sea observatory platform that connects to land via a 15 km length submarine cable providing high bandwidth data connection and power supply. The site of the POSEIDON platform is located in the SE region of the Ionian Sea at 1580 m depth, 15 km NW off the town of Pylos in the SW Peloponnese and belongs to the EMSO distributed research infrastructure consisting of fixed seafloor and water column observatory nodes for deep ocean observations. The bottom platform hosts multiple sensors related to seismology, geodesy, sea level, fluid and gas vents, physical oceanography, and biodiversity imaging at different scales. Figure 10a,b shows the POSEIDON deep-sea observatory during its immersion in the Pylos site (Figure 10a) and installation at the sea bottom (Figure 10b). In Table 5, the recorded parameters and the equipment of the platform are also listed.
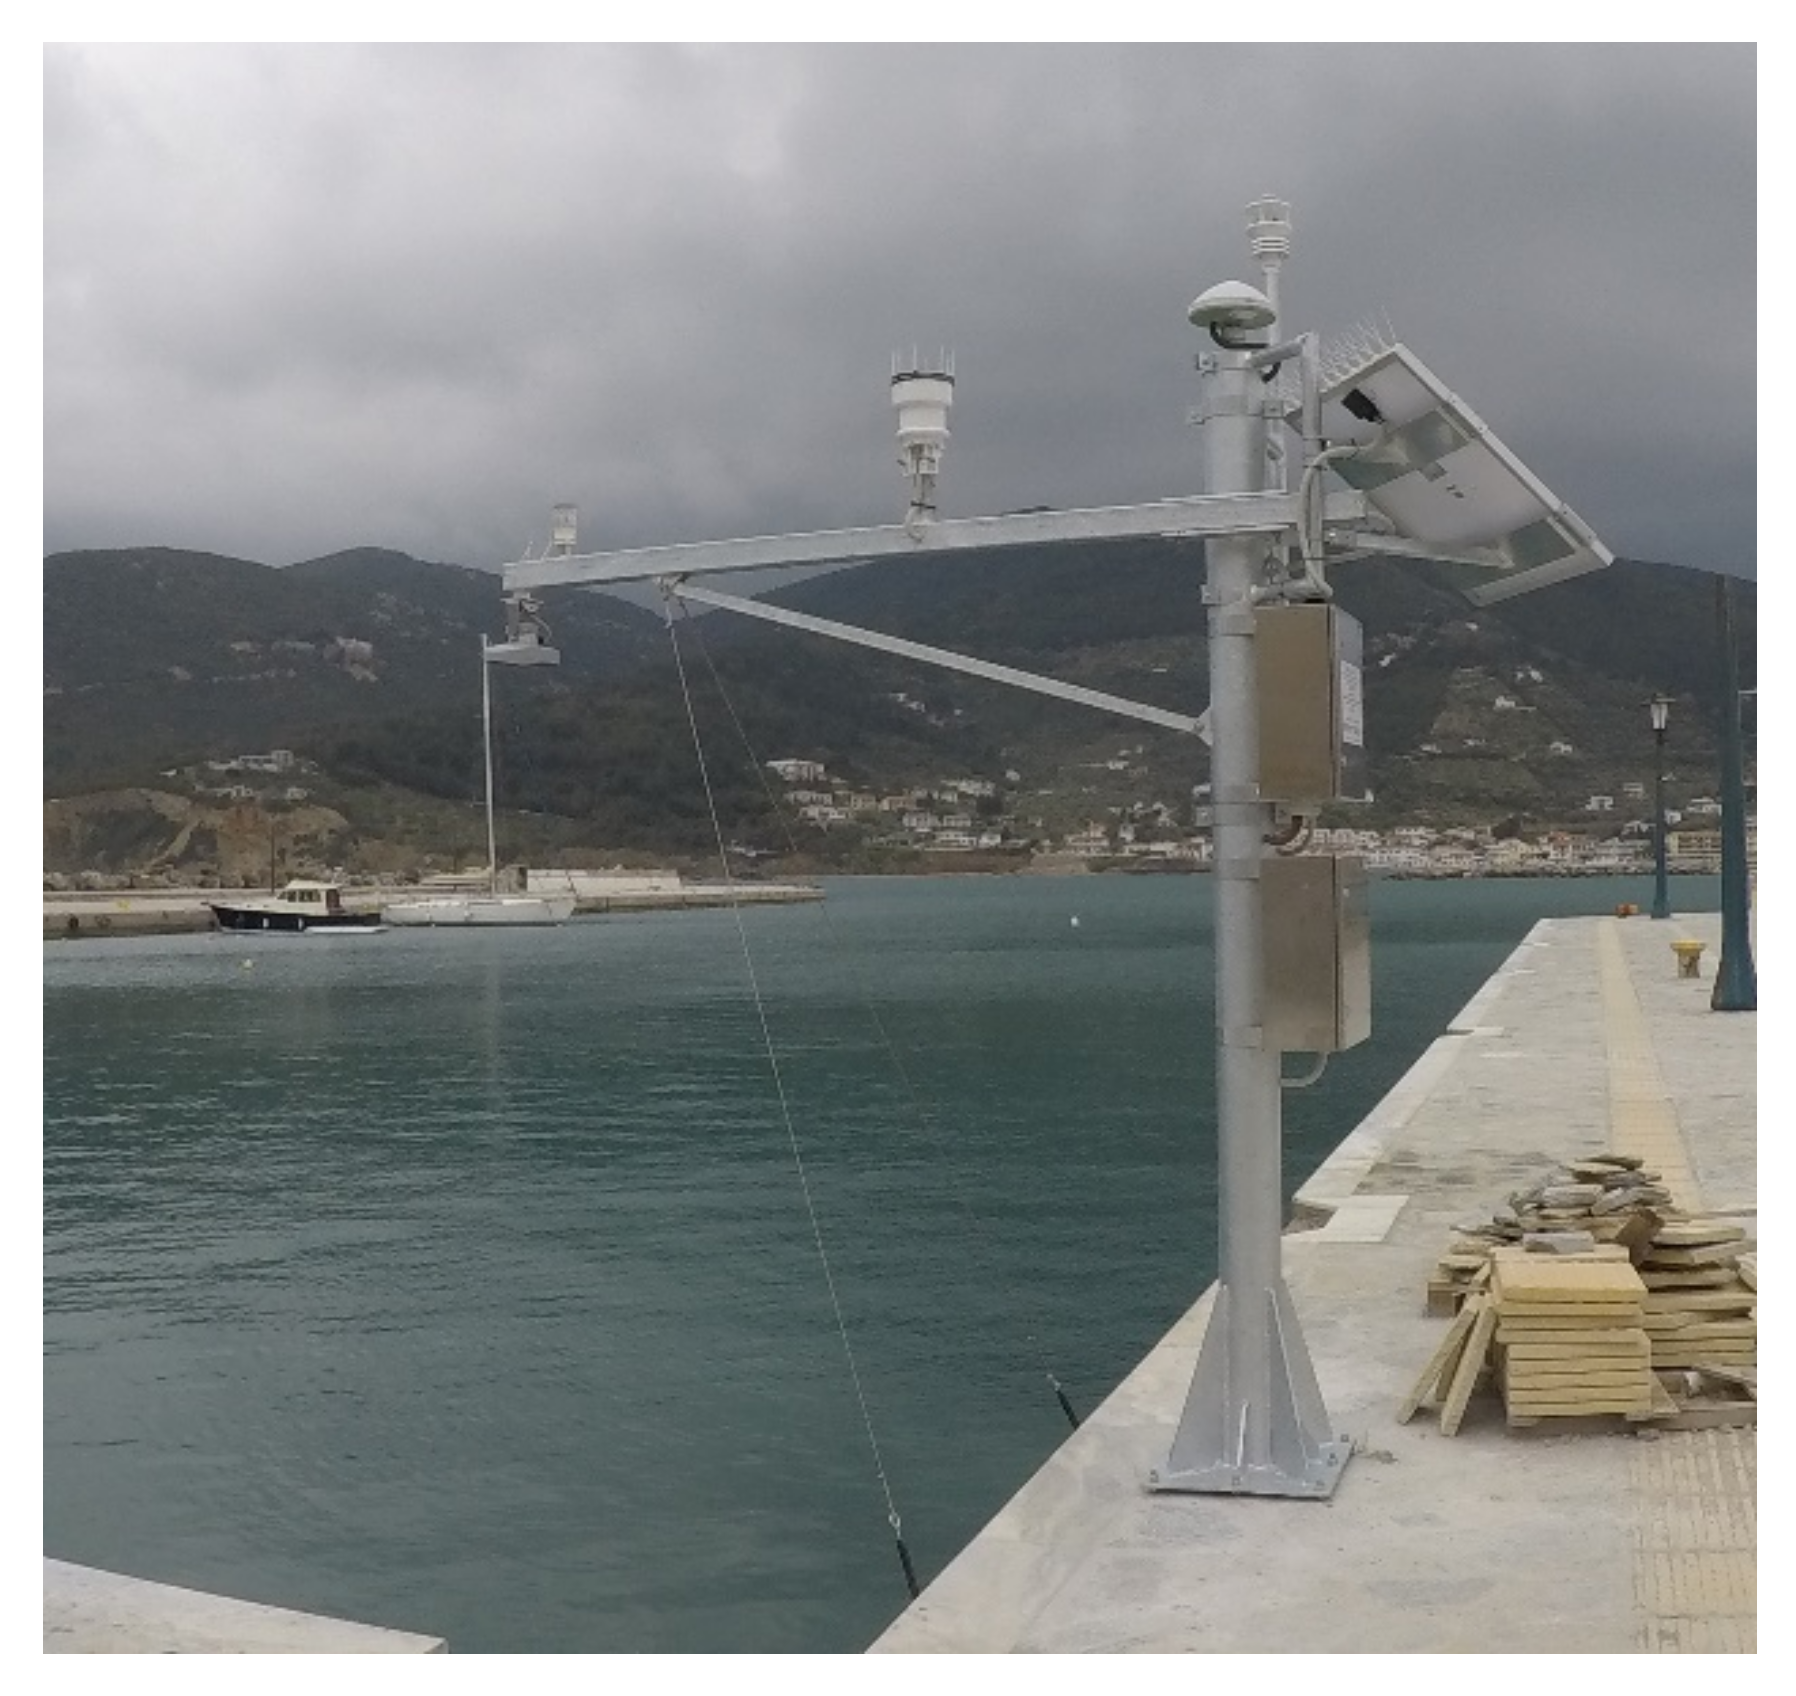
Tide gauges are recording stations equipped with sensors that continuously monitor the height of the surrounding water level. A typical installation of a radar tide gauge is shown in Figure 11. Tide gauge measurements are used to estimate sea level changes due to tides, atmospheric pressure, wind conditions, and sea temperature variations—which affect the density and the volume of the water, rainfall and river water flows into the sea. Furthermore, trends in mean sea level are used to identify extreme conditions and their relation to climate change. Furthermore, sea level data are critical for harbor operations, navigation and other coastal activities. Two state-of-the-art radar sea level recording stations were added to the POSEIDON observatory in the framework of the HIMIOFoTS project, also equipped with meteorological sensors and GNSS receivers for high precision positioning references. One station is located in Skopelos island (Figure 11) and the other in Palaia Fokea harbor contributing to the national sea level monitoring network. In Table 6, the recorded parameters of the new radar tide gauge stations are presented, with their sampling frequency and the data acquisition efficiency per parameter (actually acquired data/maximum number of data), since their installation in Palaia Fokea harbor and in Skopelos island.

3.1.2. The “Dardanos” System

The observational constituent of the marine infrastructure is complemented by the Coastal Surface Circulation Monitoring System “Dardanos”. The system is a High-Frequency Radar (HF radar) System, providing mapping of surface currents over large areas at half-hour or hourly intervals. The principle of operation of HF radars lies on the extraction of the radial component of the surface currents by identifying the Doppler-shift of the radio signal Bragg-backscattered on the sea-surface waves. Thus, the phase speed of the waves along the line connecting the target area with the receiver antennas is measured and, through subtraction of the theoretical speed over still water, it is possible to obtain an estimate for the component of the current along this line. Two antenna sites are required in order to enable the computation of the 2D current field.
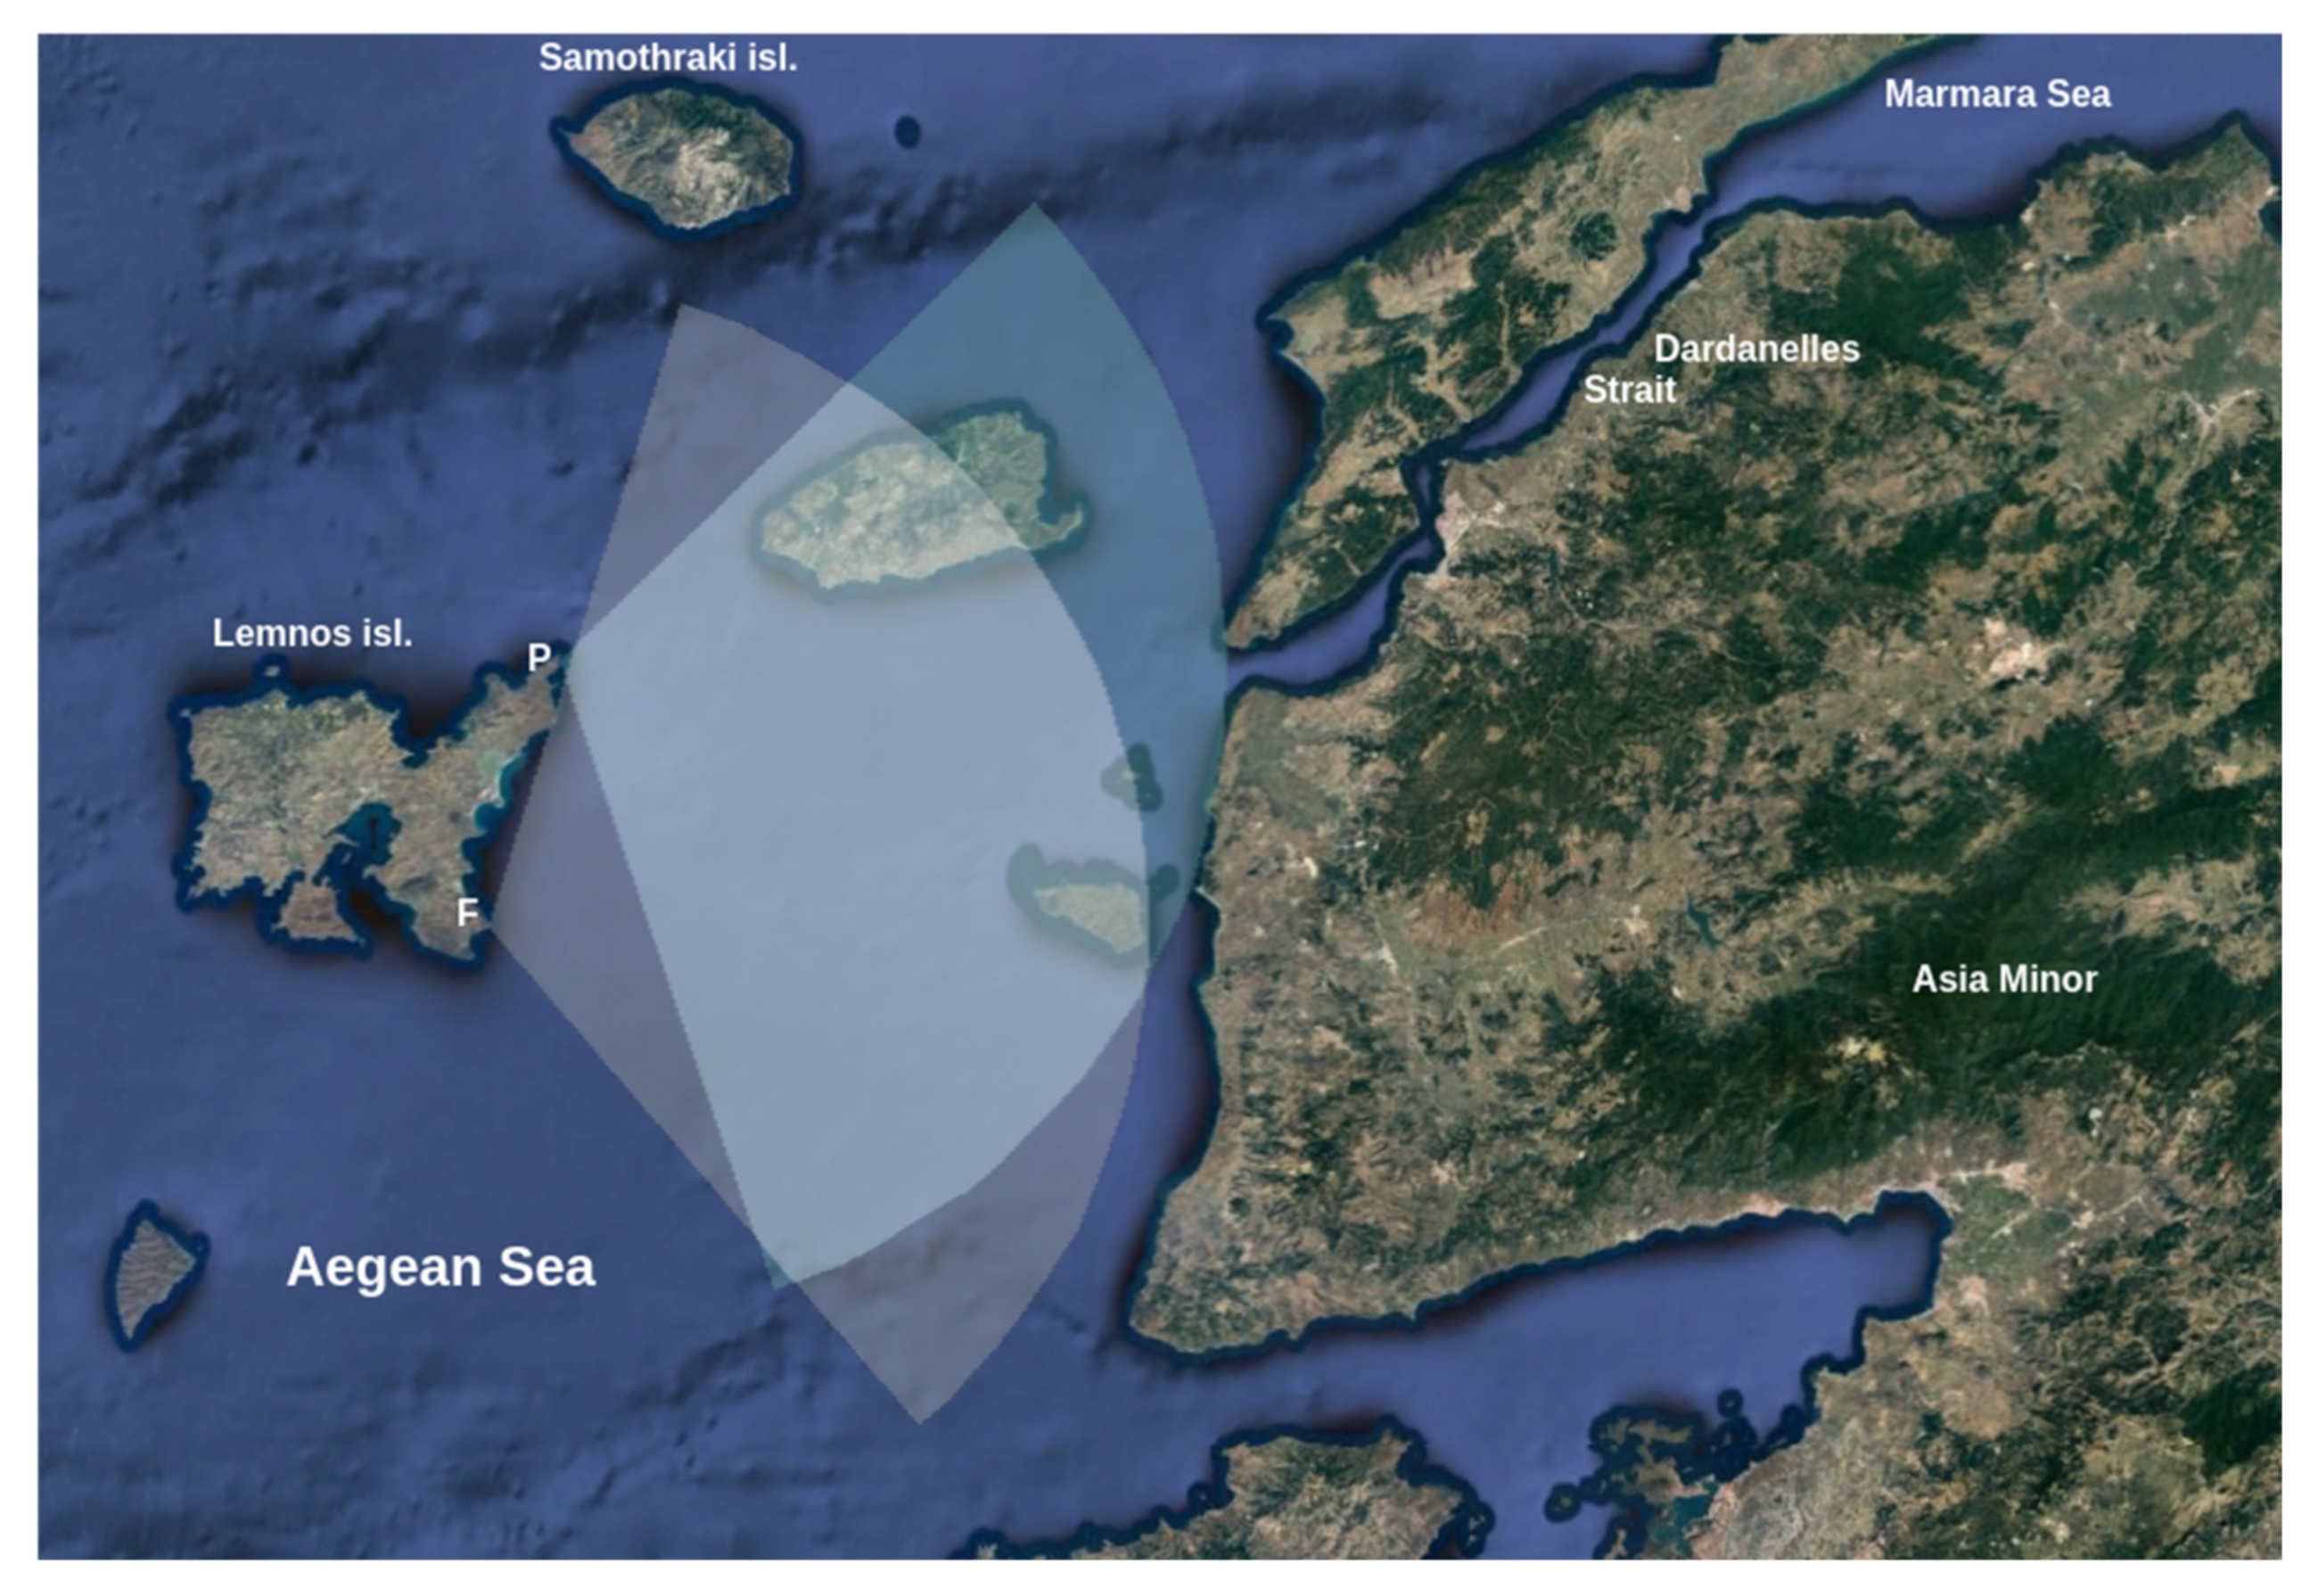
The use of HF radars in oceanography was introduced in the 1970s [7,8], but the technology matured and was widespread to cover many U.S. and European coastal areas in the 1990s and 2000s [9]. One of the first HF radars installed in the Eastern Mediterranean was the “Dardanos” system, which was installed initially in 2009 as a collaboration between two HIMIOFoTS partners, the University of the Aegean and HCMR [10]. The antenna sites of the system were located at the northeastern and southeastern extremities of Lemnos Island, in order to provide coverage over the northeastern Aegean, a Mediterranean region that directly receives the Black Sea waters exiting the Dardanelles Straits. These waters, characterized by low temperature, salinity and density, are considered to be a factor strongly influencing the hydrographic characteristics and circulation [11] as well as the deep-water formation of the region [12]. Furthermore, the inflow of mesotrophic Black Sea-originated waters fertilizes the North Aegean Sea and is responsible for its higher productivity than the rest of the Aegean [13,14,15]. The above constitute the major oceanographic reasoning for selecting the east coast of Lemnos to install the first HF radar in Greece. In addition to the above, the strong currents along the narrow Dardanelles Strait, in combination with the intense marine traffic through them, increase the probability of a polluting accident taking place in the Strait. In such a condition, the pollution would be carried by the outflowing Black Sea waters into the Aegean, and pose a potential threat to the ecosystem and the coastal communities. The same Black Sea water outflow could also curry the signal (and potential impacts) of any ecological crisis of the Marmara Sea upper layers into the Aegean. Thus, the choice of the east coast of Lemnos for the installation of the first HF radar in Greece was identical (Figure 12).
The system installed in 2009 was a WERA radar [16], transmitting at 13.4 MHz and exploiting the direction—finding a technique for estimating the surface currents. However, that operating frequency proved to be quite noisy, and thus it was decided that the upgrades and improvements planned within the framework of the HIMIOFoTS project should include a new transmission frequency. The installation of the upgraded “Dardanos” system was completed in early December 2020 (Figure 13), and included the following improvements:
  • The receiver arrays, initially composed of four antennas deployed on a square configuration, were replaced by linear arrays composed of eight antennas on every site.
  • The transmitting frequency was moved to 16.1 MHz, thus providing a slightly smaller range but in a much less noisy electromagnetic environment.
  • One of the major improvements in using eight antennas oriented in a linear array is the ability to use both direction-finding and beam-forming techniques, thus exploiting the advantages of both.
  • The beam-forming technique enables the assessment of wave characteristics over a region smaller than the region of current coverage.
  • Indirect products may include wind stress, mixed layer depth [17] and possibly other parameters.
The technical characteristics of the “Dardanos” HF radar are described in Table 7.

3.2. The Forecasting System

The observing system, as it was described above, consists of several platforms surveying the marine environment, from the atmospheric surface borders up to the deep sea, in order to collect in situ data for reckoning the status of the ocean and coastal environments. This system is bound to the forecasting system for the provision of marine information and services. The forecasting system comprises numerical models, which produce analyses and forecasts for the weather and ocean conditions of the Mediterranean and Greek Seas, using state-of-the-art techniques and data assimilation procedures. The forecasting system incorporates the well-established models of the POSEIDON System:
  • The POSEIDON weather forecasting system [18] with simulation period of 5 days.
  • The Mediterranean ocean circulation forecasting system [19], which provides 5-day forecasts.
  • The Aegean Sea hydrodynamic model [20,21] also provides forecasts for 5 days ahead.
  • The WAM based wave forecasting system provides wave forecasts for the next 5 days forced with hourly forecast winds produced by the POSEIDON weather prediction system.
  • The WAVEWATCH based wave forecasting system provides wave forecasts for the next 5 days forced with hourly analysis and forecast winds produced by the POSEIDON weather prediction system.
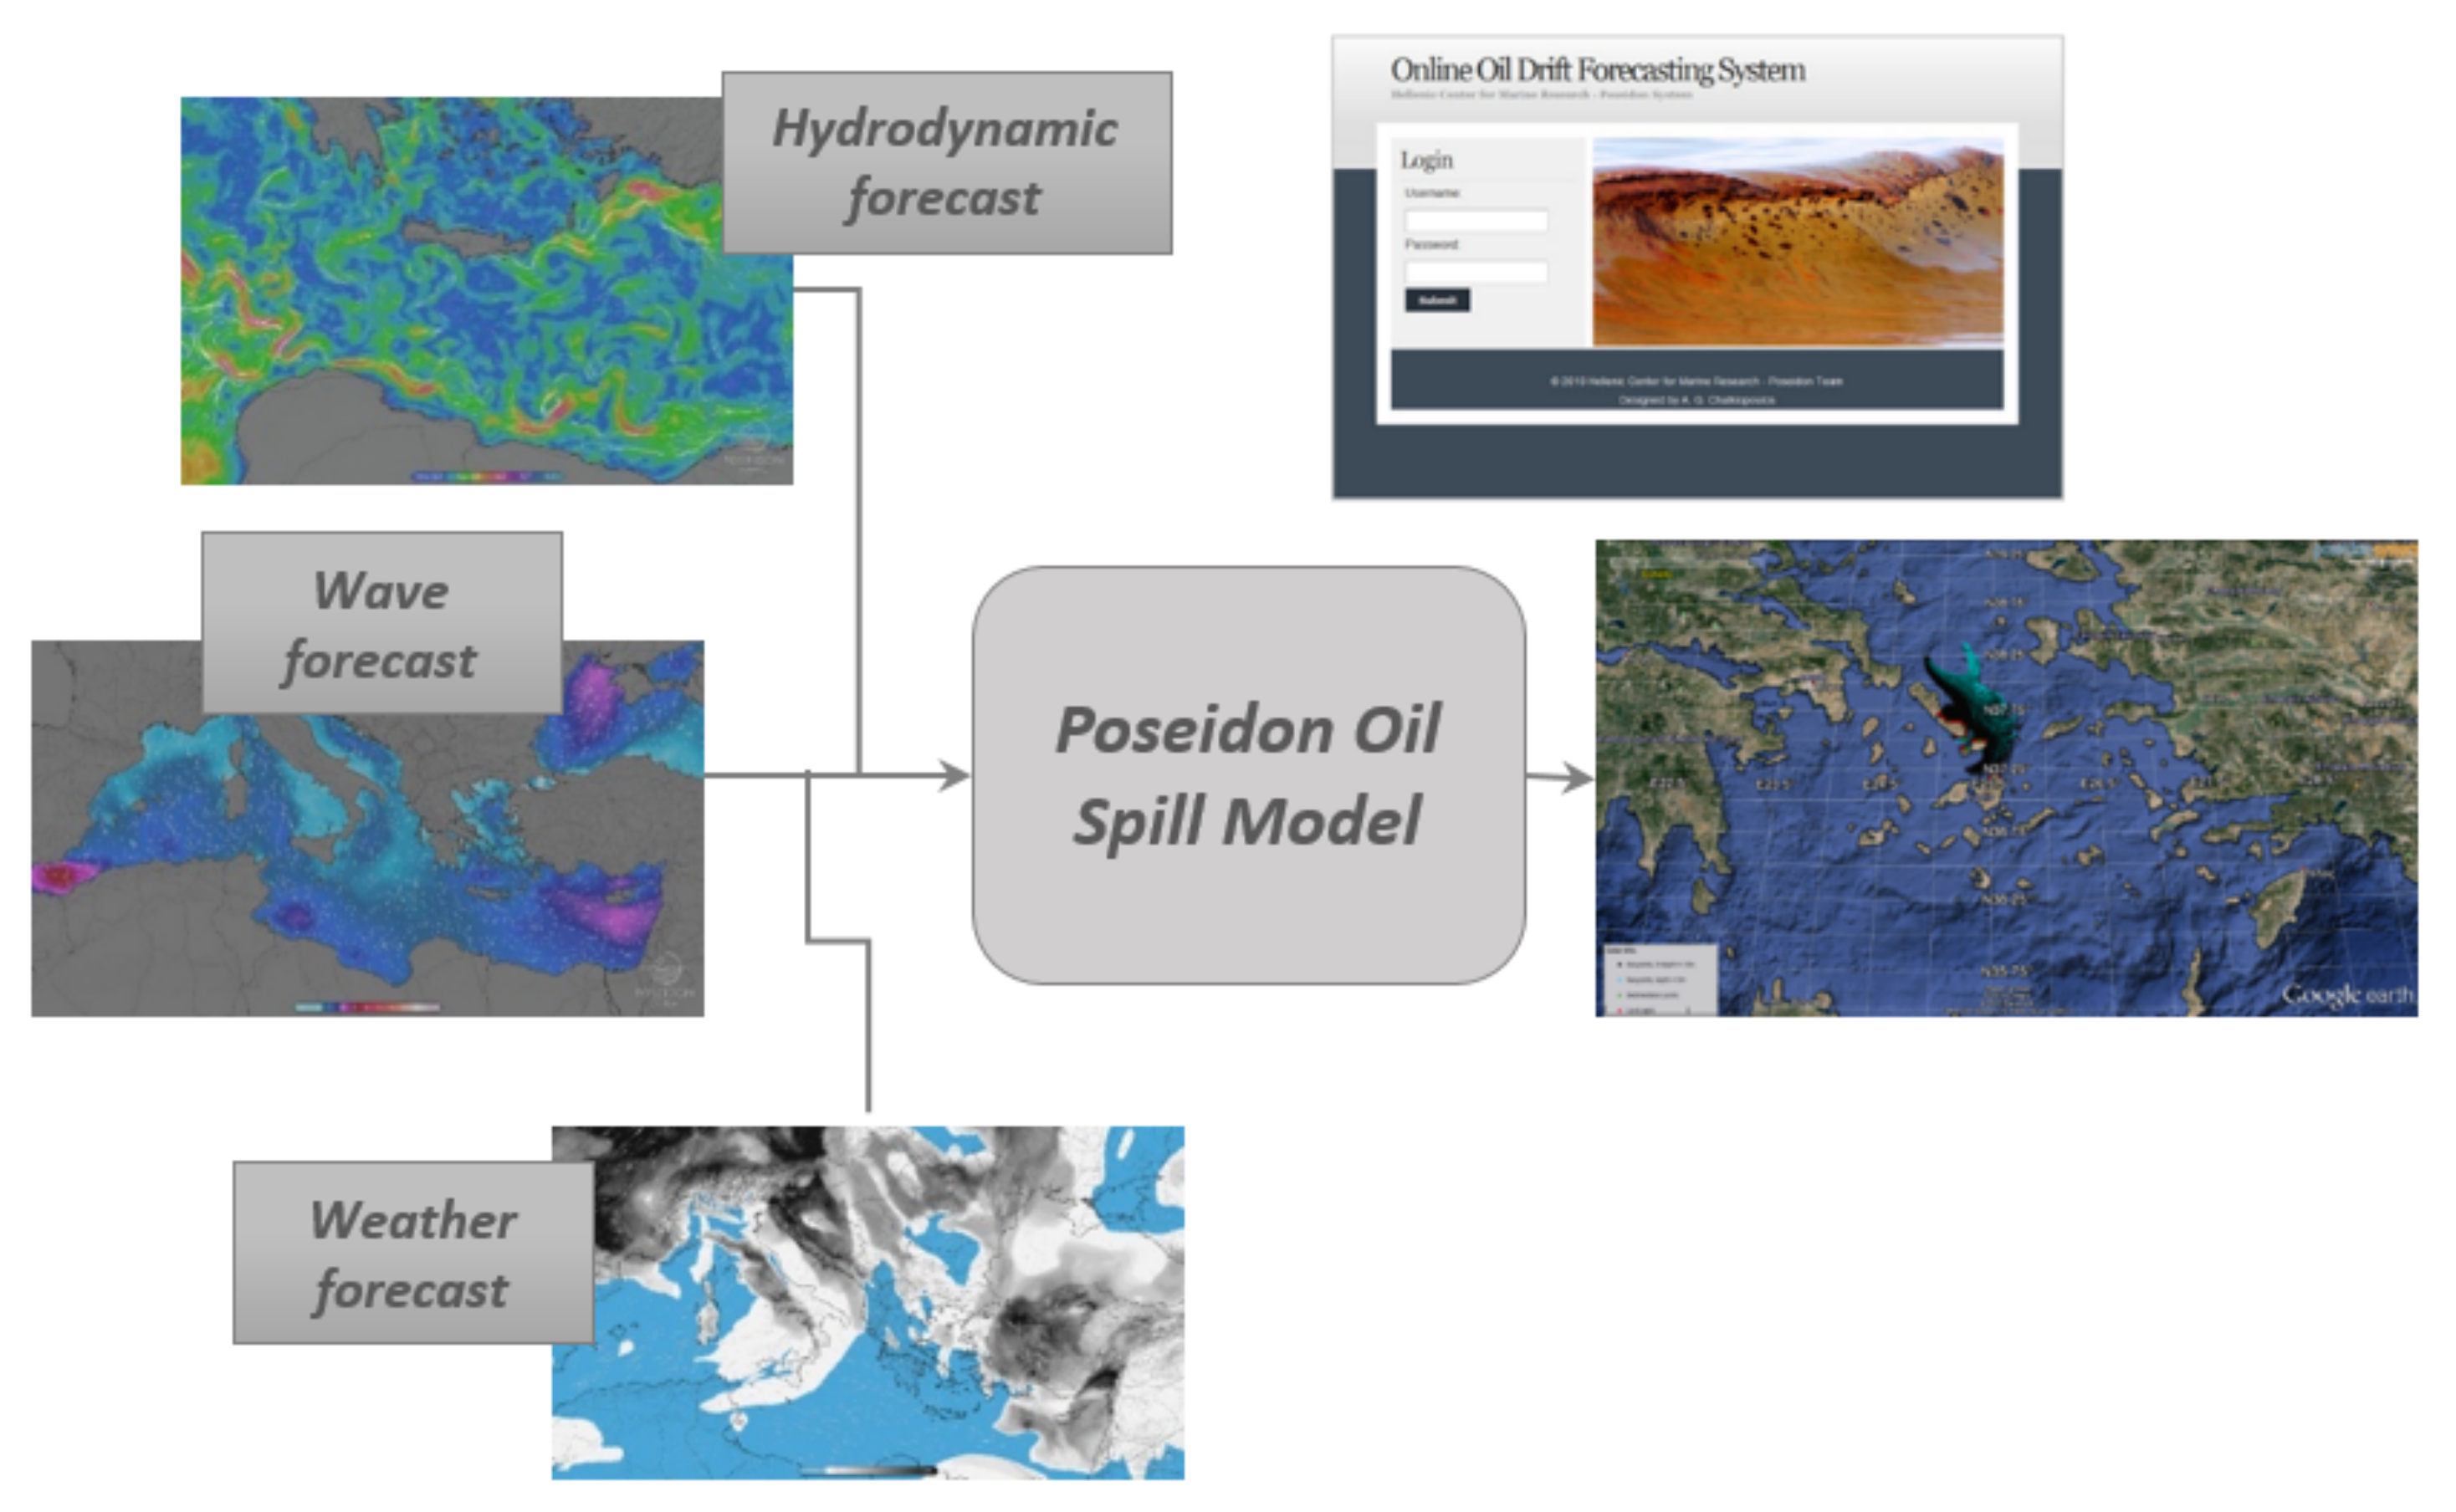
  • The oil spill fate and trajectory model, which is able to simulate not only the drift of the oil but also the chemical transformations under the specific environmental conditions.
In addition to the POSEIDON operational forecasting models integrated to the marine research infrastructure, the following developments were also carried out in order to expand the system’s forecasting abilities:
  • The weather system was further improved through a major upgrade of the Local Analysis and Prediction System (LAPS) 3D data assimilation package implemented by the Harokopio University of Athens, enhancing the high-resolution analysis fields. The LAPS domain covers all of Europe and is configured to run with GFS forecasts as background fields assimilating METAR, SYNOP and RAOB measurements in real time. Moreover, the POSEIDON weather forecasting system was ported to a new High Performance Computer System (HPC) to ensure faster execution and better stability.
  • A new forecasting system was developed covering both the Aegean and the Ionian Seas based on the hydrodynamic model Regional Ocean Modeling System (ROMS version 3.7).
  • A high-resolution offline model was developed covering the Gulf of Saronikos and embedded into the above system.
These three major developments implemented to the forecasting system are presented in more detail below, as well as the WAM wave forecasting system and its quality assessment.

3.2.1. The Weather Forecasting System

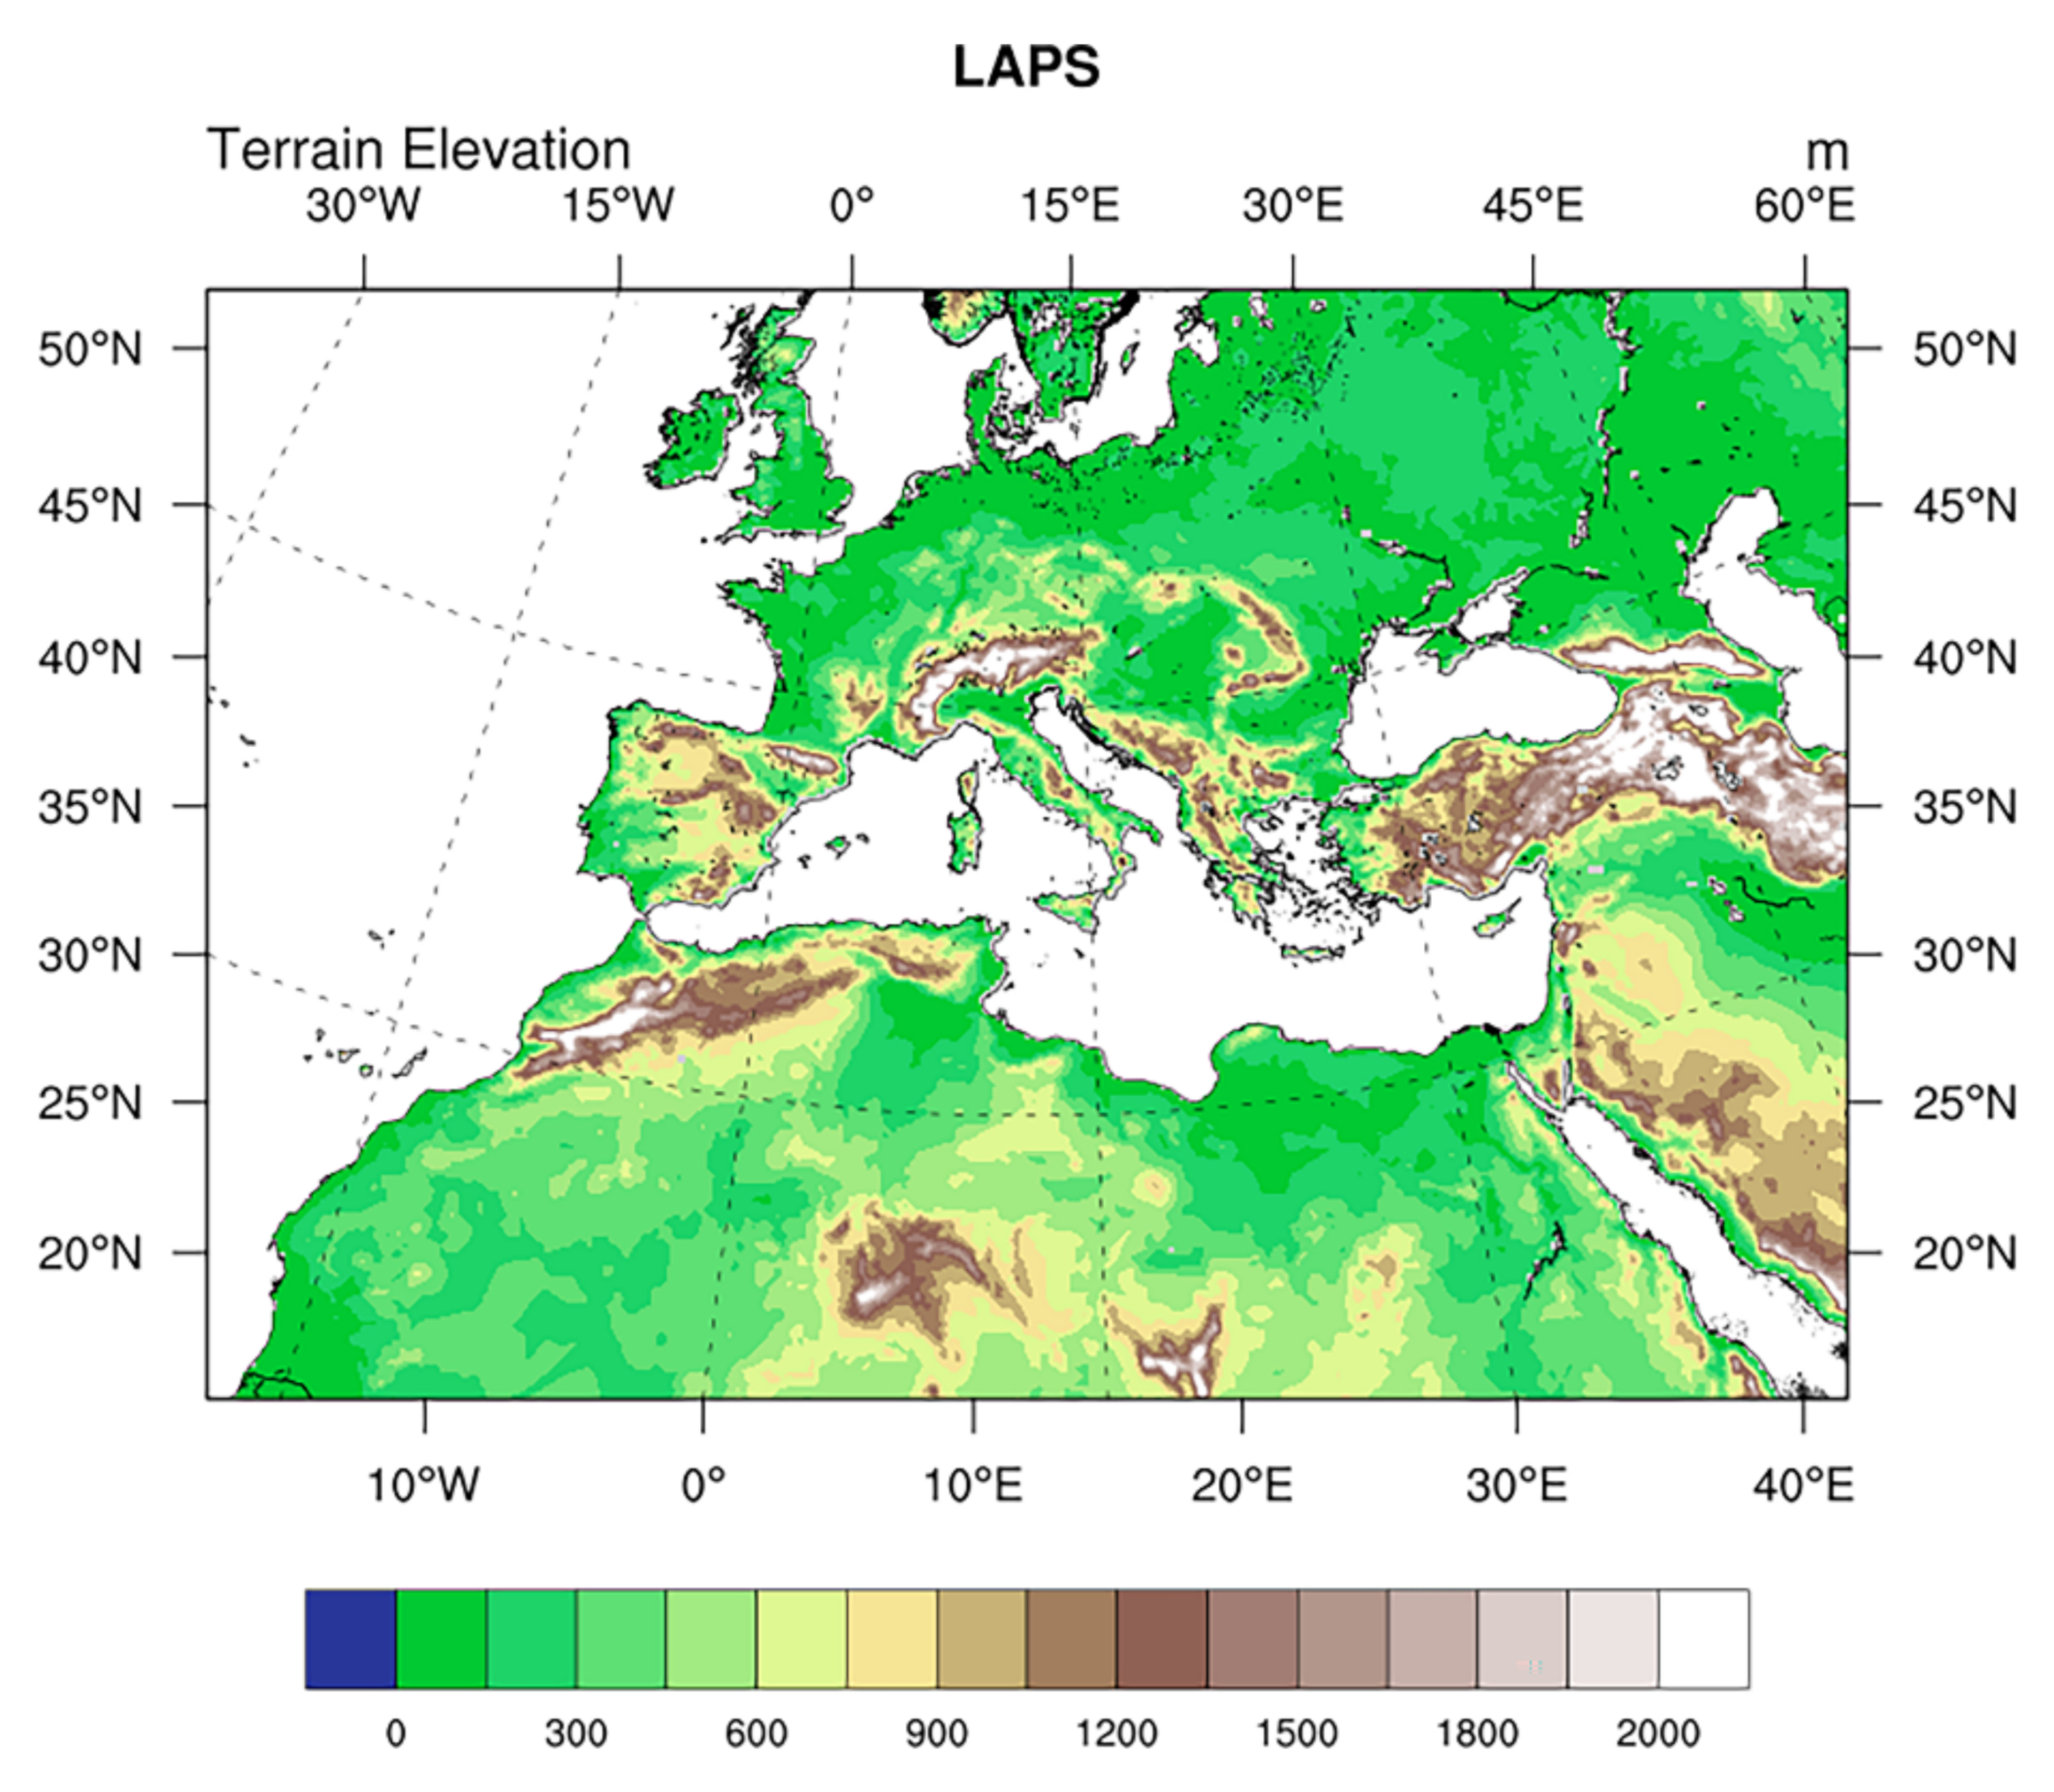
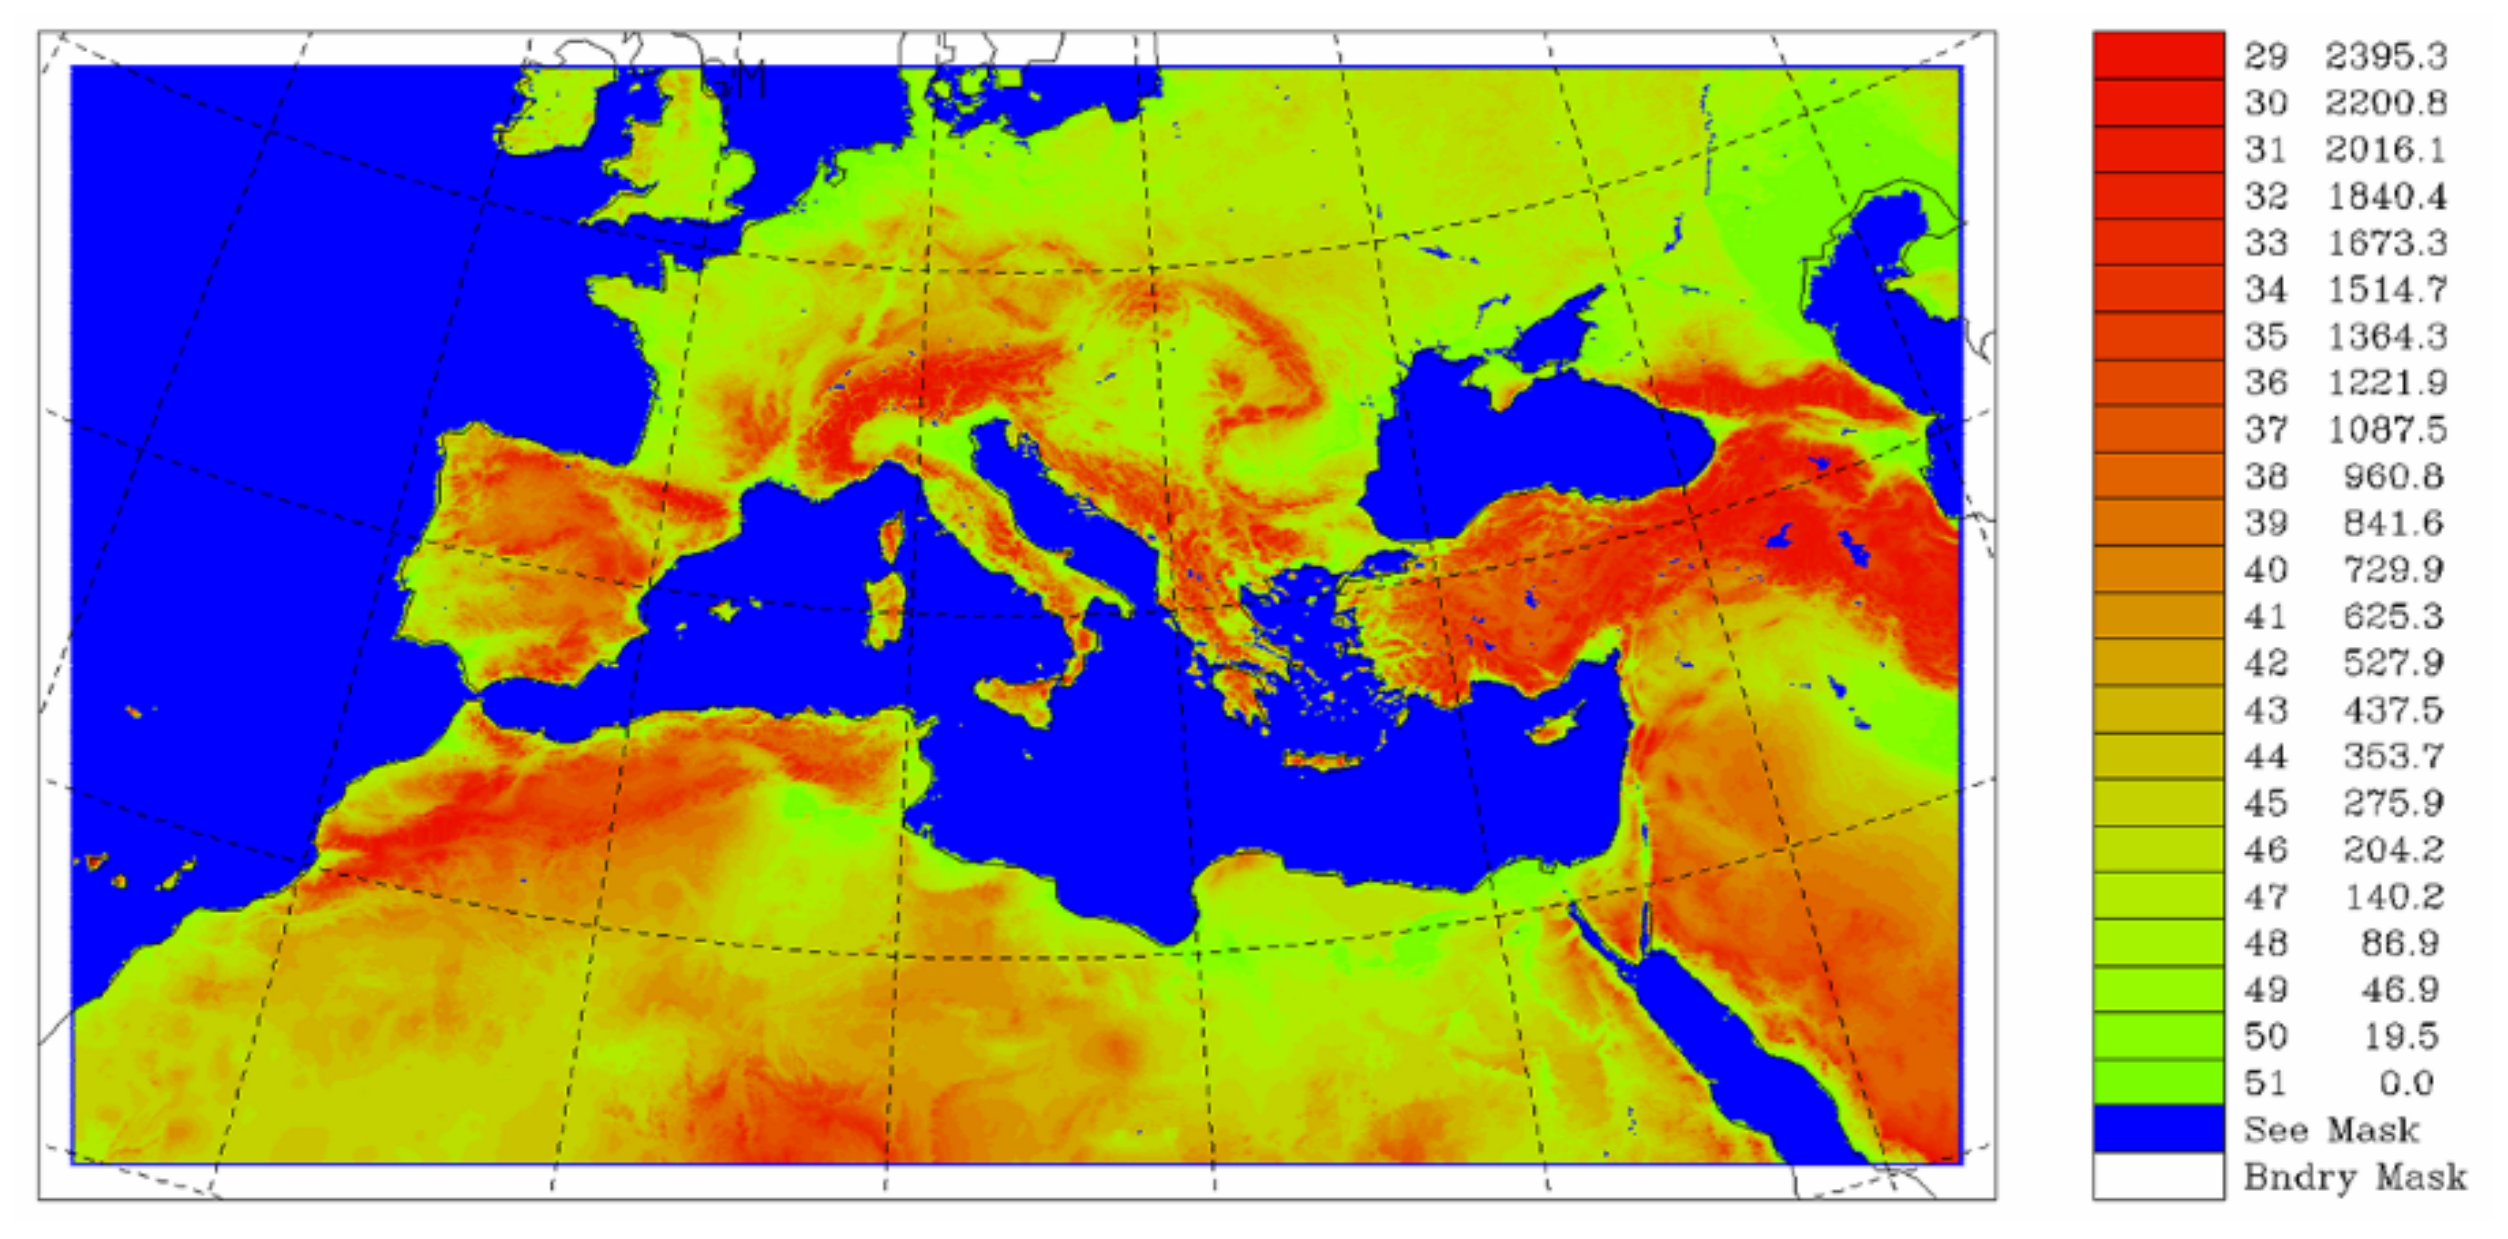
The weather forecasting system consists of the 3D-Var data assimilation model LAPS (Local Analysis and Prediction System; [22]) and the non-hydrostatic version of the ETA model [23]. This system was initially installed during the POSEIDON II project [24] and it runs operationally at HCMR HPC infrastructure since 2008. LAPS creates the initial conditions for driving the atmospheric model by assimilating a number of in situ and upper air measurements. In the framework of implementing the marine infrastructure it was upgraded to the most recent version 0-46-13 including updated decoders and additional assimilated data [25]. It utilizes GFS near-to-analysis forecasts at 0.5° × 0.5° horizontal resolution as background fields merged with a number of METAR, SYNOP and RAOB real time measurements. LAPS is executed every hour providing 24 analyses per day at 15 × 15 km horizontal resolution (Figure 14). The atmospheric model is daily initialized with the 18UTC LAPS analysis, and it provides 114 h of weather forecasts covering the entire Mediterranean and the Black Sea at 0.05° × 0.05° horizontal resolution (Figure 15). The desert dust uptake-transport-deposition processes are also predicted from the atmospheric model but at a coarser resolution of 0.24° × 0.24°. This chain of models requires almost 4 h of execution time to prepare the analysis and the forecasts of various atmospheric and desert dust products for driving sea state and ocean circulation models. Details on the operational configuration of the models are listed in Table 8 and Table 9.

3.2.2. The Circulation Forecasting System

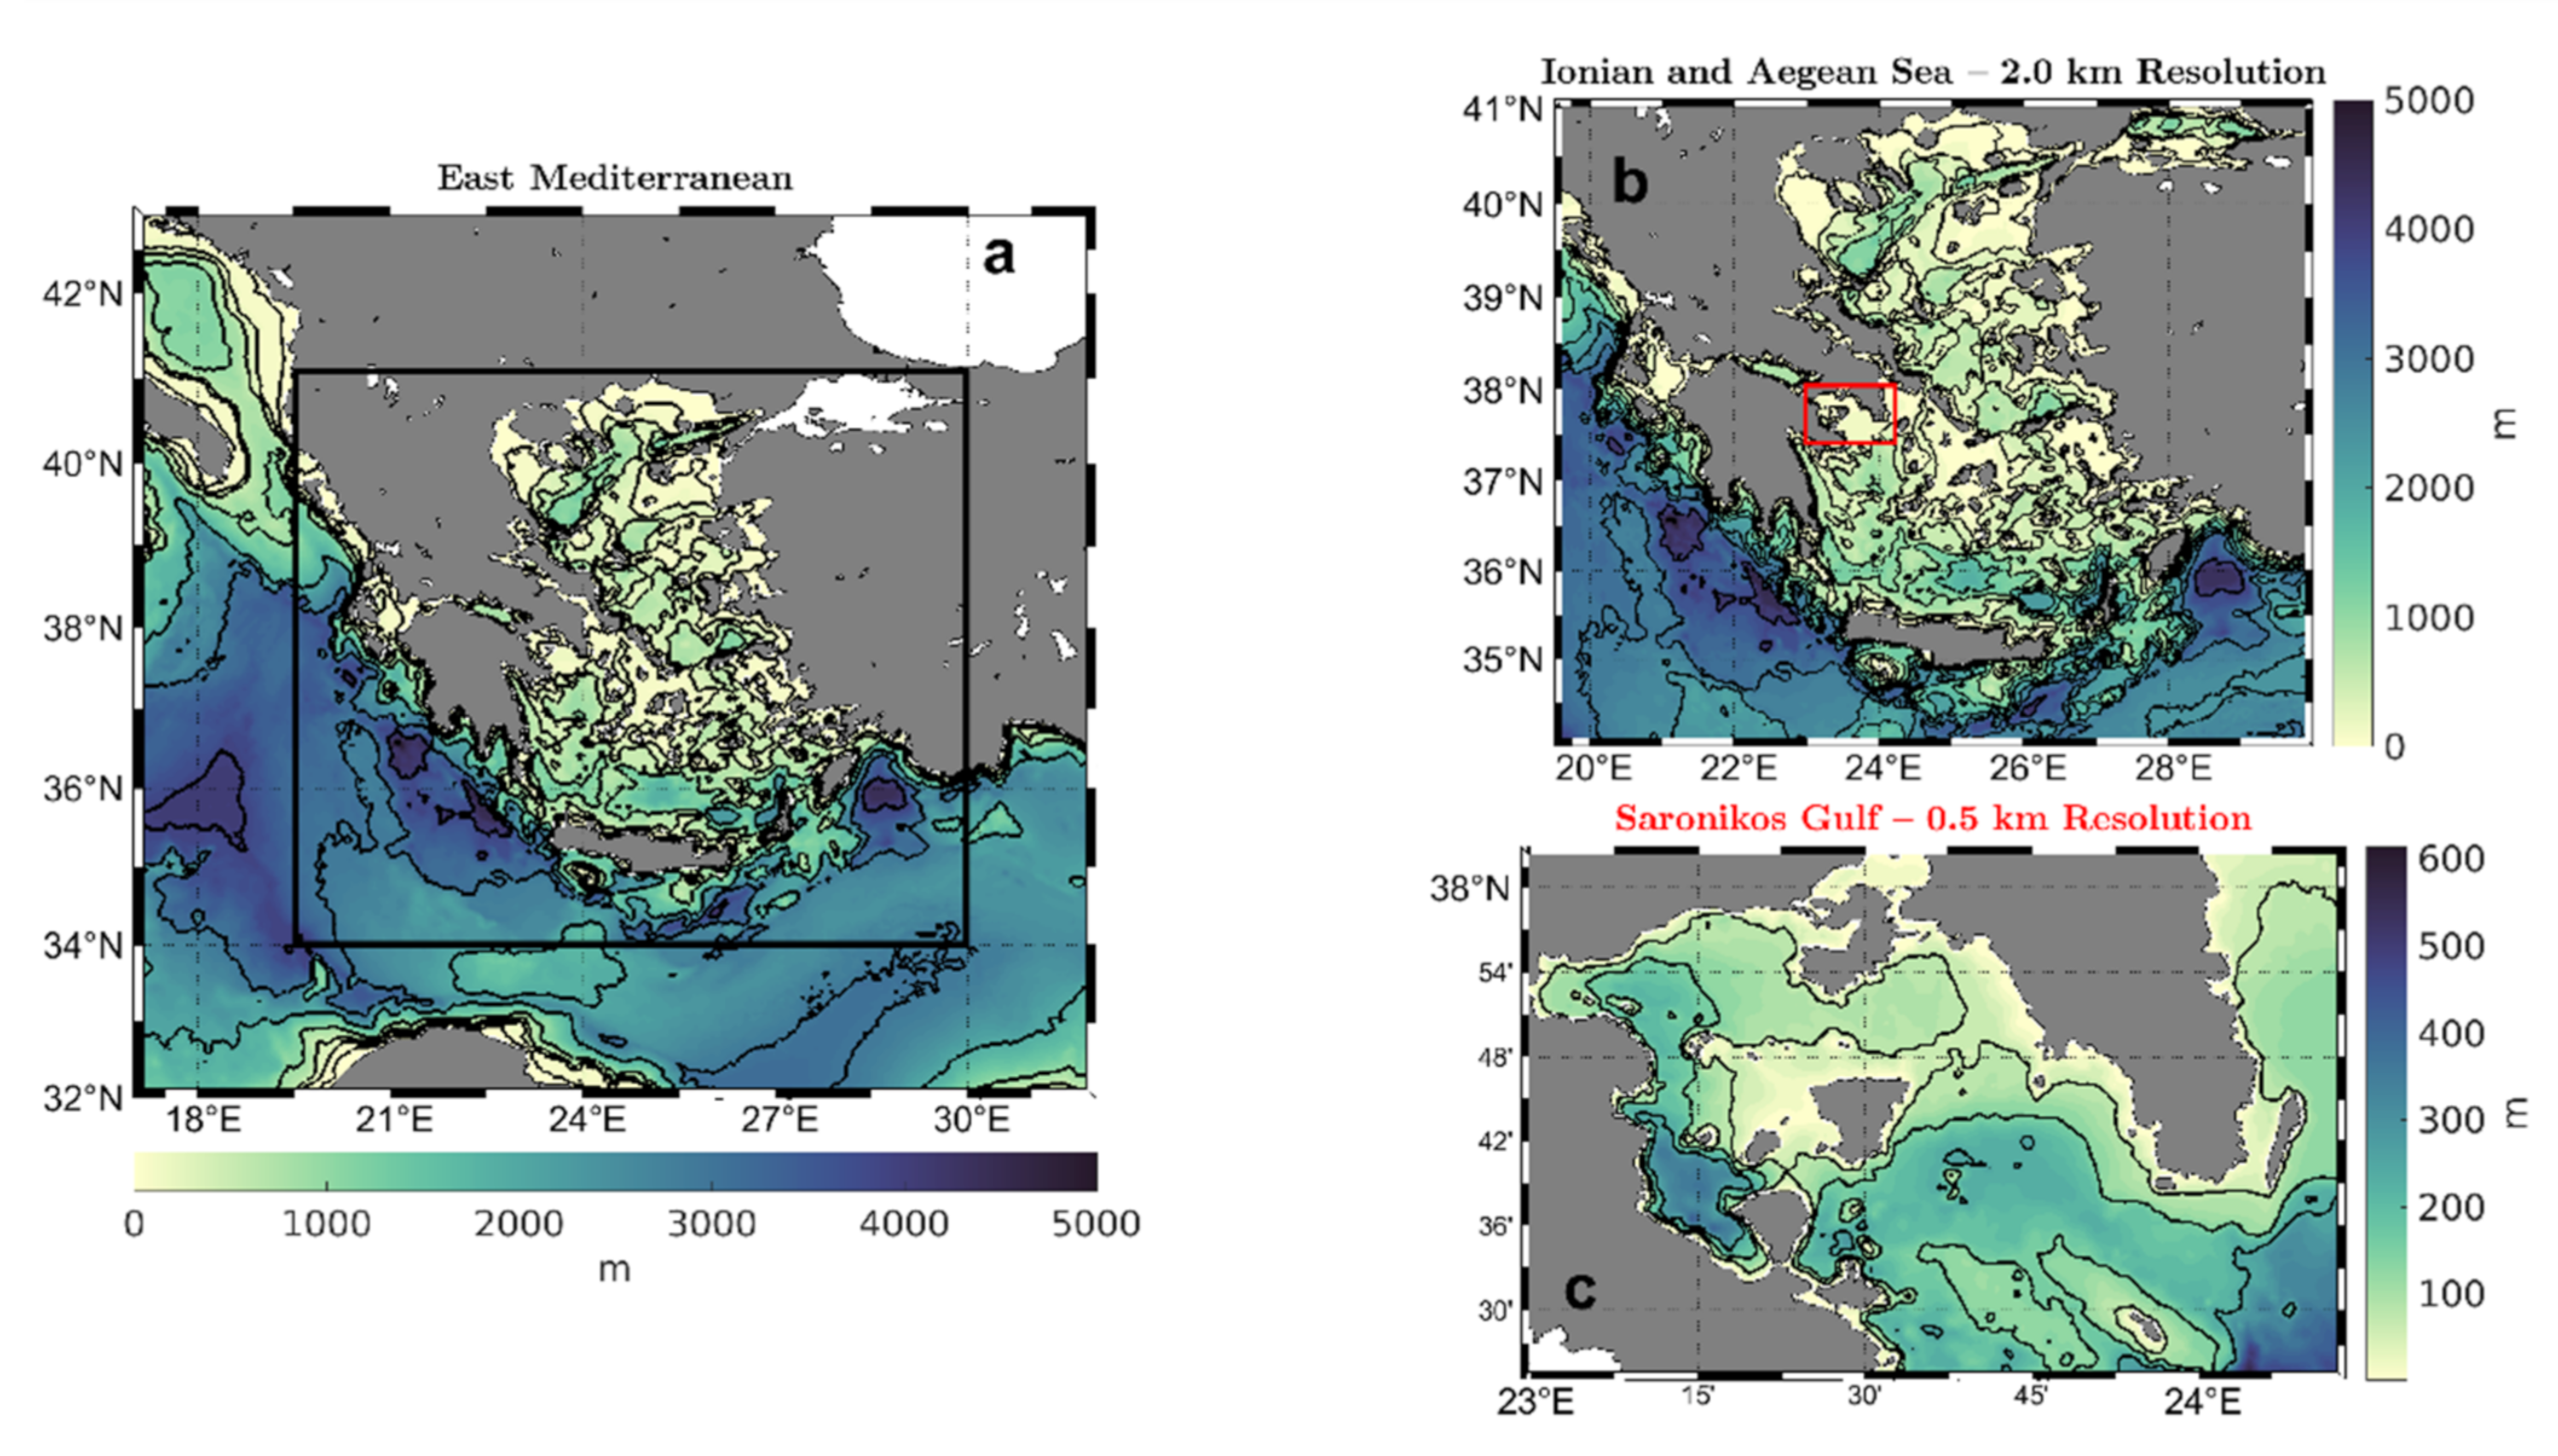
During the implementation of the infrastructure, two forecasting systems were developed, in order to be added to the operational procedure. The first, which represents the main research and development effort, covers the Greek Seas, both Aegean and Ionian (hereafter referred as IAS). The second is offline embedded into the latter and covers the gulf of Saronikos. Figure 16 shows the spatial extent of the systems. The hydrodynamic model of our choice for both systems was the Regional Ocean Modeling System (ROMS version 3.7) [26,27,28].
The IAS model has approximately 2 km resolution at both horizontal directions and 30 vertical sigma levels. Bathymetry comes from General Bathymetric Charts of the Ocean (GEBCO 2014) dataset. For three of the four open boundaries—west, south and east—data from a basin scale model of the Mediterranean are used (CMEMS MED-Currents, EAS5 System). For the northern open boundary—Bosporus Strait—data come from V. Maderich’s (2014) work [29], providing time series with temperature, salinity and velocities for the inflow and outflow interface. Tidal currents and elevation are constructed from the Oregon State University Global Tidal Atlas (TPOX08, [30]). Meteorological surface forcing conditions are derived from the POSEIDON operational weather forecasting system [18,31]. Finally, 17 rivers are included, and their outflow comes from climatological time series of the HYPE model [32]. IAS forecast starts with analysis from a 5-day data assimilation window. ROMS’s four-dimensional variational data assimilation (4DVAR) methodology is used to improve the initial conditions of the ocean state. Currently, the following observations are assimilated: satellite sea-surface temperature (SST), sea level anomaly (SLA) and T/S casts from ARGO floats. A short description of the IAS model is given in Table 10.
The Saronikos Gulf system consists of a two-way ocean–wave coupled model. The hydrodynamic component has 0.5 km horizontal resolution and 20 vertical sigma levels and the three open boundaries—south, east and north—are forced IAS model 5-day forecast data. The wave component uses the SWAN model [33], has the same horizontal resolution (0.5 km) and uses boundary conditions from POSEIDON’s wave forecasting system for the Aegean Sea (WAM cycle 4). A short description is also given in Table 3.

3.2.3. The WAM Wave Forecasting System and Its Quality Assessment

The WAM wave component of the Mediterranean Forecasting Centre (MED-waves) is providing short-term wave forecasts (5 days) for the Mediterranean Sea at 1/10° horizontal resolution. It is based on the state-of-the-art third-generation wave model WAM model recently upgraded to Cycle 4.6.2 which is a modernized and improved version of the well-known and extensively used WAM Cycle 4 wave model [35,36]. Compared to the previous version of the WAM model (Cycle 4.5.4) used in the previous version of the POSEIDON system, WAM Cycle 4.6.2 permits different depth scaling (deep–shallow) for the calculation of the nonlinear wave–wave interactions. WAM solves the wave transport equation explicitly without any presumption on the shape of the wave spectrum. Its source terms include the wind input, whitecapping dissipation, nonlinear transfer and bottom friction. The wave model grid is implemented over the whole Mediterranean Sea at 1/10° horizontal resolution and is driven by 10 m hourly wind forecasts provided by the upgraded weather forecasting system. At this horizontal resolution (1/10), the Mediterranean model runs in deep water mode while the wave spectrum is discretized using 30 frequencies, which cover a logarithmically scaled frequency band from 0.05 Hz to 0.7931 Hz (covering wave periods ranging from approximately 1 s to 24 s) and 24 equally spaced directions (15 degrees bin).
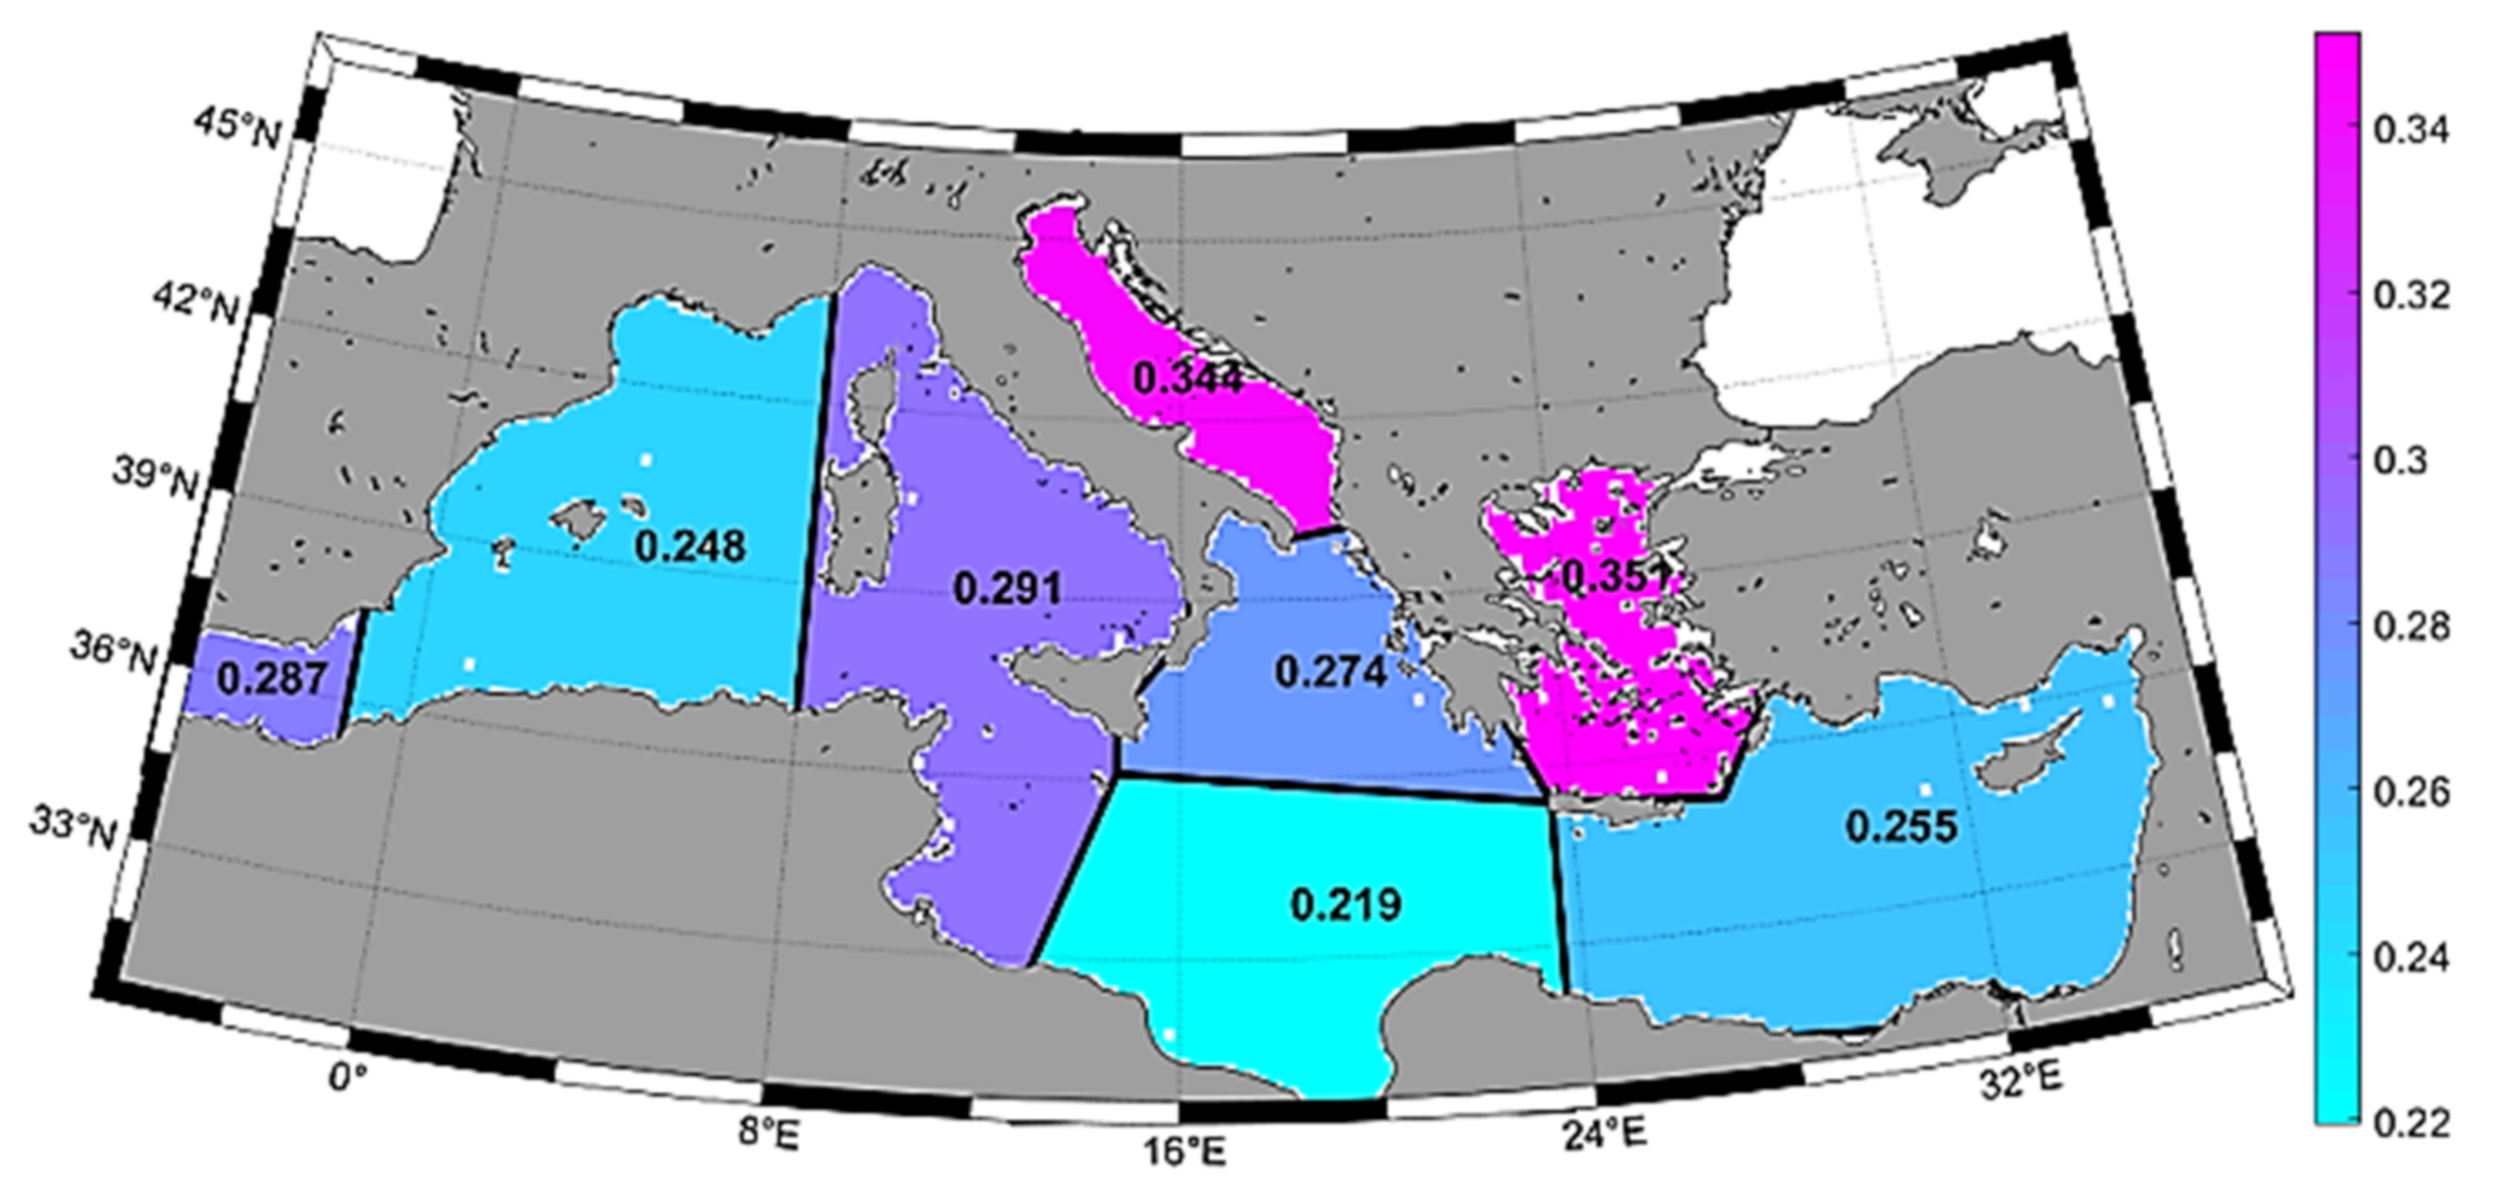
In order to assess the quality of the WAM based wave forecasts for the first 24 h (+0 lead time), the wave forecasting system has been integrated for a one-year period (January–December 2020) driven with POSEIDON winds supplied to the WAM model at hourly intervals. The quality of the SWH forecasts is checked using along-track SWH observations from all available satellite altimeters over the Mediterranean Sea (WAVE_GLO_WAV_L3_SWH_NRT_OBSERVATIONS_014_001 CMEMS product). The scatter index (defined as the standard deviation of the difference between predicted values and observations normalized by the mean of the observations is a measure of the size of the deviation of forecasts from observations relative to the magnitude of the observations—a smaller scatter index value means better forecasts) is estimated for eight different areas of the basin and shown in Figure 17. It varies between 0.219 (southern Ionian basin) and 0.291 (Tyrrhenian and Sicilian plateau) to values higher than 0.34 in the Adriatic and the Aegean Seas due to their complexity (orography, topography, coastlines) and the poorer performance of the POSEIDON winds. In order to further increase the skill of the wave forecasting system, future developments will include the data assimilation of along-track SWH observations based on Optimal Interpolation and spectrum rescaling, and an upgrade to WAM Cycle 6 and tuning between different options of WAM physics (wind source and wave dissipation terms) offered in this latest Cycle 6.

3.3. Coastal Zone Management

Coastal regions provide a home for the EU population and shelter for rich biodiversity, while boosting our economies. To protect and preserve this vital land–sea interface it must be managed in a way that balances the conflicts created by human activity with the need to ensure a healthy and resilient ecosystem. Therefore, interdisciplinary research is necessary for effective management, whereas monitoring and assessment based on scientific knowledge is the indispensable basis for the integrated management of human activities, in view of promoting the sustainable use of the seas and coasts.
NKUA, responsible for the coastal zone component of marine research infrastructure, enhances capacities towards integrated research and management of coastal environments (beach zones, river deltas, enclosed gulfs, lagoons), considering present human environmental pressures and climate change phenomena. The Laboratories of NKUA, Laboratory of Environmental Chemistry/Department of Chemistry (LEC-NKUA), Laboratory of Physical Geography/Faculty of Geology and Geoenvironment, the Ocean Physics and Modeling (OPAM) group/Department of Physics, Section of Zoology–Marine Biology/Department of Biology, are fully equipped with infrastructure necessary for the monitoring of the coastal zone. During the implementation of the national research infrastructure, NKUA infrastructure was upgraded and maintained.
Human-induced eutrophication causes adverse effects such as losses in biodiversity, ecosystem degradation, harmful algae blooms and oxygen deficiency in bottom waters. In order to be able to assess the eutrophication status of coastal regions, data on nutrient levels and their direct effects (e.g., chl-a concentration, phytoplankton abundance and composition, water transparency) and indirect effects (e.g., oxygen concentration, macrophytes) is essential. To measure nutrients and chlorophyll-a in aquatic samples, double beam UV-VIS spectrophotometers are used and established spectrophotometric methods are applied (Table 11) [37]. Various studies of nutrients in coastal areas have been carried out by LEC-NKUA over the years [38,39].
The study of the coastal zone often requires groundwater monitoring. A basic parameter that is crucial for the interactions between the coastal marine area and the shallow aquifers is the level of Cl content (Table 11) indicating saline intrusion, as attested in the Pinios deltaic area due to excessive consumption of ground water for agricultural irrigation [40].
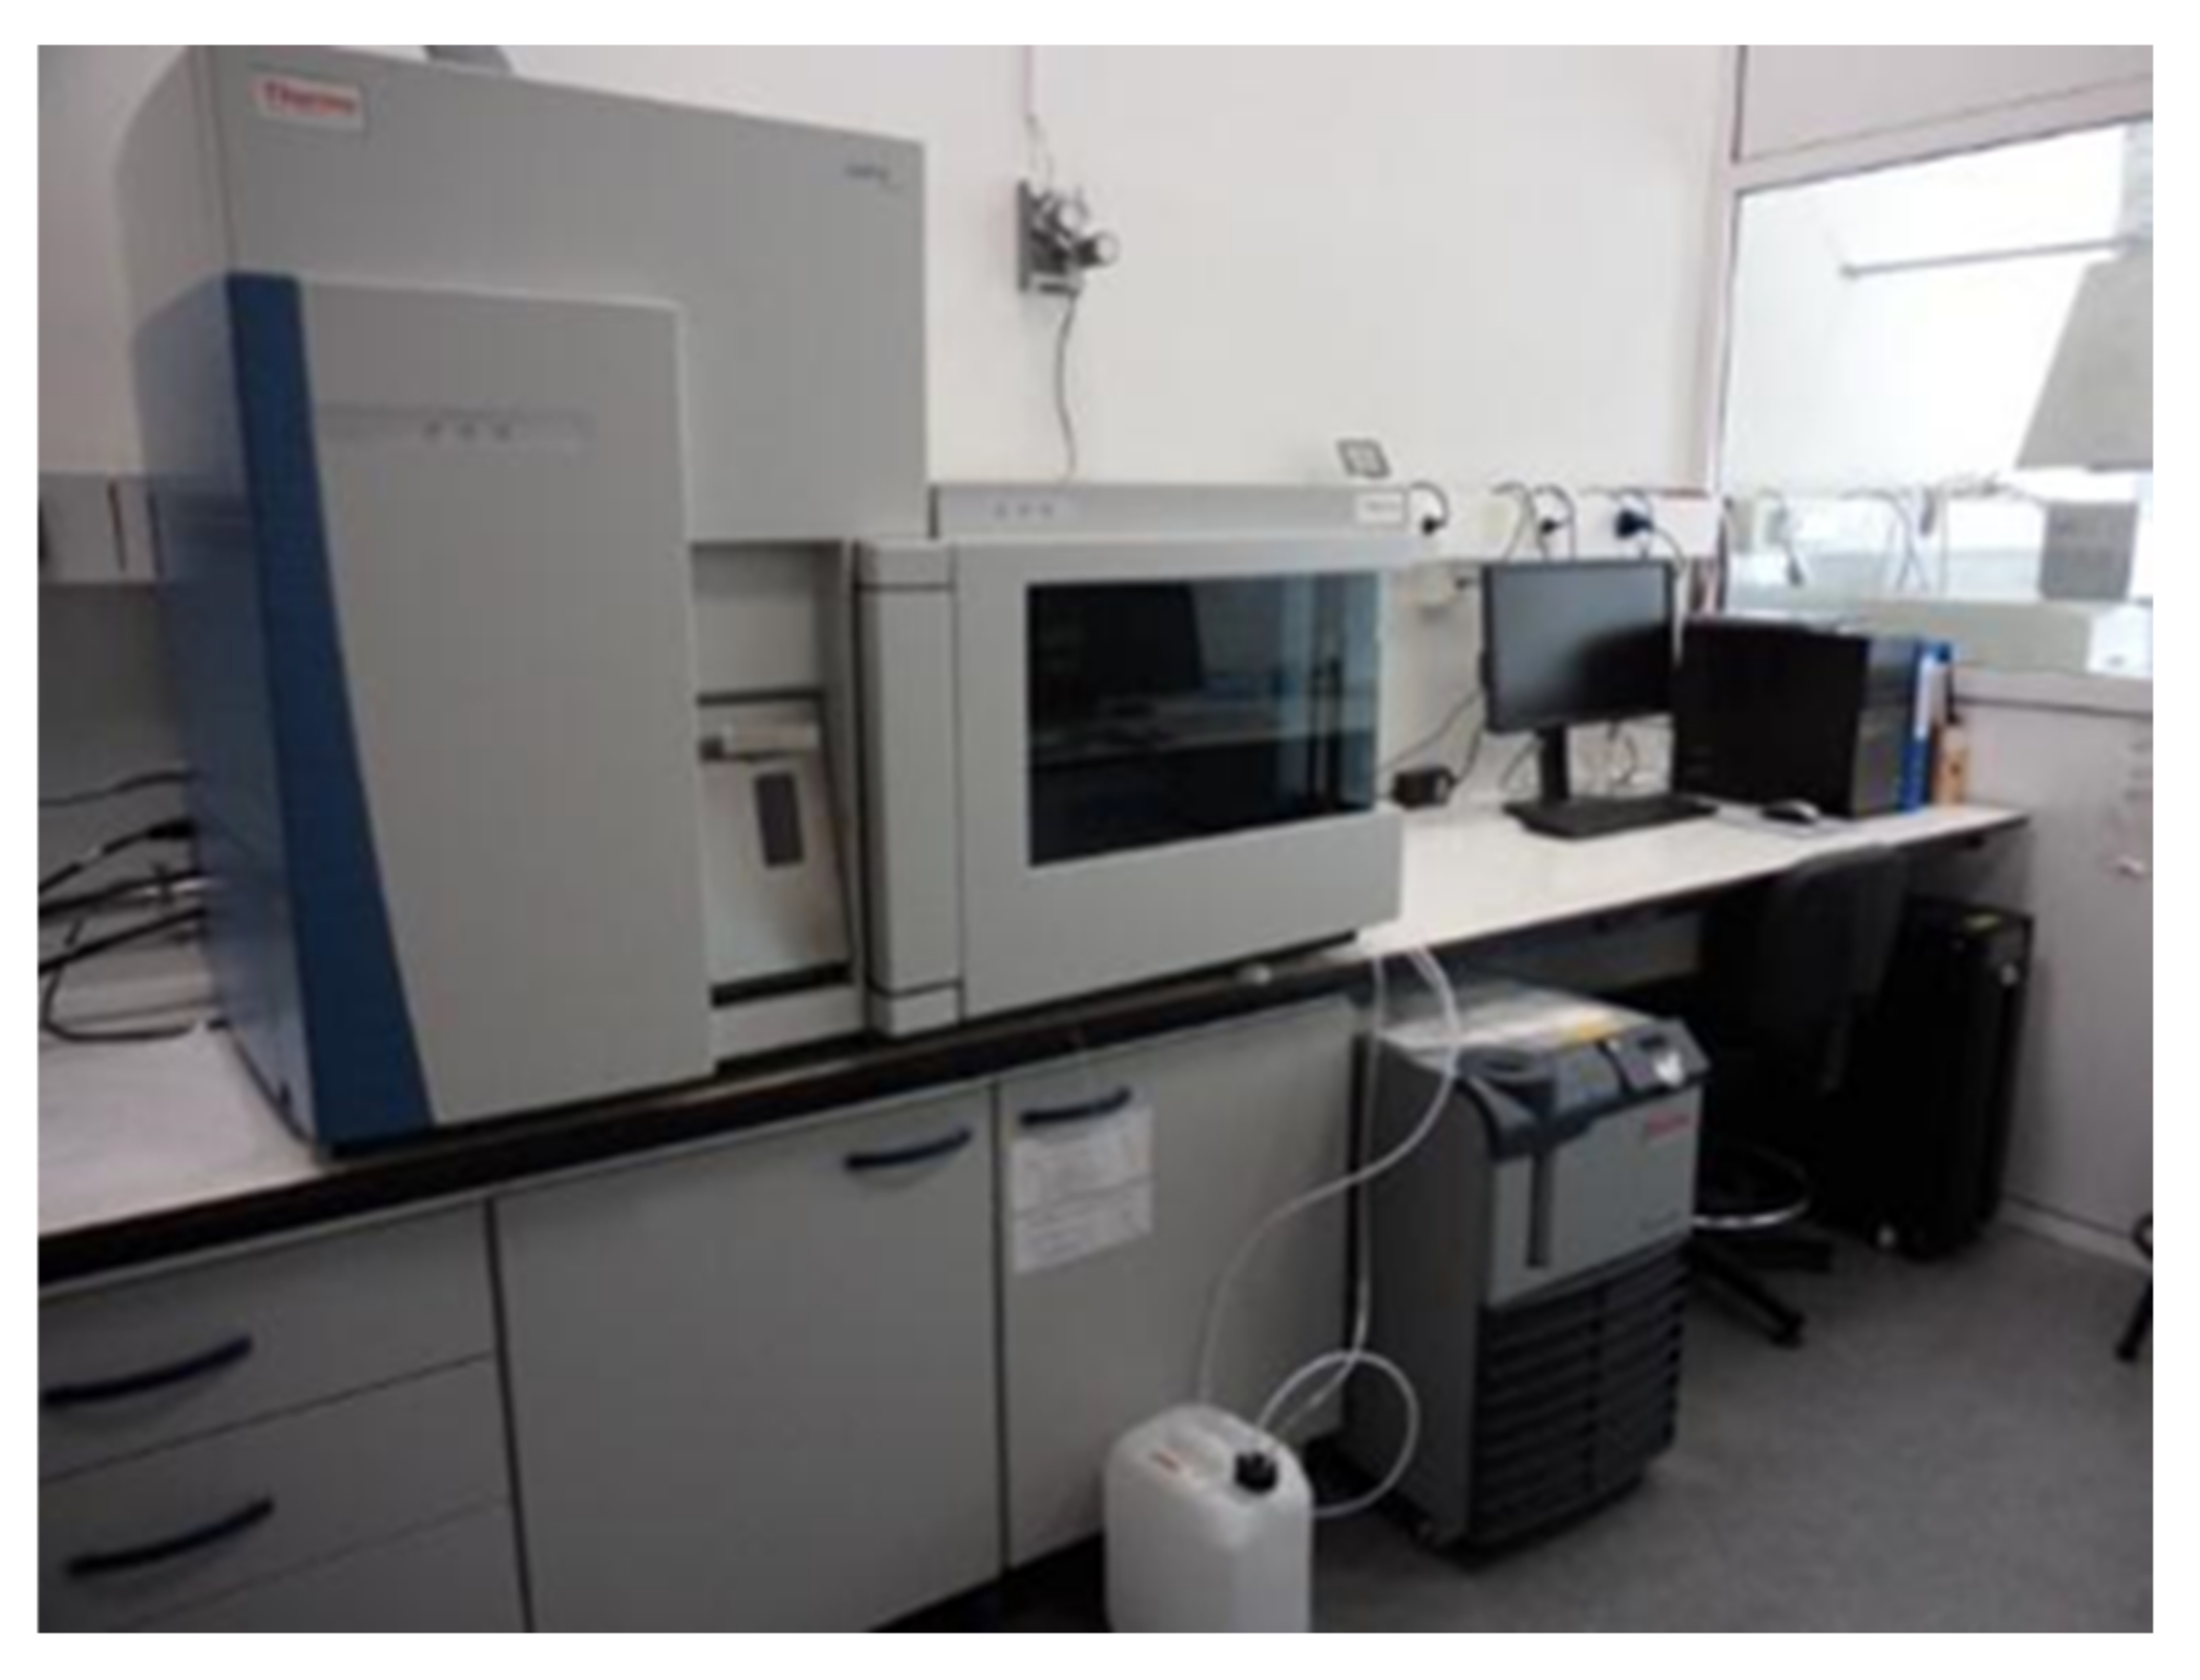
Different anthropogenic pressures affect species, habitats or ecosystem functions whereas coastal water and sediment quality are compromised due to contaminant input. Reliable and accurate measurements of elements at trace and ultra-trace concentrations (Table 11) are needed in a variety of research activities. LEC-NKUA utilizes conventional atomic absorption spectrometers and inductively coupled plasma-mass spectrometry (ICP-MS) for the determination of multiple elements in various contaminant monitoring and bioaccumulation studies [42,43,44,45,46]. Inductively coupled plasma-mass spectrometry (ICP-MS) (Figure 18) is a powerful technique to measure the level of trace metal contamination and assess environmental status, and is advantageous in that ionization is more complete as it occurs in a chemically inert environment, preventing oxide formation. Measurements of multiple metal or metalloid elements (i.e., Al, Ba, Cd, Co, Cr, Cs, Cu, Fe, Ga, Mn, Ni, Pb, Rb, Sr, Tl, V, Zn and As) are carried out in a single collision cell mode, with kinetic energy determination (KED) using pure He [47].
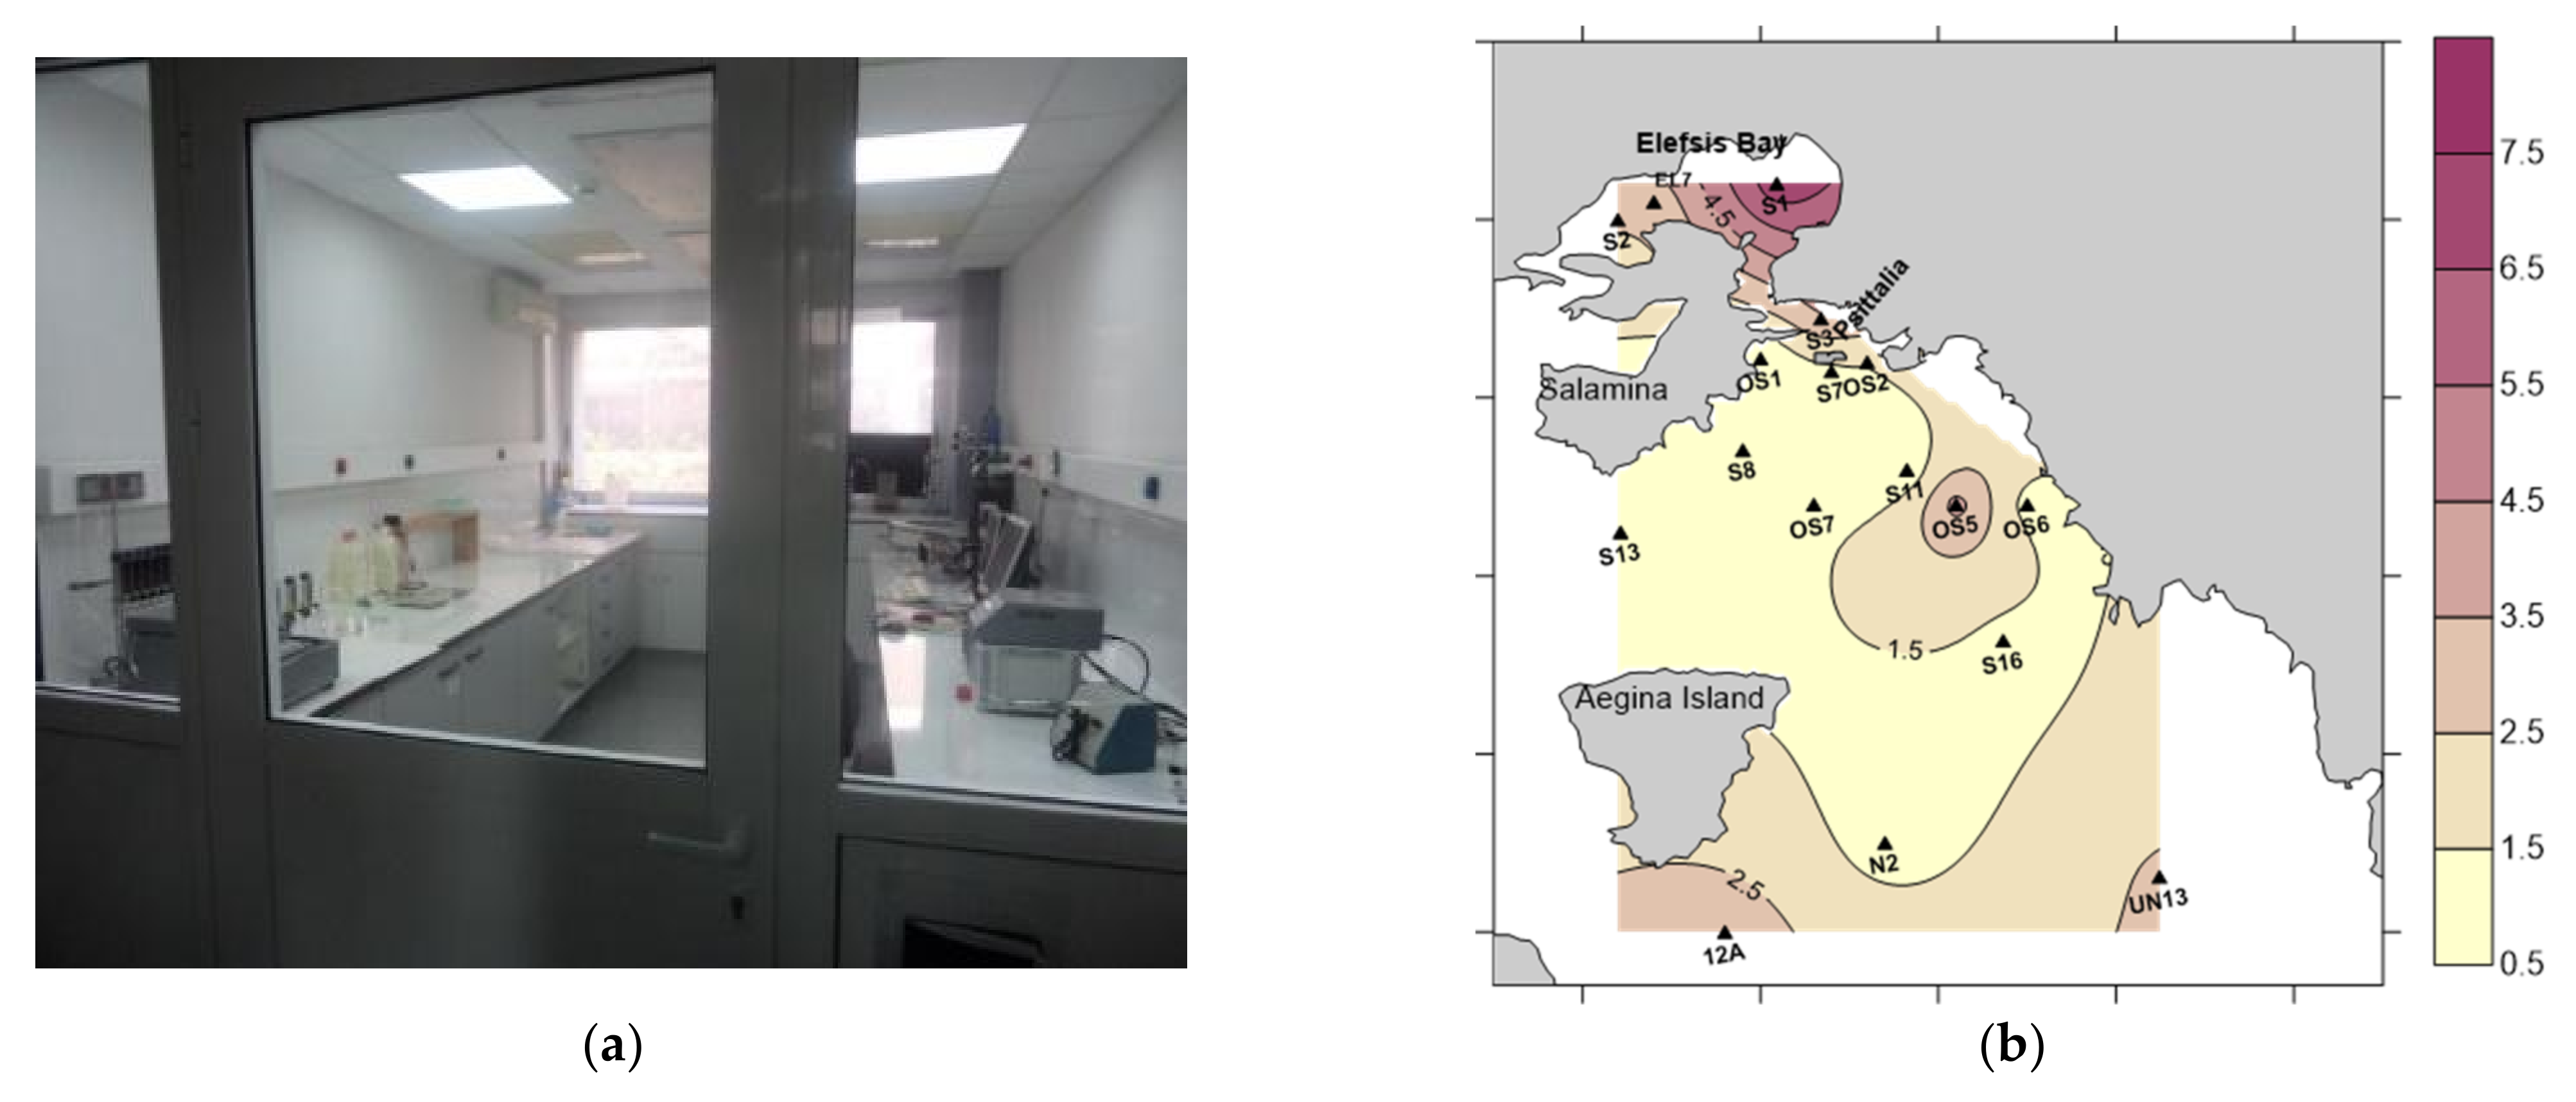
In addition, the ultra-trace and trace analysis of metals including mercury in environmental samples from coastal areas [48] is performed in the laminar flow cabinet CLEAN ROOM (Table 11) (Figure 19a) in a controlled environment to meet the demands of such analyses for limiting systematic errors and controlling contamination of samples through particulate matter from the laboratory environment. The determination of Total Hg, i.e., all BrCl-oxidizable mercury forms and species found in an unfiltered seawater sample, is carried out by the EPA 1631 method [49]. The measurement consists of the oxidation of all species to Hg(II), purged and trapped onto a gold cartridge, followed by desorption and cold-vapor atomic fluorescence spectrometry. The limit of quantification for Total Hg achieved is 0.2 ng/L. Surface spatial distribution of dissolved Hg in the Saronikos Gulf was investigated showing the highest Hg concentration levels in the enclosed Elefsis Bay [50] (Figure 19b).
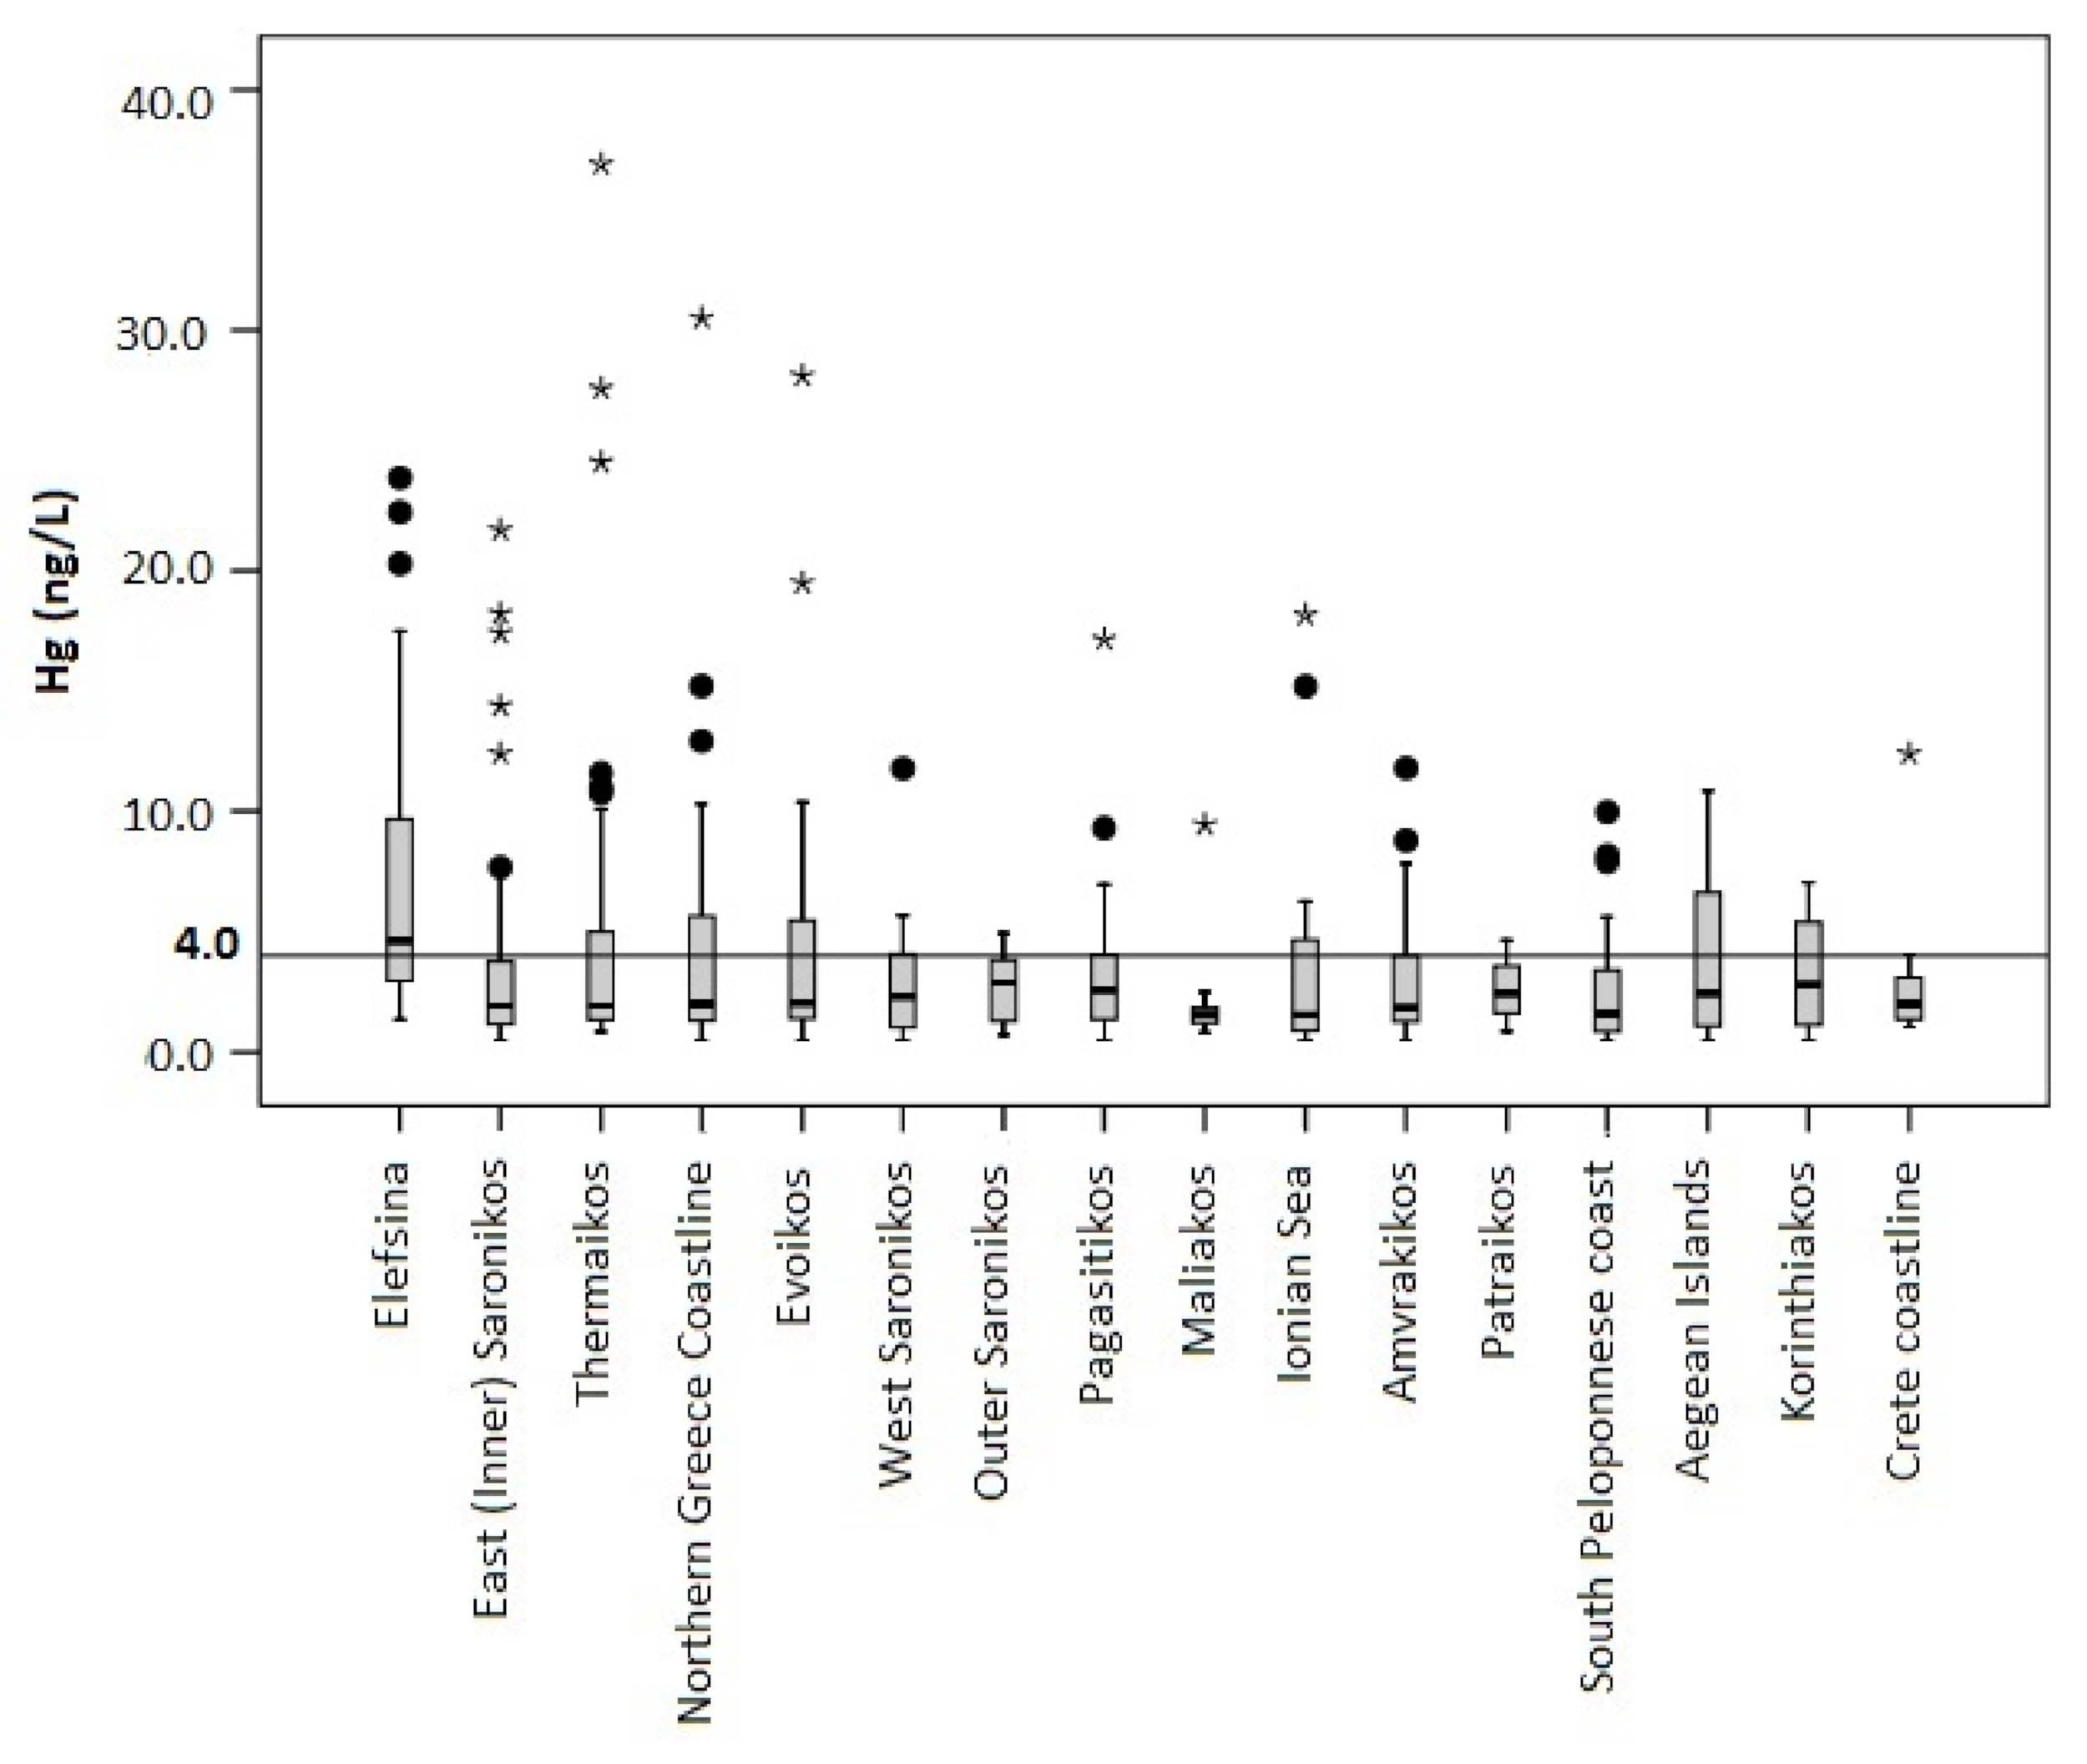
A preliminary analysis of 580 seawater samples, collected from Greek coastal areas in the framework of WFD monitoring (2012–2020), shows that the Hg levels were well below the European Legislation threshold of 70 ng/L (EC 2013/39), as median Hg concentration was calculated at 2.2 ng/L (Figure 20). Values above 4 ng/L and extremes were attributed to pollution hot spots [51].
Sampling in the coastal areas monitored (Table 12) for the analyses mentioned above is performed using portable field equipment belonging to NKUA (Table 11), for in situ measurements of the necessary physicochemical parameters.
Marine biodiversity is undergoing rapid alteration under the combined pressures of human impact and climate change [52]. Monitoring of the whole range of species and habitats is required in order to adopt measures to protect the ecosystem as a whole. An underwater (up to 200 m depth) and an aerial drone, added to NKUA field equipment in the framework of the HIMIOFoTS project, are used for monitoring the marine environment and recording its organisms. They form an easier, faster and cheaper method for collecting data with sensors for measuring different parameters (e.g., water temperature, depth, etc.), recording marine organisms (Table 13) (e.g., fish, jellyfish, marine mammals, etc.) or undersea regions that are difficult to investigate and provide reliable scientific results (Figure 21).
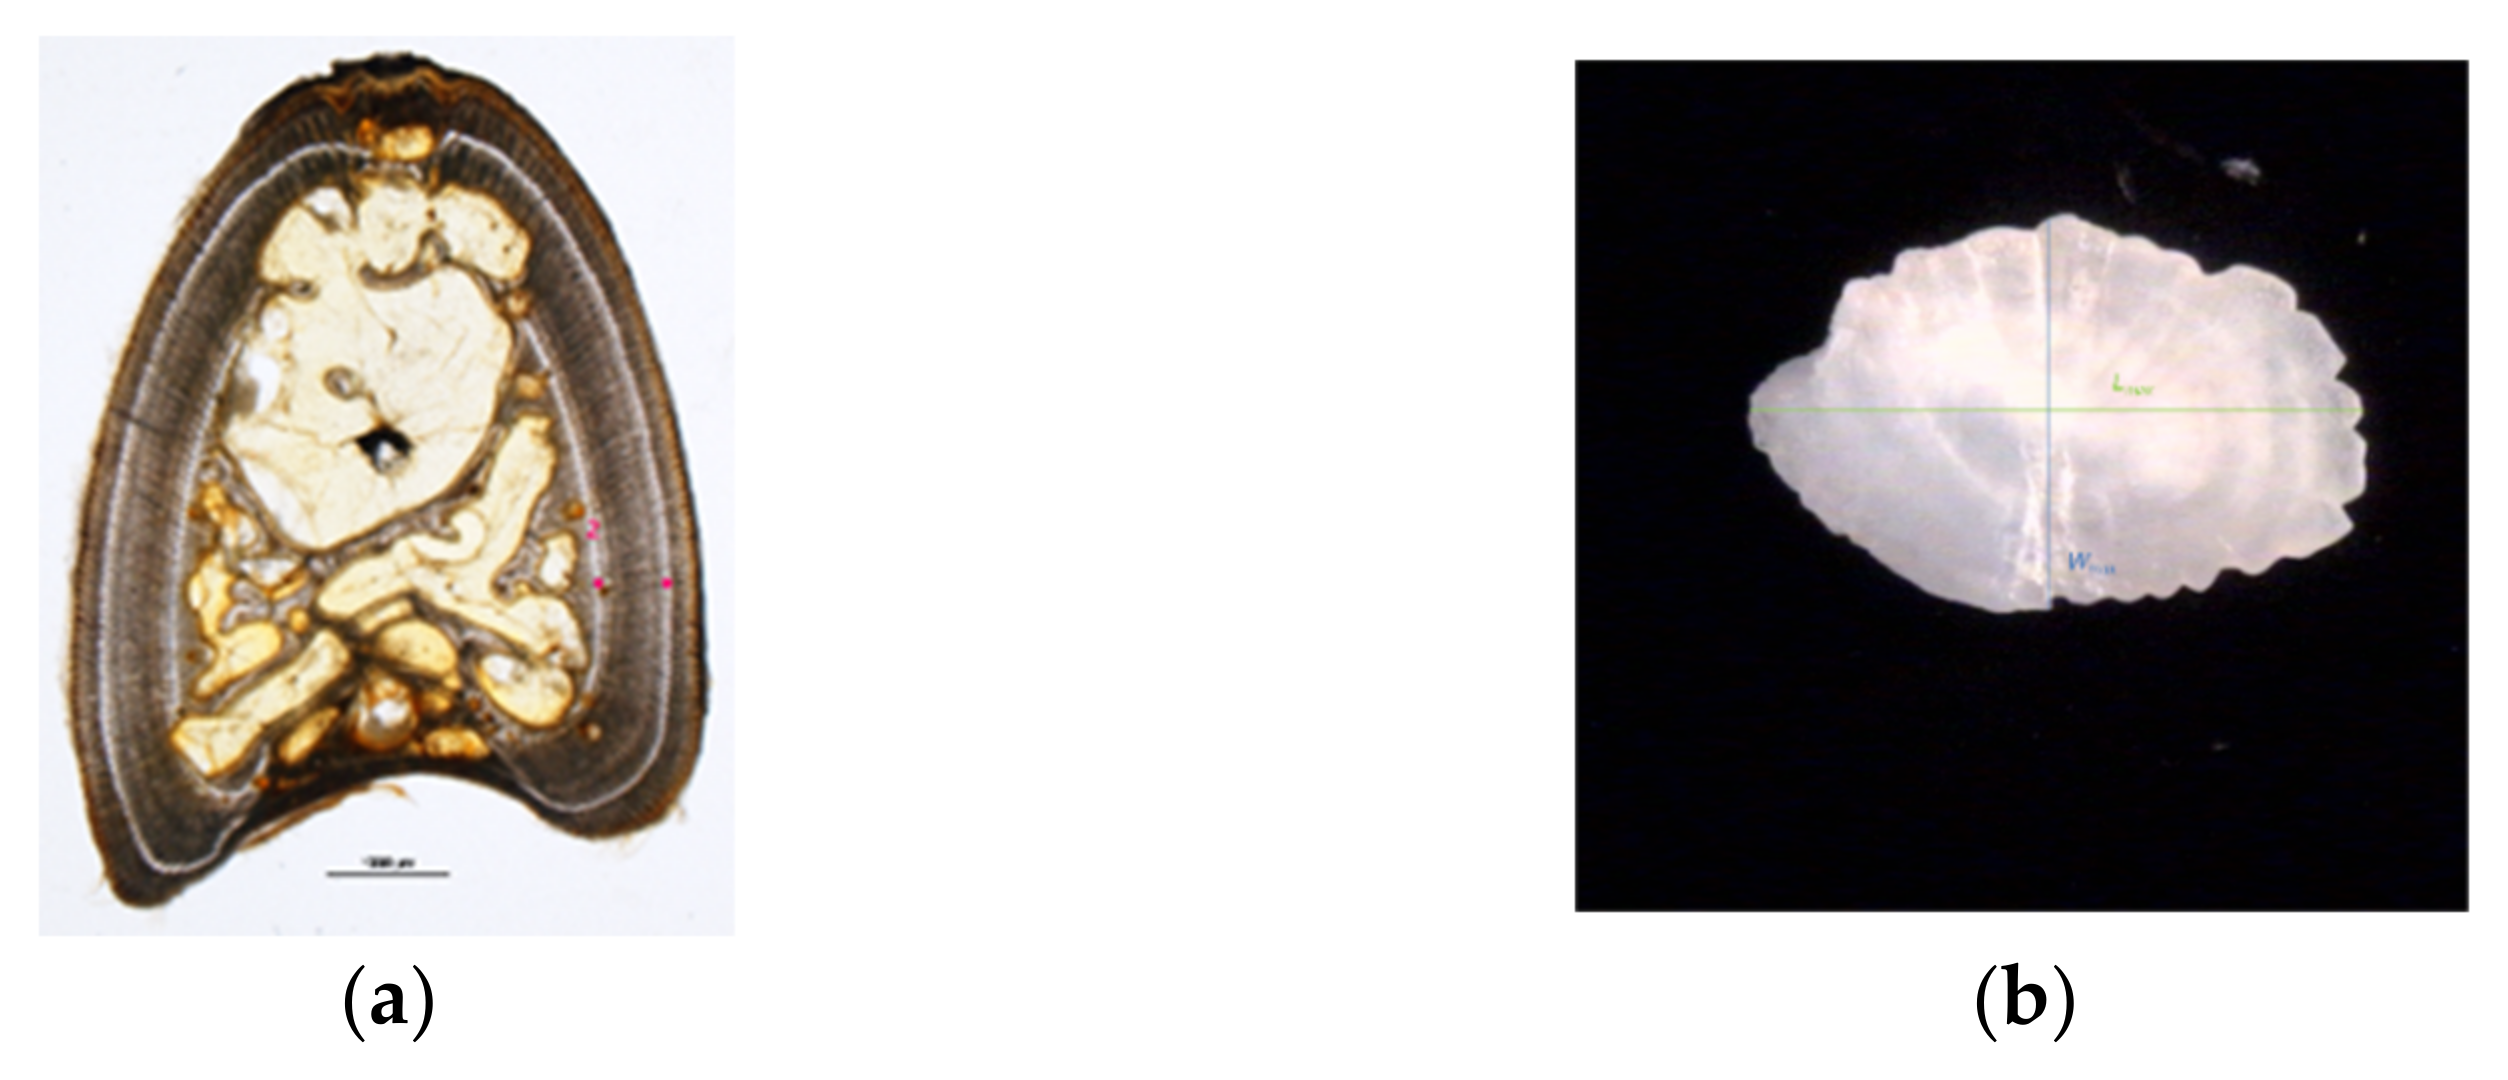
Age and growth information is essential for the monitoring of fishery resources and forms an essential component of models used in stock assessment, as it informs population analysis. There are many biological studies concerning the age and growth of various fish species [53,54,55,56], in which age was estimated by counting the annuli of calcified structures (e.g., scales, otoliths, spines, vertebrae, etc.) combined with model analysis of length frequencies. The Image Analysis System (Table 13) allows counting, measuring (length, width, perimeter, area, density), and classifying organisms with high accuracy. Moreover, it is used for age estimation by counting growth bands in calcified structures (e.g., scales, otoliths, spine sections) (Figure 22a)and for viewing histological sections Quantified data can be extracted from images using a variety of measurement options (Figure 22b).
The age and growth of fish can also be estimated by tagging experiments [57]. Archival Tags added to NKUA field equipment in the framework of the HIMIOFoTS project are attached to marine animals (e.g., large pelagic fish) and provide data on the temperature, salinity, and depth of the water where the tagged animals swim, bearing a tiny computer that records and stores the data. They also record data such as light levels, heart rate, and swimming speed (Table 13). From the light intensity data and the use of appropriate software, the horizontal movements of the tagged animal can be tracked (Figure 23).
Understanding reproductive characteristics of fish that affect population recovery and natural mortality is essential for conservation management planning [58]. For this reason, a microtome, water bath and paraffin embedding system (Table 13) is used for the histological analysis of organisms.
Monitoring of physical characteristics, such as bathymetry and morphology of the seabed, gives background information on hydrographical conditions and provides information on sea floor integrity with the assessment of the extent of the area affected by alterations due to activities or infrastructures. The single beam echosounder coupled with Sidescan Sonar (Figure 24 and Table 14), added to NKUA field equipment in the framework of the HIMIOFoTS project, is a system used for recording bathymetry and performing sea-bottom habitat classification.
A wireless Autonomous Weather Station (Table 3), which reproduces and displays weather data, was serviced and maintained during the implementation of the project. The station can be further integrated with an Autonomous Beach Imaging System [59], that can monitor high-frequency beach (and shoreline) changes [60]. The recorded images provide information on the position of the coastline and the nearshore morphological features. In addition, time-stack images processing generates time series information on swash excursions and wave run-up.
Moreover, portable pieces of equipment are also used for coastal monitoring surveys: A portable Tide Logger for recording water levels and temperatures in the sea, shallow wells, streams and lakes, a Portable Wave Logger, as well as water and sediment samplers.
Coastal zone monitoring forms a concrete basis of sound scientific knowledge regarding the highly dynamic and constantly changing coastal resource system. It contributes to the appropriate implementation of Integrated Coastal Zone Management and the associated EU legislation relating to the marine environment such as the Marine Strategy Framework Directive (2008/56/EC) and the Marine Spatial Planning Directive (2014/89/EU) [61,62,63]. In addition, a thorough approach to coastal zone issues not only assists competent authorities and decision makers in the implementation of EU legislation [64,65], but also informs the EU on the delivery of Member States’ obligations and consequent policy efficiency [66,67,68].

3.4. The Marine Land-Based Facility for Testing and Marine Engineering

The Hellenic marine research infrastructure links the ocean observing and forecasting systems to ocean engineering testing facilities. The main infrastructure is the wave towing tank of the Laboratory of Ship and Marine Hydrodynamics at the National Technical University of Athens (Figure 25). The basin measures 100 × 5 × 3.5 m, is unique in Greece, and has been operational since 1979 (member of the international ITTC union and HELLAS LAB).
The tank is equipped with a wavemaker that can create realistic unidirectional sea states corresponding to the wave climate observed or forecasted by the relevant HIMIOFoTS systems. The seakeeping qualification of ships and other floating structures in rough seas are studied either experimentally in the wave tank or analytically using refined computer codes, in order to determine quantitatively whether a ship or a floating structure satisfies criteria such as passenger comfort, crew effectiveness, operational characteristics (for naval or other special ships) and strength of the ship structure. Moreover, ship and propeller models are used to conduct experiments on ship resistance, flow visualization around the hull and the appendages, wake measurements, propeller characteristics in open water and, finally, self-propulsion. The facilities can be used for the:
  • Calibration of wave buoys, floats and sea current meters.
  • Examination of the floatation and performance of submerged instruments such as ocean gliders.
  • Hydrodynamic design of buoys, floaters, conventional ships (design of hull forms, bulbous bows, sponsons, appendages, etc.).
  • Reproduction of the wave climate in a sea region and determination of the corresponding ship operability.
  • Hydrodynamic design of modern ships (fast and planning ships, single hull and catamaran).
  • Design of ship propulsion systems. Optimization of the ship lines with respect to her seakeeping qualities.
  • Special measurements on board of ships and floating structures using modern data acquisition systems.
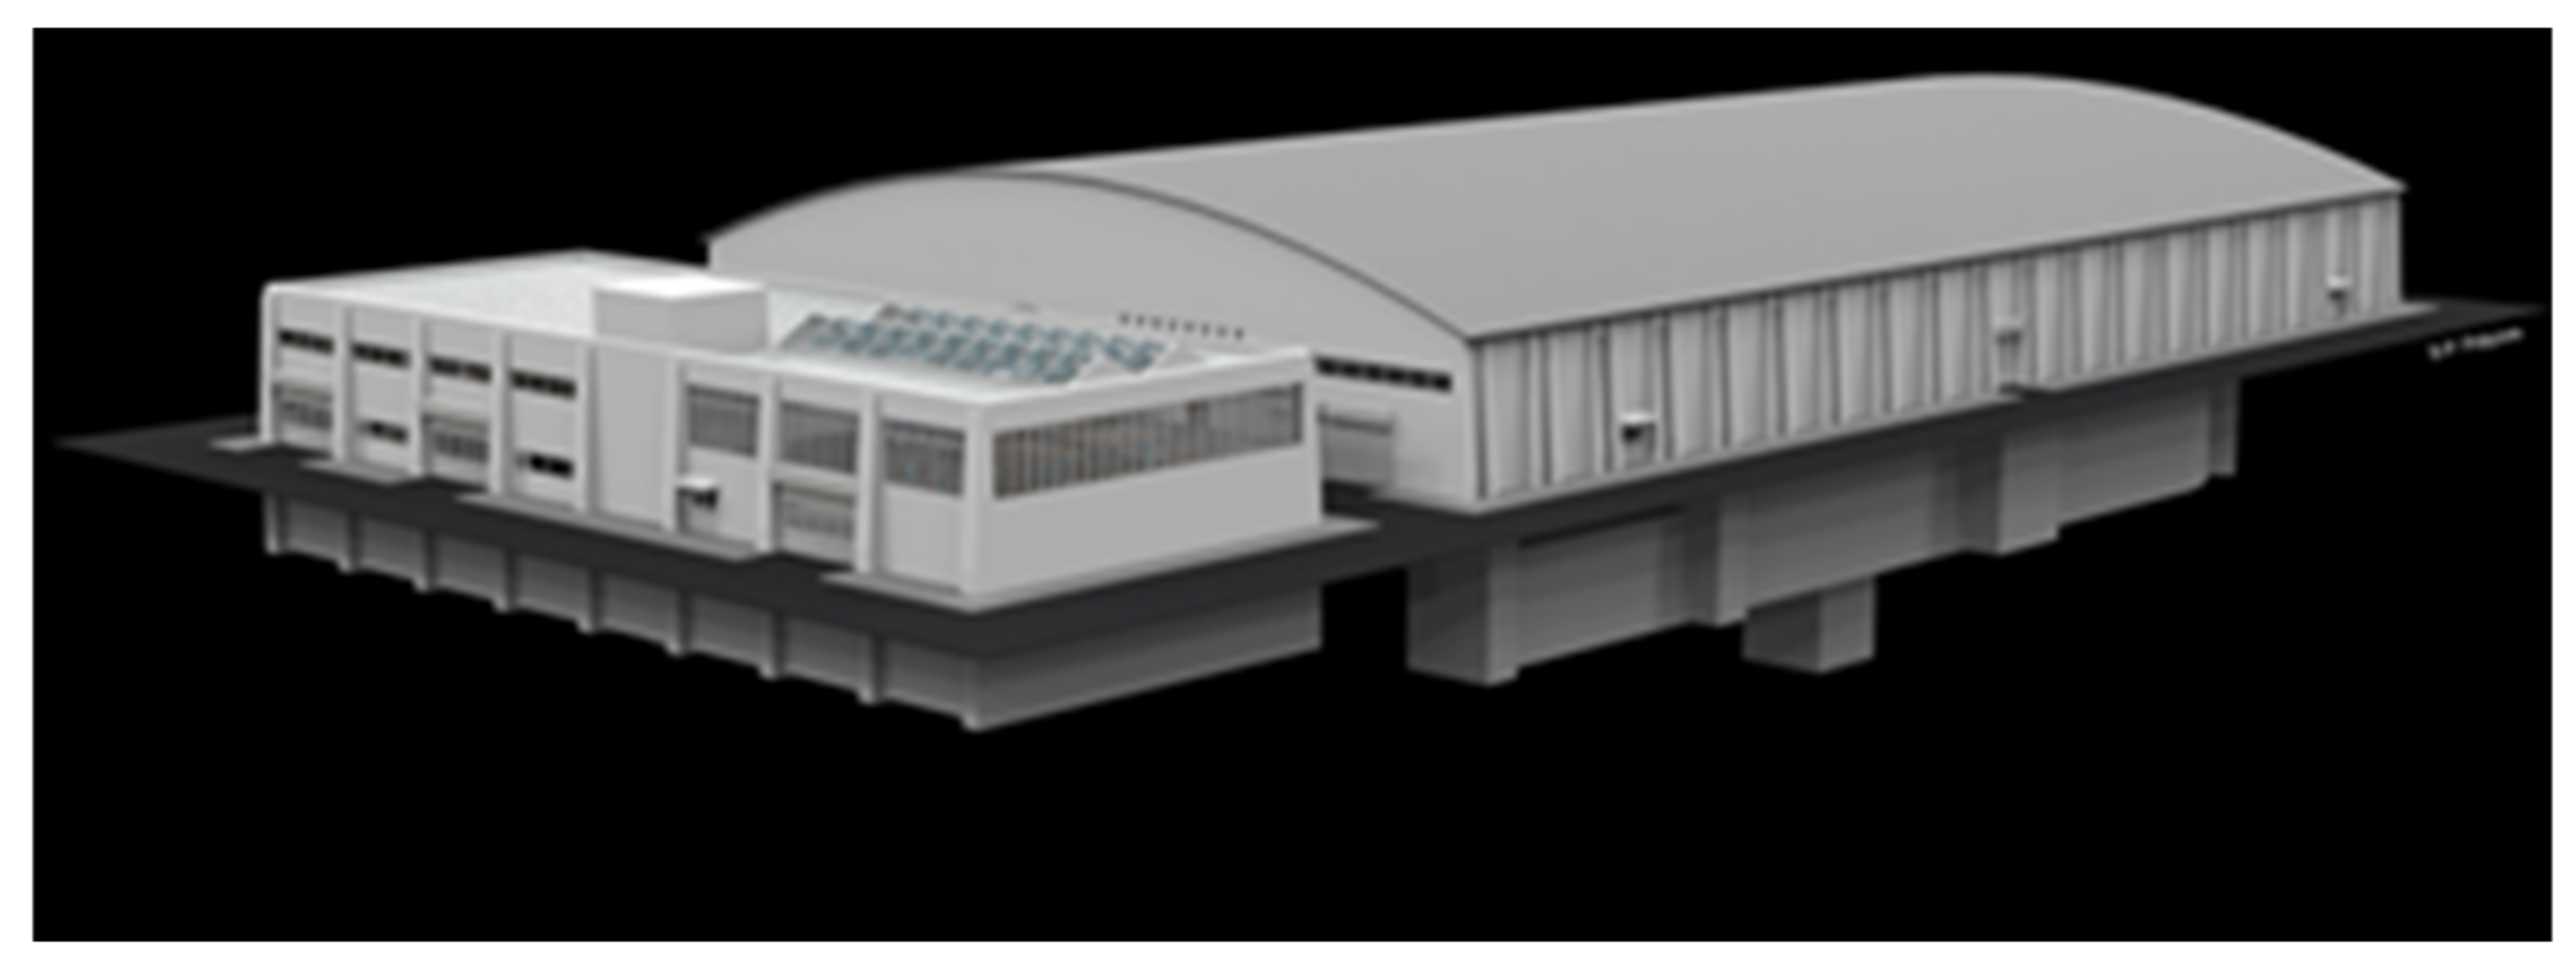
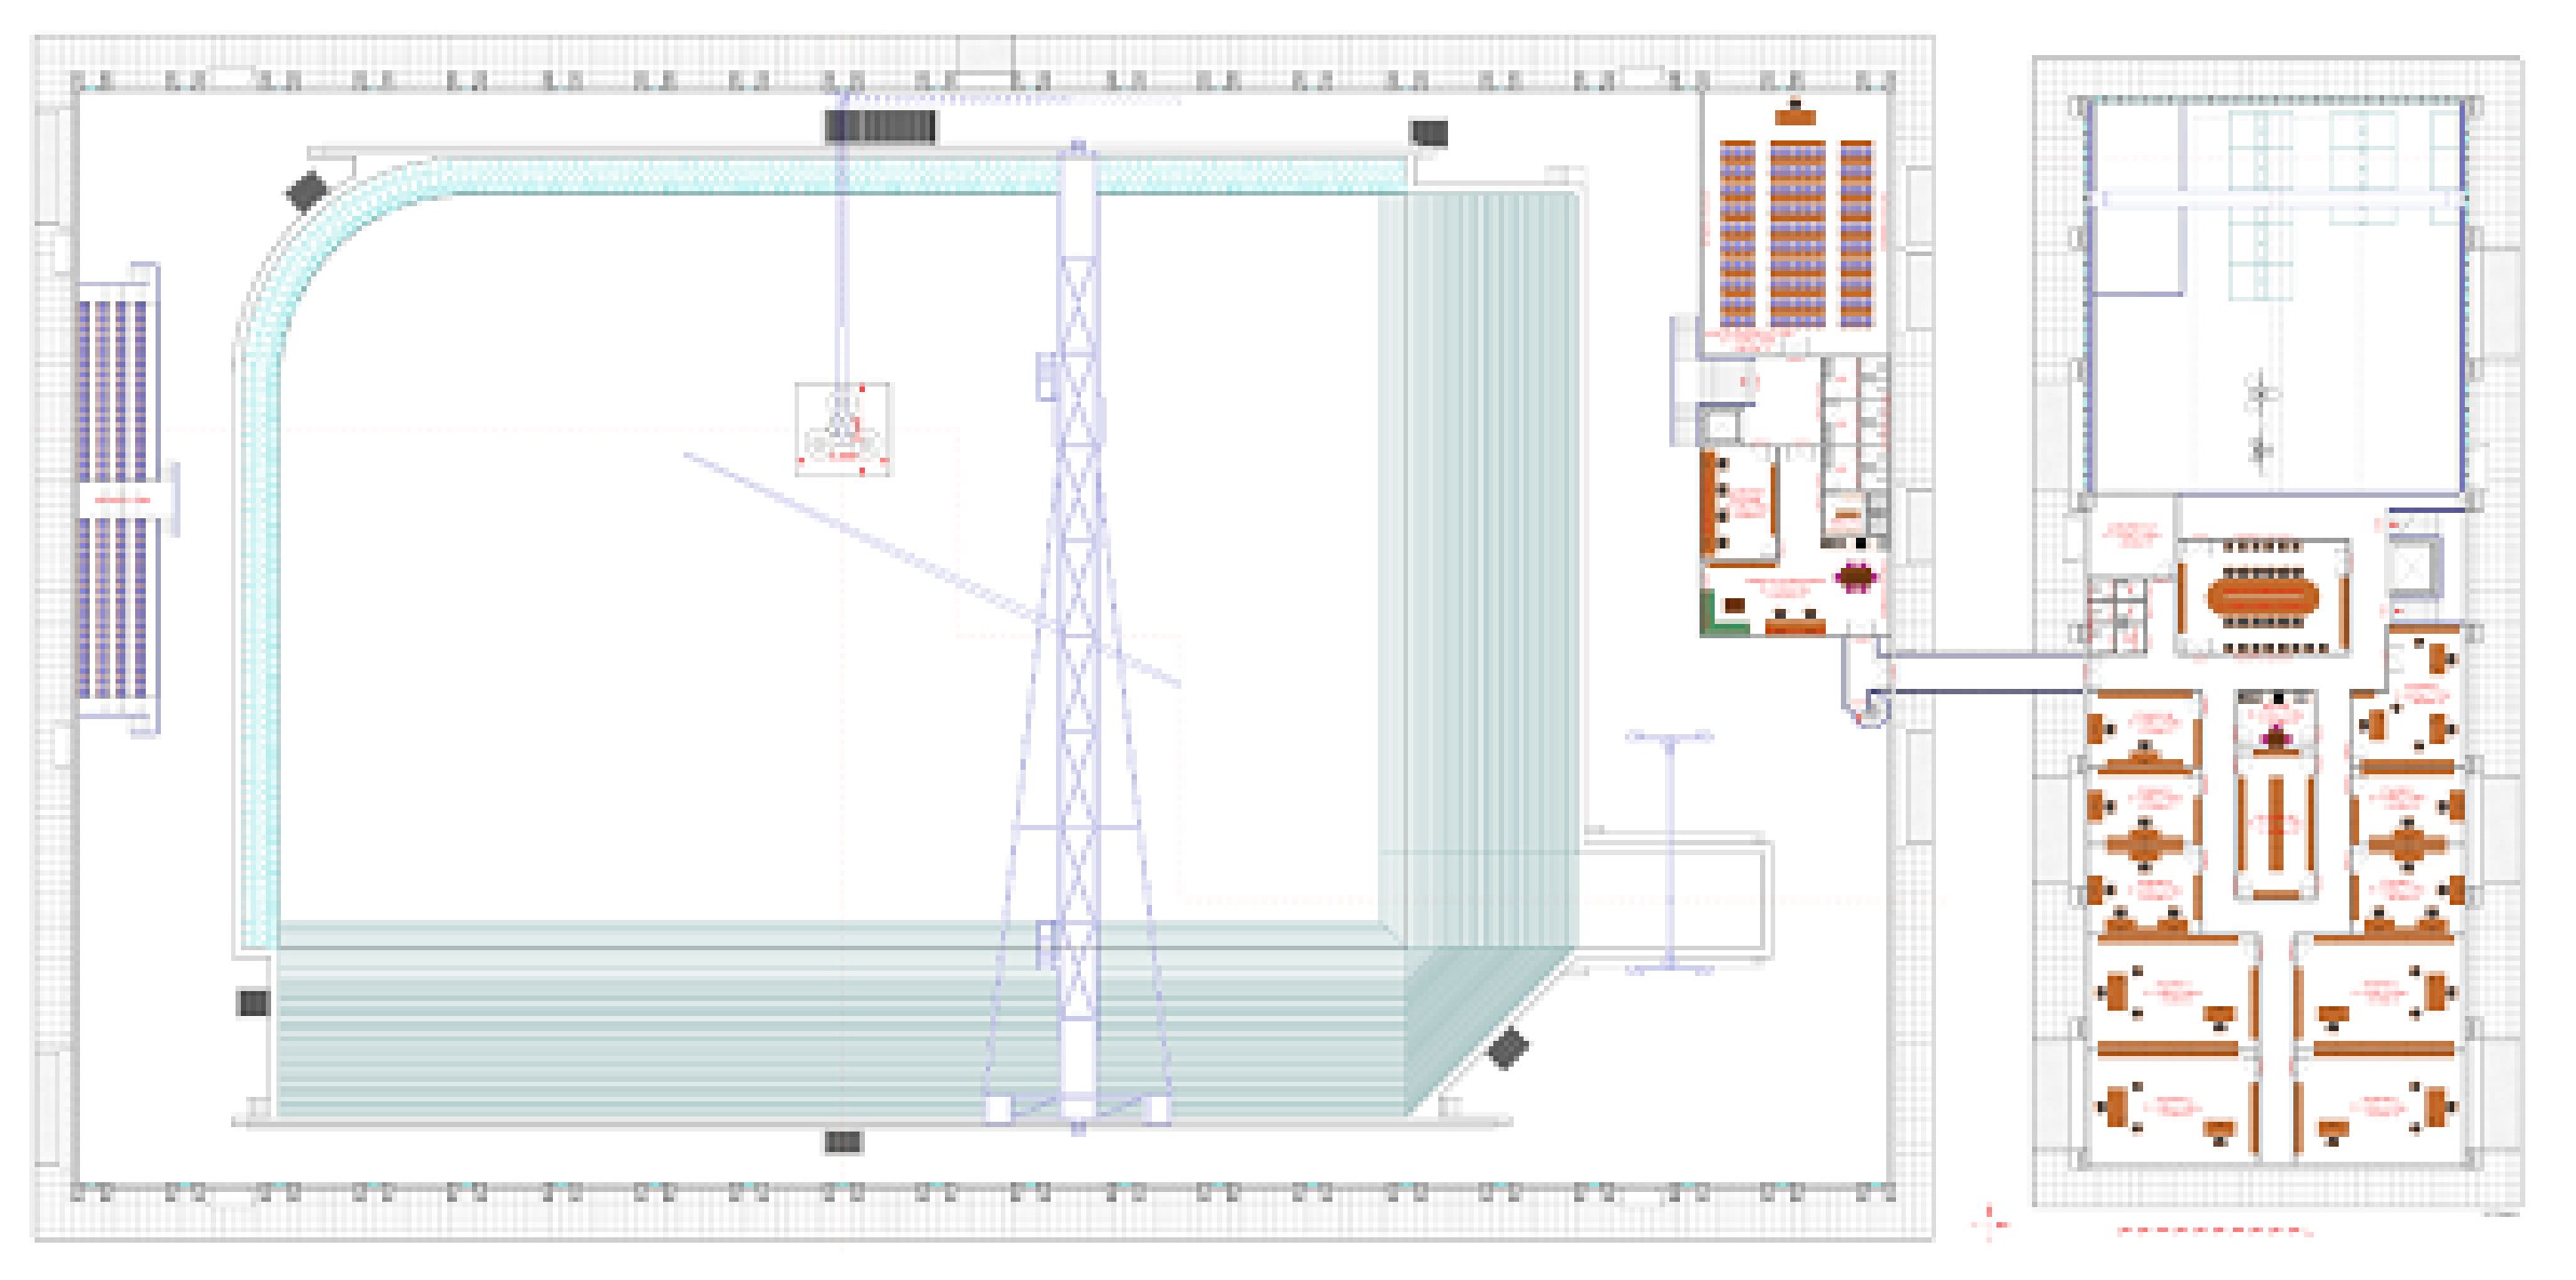
In order to expand the capabilities of the above infrastructure, covering the demands of the evolving offshore industry, a new offshore wave basin was designed in the framework of the HIMIOFoTS project, after having reviewed the existing international facilities and following the current trends in this discipline. Figure 26, Figure 27 and Figure 28 depict drawings and artistic impressions of the general arrangement, experimental facilities and laboratory spaces. The main basin has a rectangular shape with dimensions of 60 × 40 m and a depth of 10 m. A square central pit (5 × 5 m) in the wave tank offers an additional depth of 20 m, for the facilitation of deep-water mooring systems at sea depths up to 2000 m.
The tank is equipped with a wavemaker system having controlled paddles along the two sides, for the reproduction of omnidirectional wave states, offering the capability of the conduction of experiments on TLP platforms, offshore wind turbines, offshore aquaculture facilities, etc. The design also includes a carriage system for resistance towing and seakeeping and maneuvering experiments. In the context of the HIMIOFoTS project, the measuring instruments and the data acquisition system have been defined, including cost estimations, making in this way the first step towards a successful design of a state-of-the-art offshore wave basin.

4. Current Status for Services and Accessibility

The Hellenic marine research infrastructure is built on the sophisticated technological developments described above according to the fundamental objective, which is to offer multidisciplinary services to the users. Furthermore, it is necessary for the sustainable operation of research infrastructures to establish interactive procedures that will ensure the continuous development of added value products and services, entirely targeted to the needs of the stakeholders. Following this principle, the Hellenic Marine Observing, Forecasting and Technology System delivers several innovative applications, products and services for civil, industrial and scientific users, while at the same time establishes interactive procedures to keep track of the present needs and advance its developments.

4.1. Weather, Ocean and Sea State Forecasting Services

Forecasting services are available to the user through the POSEIDON system website: https://poseidon.hcmr.gr/ (accessed on 18 December 2021), providing interactive maps for all the available forecasting products.
The atmospheric model produces various near surface and upper airfields (e.g., temperature, wind speed and direction, relative humidity, mean sea level pressure, precipitation, etc.) in a forecast window of 114 h. In the model post-processing stage, entire atmospheric outputs are re-projected on a regular latitude–longitude plane for plotting and driving the ocean wave and ocean circulation models. Thus, the ocean wave model receives scalars of the horizontal wind components (U and V) while the ocean circulation model additionally receives the near surface temperature and relative humidity, the mean sea level pressure, the accumulated precipitation, the net short wave radiation and the incoming long wave radiation, all estimated by the atmospheric model on hourly time increments.
The wave forecasting system produces significant wave height and wave direction hourly forecasts for the next 114 h. Currently, there are two wave systems operating: one based on WAM code (described above) at 1/10 resolution and the other based on WW3 code covering the whole Mediterranean and the Black Seas at 1/20 resolution. The circulation forecasting system offers circulation, temperature and salinity fields at various levels along with the free surface elevation forecast for the next 114 h.
The forecasting system is providing important information concerning many aspects of human activities, as well as scientific research and innovation. It supports the scientific research and understanding of critical issues such as climate change, natural disasters and anthropogenic hazards, having also the ability to produce alerts for the protection of life and the conservation of the marine and coastal environments. Such an example, the Mediterranean cyclone IANOS as it was simulated by the POSEIDON wave model, is presented in Figure 29. The Medicane IANOS hit Greece from 17–20 September 2020, with heavy rainfall and strong winds, causing the death of four people and causing extensive damages to the Ionian Islands and the coastal areas of Achaia and Ilia.

4.2. Search and Rescue

Combining the surface currents and the 10 m wind forecasts a Search and Rescue service based on the Leeway model code is also operated by the Hellenic marine RI. The Leeway [69] is a stochastic (Monte Carlo) ensemble trajectory model that calculates the motion of an object on the sea surface under the influence of wind (reference height 10 m) and surface currents. The result that it provides to the user is an approximation of the time evolution of the probability distribution (search area) in the form of a set of positions of the selected object being dragged. The items that can be selected are divided into categories, e.g., one person in the water (PIW), various life raft categories, small boats, etc.
A cooperation protocol (MoU) was signed in the framework of the national RI HIMIOFoTS and the MEDOSMoSIS Strategic Project (MEDiterranean gOvernance for Strategic Maritime Surveillance and Safety ISsues) of the INTERREG MED Transnational Cooperation Program 2014–2020, between the Joint Search and Rescue Coordination Center of the Hellenic Coast Guard (J.S.R.C.C) and HCMR, with which both parts are expressing their interest in strengthening and upgrading the operational capabilities of J.S.R.C.C. The MoU ensures the sustained provision of hourly forecasts of wind, surface currents, ripples and sea-surface temperature of the POSEIDON system, as well as the development and installation of an operational application for the determination of the Search and Rescue area in cases of marine and air accidents. Through the application the competent operator is able to determine the geographical (marine) search area, using as input data the time, the location and the technical characteristics of the “object” to be searched (lifeboat, shipwreck, object), thus organizing and guiding the Search and Rescue teams.

4.3. The Oil Spill Forecasting Service

POSEIDON OSM is the oil spill model operationally used by HCMR in the Aegean, Ionian and Mediterranean Seas to provide simulations of the oil spill dispersion using the atmospheric, oceanographic and sea state forecasting results produced during the daily operation of the POSEIDON system (Figure 30). It is a 3D Lagrangian numerical model that simulates the pollutant transport (physical movement of the oil in the marine environment) and weathering (transformation of the oil due to interaction with the sea and atmosphere: evaporation, emulsification, sedimentation, beaching), while the oil slick is represented as “parcels” with time-dependent chemical and physical characteristics [70]. The POSEIDON OSM has been efficiently used in the framework of several European-funded projects concerning the prevention, contingency planning, and preparedness during real oil spill accidents [71,72]. These projects have been supported by European environmental agencies such as the Regional Marine Pollution Emergency Response Centre for the Mediterranean Sea (REMPEC) and the European Maritime Safety Agency (EMSA) [73].
The POSEIDON OSM application is available through the POSEIDON site and can be triggered by the user providing the necessary information regarding the oil spill accident—real or hypothetical—about the location, date and time of the event, total volume of the oil released into the sea, and the user can receive the simulation of the spill evolution in time and space. In the case of oil spill accidents and operational pollution, such forecasting tools provide valuable support to the decision makers, producing near real time information during oil spill response for the prevention of severe impacts on the coastal environment and habitats. In the case of the Agia Zoni II shipwreck at the Saronikos Gulf on 10 September 2017 (Figure 31), oil spill forecasts were provided to the Greek Ministry of Mercantile Marine and to the REMPEC [74].

4.4. Ocean Data

The POSEIDON operational center receives, processes and analyzes all the data collected during the observing network operations. These data are archived and utilized for the production of forecasts, scientific research and outsource. After the reception, the data undergo a number of quality control procedures and then are formatted into NetCDF (Network Common Data Form) files, following globally used format conventions and standards by OceanSites and Copernicus [75]. Under this format, these files are distributed into some of the most known repositories for marine data such as Copernicus, MonGOOS and EMODnet. In addition to the production of NetCDF files, all the data are also transferred into a local database which updates on a daily basis, offering full access both to archived and recent data. Multiple metadata information is also available regarding the sensors, location, operational period and other combined information. The data flow from the transmission by the platforms until the release to the end users is shown in Figure 32a, while in Figure 32b a snapshot of the MonGOOS Data Center is given. MONGOOS stands for Mediterranean Oceanography Network for the Global Ocean Observing System.
Data collected during the POSEIDON network operation are easily accessible through a web interface to the system’s database: http://poseidon.hcmr.gr/listview.php?id=136 (accessed on 18 December 2021).

4.5. Calibration Services

The calibration facilities, at the HCMR Thalassocosmos complex in Crete, include a fully equipped laboratory with a specially designed large calibration tank, two smaller glass tanks and a number of reference sensors and equipment for temperature, salinity, chlorophyll-a, turbidity and dissolved oxygen sensors’ calibration. The calibration laboratory has been developed to support the POSEIDON weather forecasting and monitoring system, focusing on the unique environmental conditions of the Eastern Mediterranean Sea for the sensors’ testing and calibration procedures.

4.6. Open Access to Ocean Platforms and Field Experiments

One major objective of the integrated infrastructure is to provide open access to data from the monitoring networks, as well as to related forecasting products, and also enhance and promote the productive capacity of the services. Furthermore, the accessibility to the infrastructure’s nodes is expected to provide the opportunity to the research and academic institutions to design and implement their related research activities. In that framework, the proposal “Underwater passive acoustic monitoring of cetaceans using underwater gliders—ΥΠAΚOUE” was submitted for free access to the underwater gliders of the infrastructure. The project was a cooperation of the Sea Mammal Research Unit, Scottish Ocean Institute, University of St. Andrews and the Operational Oceanography Department of HCMR concerning the monitoring of cetaceans and environmental noise in the Cretan Sea. The synergy was successfully accomplished during three consequent missions, with the integration of an autonomous acoustic recorder in an underwater glider of the infrastructure in order to record passive acoustic data for the detection of different species of cetaceans with different depth preferences up to 1000 m.

4.7. Field Equipment/Laboratory Infrastructure for Coastal Zone Monitoring

The laboratory infrastructure and field equipment presented by NKUA for the monitoring of the coastal zone are accessible upon request to research and academic institutions to design and implement related research activities.

4.8. The Database of the Coastal Zone

The NKUA Database of the Coastal Zone (http://www.oc.phys.uoa.gr/Himiofots/, accessed on 18 December 2021) developed by the Ocean Physics and Modeling (OPAM) group includes gridded data and a wide network of available information on several coastal areas of Greece.
(A).
Gridded data
(i)
Data obtained by analyzing in situ observations
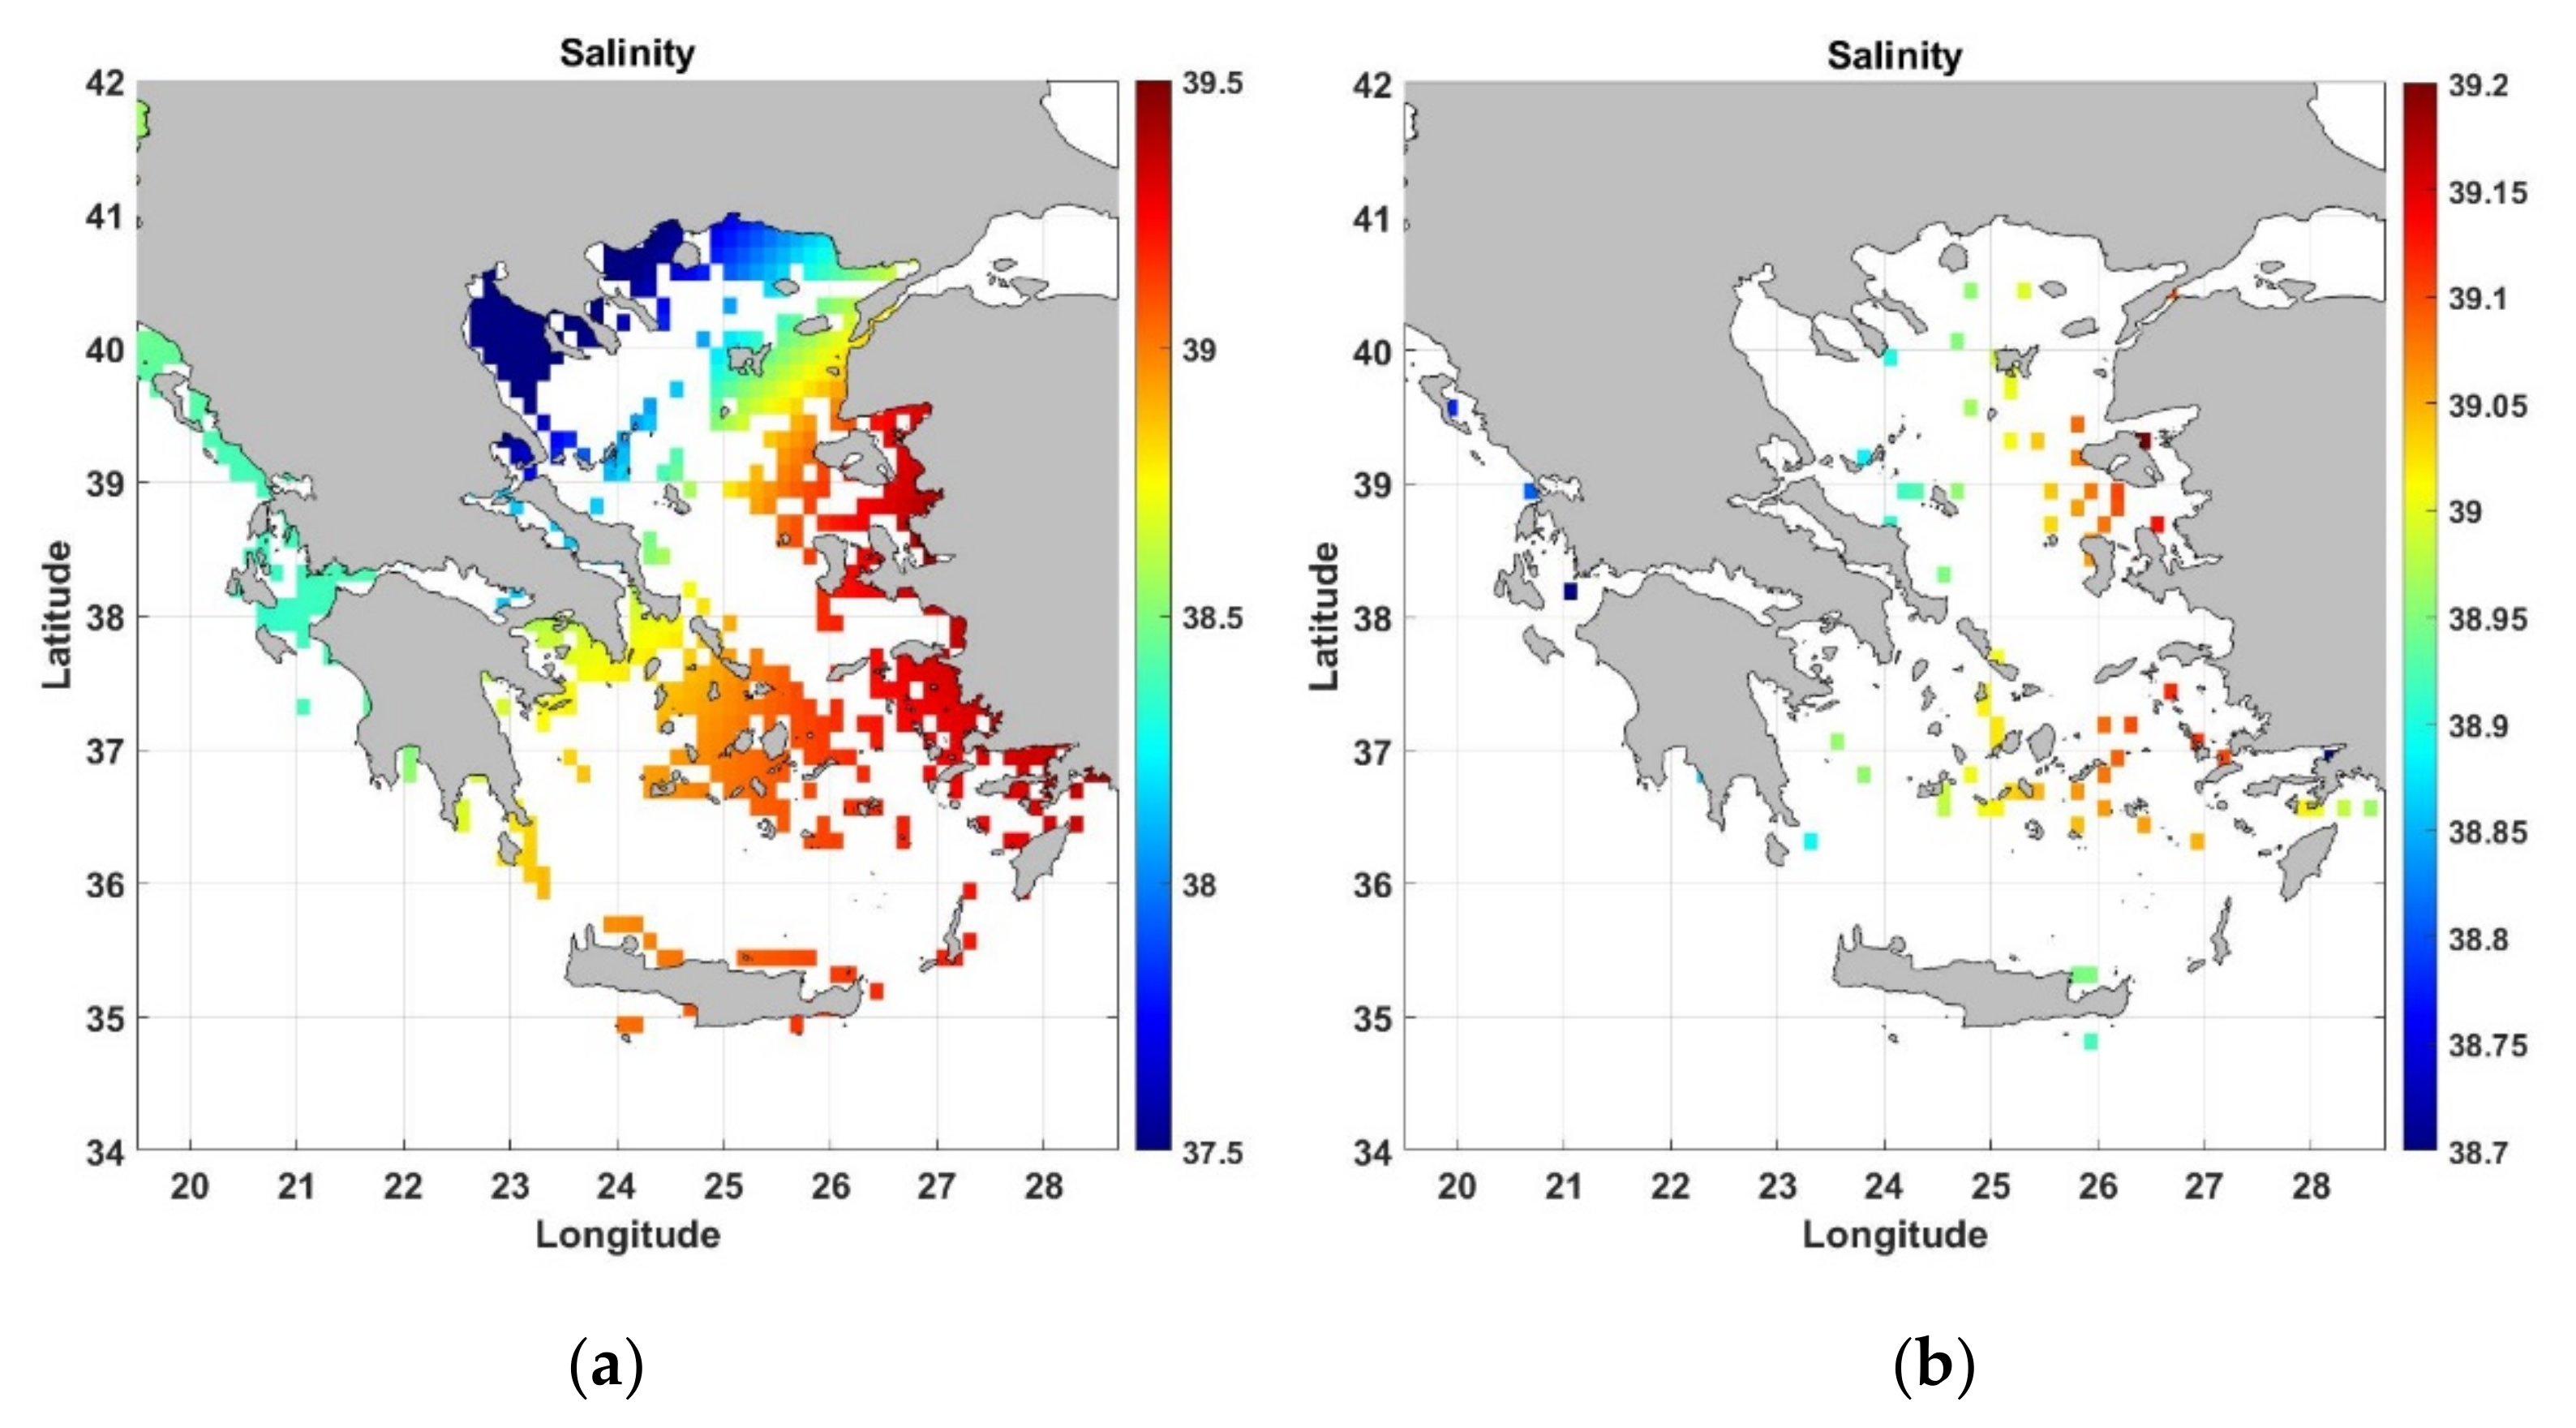
This is a reconstructed high-resolution gridded interannual dataset of the dissolved oxygen, temperature and salinity by means of variational analysis. All the data are provided by the World Ocean Database 2013 (WOD13) [76], available from the National Oceanographic Data Center (NODC-NOAA) over the period 1960–2017 and cover the Mediterranean Sea. The gridded fields are provided on a mesh grid of 1/8° × 1/8° spatial resolution and projected on standard depths. The lack of good spatiotemporal coverage of in situ measurements does not allow for a direct and accurate evaluation of the changes in the marine ecosystem. Thus, for an optimal coastal zone monitoring system, all the available observations were analyzed using Data-Interpolating Variational Analysis (DIVA) [77]. The target of the analysis is defined as the smoothest fields that respect the consistency with the observations and a priori knowledge of the background field (climatology) over the domain of interest. A detailed description of the method is provided by Mavropoulou et al. [78]. The database provides monthly climatological fields as well as annual averaged fields covering the period 1960–2017 for the physical parameters of the coastal zone of the Greek Seas. Such an example, the salinity gridded field for different depths over the coastal Greek areas, as it was provided by the dataset, is presented in Figure 33.
All outputs are created in NetCDF (Network Common Data Format) files for easier post-processing using broadly available tools and could be compared with other corresponding databases that follow the same format.
(ii)
Data obtained by model
A modern, high-resolution model, able to be coupled with the other components of the earth climate system (e.g., atmosphere, sea-ice, biogeochemical tracers) was implemented in order to represent the dynamics of a wide range of spatiotemporal processes. A regional configuration based on stable version 3.6 of the NEMO model (Nucleus for European Modelling of the Ocean; https://www.nemo-ocean.eu/ (accessed on 18 December 2021); [79]) was used, covering the Mediterranean Sea. The computational grid had a horizontal resolution of 1/36° × 1/36° (~2.5 Km) and a vertical grid of 75 geopotential levels applying a step-like representation of bottom topography (z-coordinate with partial step). The regional domain was extracted as an exact 1:9 subset of the global 1/4o ORCA tripolar grid [80]. The bathymetry is based on the ETOPO1 dataset ([81]; 1 min Gridded Global Relief Data) and the minimum depth was set at 12 m. Local corrections were also introduced in some areas of the Mediterranean basin. The exchanges with the Atlantic Ocean were performed through a buffer zone of 10 grid points at 9.5 °W with a damping timescale set at 30 days for the tracers and the baroclinic velocities. The Dardanelles Strait is explicitly introduced as an open boundary. The atmospheric forcing used in the simulations was provided by DRAKKAR Forcing Set 5.2 (DFS5.2; [82]). After a 70-year spin-up the model results are organized in 5-day outputs for all oceanic parameters (temperature, salinity, current velocities etc.) which supply the Database of the Coastal Zone for the period 1958–2013. From this node, users could have access to long-term interannual time series of the hydrodynamic parameters in order to monitor and evaluate the variability observed in the Greek coastal zone and use the results for academic or other socioeconomic applications.
(B).
Network of available coastal information
(i)
Result information from in situ measurements and observations
A wide network of information regarding the coastal zone, containing data and analytical results from measurements in different areas of the Greek coastal zone, collected throughout the NKUA research activity, can be found in the database (Table 15, Figure 34). Metadata files are in NetCDF format.
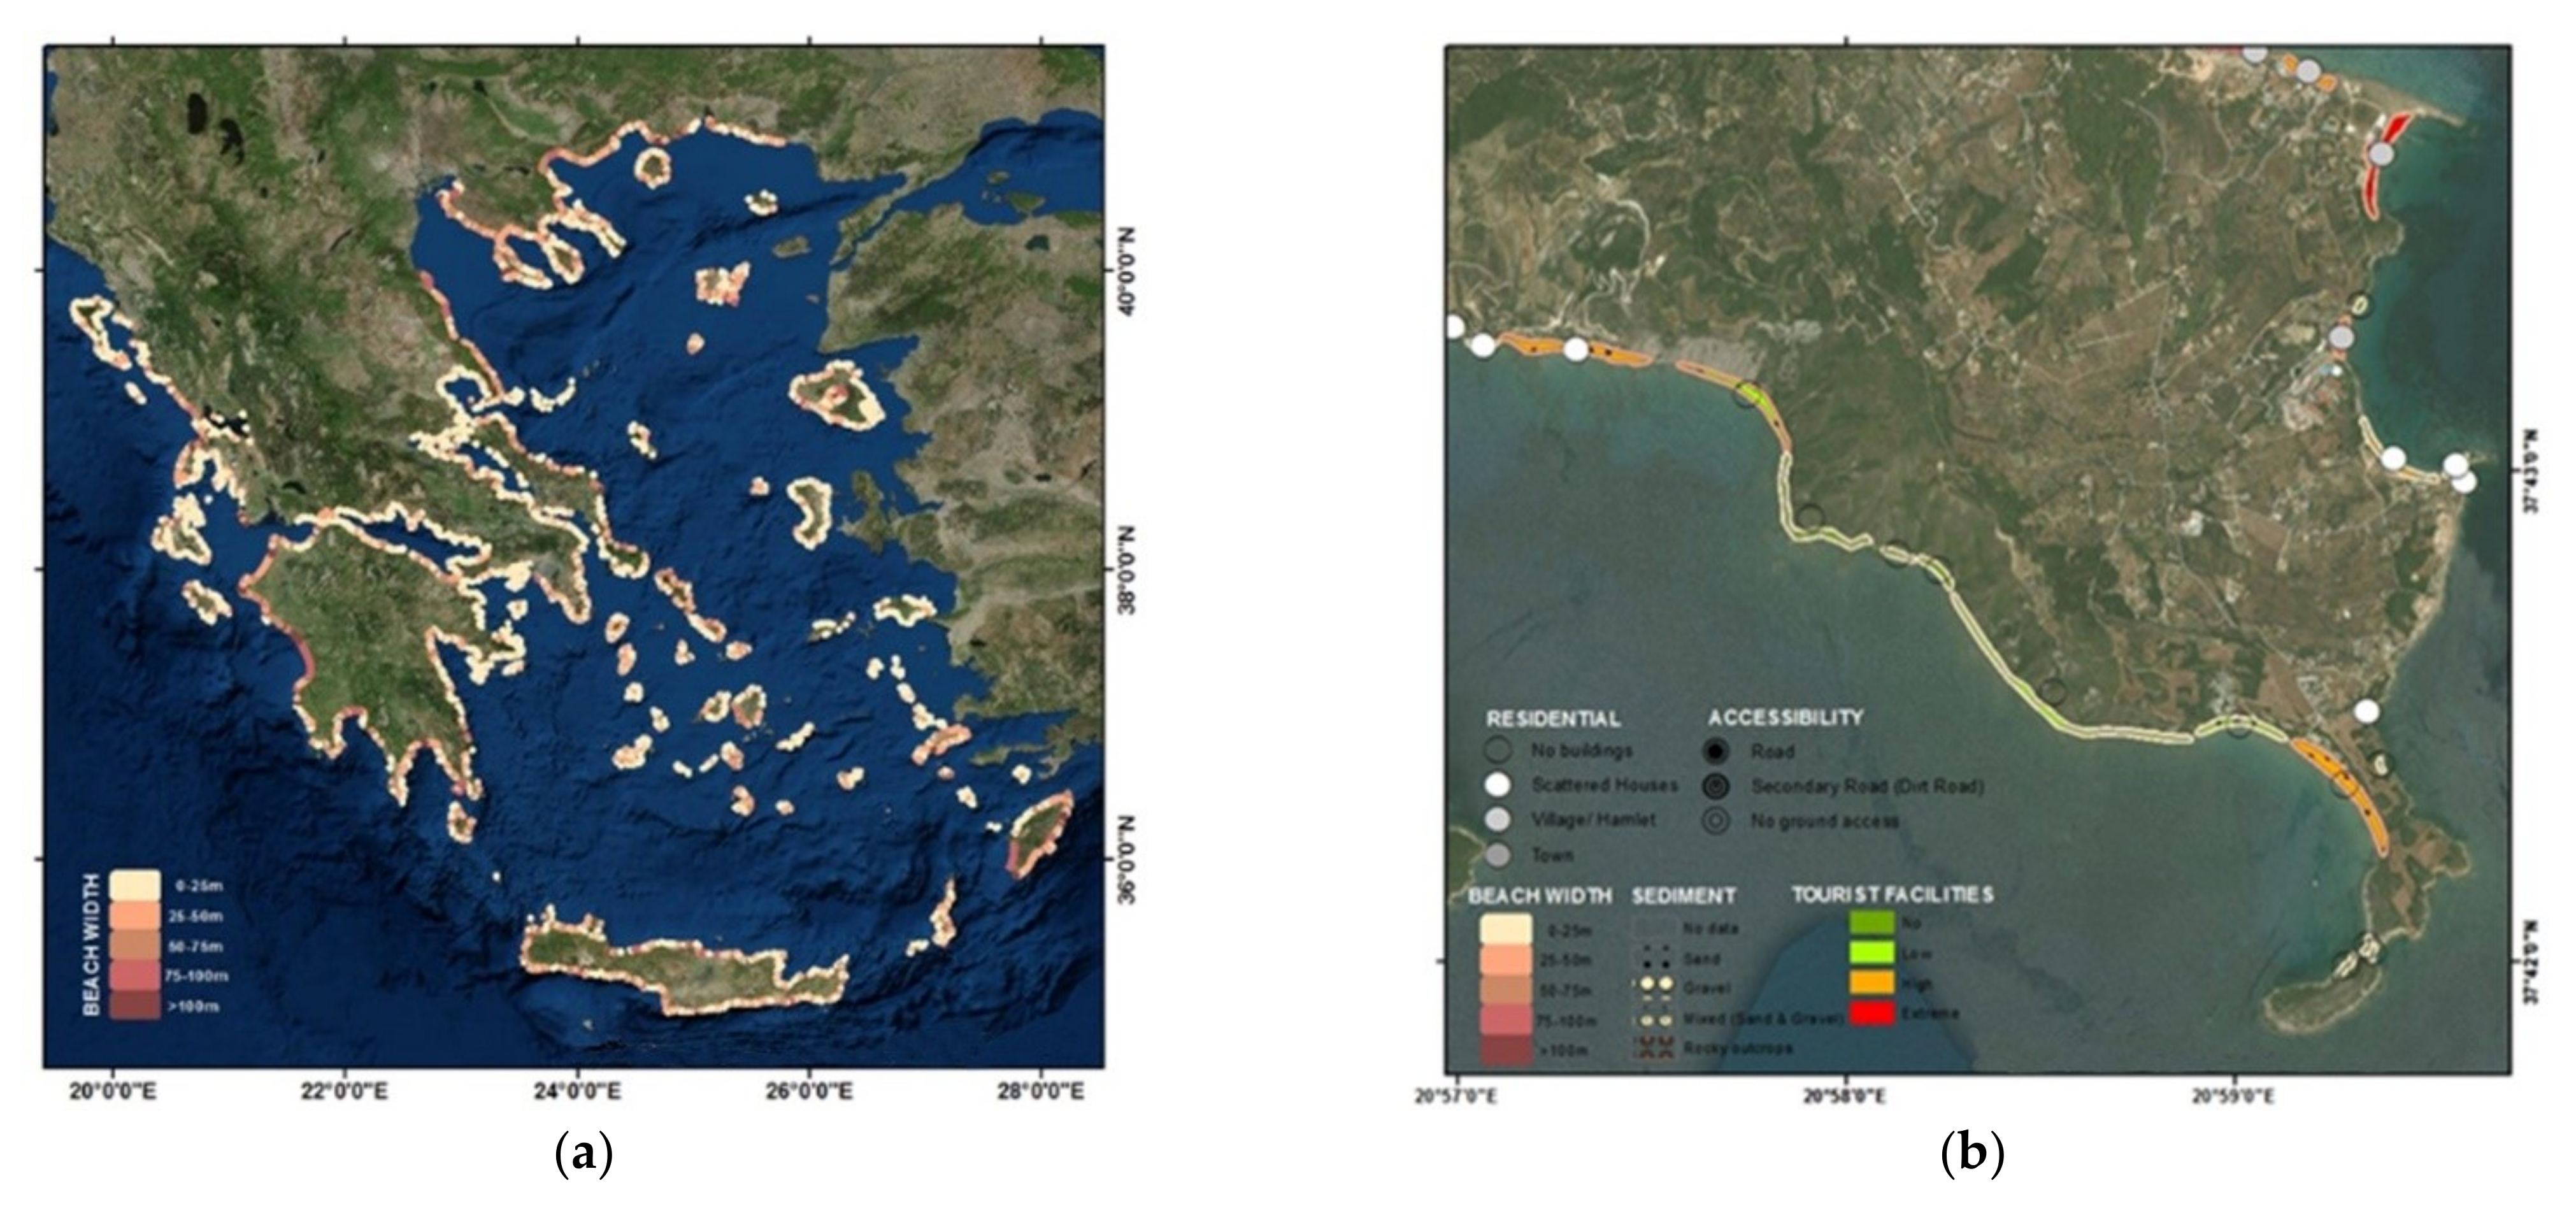
An additional beach zone inventory is maintained in the premises of NKUA (Figure 35). The inventory provides database information with regard to the physico-geographical (i.e., width, length, sediment type, slope, backshore zone geomorphology) and socioeconomic characteristics (i.e., touristic activity, residential density, human infrastructures, accessibility to site) of the majority of beaches in Greece (>7000 beaches) [83]. The inventory was initially developed during the BEACHTOUR project (www.beachtour.geol.uoa.gr, accessed on 18 December 2021) and was upgraded during the implementation of the HIMIOFoTS project.

5. The Roadmap to the Future Evolution

In this work, a summary of the existing nodes and the services of the marine component of the Greek national scale HIMIOFoTS (Hellenic Integrated Marine Inland water Observing, Forecasting and offshore Technology System) research infrastructure were presented. The first phase of the HIMIOFoTS implementation was funded by the General Secretariat for Research and Innovation, aiming to develop a coordinated monitoring and information system for the Greek water resources, which can provide access to in situ and forecasting data, products, and services regarding the marine environment and the surface waters.
As it is discussed in the present paper, during this first period targeted upgrades to the node’s facilities and services of the marine component were realized. However, the main goal for further funding and the implementation of the marine component is the establishment of a multi-node RI system under efficient coordination that will be able to provide scientific excellence and enhance the position of the Greek marine research community into the international landscape, as a large-scale research infrastructure including high technology instruments, observational platforms, underwater vehicles, and research vessels can provide resources, products, and services to research communities to further conduct their research and foster innovation.
The HIMIOFoTS RI is going to be developed as a system of systems and thus the overall cost of the whole infrastructure can be estimated as the sum of the individual costs of the nodes provided by each partner. This number can be significant, reaching to tens of millions of Euros, taking into account the high cost of the marine observing components (multi-parametric buoys, gliders, ferry boxes, HF radars, Argo floats). Moreover, the maintenance cost is also high for the marine component, since in most cases the use of a research vessel is required to access the observing sites. Currently, besides a small contribution of the national funds which is approximately 15% of the total budget, the RI is supported mainly by structural funds. Contributions from EU infrastructure and research projects are short-term with big variability in terms of resources and mostly targeted to specific parts of the RI (research a development, access, etc.). The long-term sustainability of the HIMIOFoTS RI remains an open issue as for many other national and international RIs, since its products and services are addressed mainly to governmental authorities which deal with the marine environment and surface waters, state agencies that handle emergency cases (pollution accidents in the sea, floods) such as the Coast Guard and/or the civil protection agency, the National Meteorological Service, the academic and research community, and to the general public.
During this initial period of implementation, no solid plan for the management of the activities was applied and all the important issues were discussed thoroughly in the General Assemblies with the participation of all partners. It became evident, however, that during the next implementation phase a governance scheme will be required to facilitate the effective interconnection of the different nodes as well as the overall management. This plan should include (a) the coordinator who will represent the RI, (b) the steering committee where the important issues will be discussed and the relevant decisions will be made, (c) the development operational team (DOT) which will monitor the provided services and products and propose the possible developments, (d) the scientific and techno-logical advisory committee which will address the required evolutions, and (e) the users’ advisory group, which will provide a permanent link with the user requirements.
Such a coordinated marine RI is expected to have a major contribution in supporting Blue Growth in Greece, acting as the central hub for scientific research, while engaging a wide spectrum of activities and initiatives involving the marine and coastal regions. On the other hand, it could also act as the key consultant to the state and regional authorities on climate change issues providing guidelines for minimizing the environmental and economic impact. The long-term plan for the national research infrastructure envisages strengthening and enlarging the marine and technological operational network, adding new components, and embracing interactions and synergies with other regional-scale operational systems and initiatives.

Author Contributions

Conceptualization, E.B. and L.P.; Data curation, E.B., C.F., D.B., V.Z., E.T., P.K., C.S., T.P., A.K., S.P. (Stelios Petrakis), A.-M.M., V.P., N.M., P.P., S.V., M.N., M.P., M.S., A.M. (Aspasia Mavroudi), A.M. (Antigoni Moira), D.D., G.A., E.P., V.K., A.-A.D., S.P. (Stamatios Petalas) and N.Z.; Formal analysis, G.P., G.K. (Gerasimos Korres), C.F., V.Z., E.T., P.K., M.D., S.P. (Serafim Poulos), P.M., S.S. (Sarantis Sofianos), T.P., G.K. (Georgios Katsaounis), A.K., S.P. (Stelios Petrakis). A.-M.M., V.P., N.M., I.M., S.C. and D.K.; Funding acquisition, L.P., G.P., M.D. and G.K. (Gerasimos Korres); Investigation, G.K. (Gerasimos Korres), S.P. (Stamatios Petalas) and I.M.; Project administration, L.P.; Resources, D.B.; Supervision, E.B. and L.P.; Writing—original draft, E.B., L.P., G.K. (Gerasimos Korres), V.Z., E.T., C.S., T.P., A.K., S.P. (Stelios Petrakis), A.-M.M., V.P., N.M., G.K. (Georgios Katsaounis) and I.M.; Writing—review and editing, E.B. All authors have read and agreed to the published version of the manuscript.

Funding

This work was supported by the project HIMIOFoTS (MIS 5002739), which was implemented under the Action “Reinforcement of the Research and Innovation Infra-structure”, funded by the Operational Programme “Competitiveness, Entrepreneurship and Innovation” (NSRF 2014–2020) and co-financed by Greece and the EU.

Informed Consent Statement

Informed consent was obtained from all subjects involved in the study.

Data Availability Statement

The data presented in this study are openly available in https://www.himiofots.gr/en (accessed on 18 December 2021).

Conflicts of Interest

The authors declare no conflict of interest. The funders had no role in the design of the study; in the collection, analyses, or interpretation of data; in the writing of the manuscript, or in the decision to publish the results.

References

  1. General Secretariat for Research and Technology. National Roadmap for Research Infrastructures; GSRT: Athens, Greece, 2014. [Google Scholar]
  2. Davidson, F.; Alvera-Azcárate, A.; Barth, A.; Brassington, G.B.; Chassignet, E.P.; Clementi, E.; De Mey-Frémaux, P.; Divakaran, P.; Harris, C.; Hernandez, F.; et al. Synergies in Operational Oceanography: The Intrinsic Need for Sustained Ocean Observations. Front. Mar. Sci. 2019, 6, 450. [Google Scholar] [CrossRef] [Green Version]
  3. Soukissian, T.H.; Chronis, G. Poseidon: A marine environmental monitoring, forecasting and information system for the Greek seas. Mediterr. Mar. Sci. 2000, 1, 71–78. [Google Scholar] [CrossRef]
  4. Kalantzi, G.; Soukissian, T.H.; Nittis, K. Assessment of surface circulation using remote-sensed data, in-situ measurements and directional statistics. Int. J. Mol. Sci. 2010, 39, 15–26. [Google Scholar]
  5. Petihakis, G.; Perivoliotis, L.; Korres, G.; Ballas, D.; Frangoulis, C.; Pagonis, P.; Ntoumas, M.; Pettas, M.; Chalkiopoulos, A.; Sotiropoulou, M.; et al. An integrated open-coastal biogeochemistry, ecosystem and biodiversity observatory of the eastern Mediterranean-the Cretan Sea component of the POSEIDON system. Ocean Sci. 2018, 14, 1223–1245. [Google Scholar] [CrossRef] [Green Version]
  6. Kassis, D.; Korres, G. Hydrography of the Eastern Mediterranean basin derived from argo floats profile data. In Deep Sea Research Part. Ii: Topical Studies In Oceanography; Elsevier: Amsterdam, The Netherlands, 2020; Volume 171, p. 104712. [Google Scholar]
  7. Stewart, R.H.; Joy, J.W. HF radio measurements of surface currents. Deep-Sea Res. 1974, 21, 1039–1049. [Google Scholar] [CrossRef]
  8. Barrick, D.E.; Evans, M.W. Ocean surface currents mapped by Radar. Science 1977, 198, 138–144. [Google Scholar] [CrossRef]
  9. Bellomo, L.; Griffa, A.; Cosoli, S.; Falco, P.; Gerin, R.; Iermano, I.; Kalampokis, A.; Kokkini, Z.; Lana, A.; Magaldi, M.G.; et al. Toward an integrated HF radar network in the Mediterranean sea to improve search and rescue and oil spill response: The TOSCA project experience. J. Oper. Oceanogr. 2015, 8, 95–107. [Google Scholar] [CrossRef]
  10. Kokkini, Z.; Potiris, M.; Kalampokis, A.; Zervakis, V. HF radar observations of the dardanelles outflow current in the north eastern aegean using validated WERA HF radar data. Mediterr. Mar. Sci. 2014, 15, 753–768. [Google Scholar] [CrossRef] [Green Version]
  11. Tzali, M.; Sofianos, S.; Mantziafou, A.; Skliris, N. Modelling the Impact of Black Sea Water Inflow on the North Aegean Sea Hydrodynamics. Ocean Dyn. 2010, 60, 585–596. [Google Scholar] [CrossRef]
  12. Zervakis, V.; Georgopoulos, D.; Drakopoulos, P.G. The Role of the North Aegean in Triggering the Recent Eastern Mediterranean Climatic Changes. J. Geophys. Res. Ocean. 2000, 105, 26103–26116. [Google Scholar] [CrossRef]
  13. Ignatiades, L.; Psarra, S.; Zervakis, V.; Pagou, K.; Souvermezoglou, E.; Assimakopoulou, G.; Gotsis-Skretas, O. Phytoplankton Size-Based Dynamics in the Aegean Sea (Eastern Mediterranean). J. Mar. Syst. 2002, 36, 11–28. [Google Scholar] [CrossRef]
  14. Siokou-Frangou, I.; Bianchi, M.; Christaki, U.; Christou, E.D.; Giannakourou, A.; Gotsis, O.; Ignatiades, L.; Pagou, K.; Pitta, P.; Psarra, S.; et al. Carbon Flow in the Planktonic Food Web Along a Gradient of Oligotrophy in the Aegean Sea (Mediterranean Sea). J. Mar. Syst. 2002, 33–34, 335–353. [Google Scholar] [CrossRef]
  15. Siokou-Frangou, I.; Zervoudaki, S.; Christou, E.D.; Zervakis, V.; Georgopoulos, D. Variability of Mesozooplankton Spatial Distribution in the North Aegean Sea, as Influenced by the Black Sea Waters Outflow. J. Mar. Syst. 2009, 78, 557–575. [Google Scholar] [CrossRef]
  16. Gürgel, K.W.; Antonischki, G.; Essen, H.-H.; Schlick, T. Wellen Radar (WERA), a new ground-wave based HF radar for ocean remote sensing. Coast. Eng. 1999, 37, 219–234. [Google Scholar] [CrossRef]
  17. Zervakis, V.; Kokkini, Z.; Potiris, E. Estimating Mixed Layer Depth with the use of a Coastal High-Frequency Radar. Cont. Shelf Res. 2017, 149, 4–16. [Google Scholar] [CrossRef]
  18. Papadopoulos, A.; Katsafados, P.; Mavromatidis, E.; Kallos, G. Assessing the skill of the POSEIDON-II weather forecasting system. In Proceedings of the Fifth International Conference on EuroGOOS, Exeter, UK, 22–20 May 2008. [Google Scholar]
  19. Korres, G.; Tsiaras, K.; Nittis, K.; Triantafyllou, G.; Hoteit, I. The POSEIDON-II system: Forecasting at the Mediterranean scale. In Proceedings of the 5th EuroGoos Conference, Exeter, UK, 20–22 May 2008. [Google Scholar]
  20. Nittis, K.; Perivoliotis, L.; Korres, G.; Tziavos, C.; Thanos, I. Operational monitoring and forecasting for marine environmental applications in the Aegean Sea. Environ. Modell. Softw. 2006, 21, 243–257. [Google Scholar] [CrossRef]
  21. Korres, G.; Lascaratos, A.; Hatziapostolou, E.; Katsafados, P. Towards an Ocean Forecasting System for the Aegean Sea. Glob. Atmos. Ocean Syst. 2002, 8, 191–218. [Google Scholar] [CrossRef]
  22. Albers, S. The LAPS wind analysis. Wea. Forecast. 1995, 10, 342–352. [Google Scholar] [CrossRef] [Green Version]
  23. Janjic, Z.I.; Gerrity, J.P., Jr.; Nickovic, S. An Alternative Approach to Nonhydrostatic Modeling. Mon. Wea. Rev. 2001, 129, 1164–1178. [Google Scholar] [CrossRef]
  24. Kallos, G.; Papadopoulos, A.; Nickovic, S.; Katsafados, P. Trans-Atlantic North African dust transport: Model simulation. J. Geophys. Res. 2006, 111, D09204. [Google Scholar] [CrossRef] [Green Version]
  25. Spyrou, C.; Varlas, G.; Pappa, A.; Mentzafou, A.; Katsafados, P.; Papadopoulos, A.; Anagnostou, M.N.; Kalogiros, J. Implementation of a nowcasting hydrometeorological system for studying flash flood events: The Case of Mandra, Greece. Remote Sens. 2020, 12, 2784. [Google Scholar] [CrossRef]
  26. Haidvogel, D.B.; Arango, H.G.; Hedstrom, K.; Beckmann, A.; Malanotte-Rizzoli, P.; Shchepetkin, A.F. Model evaluation experiments in the North Atlantic Basin: Simulations in nonlinear terrain-following coordinates. Dyn. Atmos. Ocean. 2000, 32, 239–281. [Google Scholar] [CrossRef]
  27. Shchepetkin, A.F.; McWilliams, J.C. A method for computing horizontal pressure-gradient force in an oceanic model with a nonaligned vertical coordinate. J. Geophys. Res. 2003, 108, 3090. [Google Scholar] [CrossRef]
  28. Shchepetkin, A.F.; McWilliams, J.C. The Regional Ocean Modeling System: A split-explicit, free-surface, topography following coordinates ocean model. Ocean Model. 2005, 9, 347–404. [Google Scholar] [CrossRef]
  29. Maderich, V.; Ilyin, Y.; Lemeshko, E. Seasonal and interannual variability of the water exchange in the turkish straits system estimated by modelling. Mediterr. Mar. Sci. 2015, 16, 444–459. [Google Scholar] [CrossRef] [Green Version]
  30. Egbert, G.D.; Erofeeva, S.Y. Efficient inverse modeling of barotropic ocean tides. J. Atmos. Ocean. Technol. 2002, 19, 183–204. [Google Scholar] [CrossRef] [Green Version]
  31. Papadopoulos, A.; Katsafados, P.; Kallos, G.; Nickovic, S. The weather forecasting system for POSEIDON-An overview. Glob. Atmos. Ocean Syst. 2002, 8, 219–237. [Google Scholar] [CrossRef]
  32. Lindstrom, G.; Pers, C.; Rosberg, J.; Strmqvist, J.; Arheimer, B. Development and testing of the HYPE (Hydrological Predictions for the Environment) water quality model for different spatial scales. Hydrol. Res. 2010, 41, 295–319. [Google Scholar] [CrossRef]
  33. Booij, N.; Ris, R.C.; Holthuijsen, L.H. A third-generation wave model for coastal regions: 1. Model description and validation. J. Geophys. Res. 1999, 104, 7649–7666. [Google Scholar] [CrossRef] [Green Version]
  34. Gürol, S.; Weaver, A.T.; Moore, A.M.; Piacentini, A.; Arango, H.G.; Gratton, S. B-preconditioned minimization algorithms for variational data assimilation with the dual formulation. Q. J. R. Meteorol. Soc. 2014, 140, 539–556. [Google Scholar] [CrossRef] [Green Version]
  35. WAMDI Group. The WAM Model—A Third Generation Ocean Wave Prediction Model. J. Phys. Oceanogr. 1988, 18, 1775–1810. [Google Scholar] [CrossRef] [Green Version]
  36. Komen, G.J.; Cavaleri, L.; Donelan, M.; Hasselmann, K.; Hasselmann, S.; Janssen, P. Dynamics and Modelling of Ocean Waves; Cambridge University Press: Cambridge, UK, 1994. [Google Scholar]
  37. Grashoff, K.; Kremling, K.; Ehrhardt, M. Methods of Seawater Analysis; Wiley-VCH: Hoboken, NJ, USA, 1999; pp. 159–209. [Google Scholar]
  38. Ladakis, M.; Dassenakis, M.; Pantazidou, A. Nitrogen, and phosphorus in coastal sediments covered by algal mat. J. Soils Sediments 2006, 6, 46–54. [Google Scholar] [CrossRef]
  39. Diamantopoulou, E.; Dassenakis, M.; Paraskevopoulou, V.; Rouselakis, E.; Tomara, V. Heavy metals behaviour and distribution in a shallow Mediterranean lagoon. Fresenius Environ. Bull. 2008, 17, 1717–1724. [Google Scholar]
  40. Matiatos, I.; Paraskevopoulou, V.; Lazogiannis, K.; Botsou, F.; Dassenakis, M.; Ghionis, G.; Alexopoulos, J.D.; Poulos, S.E. Surface-ground water interactions and hydrogeochemical evolution in a fluvio-deltaic setting: The case study of Pinios River Delta. J. Hydrol. 2018, 561, 236–249. [Google Scholar] [CrossRef]
  41. APHA. Standard Methods for the Examination of Water and Wastewater; American Public Health Association: Washinghton, DC, USA, 2005; Volume 198, pp. 138–144. [Google Scholar]
  42. Koukounari, I.N.; Paraskevopoulou, V.; Karditsa, A.; Koulouri, P.; Poulos, S.E.; Dounas, C.G.; Dassenakis, M. Trace metal concentrations in the offshore surficial sediments of Heraklion Gulf (Crete Island, East Mediterranean Sea). Mediterr. Mar. Sci. 2020, 21, 84–104. [Google Scholar] [CrossRef]
  43. Paraskevopoulou, V.; Zeri, C.; Kaberi, H.; Chalkiadaki, O.; Krasakopoulou, E.; Dassenakis, M.; Scoullos, M. Trace metal variability, background levels and pollution status assessment in line with the Water Framework and Marine Strategy Framework EU Directives in the waters of a heavily impacted Mediterranean Gulf. Mar. Pollut. Bull. 2014, 87, 323–337. [Google Scholar] [CrossRef] [PubMed]
  44. Chalkiadaki, O.; Dassenakis, M.; Lydakis-Simantiris, N. Bioconcentration of Cd and Ni in various tissues of two marine bivalves living in different habitats and exposed to heavily polluted seawater. Chem. Ecol. 2014, 30, 726–742. [Google Scholar] [CrossRef] [Green Version]
  45. Sakellari, A.; Karavoltsos, S.; Theodorou, D.; Dassenakis, M.; Scoullos, M. Bioaccumulation of metals (Cd, Cu, Zn) by the marine bivalves M. galloprovincialis, P. radiata, V. verrucosa and C. chione in Mediterranean coastal microenvironments association with metal bioavailability. Environ. Monitor. Assess. 2013, 185, 3383–3395. [Google Scholar] [CrossRef]
  46. Diamantopoulou, E.; Dassenakis, M.; Kastritis, A.; Tomara, V.; Paraskevopoulou, V. Seasonal fluctuations of nutrients in a hypersaline Mediterranean lagoon. Desalination 2008, 224, 271–279. [Google Scholar] [CrossRef]
  47. Kandyliari, A.; Karavoltsos, S.; Sakellari, A.; Anastasiadis, P.; Asderis, M.; Papandroulakis, N.; Kapsofefalou, M. Trace metals in six fish by-products of two farmed fishes, the gilthead sea bream (Sparus aurata) and the meager (Argyrosomus regius): Interactions with the environment and feed. Hum. Ecol. Risk Assess. Int. J. 2021, 27, 1126–1146. [Google Scholar] [CrossRef]
  48. Dassenakis, M.; Paraskevopoulou, V.; Botsou, F.; Chalkiadaki, O.; Tzempelikou, E.; Stathopoulou, E.; Bilias, G.; Scoullos, M. Mercury levels in Greek coastal areas. In Proceedings of the International Conference Environmental Perspectives of the Gulf of Elefsis. A Mediterranean Case Study Where Science Meets the Society. Elefsis, Greece, 11–12 September 2015; Special Issue of the Sustainable Mediterranean Journal; MIO-ECSDE: Athens, Greece, 2015. [Google Scholar]
  49. Environmental Protection Agencty. Method 1631, Revision E: Mercury in Water by Oxidation, Purge and Trap, and Cold Vapor Atomic Fluorescence Spectrometry; EPA-821-R-02-019; Office of Water 4303, Environmental Protection Agency: Washington, DC, USA, 2002.
  50. Panagopoulou, G.; Paraskevopoulou, V.; Chalkiadaki, O.; Botsou, F.; Scoullos, M.D.E. Total mercury in seawater and sediments of Saronijkos Gulf. In Proceedings of the 14th International Conference o n Mercury as a Global Pollutant (ICMGP 2019), Krakow, Poland, 8–13 September 2019; Volume 250, p. 169. [Google Scholar]
  51. Yfanti, A.; Paraskevopoulou, V.; Chalkiadaki, O.; Botsou, F.; Panagopoulou, G.I.; Stathopoulou, E.; Zeri, C.; Tzempelikou, E.; Dassenakis, M. Mercury in the coastal waters of Greece under the implementation of the Water Framework Directive (WFD). In Proceedings of the 17th International Conference on Environmental Science and Technology, CEST2021, Athens, Greece, 1–4 September 2021. [Google Scholar]
  52. Bianchi, C.N.; Morri, C. Marine Biodiversity of the Mediterranean Sea: Situation, Problems and Prospects for Future Research. Mar. Pollut. Bull. 2000, 40, 367–376. [Google Scholar] [CrossRef]
  53. Megalofonou, P. Comparison of otolith growth and morphology with somatic growth and age in young-of-the-year bluefin tuna. J. Fish Biol. 2006, 68, 1867–1878. [Google Scholar] [CrossRef]
  54. Armiger, H.; Hartill, B.; Rush, N.; Vaughan, M.; Smith, M.; Buckthought, D. Length and age compositions of recreational landings of kahawai in KAH 1 in January to April 2008 and KAH 8 in January to April 2007. N. Z. Fish. Assess. Rep. 2009, 36, 40. [Google Scholar] [CrossRef]
  55. Milatou, N.; Megalofonou, P. Age structure and growth of bluefin tuna (Thunnus thynnus L.) in the capture-based aquaculture in the Mediterranean Sea. Aquaculture 2014, 424–425, 35–44. [Google Scholar] [CrossRef]
  56. Rodríguez-Marín, E.; Di Natale, A.; Quelle, P.; Ruiz, M.; Allman, R.; Bellodi, A.; Busawon, D.; Farley, J.; Garibaldi, F.; Ishihara, T.; et al. Report of the age calibration exchange within the Atlantic Wide Research Programme for bluefin tuna (GBYP) (SCRS/2014/150). 2014. [Google Scholar] [CrossRef]
  57. Megalofonou, P. Age and growth of Mediterranean albacore. J. Fish Biol. 2000, 57, 1–17. [Google Scholar] [CrossRef]
  58. Kousteni, V.; Megalofonou, P. Reproductive strategy of Scyliorhinus canicula (L., 1758): A holistic approach based on macroscopic measurements and microscopic observations of the reproductive organs. Mar. Freshw. Res. 2020, 71, 596–616. [Google Scholar] [CrossRef]
  59. Ghionis, G.; Trygonis, V.; Karydis, A.; Vousdoukas, M.; Alexandrakis, G.; Drakopoulos, P.; Andreadis, O.; Psarros, F.; Velegrakis, A.; Poulos, S. An integrated multispectral video and environmental monitoring system for the study of coastal processes and the support of beach management operations. Geophysical Research Abstracts. In Proceedings of the EGU General Assembly, EGU2016-17240, Vienna Austria, 17–22 April 2016; Volume 18. [Google Scholar]
  60. Trygonis, V.; Ghionis, G.; Andreadis, O.; Vousdoukas, M.; Ntemogiannis, I.; Rigos, A.; Psarros, F.; Velegrakis, A.; Hasiotis, T.; Poulos, S.E. Monitoring beach usage with a coastal video imaging system: An application at Paralia Katerinis. In Proceedings of the 11th Panhellenic Symposium on Oceanography and Fisheries, Mytilene, Lesvos island, Greece, 13–17 May 2015; pp. 737–740. [Google Scholar]
  61. Paramana, T.; Karditsa, A.; Milatou, N.; Petrakis, S.; Megalofonou, P.; Poulos, S.; Dassenakis, M. Creating the base for MSP; depicting the environmental status of Inner Ionian-Korinthiakos Gulf. In Proceedings of the 17th International Conference on Environmental Science and Technology, CEST2021, Athens, Greece, 1–4 September 2021. [Google Scholar]
  62. Paramana, T.; Karditsa, A.; Milatou, N.; Petrakis, S.; Megalofonou, P.; Poulos, S.; Dassenakis, M. MSFD In-Depth Knowledge of the Marine Environment as the Stepping Stone to Perform Marine Spatial Planning in Greece. Water 2021, 13, 2084. [Google Scholar] [CrossRef]
  63. Dassenakis, M.; Poulos, S.; Megalofonou, P.; Paramana, T.; Karditsa, A.; Petrakis, S.; Milatou, N. Environmental status of Lakonikos Gulf in connection to MSP. In Proceedings of the 14th MEDCOAST Congress on Coastal and Marine Sciences, Engineering, Management and Conservation, MEDCOAST 2019, Marmaris, Turkey, 22–26 October 2019; Volume 1, pp. 361–372. [Google Scholar]
  64. Gorjanc, S.; Klančnik, K.; Murillas-Maza, A.; Uyarra, M.C.; Papadopoulou, N.K.; Paramana, T.; Smith, C.; Chalkiadaki, O.; Dassenakis, M.; Peterlin, M. Coordination of pollution-related MSFD measures in the Mediterranean—Where we stand now and insights for the future. Mar. Pollut. Bull. 2020, 159, 111476. [Google Scholar] [CrossRef]
  65. Gorjanc, S.; Klančnik, K.; Papadopoulou, N.; Murillas-Maza, A.K.; Jarni, K.; Paramana, T.; Pavičić, M.; Ronchi, F.; Uyarra, M.C.; Koren, S.P.; et al. Evaluating the progress in achieving good environmental status in the mediterranean: A methodology to assess the effectiveness of marine strategy framework directive’s programmes of measures. Mar. Pol. 2021, 136, 104889. [Google Scholar] [CrossRef]
  66. Murillas-Maza, A.; Uyarra, M.C.; Papadopoulou, N.K.; Smith, C.; Gorjanc, S.; Klančnik, K.; Paramana, T.; Chalkiadaki, O.; Dassenakis, M.; Pavicic, M. Programmes of measures of the marine strategy framework directive: Are they contributing to achieving good environmental status in the Mediterranean? Mar. Pollut. Bull. 2020, 161, 111715. [Google Scholar] [CrossRef]
  67. Paramana, T.; Chalkiadaki, O.; Katsouras, G.; Dassenakis, M. Implementing the 1st MSFD cycle in the Mediterranean: Lessons learnt. In Proceedings of the 14th MEDCOAST Congress on Coastal and Marine Sciences, Engineering, Management and Conservation, MEDCOAST 2019, Marmaris, Turkey, 22–26 October 2019; Volume 1, pp. 33–43. [Google Scholar]
  68. Paramana, T.; Katsouras, G.; Dassenakis, F. Assessing the First MSFD Implementation Cycle in Greece under Biodiversity and Contaminants Descriptors. Water 2021, 13, 3547. [Google Scholar] [CrossRef]
  69. Allen, A.A. Leeway Divergence, Technical Report CG-D-05-05; U.S. Coast Guard Research and Development Center: Groton, CT, USA, 2005. [Google Scholar]
  70. Pollani, A.; Triantafyllou, G.; Petihakis, G.; Nittis, K.; Dounas, K.; Koutitas, C. The POSEIDON Operational Tool for the Prediction of Floating Pollutant Transport. Mar. Pollut. Bull. 2001, 43, 270–278. [Google Scholar]
  71. Perivoliotis, L.; Krokos, G.; Nittis, K.; Korres, G. The Aegean Sea Marine Security Decision support System. Ocean Sci. 2011, 7, 671–683. [Google Scholar] [CrossRef] [Green Version]
  72. Zodiatis, G.; Dominicis, M.D.; Perivoliotis, L.; Radhakrishnan, H.; Georgoudis, E.; Sotillo, M.; Lardner, R.W.; Krokos, G.; Bruciaferri, D.; Clementi, E.; et al. The Mediterranean decision support system for marine safety dedicated to oil slicks predictions. Deep Sea Res. Part II Top. Stud. Oceanogr. 2016, 133, 4–20. [Google Scholar] [CrossRef] [Green Version]
  73. Zodiatis, G.; Coppini, G.; Perivoliotis, L.; Lardner, R.; Alves, T.; Pinardi, N.; Liubartseva, S.; De Dominicis, M.; Bourma, E.; Neves, A. Numerical modeling of oil pollution in the Eastern Mediterranean Sea. In Oil Pollution in the Mediterranean Sea: Part I; Springer: Berlin/Heidelberg, Germany, 2017; pp. 215–254. [Google Scholar]
  74. Coppini, G.; Gonzalez, G.; Perivoliotis, L.; Smaoui, M.; Liubartseva, S.; Bourma, E.; Lecci, R.; Creti, S. MONGOOS-REMPEC operational experience during Agia Zoni II oil spill, September 2017. In Proceedings of the 20th EGU General Assembly, EGU2018, Vienna, Austria, 4–13 April 2018; Volume 20, p. 6745. [Google Scholar]
  75. Copernicus Marine In Situ Tac Data Management Team. Copernicus Marine In Situ NetCDF Format Manual; Copernicus Marine Environment Monitoring Service: Hermès, France, 2021; Available online: https://archimer.ifremer.fr/doc/00488/59938/ (accessed on 18 December 2021). [CrossRef]
  76. Boyer, T.P.; Antonov, J.I.; Baranova, O.K.; Coleman, C.; Garcia, H.E.; Grodsky, A.; Johnson, D.R.; Locarnini, R.A.; Mishonov, A.V.; O’Brien, T.D.; et al. World Ocean Database 2013; (NOAA Atlas NESDIS, 72); National Oceanographic Data Center: Silver Spring, MD, USA, 2008. [Google Scholar] [CrossRef]
  77. Troupin, C.; Barth, A.; Sirjacobs, D.; Ouberdous, M.; Brankart, J.M.; Brasseur, P.; Rixen, M.; Alvera-Azcárate, A.; Belounis, M.; Capet, A.; et al. Generation of analysis and consistent error fields using the Data Interpolating Variational Analysis (DIVA). Ocean Model 2012, 52, 90–101. [Google Scholar] [CrossRef] [Green Version]
  78. Mavropoulou, A.-M.; Vervatis, V.; Sofianos, S. Dissolved oxygen variability in the Mediterranean Sea. J. Mar. Syst. 2020, 208, 103348. [Google Scholar] [CrossRef]
  79. Madec, G. NEMO Ocean Engine; (Issue 27); Institut Pierre Simon Laplace (IPSL): Guyancourt, France; Available online: https://www.nemo-ocean.eu/wp-content/uploads/NEMO_book.pdf (accessed on 18 December 2021).
  80. Barnier, B.; Madec, G.; Penduff, T.; Molines, J.-M.; Treguier, A.-M.; Le Sommer, J.; Beckmann, A.; Biastoch, A.; Böning, C.; Dengg, J.; et al. Impact of partial steps and momentum ad-vection schemes in a global ocean circulation model at eddy permitting resolution. Ocean Dyn. 2006, 56, 543–567. [Google Scholar] [CrossRef] [Green Version]
  81. Amante, C.; Eakins, B.W. NOAA-National Geophysical Data Center. In ETOPO1 Global Relief Model Converted to PanMap Layer Format; PANGAEA: Boulder, CO, USA, 2009. [Google Scholar] [CrossRef]
  82. Dussin, R.; Barneir, B.; Brodeau, L.; Molines, J.M. The making of the DRAKKAR Forcing Set DFS5 (DRAKKAR/MyOcean Rep. 01–04-16). Available online: https://www.drakkar-ocean.eu/publications/reports/report_DFS5v3_April2016.pdf (accessed on 18 December 2021).
  83. Karditsa, A.; Poulos, S.; Velegrakis, A.; Adreadis, O.; Rigos, A.; Alexandrakis, A.; Petrakis, S.; Ghionis, G. Development of an inventory of Hellenic beaches. Rapport du Commission Internationale Mer Mediterranee CIESM. In Proceedings of the 41th CIESM Congress, Kiel, Germany, 12–16 September 2016. [Google Scholar]
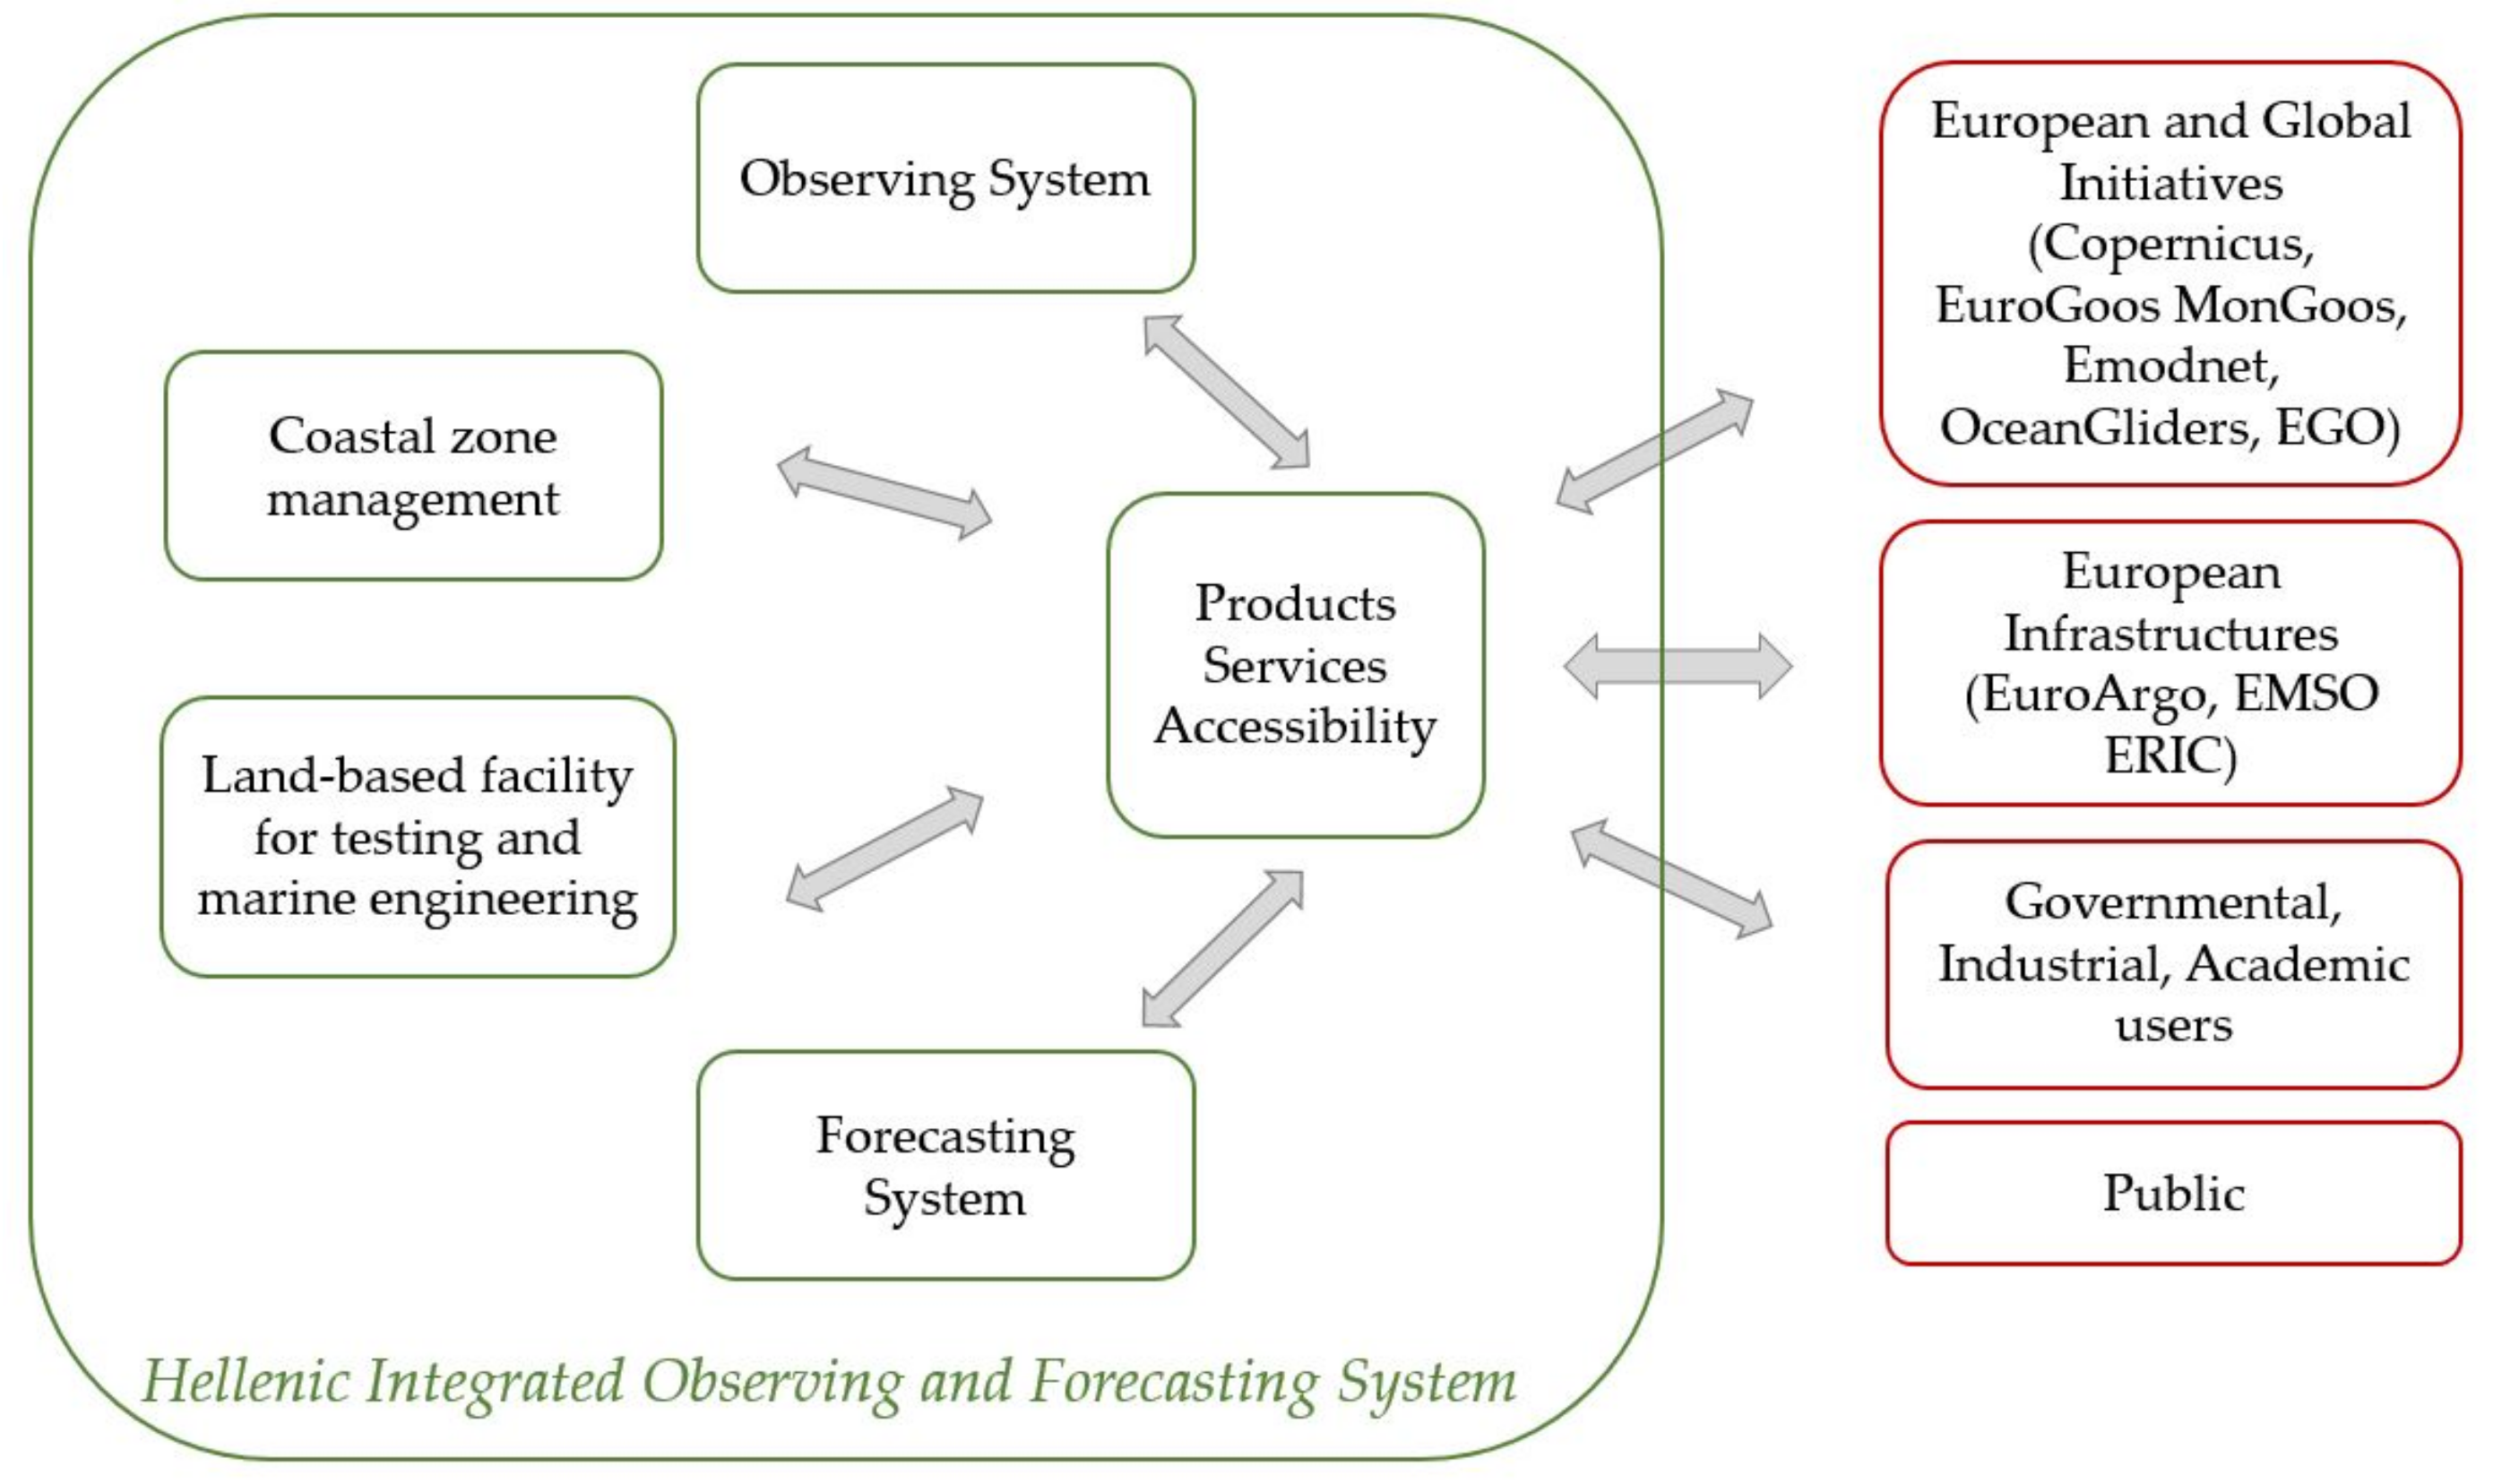
Figure 1. Conceptual representation of the marine infrastructure and the links to the end users.
Jmse 10 00329 g001
Figure 2. General circulation patterns of the Aegean Sea and the POSEIDON network, buoy locations as circles [4].
Jmse 10 00329 g002
Figure 3. (a) WaveScan type buoy; (b) locations of fixed position POSEIDON system buoy moorings.
Jmse 10 00329 g003
Figure 4. Temperature recordings at the E1-M3A buoy from 2007 to 2017 [5].
Jmse 10 00329 g004
Figure 5. (a) Argo profiles mapped in sub-regions of the Eastern Mediterranean Sea for the period 2004–2017; (b) spatial coverage of Argo profiles for the same period [6].
Jmse 10 00329 g005
Figure 6. (a) Average profiles of potential temperature per examined region (Eastern Mediterranean, East Levantine, West Levantine, South Ionian, North Ionian, South Adriatic, South Aegean) for a 14-year period 2004–2017; (b) average profiles of salinity per examined region for the same 14-year period [6].
Jmse 10 00329 g006
Figure 7. (a) A POSEIDON glider starting a mission; (b) sea-surface height distribution in the Cretan Sea derived from satellite altimetry in November 2017, and the glider west–east transect (red dotted line).
Jmse 10 00329 g007
Figure 8. Oceanographic data gathered by the glider along its transect in the Cretan Sea during November 2017: (a) the vertical distribution of temperature up to 700 m; (b) the vertical distribution of salinity up to 700 m [5].
Jmse 10 00329 g008
Figure 9. POSEIDON ferry box and the route Piraeus (Athens) and Heraklion (Crete).
Jmse 10 00329 g009
Figure 10. (a) The cabled observatory during its immersion in Pylos site; (b) the deep-sea platform installed at the sea bottom, guided by the robotic arm of the supporting underwater vehicle.
Jmse 10 00329 g010
Figure 11. A radar tide gauge equipped with meteorological sensors and wireless telecommunication link, installed at Skopelos Island.
Jmse 10 00329 g011
Figure 12. Estimated spatial coverage of the “Dardanos” HF radar. Surface current maps are produced in the region where the two circular sectors centered at Plaka (P) and Fisini (F) intersect.
Jmse 10 00329 g012
Figure 13. Installation of the linear receiver array of the “Dardanos” system in the Plaka site (northeastern extremity of Lemnos Island) in December 2020.
Jmse 10 00329 g013
Figure 14. The operational domains of LAPS model.
Jmse 10 00329 g014
Figure 15. The operational domains of ETA model.
Jmse 10 00329 g015
Figure 16. Bathymetric map of Eastern Mediterranean. (a) Black square denotes Ionian’s and Aegean’s Sea (IAS) model geographic extent. Panels (b,c) show IAS and Saronikos Gulf models bathymetry, respectively.
Jmse 10 00329 g016
Figure 17. Scatter index estimated using WAM model SWH forecasts (first 24 h) for one-year period (2020) and along-track SWH observations from Saral-Altika, S3A, S3B, Jason3, Cryosat-2, CFOSAT and H2B satellites.
Jmse 10 00329 g017
Figure 18. Inductively coupled plasma-mass spectrometry (ICP-MS).
Jmse 10 00329 g018
Figure 19. (a) CLEAN ROOM for Hg analysis; (b) Total oxidizable Hg (ng/L) in surface waters of Saronikos Gulf [50].
Jmse 10 00329 g019
Figure 20. Box plot of Total Hg concentration levels in Greek coastal seawater (WFD monitoring) (Horizontal lines in the boxes correspond to median concentrations; lower and upper box sides to the 25th, 75th percentiles; lower and upper whiskers to the 10th and 90th percentiles. Outliers are shown as circles and extremes as asterisks) [51].
Jmse 10 00329 g020
Figure 21. Underwater recording of organisms in the coastal zone of North Evoikos Gulf.
Jmse 10 00329 g021
Figure 22. Image Analysis System: (a) spine section image from Atlantic bluefin tuna aged 3 years old. The points reflect translucent bands counted as annuli; (b) image of Dentex macrophthalmus sagittal otolith depicting the dimensions measured (maximum length and width).
Jmse 10 00329 g022
Figure 23. Mk9 Archival Tags: (a) programming and setting up the archival tag; (b) implantation of the activated archival tag; (c) archival tag extraction; and(d) data retrieval.
Jmse 10 00329 g023
Figure 24. The Sidescan Sonar system. (a) in situ measurements (b) digital recording.
Jmse 10 00329 g024
Figure 25. The wave towing tank of NTUA.
Jmse 10 00329 g025
Figure 26. The ocean wave tank building complex.
Jmse 10 00329 g026
Figure 27. Wave basin and laboratory spaces.
Jmse 10 00329 g027
Figure 28. Offshore wave tank and carriage equipment.
Jmse 10 00329 g028
Figure 29. The Medicane IANOS.
Jmse 10 00329 g029
Figure 30. Conceptual sequence of the POSEIDON OSM simulation process.
Jmse 10 00329 g030
Figure 31. (a) Agia Zoni II shipwreck at Saronikos Gulf; (b) simulation of the oil spill fate after the Agia Zoni II accident from the POSEIDON OSM.
Jmse 10 00329 g031
Figure 32. (a) The POSEIDON Operational Center Data Flow; (b) MonGOOS Data Center/Copernicus Mediterranean In Situ TAC. Data are available to the users through the main European marine data infrastructures (CMEMS, EMODNET).
Jmse 10 00329 g032
Figure 33. Gridded field of salinity over the coastal Greek areas for the year 1990 at (a) surface layer and (b) 200m depth.
Jmse 10 00329 g033
Figure 34. NKUA coastal in situ measurements and observation stations.
Jmse 10 00329 g034
Figure 35. The NKUA beach zone inventory (a) scale 1: 5,000,000 (b) scale 1:25,000 (www.beachtour.geol.uoa.gr, accessed on 18 December 2021).
Jmse 10 00329 g035
Table 1. Fixed Mooring Buoys.
Buoy AthosSaronikosMykonosPylosE1M3AHeraklion
PositionLatitude: 39.975-
Longitude: 24.7294
Latitude: 37.6099-Longitude: 23.5669Latitude: 37.5194-Longitude: 25.4597Latitude: 36.8288-Longitude: 21.6068Latitude: 35.7263-Longitude: 25.1307Latitude: 35.4342-Longitude: 25.0792
ParametersAtmospheric
Sea Temperature
Salinity-Conductivity
Currents
Waves
Optical
Biochemical
Atmospheric
Sea Temperature
Salinity-Conductivity
Currents
Waves
Atmospheric
Sea Temperature
Salinity-Conductivity
Currents
Waves
Atmospheric
Sea Temperature
Salinity-Conductivity
Currents
Waves
Optical
Biochemical
Atmospheric
Sea Temperature
Salinity-Conductivity
Currents
Waves
Optical
Atmospheric
Sea Temperature
Salinity-Conductivity
Currents
Waves
Biochemical
Depth100 m3 m3 m1000 m1000 m3 m
Sampling Frequency3 h3 h3 h3 h3 h3 h
StatusActiveTerminated
(last date:
1 August 2019)
ActiveActiveActiveActive
Deployment Date25 May 200027 Auguest 20071 January 20019 November 200728 May 200715 July 2016
Percentage of missing dataAir Temperature: 24.3%
Sea Temperature: 34.52%
Salinity-Conductivity: 40.8%
Air Temperature: 49.7%
Sea Temperature:51.2%
Salinity-Conductivity: 53.2%
Air Temperature: 49.8%
Sea Temperature:61.9%
Salinity-Conductivity: 61.6%
Air Temperature: 34.7%
Sea Temperature: 40.01%
Salinity-Conductivity: 42.87%
Air Temperature:47.9%
Sea Temperature: 37.17%
Salinity-Conductivity: 38.44%
Air Temperature: 29.9%
Sea Temperature: 47.2%
Salinity-Conductivity: 52.4%
Table 2. Argo Floats.
Geographical AreaNumber of Float DeploymentsNumber of
Operational Floats
Floats’ IdsTotal Mission DaysTotal
Profile Number
Average Profile Number per Float
South Ionian276901882 6901885 6901887 6901889 6903282 6903153404766595
North Ionian246901882 6901883 690315388417644
South Aegean15186900795 6901881 6901885 6901886 6903152 6903276 6903277 6903278 6903280 6903281 6903282 6903284 6903286 6903287 6903289 6903290 6903291 6903296382375642
North Aegean13136901884 6901888 6901890 6903152 6903275 6903278 6903279 6903283 6903284 6903285 6903288 6903297 6903298333274157
Levantine146901889 6903153 6903276 6903296123624461
Adriatic026901882 69018832505025
Table 3. Glider missions in the Cretan Sea.
MissionParametersDeployment DateMission
Duration
Maximum
Depth (m)
Horizontal
Distance Covered
Number of
Profiles
1Sea Temperature
Salinity-Conductivity
Biochemical
31/10/201735 days700760 km682
2Sea Temperature
Salinity-Conductivity
Biochemical
30/01/201836 days700575 km776
3Sea Temperature
Salinity-Conductivity
Biochemical
03/04/201845 days700824 km750
4Sea Temperature
Salinity-Conductivity
Biochemical
07/06/201840 days700768 km702
5Sea Temperature
Salinity-Conductivity
Biochemical
20/11/201826 days1000675 km426
6Sea Temperature
Salinity-Conductivity
Biochemical
04/03/201931 days1000686 km446
7Sea Temperature
Salinity-Conductivity
Biochemical
03/07/201929 days1000619 km376
8Sea Temperature
Salinity-Conductivity
Biochemical
21/11/201916 days700348 km362
9Sea Temperature
Salinity-Conductivity
Biochemical
11/03/202042 days1000935 km514
10Sea Temperature
Salinity-Conductivity
Biochemical
03/07/202035 days1000779 km476
11Sea Temperature
Salinity-Conductivity
Biochemical
22/04/202136 days700718 km540
Table 4. Ferry box system (Piraeus Jmse 10 00329 i001 Heraklion).
RouteStart DateEnd DateParametersSampling
Frequency
Number of Cruises
Piraeus
Heraklion
20 June 201210 October 2014Sea Temperature
Salinity-Conductivity
Optical
Biochemical
1 min280
Piraeus
Heraklion
28 September 201718 January 2018Sea Temperature
Salinity-Conductivity
Optical
Biochemical
1 min84
Piraeus
Heraklion
1 April 201812 October 2018Sea Temperature
Salinity-Conductivity
Optical
Biochemical
1 min134
Table 5. Cabled seabed observatory.
Pylos Site
LocationLatitude: 36.8347 Longitude: 21.6139
Depth1580 m
Installation Date22 May 2018
ParametersConductivity
Temperature
Pressure
Chlorophyll-a
Dissolved oxygen
Dissolved carbon dioxide
Turbidity
Acidity (pH)
Additional
sensors and equipment
Supersensitive pressure sensor to detect tsunami waves
Subsurface water Currents Measuring Instrument (ADCP 600 m)
Ambient sound recorder
Seismograph (OBS)
Gravimeter
Lighting system
Picture and video recording system
Table 6. Tide gauges.
Skopelos IslandPalaia Fokea
PositionLatitude: 39.1238 Longitude: 23.7297Latitude: 37.7175 Longitude: 23.9452
Available ParametersAtmospheric, Sea levelAtmospheric, Sea level
Sampling FrequencyAtmospheric: 10 min
Sea level: 5 min
Atmospheric: 10 min
Sea level: 5 min
Installation Date16 April 202122 March 2021
Statusactiveactive
Efficiency of Data AcquisitionAtmospheric: 87.8%
Sea level: 96.27%
Atmospheric: 99.4%
Sea level: 98.04%
Table 7. HF radar “Dardanos”.
Plaka StationFisini Station
Position—Latitude40°02′06″ N39°48′54″ N
Position—Longitude025°26′48″ E025°22′12″ E
Central Lobe Azimuth98°65°
ParametersSea-Surface Current Velocity
Wave Parameters
Transmission Frequency16.15 MHz
Repetition Cycle30 min
Samples per data run4096
Maximum Range96 km
Rx antennas per site8
Table 8. Main configuration of the data assimilation model.
3D-Var Data Assimilation Model (LAPS)
Integration domainEurope, North Atlantic, North Africa, Middle East, Western Russia
Grid structureLambert conformal
Horizontal resolution15 × 15 km
Vertical resolution22 pressure levels
Ingested dataMETAR, SYNOP, RAOB
Background fieldsTime-dependent near-to-analysis global forecasts at 0.5°× 0.5° resolution from NCEP/GFS with a 3 h time increment
Operational suiteHourly analyses
Table 9. Main configuration of the atmospheric model.
Atmospheric Model (Non-Hydrostatic ETA)
Integration domainEurope, North Atlantic, North Africa, Middle East
Grid structureArakawa semi-staggered E-grid defined in transformed lat/lon coordinate system
Horizontal resolution0.05° × 0.05° (0.24° × 0.24° for the dust module)
Vertical resolution50 ETA levels
Basic time step18 s
Initial conditionLAPS analyses (see Table 1)
Boundary conditionsTime-dependent global forecasts at 0.5° × 0.5° resolution from NCEP/GFS with a 3 h time increment
Table 10. IAS and Saronikos Gulf model’s description. RBL4D-Var refers to Restricted B preconditioned Lanczos 4D-Var algorithm [34].
ModelIAS Saronikos
Gulf
CoupledNoYes—SWAN
Horizontal resolution2.0 km0.5 km
Vertical resolution30 sigma level20 sigma level
Mixing SchemeMellor Yamada 2.5Mellor Yamada 2.5
Assimilation Scheme4D-VAR (RBL4D-Var)No
TidesYesYes
Atmospheric forcingPOSEIDON ETA/SkironPOSEIDON ETA/Skiron
Riverine outflowSHMI E-HYPE modelNo
Lateral boundary conditionsCMEMS MED-CurrentsIAS forecast/Aegean WAM forecast
Table 11. LEC-NKUA infrastructure.
InfrastructureModels/Specifications
Double beam UV-VIS SpectrophotometersVarian Cary 1E
Specord 210 Plus (1 and 5 cm optical length)
Ion chromatographer [41]Metrohm 820 IC Separator 551 Center,
819 IC Detector
Atomic absorption spectrometersGraphite Furnace Varian SpectrAA-640Z-GTA-100 Flame Varian SpectrAA-200
ICP-MSThermo Scientific ICAP Qc
Laminar flow cabinet 570 CLEAN ROOMClass 10000
Cold-vapor atomic fluorescence spectrometer (CVAFS)TEKRAN 2500
In situ physicochemical measurement devicesYSI 63 portable (pH, salinity, temperature),
Lovibod SD310 Oxi meter
Sampling devicesBirge Eckman sediment grab,
Mackereth corer,
Niskin type andRuttner type plastic water samplers
Table 12. Hg monitoring in 2017–2020.
CruiseParametersSampling
Dates
Cruise
Duration
Sampling AreaNumber of Samples
1Total Hg in seawaterOctober 20173 daysSaronikos Gulf35
2March 20187–10 daysGreek WFD
monitoring station grid
30
3October 20187–10 days32
4March 20197–10 days30
5October 20197–10 days32
6March 20187–10 days42
7October 20207–10 days43
Table 13. Section of Zoology–Marine Biology infrastructure.
InfrastructureModels/Specifications
Underwater droneGLADIUS MINI Underwater Drone
Maximum Recording Depth: 200 m,
Speed: 2 m/s,
4K Ultra HD Camera
Aerial droneDJI Mavic 2 Pro
Sensor: 1″ CMOS Effective Pixels/20 million
Video Resolution: 4K, FHD,
Max Speed: 72 Km/h,
Maximum Takeoff Altitude: 6000 m,
Operating Temperature Range: −10 °C to 40 °C
Image Analysis SystemImage-Pro Plus v. 6.0 software,
stereoscope or optical microscope,
digital or analogue camera
Archival tagsMk9 Archival Tags (Wildlife Computers)
Size: 72 × 19 mm/Weight: 34 g,
Pressure Resistance: 1000 m.
Memory and Data Retention: 64 MB
Depth/A 12-bit analog to digital converter, measurements from −40 to 1000 m, (resolution 0.5 m, accuracy of ±1%)
Temperature/A 12-bit analog to digital actual measured range of −40 °C to 60 °C, (0.05 °C resolution and an accuracy of ±0.1 °C).
Microtome, embedding station
& flotation bath
Manually operated microtome for thin sections (6–8 μm) (Leica RM2235).
Advanced paraffin embedding station with microprocessor control system (Leica EG1150H).
Paraffin flotation bath for flattening and drying sectioned tissues (Leica HI1210)
Table 14. Laboratory of Physical Geography infrastructure.
InfrastructureModels/Specifications
Single beam echosounder coupled with Sidescan SonarMaximum Recording Depth: ~300 m.
Triple Sounding Frequency (455, 800 and 1200 kHZ), for bottom scanning up to 120, 40 and 60 m,
Scanning swath of about 300 m
GNSS receiver (10 Hz with EGNOS and GLONASS) preinstalled nautical charts
Autonomous Weather Station (Wireless)Temperature (Range: 0° to +60 °C, Resolution 0.1 °C)
Barometric Pressure (410 to 820 mm Hg, Resolution 0.1 mm Hg),
Humidity (Range: 1 to 100% 663 RH, Resolution 1%),
Rain (Range: 0 to 6553 mm, Resolution 0.2 mm)
Autonomous Beach Imaging SystemCalibrated/coupled with RTK-DGPS topographical mapping and 3D laser
Table 15. Network of in situ measurements and observations.
Type of
Data
Total StationsParametersSampling Frequency
Geological183coastal zone topography, bathymetry,
seabed morphology,
sedimentology
Bathymetric mapping; one-off.
Sedimentology; one-off.
Sediment dynamics; repeated if required.
Shoreline changes; seasonally.
Weather station measurements; long-term (>annual).
Sea level/wave measurements; throughout field campaigns.
Chemical207nutrients,
trace metals in seawater and sediments
Nutrients in coastal waters; quarterly.
Metal analysis; quarterly for water samples and yearly for sediment samples.
Biological55recordings of the presence and distribution of endangered species,
Cartilaginous species,
marine mammals,
overfished species,
jellyfish
recordings of human activities (e.g., fisheries, aquaculture, industry, tourism) and their impact on biological resources
Monitoring jellyfish blooms along the North Evoikos Gulf on an annual basis.
Fish Stock Assessment Reports for endangered species (e.g., Atlantic bluefin tuna, Chondrichthyes, etc.); depending on project requirements.
Determination of heavy metals in fish tissues and risk assessment; depending on project on requirements.
Occurrence and exposure analysis of microplastics in the gut and gills of marine fish species; depending on project requirements.
Sexual maturity, spawning activity, sex ratio and fecundity of various marine fish species; depending on project requirements.
Publisher’s Note: MDPI stays neutral with regard to jurisdictional claims in published maps and institutional affiliations.