Article

A Model for Translation and Rotation Resistance Tensors for Superellipsoidal Particles in Stokes Flow

1
Faculty of Mechanical Engineering, University of Maribor, Smetanova 17, SI-2000 Maribor, Slovenia
2
Institute of Applied Mechanics, Friedrich-Alexander Universität Erlangen-Nürnberg, Paul-Gordan-Str. 3, D-91052 Erlangen, Germany
3
Glasgow Computational Engineering Centre, University of Glasgow, Glasgow G12 8QQ, UK
*
Author to whom correspondence should be addressed.
J. Mar. Sci. Eng. 2022, 10(3), 369; https://doi.org/10.3390/jmse10030369
Submission received: 11 February 2022 / Revised: 24 February 2022 / Accepted: 28 February 2022 / Published: 4 March 2022

Abstract

:
In this paper, forces and torques on solid, non-spherical, orthotropic particles in Stokes flow are investigated by using a numerical approach on the basis of the Boundary Element Method. Different flow patterns around a particle are considered, taking into account the contributions of uniform, rotational and shear flows, to the force and the torque exerted on the particle. The expressions for the force and the toque are proposed, by introducing translation, rotation and deformation resistance tensors, which capture each of the flow patterns individually. A parametric study is conducted, considering a wide range of non-spherical particles, determined by the parametric superellipsoid surface equation. Using the results of the parametric study, an approximation scheme is derived on the basis of a multivariate polynomial expression. A coefficient matrix for the polynomial model is introduced, which is used as a tunable parameter for a minimization problem, whereby the polynomials are fitted to the data. The developed model is then put to the test by considering a few examples of particles with different shapes, while also being compared to other, currently available solutions. On top of that, the full functionality of the model is demonstrated by considering an example of a pollen grain, as a realistic non-spherical particle. First, a superellipsoid, which best fits the actual particle shape, is found from the considered range. After that, the coefficients of the translation, rotation and deformation resistance tensors are obtained from the present model and compared to the results of other available models. In the conclusion, a superior accuracy of the present model, for the considered range of particles, is established. To the best of the authors knowledge, this is also one of the first models to extend the torque prediction capabilities beyond sphere and prolate particles. At the same time, the model was demonstrated to be simple to implement and very conservative with the computational resources. As such, it is suitable for large scale studies of dispersed two-phase flows, with a large number of particles.

1. Introduction

Multiphase flows with non-spherical particles are being extensively researched in recent years, by authors from numerous fields of engineering and science. Nowadays, with significant development of computational methods, one of the greatest challenges still remains in tackling industrial level simulations. This follows from a fact that they are frequently associated with complex carrier fluid flow fields and a large number of dilutely distributed, non-spherical particles. Problems of this nature are usually treated by using the Euler-Lagrangian approach, based on the point-particle assumption, which is valid for particle sizes much lower than the Kolmogorov length scale of the flow. Such an approach relies on using a model for the prediction of the particle-fluid interaction, instead of using the computationally expensive direct approach. Albeit the simplifications, this approach was proven successful for a number of problems considering disperse flows [1], where small particles are involved. A typical starting point for the formulation of particle-fluid interaction is the Maxey-Riley equation [2] that was originally developed for spheres. It has been repeatedly shown that for sufficiently high particle-to-fluid density ratios (i.e., in solid-gas suspensions), the most important terms are gravity and drag [3,4,5], which dominate the particle translation. The simplest model for drag is that of a sphere in a creeping flow, which was later extended to other flow regimes [6,7,8]. Due to its simplicity, accuracy and the fact that the drag formulation for a sphere has been available for the longest, researchers have extensively relied on the assumption of the spherical particle shape. Significant research interest still exists for this approach, as there is a number of applications [9,10,11,12], where the best representation of the particle shape is in fact spherical. On the other hand, it is not uncommon that a reasonable shape specific model does not exist for the actual particle shape and flow regime [13], in which case a spherical drag model can still be used, at least to gain an approximate overview of the observed phenomena. Unlike for the spheres, drag models for non-spherical particles are significantly more complex, not only because of the increased shape formulation effort, but also due to the fact that the particle orientation, with respect to the flow velocity field, needs to be accounted for. One of the first attempts to consider the drag of a simplest non-spherical particle had been carried out by Oberbeck [14], who derived the analytical solution for the drag of an arbitrarily oriented ellipsoid in an uniform creeping flow. Despite the limitation of the linear flow field around the particle, this is still one of the very few models available for non-spherical particles, which is based on the exact expression for the drag prediction. Among the many studies considering the ellipsoidal particles, prolate [15,16] and oblate [17] ellipsoids still seem to be the most popular choices. Nevertheless, for the comprehensive description of the particulate phase involving non-spherical particles, employing only the drag model is not sufficient, as it has been repeatedly demonstrated [18,19,20]. It is now well understood that the rotation can significantly affect the particle dynamics and other associated phenomena, such as their deposition. With this in mind, one can no longer neglect the importance of employing an accurate model for the torque, along with those for the drag. Much like for the drag, ellipsoids [21] are one of the very few geometries for which the exact torque expression is available, based on the analytical solutions of the creeping flow field around the particle. Together with the ellipsoid drag model, both have been proven very useful when applied to the problems with fibrous micro-particles, for example in bio-engineering [22,23], medicine [24], paper-making industry [25] and in nuclear reactors processes [26]. That said, it is important to remember that non-spherical particles, encountered in a number of natural or industrial flows, are often distinctively irregular, up to the extent where readily available exact models fail to deliver a reasonable solution. To overcome that, drag models based on generalised shape descriptions were proposed as a result of the extensive experimental work throughout the years. In those models, the particle shape is characterised by shape descriptors, i.e., sphericity [27], which is then used as a relation of the particle shape with the drag prediction. Some of the more advanced models also employ additional shape descriptors [28] and even consider the particle orientation [29]. Examples that can be found in the literature range from the studies of volcanic ash transport in the atmosphere [30,31], as well as investigations of ice crystal trajectories in an aircraft turbofan compressor [32], to simulating the formation of polymer particles in a downer reactor [33].
Taking into account the facts from the presented literature, we identify the lack of available drag and torque models, based on the exact formulation, for a wider range of non-spherical particle shapes. With the exception of ellipsoids, almost all other non-spherical particles can still only be captured by generalised shape description models, which inevitably comes at a cost of the prediction accuracy [34]. For that reason, we propose an extension to the existing models for ellipsoids by introducing a multi-parameter surface description based on the superellipsoidal equation. Some authors estimate [35] that as much as 80 % of solids can be represented by superquadratic functions. In comparison with ellipsoids, this expands the parametrization capabilities to a significantly wider range of shapes, such as cylinders, cuboids, rhomboids and even octahedrons. In order to retain the benefits of the exact models, the drag and torque expressions are employed by considering the actual particle shape and its orientation. This allows for the treatment of all non-spherical particles that can be represented by superellipsoids, with essentially the same accuracy as analytical models provide for ellipsoids. Moreover, with this approach, new insights into the complex-shaped particle dynamics can be gained, by exposing the details that most of the generalised shape models would not be able to reconstruct. Hereinafter we present the superellipsoid drag and torque modelling framework, by means of which we obtain the necessary data to derive the required correlations. Following from that, we demonstrate the validity of the numerical approach by conducting a validation study, including the evaluation of mesh resolution and computational domain sizing. In the end, we present the final drag and torque models for superellipsoidal particles, for use in Lagrangian particle tracking applications, together with its accuracy evaluation and the functional demonstration.

2. Governing Equations

Let us consider the relative flow of a carrier fluid, around a small particle. As discussed in the introduction, we are limiting ourselves to a particle size smaller than the Kolmogorov length scale of the flow. Typically, this also results in a correspondingly small particle Stokes number S t p = ( 1 / 18 ) ( ρ p / ρ f ) ( d p / η ) 2 , where ρ p and ρ f are the particle and fluid densities respectively, d p is the particle diameter and η is the Kolmogorov length scale. It has been repeatedly shown that for a sufficiently small Stokes numbers, the particle almost perfectly traces the fluid streamlines, without any significant detachments from the flow [36]. This in turn means that the relative flow velocity around a particle is low and typically falls well into the viscous (Stokes) regime. As a result, we assume a steady state incompressible flow of a Newtonian fluid around a particle, at a very small particle Reynolds number, R e p = | | u | | 2 d p / ν 1 , where | | u | | 2 is the relative flow velocity magnitude and ν is its kinematic viscosity. In this case the advection term in the Navier-Stokes equations can be neglected, which results in the creeping flow (Stokes) equations:
· u = 0 , · σ ̲ + ρ f g = 0 .
Here g is the gravitational acceleration and σ ̲ is the Cauchy stress tensor defined as σ ̲ = P I ̲ + τ ̲ , where P is the pressure, I ̲ the identity tensor, and τ ̲ the viscous stress tensor. Considering a Newtonian fluid, we model the viscous stresses as τ i j = μ u i x j + u j x i , where μ = ν ρ f , rendering the following form of the Stokes equation
P + μ 2 u + ρ f g = 0 .
Finally, we recognise that gravity is a conservative force, which may be written as a gradient of gravitational potential Φ and introduce a modified pressure as p = P ρ f Φ , where g = Φ . The final form of the Stokes equation reads
p + μ 2 u = 0 .
The Stokes flow Green’s functions satisfy the continuity equation · u = 0 and are the solutions of the singularly forced Stokes equation. Defining r ^ = r r 0 and r = | r ^ | , the 3D free-space Green’s functions can be written as:
G i j = δ i j r + r ^ i r ^ j r 3 , T i j k = 6 r ^ i r ^ j r ^ k r 5 .
Let q = σ ̲ · n denote the boundary traction, i.e., the flux of momentum into or out of the boundary. The boundary integral representation for the Stokes problem [37] is:
c ( r 0 ) u j ( r 0 ) = Γ P V u i ( r ) T i j k r , r 0 n k ( r ) d Γ ( r ) 1 μ Γ G j i r , r 0 q i ( r ) d Γ ( r ) ,
where c ( r 0 ) = 2 α is twice the solid angle as seen from the point r 0 , i.e., in the interior of the domain c = 8 π , at a smooth boundary c = 4 π . The normal vector n points into the domain. The first term on the r.h.s represents the double layer potential of three-dimensional Stokes flow, and the second term is the single-layer potential of three-dimensional Stokes flow.

Boundary Element Solution of Stokes Flow over a Particle

The boundary integral Equation (5) is used as the basis of the Boundary Element Method (BEM) solver, which we developed. The numerical implementation is based on our Laplace BEM solver [38,39]. We consider the boundary Γ = l Γ l to be decomposed into boundary elements Γ l :
c ( r 0 ) u j ( r 0 ) = l Γ l P V u i ( r ) T i j k r , r 0 n k ( l ) d Γ ( r ) 1 μ l Γ l G j i r , r 0 q i ( r ) d Γ ( r ) ,
where n k ( l ) is the k component of the normal vector pointing from boundary element l into the domain.
Let Φ and Ψ be the interpolation functions used to interpolate the function and flux values within the boundary elements, i.e., u i = m Φ m u i ( l , m ) and q i = m Ψ m q i ( l , m ) , where u i ( l , m ) is the m t h nodal value of the function within the l t h boundary element. This yields
c ( r 0 ) u j ( r 0 ) = l m u i ( l , m ) Γ l P V Φ m T i j k r , r 0 n k ( l ) d Γ ( r ) 1 μ l m q i ( l , m ) Γ l Ψ m G j i r , r 0 d Γ ( r ) .
The integrals above depend only on the mesh geometry and are independent of the flow solution. As such, they may be calculated in advance and stored. Since the boundary elements share nodes, the number of integrals that need to be stored is smaller than the number of integrals calculated, since the integrals, which are needed by the same node, can be summed up.
To obtain a system of equations from unknown velocities and tractions, we place the source point in all boundary nodes. Storing the integral values in matrices ( [ T i j ] , row corresponding to different source points, columns to different nodes in the mesh) and flow quantities in nodal vectors { u i } , we obtain the following system of equations:
{ u x } [ T x x ] c [ I ] + { u y } [ T y x ] + { u z } [ T z x ] = 1 μ { q x } [ G x x ] + { q y } [ G x y ] + { q z } [ G x z ]
{ u x } [ T x y ] + { u y } [ T y y ] c [ I ] + { u z } [ T z y ] = 1 μ { q x } [ G y x ] + { q y } [ G y y ] + { q z } [ G y z ]
{ u x } [ T x z ] + { u y } [ T y z ] + { u z } [ T z z ] c [ I ] = 1 μ { q x } [ G z x ] + { q y } [ G z y ] + { q z } [ G z z ]
Boundary conditions include known values for { u x } , { u y } , { u z } , { q x } , { q y } , { q z } . Collocation points are placed only into nodes, where the value is unknown. A system of linear equations is set up for all unknowns, where in case of unknown { u x } or { q x } Equation (8) is used, in case of unknown { u y } or { q y } Equation (8) is used and in case of unknown { u z } or { q z } Equation (9) is used. Additional details of the BEM employed, such as implementation of integration, can be found in [38,39].
When considering flow over a particle using this method, a no-slip velocity boundary condition is prescribed at the particle surface and the algorithm renders boundary tractions. These can be integrated over the particle’s surface to obtain the force and torque exerted on the particle by the fluid. The main advantage of using BEM for this task over domain based methods such as finite volumes is that boundary tractions are obtained by direct solution of the system of equations and not post-processed from the velocity fields. Additionally, only the particle surface must be discretizised, a volume mesh is not necessary, leading to faster computational times.

3. A Particle in Stokes Flow

We aim to investigate the fluid flow induced forces and torques on non-spherical particles. Our main goal is to extend the currently available modelling options for non-spherical particles, as highlighted in the introduction. Since we want to consider a wider range of particle shapes, it is a good idea to employ a parametric surface definition approach. In order to enable shape manipulation options, we introduce a superellipsoidal particle [40,41,42] with four parameters λ 1 , λ 2 , e 1 and e 2 and fix its volume to V = π / 6 , which is the volume of a sphere with diameter d p = 1 . The three semiaxes are
a = λ 1 c , b = λ 2 c , c = π 12 λ 1 λ 2 e 1 e 2 B ( e 1 / 2 + 1 , e 1 ) B ( e 2 / 2 , e 2 / 2 ) 1 / 3 ,
where B ( ) is the beta function. Placing the frame of reference in the centre of the superellipsoid and aligning the coordinate system axes with the semiaxes of the superellipsoid, we can define the surface of the superellipsoid as
S ( x , y , z ) = x a 2 / e 2 + y b 2 / e 2 e 2 / e 1 + z c 2 / e 1 .
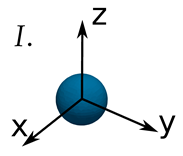
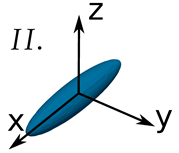
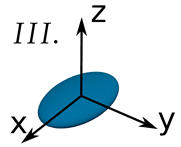
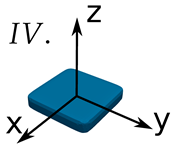
In Figure 1 a couple of representative superellipsoidal particles are shown highlighting the wide variety of shapes, which can be modelled by the superellipsoidal parametrization. The particle frame of reference (PFR) is also shown.
We consider a particle moving in a fluid, where u is the fluid velocity in the PFR. The force on the particle can be calculated by
F = Γ q d Γ = π μ c K ̲ · u ,
where q = σ ̲ · n is the boundary traction and K ̲ is the translation resistance tensor expressed in the PFR. The boundary traction represents the sink of momentum at the particle surface and thus its integral over the surface yields the force. When we consider a spinning particle in a stationary fluid, the torque is T = Γ r × q d Γ = μ π c 3 Ω ̲ · ω where Ω ̲ is the rotation resistance tensor and ω is the angular velocity of the particle in the PFR. The flow shear also affects the rotation dynamics of the particle. Taking both contributions into account, the torque can be expressed as
T = Γ r × q d Γ = μ π c 3 Π ̲ · f g h + Ω ̲ · ξ ω x η ω y χ ω z ,
where Π ̲ is the deformation resistance tensor. Here f, g, h are the elements of the deformation rate tensor and ξ , η and χ are elements of the spin tensor, defined as
f = 1 2 u z y + u y z , g = 1 2 u x z + u z x , h = 1 2 u x y + u y x ,
ξ = 1 2 u z y u y z , η = 1 2 u x z u z x , χ = 1 2 u y x u x y .
Making use of the Lorentz reciprocal theorem [43], Happel and Brenner [8] showed that the translation resistance tensor and the rotation resistance tensors are symmetric. As an immediate consequence of the properties of symmetric tensors, every particle must posses principal axes of translation, i.e., three perpendicular directions such that translating without rotation to one of them, the particle experiences a force only in that direction. In the case, when the particle is orthotropic (possess three mutually perpendicular symmetry planes), it follows from symmetry considerations that the principal axes of translation are normal to the symmetry planes. Moreover, similar can be applied for the particle rotation in a uniformly rotating and shearing flow. If we employ a two-dimensional uniform flow, with pure rotation or pure shear, blank with the particle symmetry planes, the resulting torque is limited to a single principal axis, normal to the symmetry plane where the flow is employed. Thus, considering orthotropic particles and choosing the particle reference frame blank with symmetry planes, the translation K ̲ , rotatation Ω ̲ and deformation Π ̲ resistance tensors are diagonal. That said, one must determine nine components to completely describe the force (13) and torque (14) experienced by a particle in an arbitrary creeping flow field. The K ̲ , Ω ̲ and Π ̲ tensors are expressed with respect to the particle frame of reference. Using a general tensor rotation formalism, we can transform them into the inertial (Eulerian) frame by writing K ˜ ̲ = R ̲ T K ̲ R ̲ , where K ˜ ̲ is the translation resistance tensor in the inertial frame of reference and R ̲ is the rotation matrix. The transformation of Ω ̲ and Π ̲ tensors is analogous to that of the K ̲ tensor.

4. Numerical Setup

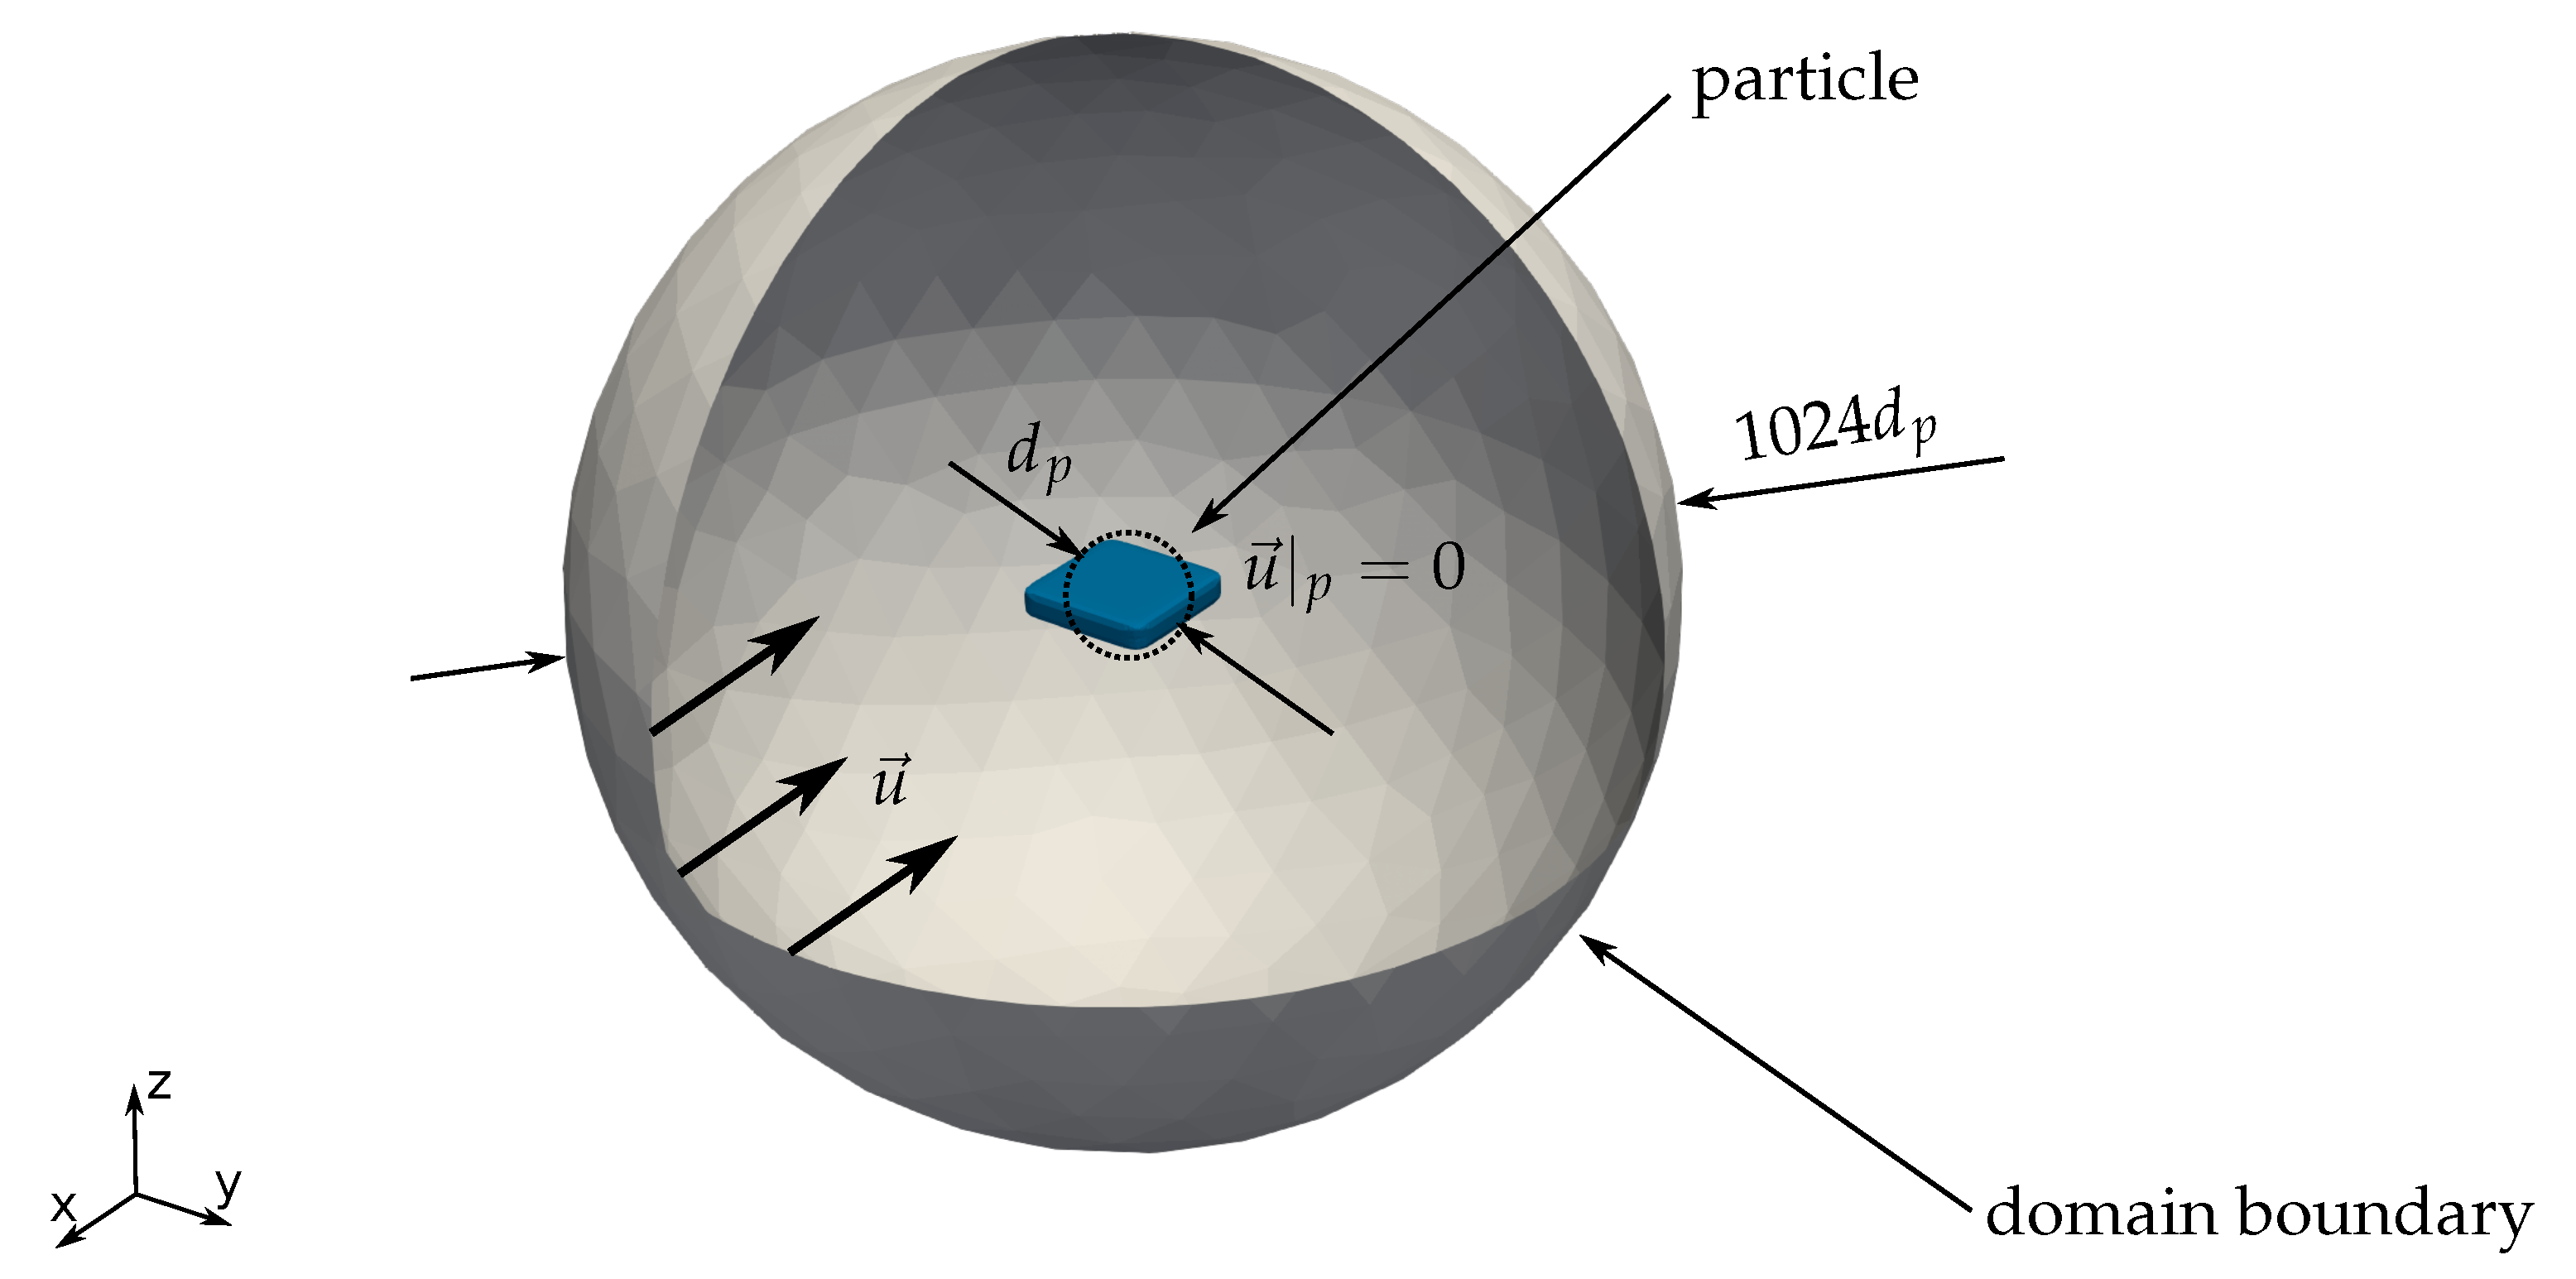
For the purpose of this study, we employ a three-dimensional numerical model of a superellipsoidal particle in creeping flow. The numerical domain, in the shape of a sphere (Figure 2), is generated with the particle under consideration positioned in its centre.
Since Stokes flow is diffusive in nature and the simulations are steady state, we expect the perturbation of the fluid due to the particle to be non-negligible in a very large region. The Stokes’s analytical solution for flow over a sphere reveals that the perturbation in flow velocity diminishes as 1 / r measuring away from the particle. This means that the boundary conditions must be placed far away from the particle in order not to have a significant effect on the force and torque calculations. Therefore, in order to correctly assess the flow field and the resistance and rotation tensors, we take into account the findings of some recent studies listed below. Chadil et al. [44] performed a DNS study of the flow around the sphere, where they used an rectangular domain of 16 d p × 8 d p . Likewise, Zastawny et al. [45] also employed an rectangular domain, sized to 20 d p × 20 d p × 10 d p , in their immersed boundary method (IBM) setup for non-spherical particles. An extensive study of low-Re flow around non-spherical particles was conducted by Andersson and Jiang [46], who selected a volume equivalent cube edge length as a comparative domain measure. Edge lengths from 20 d p to 170 d p were examined, where the length of 135 d p was claimed to produce a sufficiently domain independent solution. In a similar fashion, Štrakl et al. [47] employed a cube-shaped domain, with the base edge length of 160 d p , for their parametric study of drag and lift forces acting on non-spherical particles. At least in the latter of the four studies, the authors had to accept a compromise regarding the domain size selected for the study, as the mesh element count was required to be kept within reasonable limits. This is typically an inevitable consequence of the available computational resources and time, especially in the case of parametric studies, where a high number of simulations is required. Overcoming this limitation comes as one of the main advantages of using BEM, where meshing the volumetric domain is not required. With this in mind, if we proceed to the question of the domain size in the present work, we are able to chose the diameter of the outer sphere almost arbitrarily, which we finally set to a value of 1024 d p . In the case of creeping flow around a sphere, using the domain of this size would reduce the effects of the domain boundary to ∼0.1%, compared to ∼1%, as achieved by the domains used in [46,47].
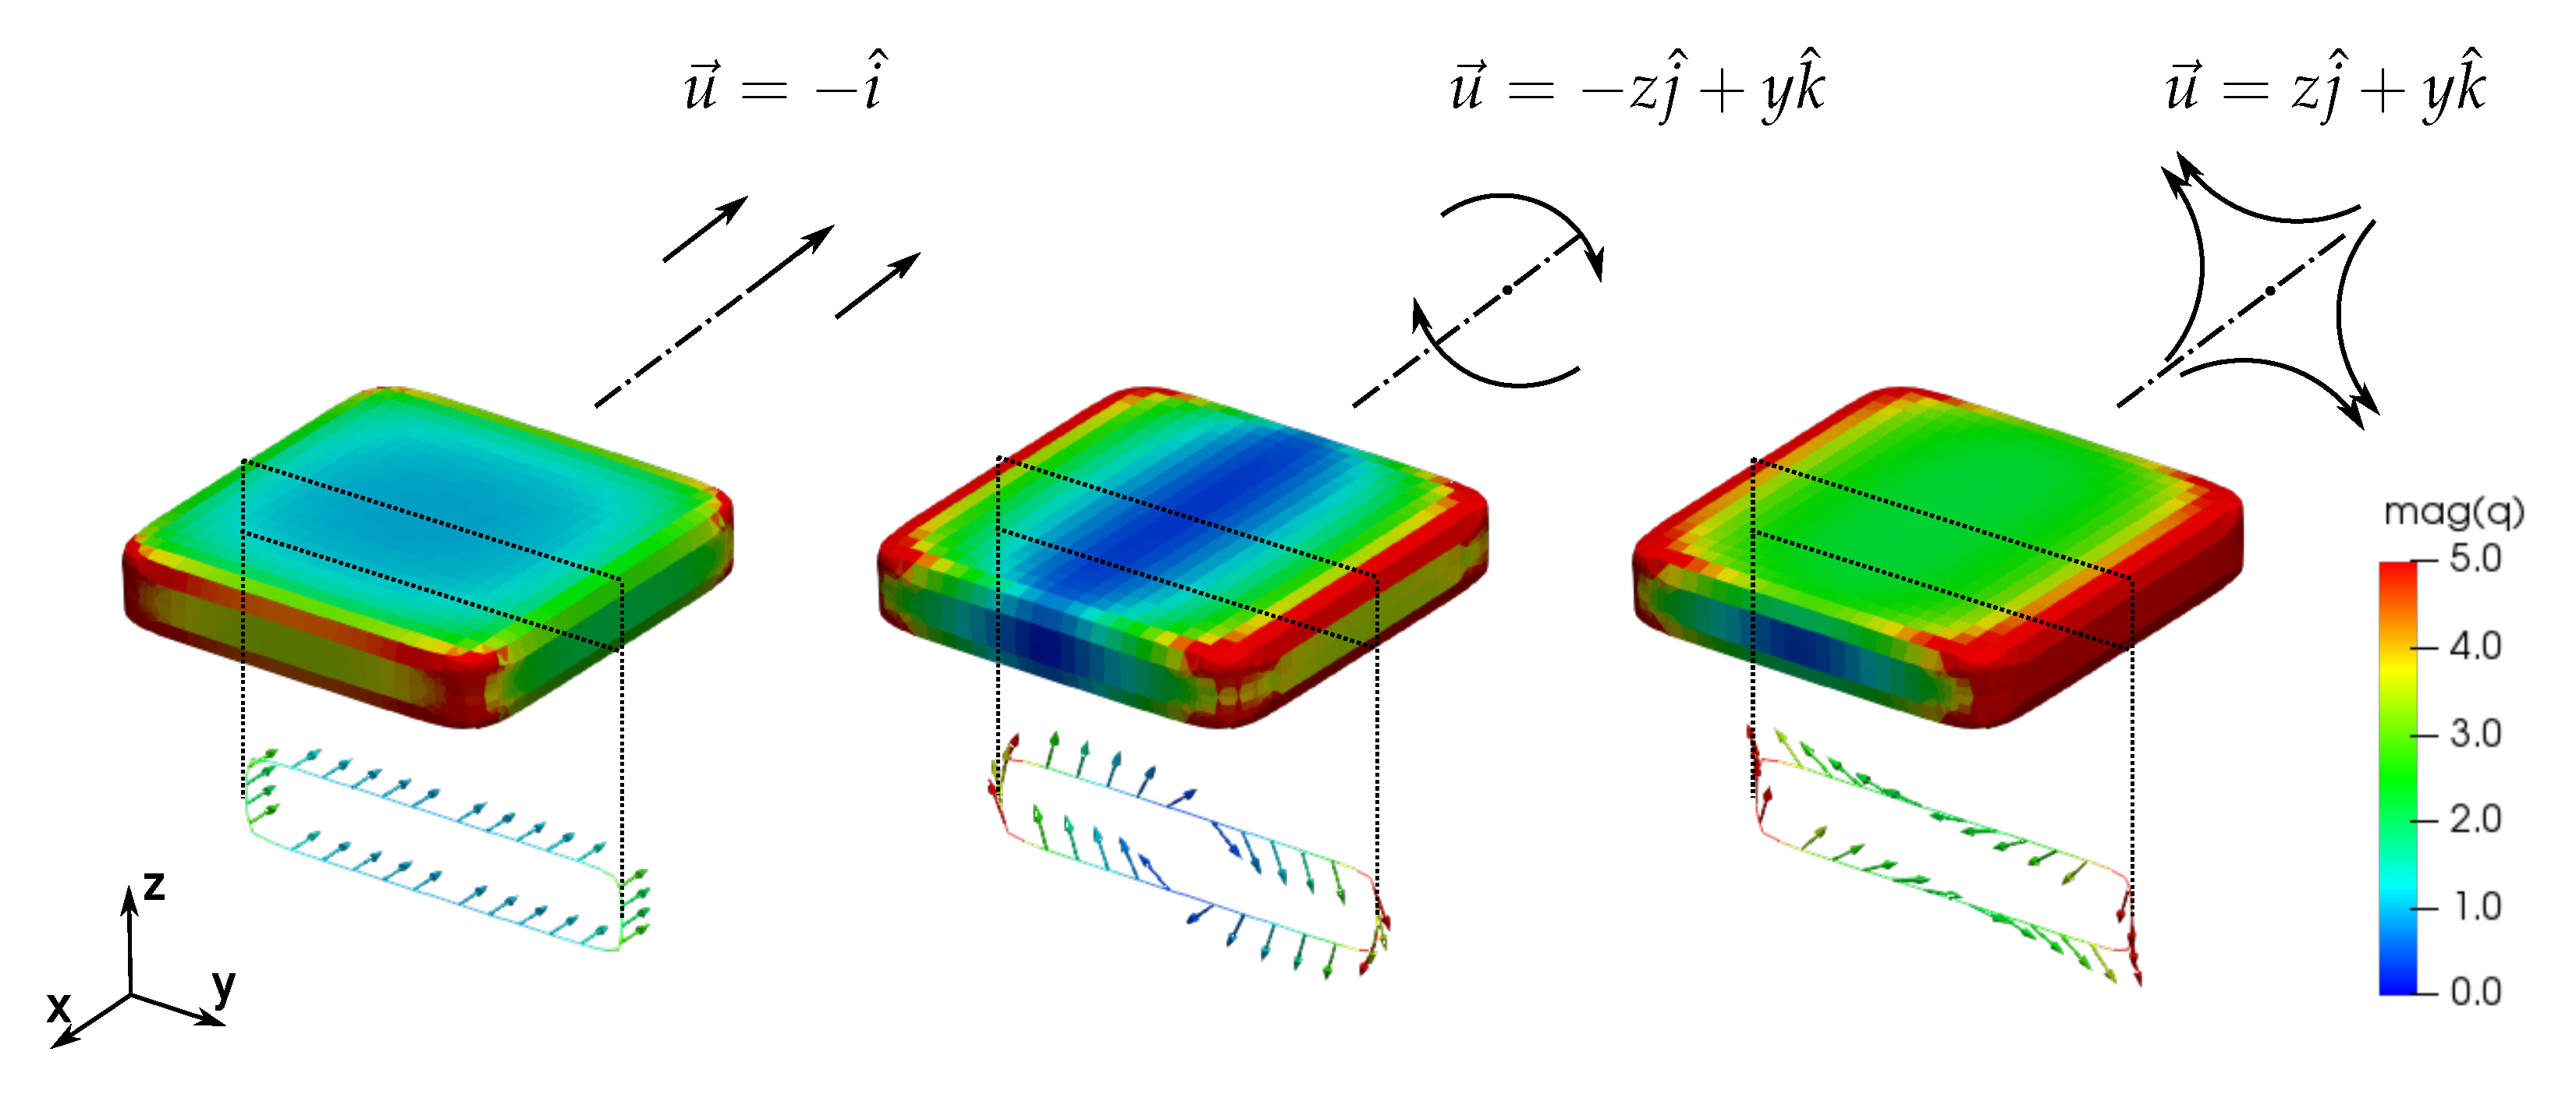
The boundary condition, imposed at the surface of the outer sphere (domain boundary), is a known velocity field. We decide to process the contributions of different resistance tensors separately. Following from that, we employ nine different velocity fields, to take in to account all three principal axes for the translation, rotation and shear flow. In the case of estimating the translation resistance tensor K ̲ we prescribe the velocity corresponding to the translation of the particle in a stationary fluid, along the three axes of symmetry, namely u = i ^ (Figure 3, left). The unit vectors ( i ^ , j ^ , k ^ ) define the standard basis of the coordinate vector space. To obtain the rotation resistance tensor Ω ̲ , we prescribe the velocity field corresponding to a uniform rotation of the particle, around the three axes of symmetry, namely u = z j ^ + y k ^ (Figure 3, centre). Analogously, for the deformation resistance tensor Π ̲ we prescribe the two-dimensional pure shear velocity field, normal to the three symmetry axes, namely u = z j ^ + y k ^ (Figure 3, right). At the same time, we prescribe a no-slip condition at the surface of the particle, to close the set of the required boundary conditions. According to (8)–(10), one can see that the result of such simulation is a traction at the particle surface q , which is displayed in Figure 3. When integrated according to Equations (13) and (14), this yields the force and the torque exerted on the particle by the fluid.

5. Mesh Study and Validation

To validate the proposed algorithm and to estimate its accuracy, we first consider a particle in the shape of a prolate ellipsoid, by varying the axial ratio λ 1 and keeping the rest of the superellipsoidal parameters at unity ( λ 2 = 1 , e 1 = 1 , e 2 = 1 ). For such a particle, Jeffery [21] analytically derived the non-zero components of the three resistance tensors in creeping flow. Ravnik et al. [19] established that their validity is limited to particles, whose size is much smaller than the Kolmogorov length scale. The expressions for the tensor components, as given by Jeffery [21], are
K x x = 8 [ λ 1 2 1 ] 3 / 2 [ 2 λ 1 2 1 ] ln [ λ 1 + λ 1 2 1 ] λ 1 λ 1 2 1 , K y y = K z z = 16 [ λ 1 2 1 ] 3 / 2 [ 2 λ 1 2 3 ] ln [ λ 1 + λ 1 2 1 ] + λ 1 λ 1 2 1 ,
and
Ω x x = 16 λ 1 3 1 α 0 , Ω y y = Ω z z = 16 λ 1 3 1 + λ 1 2 α 0 + λ 1 2 γ 0 ,
Π x x = 0 , Π y y = Π z z = 16 λ 1 3 1 λ 1 2 α 0 + λ 1 2 γ 0 .
The nondimensional coefficients α 0 and γ 0 were defined by Gallily and Cohen [48] as
α 0 = λ 1 2 λ 1 2 1 + λ 1 2 [ λ 1 2 1 ] 3 / 2 ln λ 1 λ 1 2 1 λ 1 + λ 1 2 1 ,
γ 0 = 2 λ 1 2 1 λ 1 [ λ 1 2 1 ] 3 / 2 ln λ 1 λ 1 2 1 λ 1 + λ 1 2 1 .
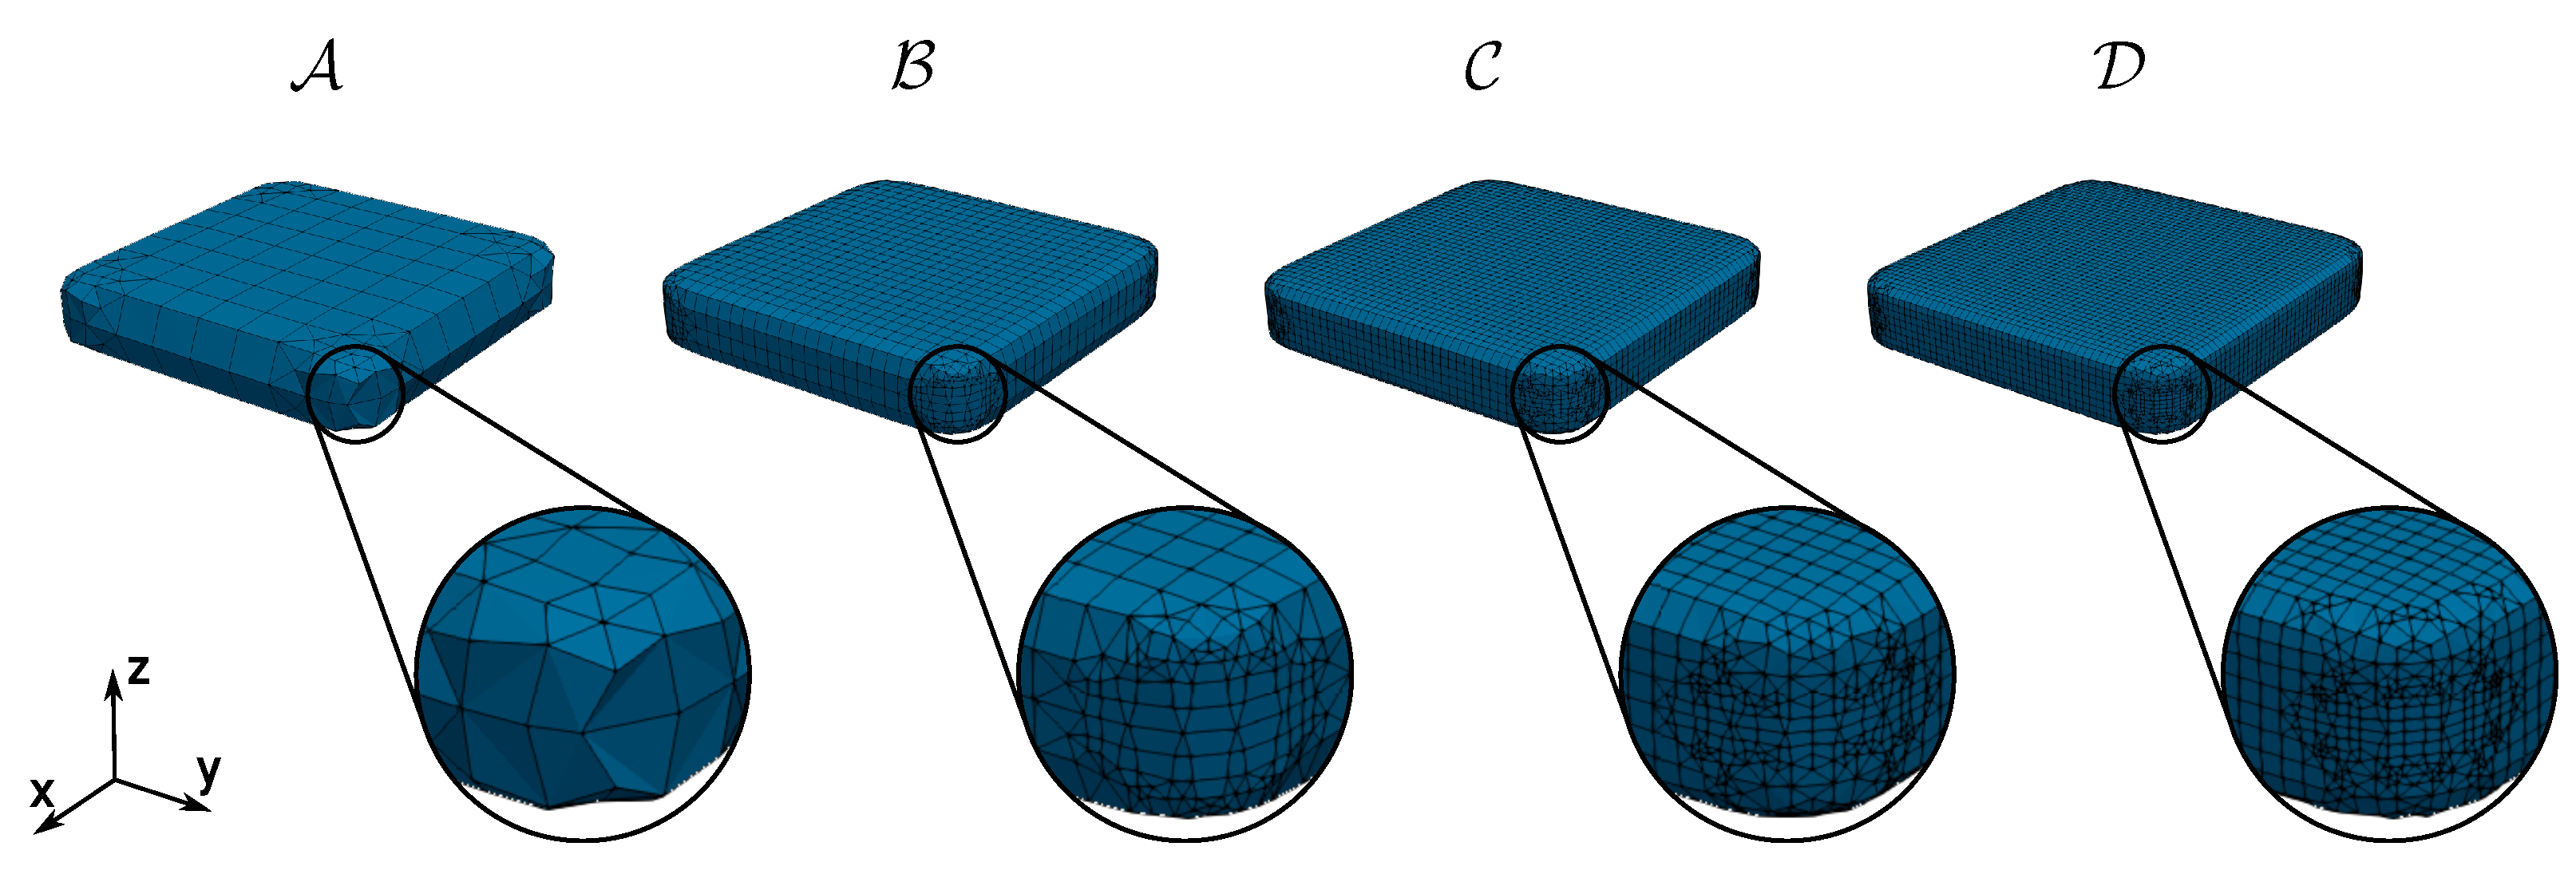
Starting from the special case of λ 1 = 1 (where the particle is in fact a sphere) the two nondimensional coefficients are lim λ 1 1 α 0 = lim λ 1 1 λ 1 2 γ 0 = 2 3 , while the resulting non-zero tensor components are K i i = 6 and Ω i i = 8 . We continue with two additional prolate particles, by setting λ 1 = 2 and λ 1 = 5 , for which we compute the tensor components in accordance with (17)–(19). Together with the spherical particle, they are used as a reference, to confirm the validity of the proposed numerical approach. The domain discretization is employed in two steps. First a domain boundary (the outer sphere) is meshed separately with approximately 4.1 · 10 3 degrees of freedom, which is kept constant for all cases. After that, the particle meshing is employed, where in total four different meshes are considered. We begin with mesh A , which has 7.4 · 10 3 degrees of freedom and continue with mesh B with 15.9 · 10 3 , mesh C with 31.1 · 10 3 and mesh D with 48.4 · 10 3 degrees of freedom. As we are trying to capture different particle shapes, some discrepancy between the meshes was unavoidable, so the above given DOFs are the average values for all particles. The results, in terms of the diagonal components of the translation, rotation and deformation resistance tensors, obtained for all meshes, are given in Table 1. As evident, the numerical results compare well with the analytical values. The average relative errors of all three particles, for all non-zero tensor components, are 2.1 % for mesh A , 0.21 % for mesh B , 0.15 % for mesh C and 0.14 % for mesh D .
Moreover, to also demonstrate the adequacy of the mesh, when capturing real superellipsoids, we select two additional particles by employing all four superellipsoidal parameters. The first, a rectangular disc particle, is obtained by using λ 1 = 5 , λ 2 = 5 , e 1 = 0.2 , e 2 = 0.2 and the second, a pyramid-like particle, by using λ 1 = 10 , λ 2 = 10 , e 1 = 1.5 , e 2 = 1.5 . We repeat the above process, where all non-zero tensor components are computed, for the same four mesh densities. In Figure 4, the meshes A - D of the rectangular disc particle are visualised. Due to the lack of analytical expressions and the lack of availability of experimental results, we have to base our verdict regarding the mesh accuracy on the convergence of the values of interest alone. This is displayed in Figure 5, where the resulting tensor components are plotted against the number of DOF for each mesh. The resistance tensor components K x x and K z z are shown in Figure 5a, Ω x x and Ω z z in Figure 5b and Π x x in Figure 5c. We notice that not all tensor components have been presented, which is supported by the fact that the two considered particles possess both axial ratios of the same value ( λ 1 = λ 2 ), so the following simplifications are observed in the resulting tensor components: K x x = K y y , Ω x x = Ω y y , Π x x = Π y y and Π z z = 0 . In general, the convergence behaviour is similar to the previous study, where spherical and prolate particles have been considered. Albeit some indications already appeared in the results from Table 1, the plots in Figure 5 clearly show the lesser sensitivity of the K ̲ tensor components to the mesh density, compared to the components of the Ω ̲ and Π ̲ tensors. For example, in case of the rectangular-disc particle, the average change in the K ̲ tensor components, from mesh A to mesh D is around 1.8 % , while the same for Ω ̲ and Π ̲ yields around 5.1 % . Nevertheless, if we take mesh B for our starting point, the average tensor component changes reduce to approximately 0.4 % for K ̲ , 1.0 % for Ω ̲ and 1.1 % for Π ̲ . We can observe that all of the tensor components start to settle at the latest around 20 · 10 3 DOF, which is consistent with what we have already established when considering the sphere and the prolate ellipsoids. After the extensive mesh evaluation, we are choosing mesh B as appropriate for the main parametric study. This mesh is also considered to have the optimal trade-off between accuracy and the required computational resources.

6. Results

6.1. Data Inspection

The models of shape dependant translation, rotation and deformation resistance tensor components are based on the conducted parametric study, where we investigate approximately 5.4 · 10 3 superellipsoidal particles, which are obtained from the following range for the superellipsoidal parameters: λ 1 = [ 1 , 11 ] , λ 2 = [ 1 , 11 ] , e 1 = [ 0.2 , 1.8 ] and e 2 = [ 0.2 , 1.8 ] . Additionally, we employ a minor simplification by limiting the parameter λ 2 λ 1 , as we recognise that, for example, the particle with axial ratios of λ 1 = 5 , λ 2 = 3 is in fact geometrically identical to the particle with axial ratios of λ 1 = 3 , λ 2 = 5 rotated by 90 . This in turn allows us to reduce the final count of the particles in the study from 9.8 · 10 3 to 5.4 · 10 3 , without loosing significant data in the set. That said, we compute each of the nine tensor components, required to construct the K ̲ , Ω ̲ and Π ̲ tensors, for the remaining range of particles in the study. At this point, we are left with a decent amount of raw data, obtained by the direct numerical computation with BEM. In order to simplify the process of putting the obtained results into use, we aim to find a suitable approximation scheme.
We have to realise that the mathematical space in consideration is essentially four-dimensional ( λ 1 , λ 2 , e 1 , e 2 ). As a result, we cannot expect to find any trivial solution for producing an accurate fit expression, to capture the complex nature of the data in question. Instead, we decide to make a number of data projections, for all nine tensor components, where we fix some of the parameters to constant values, which, in essence, reduces the dimensionality of the observation points. As an example of that, we present the tensor components K z z , Ω z z and Π z z on a 3 D plot, where we fix two dimensions to a constant. In Figure 6 the tensor components are shown with respect to λ 1 and λ 2 , while e 1 and e 2 are fixed to unity. Likewise, in Figure 7 the data is displayed with respect to e 1 and e 2 , while λ 1 and λ 2 are 5 and 3 respectively. By observing the Figure 6 and Figure 7, one can immediately establish that the data shows distinctively non-linear characteristics. We can maybe identify a slightly less pronounced non-linear behaviour in the case of K z z , whereas the behaviour of the Ω z z and Π z z components is relatively similar.
With this in mind, we proceed by finding approximation functions, to reconstruct the resulting tensor components with respect to the particle geometric parameters. Initially, we limit ourselves to fit only a single variable function, while fixing other parameters to constant, due to the enormous complexity involved, when considering more than one parameter at once. By making a few educated guesses, we employ a general polynomial as a one-dimensional non-linear fit expression, which we fit to data observations, presented on Figure 6 and Figure 7. Four functions are fitted to the results of each tensor component, namely two by fixing λ 1 and two by fixing λ 2 in Figure 6 and analogously with e 1 and e 2 in Figure 7. After comparing the fit accuracy for different order polynomials, we establish a third order polynomial as appropriate for fitting the parameters λ 1 and λ 2 and a second order polynomial for e 1 and e 2 . To confirm that, we evaluate the corresponding coefficient of determination R 2 for each fitted function, where we obtain R 2 ¯ = 0.98 as an average for all fitted functions.

6.2. Approximation Scheme Derivation

We are deriving a multivariate approximation scheme to predict each of the nine tensor components individually. We begin by first writing a general m t h order univariate polynomial, using vector notation, as p m ( x ) = [ 1 x x 2 x m ] T . At the moment we assume its coefficients to be equal to unity. We set up the initial expression for each geometric parameter, employing the polynomial order as just established, which yields p 3 ( λ 1 ) , p 3 ( λ 2 ) , p 2 ( e 1 ) and p 2 ( e 2 ) . Prior to introducing the momentarily missing polynomial coefficients, we combine the first two and the second two polynomials together, to obtain two bi-variate polynomials. We write their tensor product and vectorize [49] its transpose back to the column vector, namely p 3 , 3 ( λ 1 , λ 2 ) = vec p 3 ( λ 1 ) p 3 ( λ 2 ) T T and p 2 , 2 ( e 1 , e 2 ) = vec p 2 ( e 1 ) p 2 ( e 2 ) T T . At this point we define the matrix of polynomial coefficients A ̲ , with dimensions 16 × 9 , where 16 is the dimension of a vector p 3 , 3 ( λ 1 , λ 2 ) and 9 is the dimension of a vector p 2 , 2 ( e 1 , e 2 ) . With everything set up so far, we write
f ( λ 1 , λ 2 , e 1 , e 2 ) = p 3 , 3 ( λ 1 , λ 2 ) T A ̲ p 2 , 2 ( e 1 , e 2 ) = A 16 , 9 λ 1 3 λ 2 3 e 1 2 e 2 2 + A 16 , 8 λ 1 3 λ 2 3 e 1 2 e 2 + + A 1 , 2 e 2 + A 1 , 1 ,
where f ( λ 1 , λ 2 , e 1 , e 2 ) is the resulting approximation scheme for an individual tensor component. To obtain the coefficients of A ̲ we reformulate (22) into an optimization problem, again, for each tensor component separately. First, let us define the sum of squared errors, which we try to minimise, namely
min A ̲ i = 1 n f i ( λ 1 , λ 2 , e 1 , e 2 ) y i y i 2 ,
where f i ( λ 1 , λ 2 , e 1 , e 2 ) is the approximation scheme result (for the individual tensor component), evaluated for the i t h particle, y i is the tensor component of the i t h particle shape and n is the number of considered particle shapes. Considering the full range of the numerical results, we detect an increased standard deviation for Ω ̲ and Π ̲ results, which in turn increases the prediction difficulty for the approximation scheme. This increase of standard deviation in the results is mostly contributed by the exponentially rising magnitudes of the Ω ̲ and Π ̲ tensor components, with respect to λ 1 . To reduce this drawback as far as possible, we split the numerical results into two sub-ranges, to group together the values of similar magnitude and thus reduce the approximation error. By introducing a simple selection criteria, based on a single parameter λ 1 we obtain the two ranges, namely R 1 for λ 1 5 and R 2 for λ 1 > 5 . For solving the presented optimization problem, we use a multivariate non-linear regression method, from the software package GEKKO optimization suite [50]. As a result, we obtain the polynomial coefficient matrices with best-fitting terms for the individual tensor components in both ranges, namely A ̲ R 1 ( K x x ) , A ̲ R 1 ( K y y ) , ..., A ̲ R 1 ( Π z z ) and A ̲ R 2 ( K x x ) , A ̲ R 2 ( K y y ) , ..., A ̲ R 2 ( Π z z ) . The resulting coefficient matrices are given in the Appendix A. With that, we are able to determine all tensor components, for an arbitrary particle k within the range of the study, by simply evaluating (22) for λ 1 , λ 2 , e 1 , e 2 of the k t h particle, using A ̲ R ( α ) as the coefficient matrix, where index α denotes the tensor component and R the range under consideration.

6.3. Validation of the Approximation Scheme

Let us investigate the accuracy of the derived approximation schemes for the tensor components. Please note that there are particles in the parametric study, for which some of the tensor components are zero (or very close to zero, due to numerical errors). This in turn raises a question of representing the relative errors, as in those cases a relatively small absolute discrepancy would cause erratically high errors. For that purpose, we decide to use a modified relative error expression, which, on the example of K z z component, is given by
ε ( K z z ) = | K z z * K z z | | | K ̲ | | F ,
where ε is a modified relative error, K z z * is the tensor component of the particle, as predicted by the approximation function, K z z is a numerical result of the tensor component and | | K ̲ | | F is the Frobenius norm of the numerically computed K ̲ tensor. In Figure 8 and Figure 9 we present the ε errors for K z z , Ω z z and Π z z tensor components, plotted in terms of λ 1 , λ 2 , and e 1 , e 2 respectively. If we first focus on Figure 8, we see that the distribution of K z z errors is fairly flat, with relatively low average error, indicated as ε ¯ ( K z z ) in the right hand corner of the plot. On the contrary, the distributions for Ω z z and Π z z are showing a slightly increased dispersion between the values on the displayed range, with comparatively increased average errors. This is an expected behaviour, as we already identified that the standard deviation in the results of the latter two tensor components is much higher than in the results of the first. On the other hand, the plots in terms of e 1 , e 2 (Figure 9) are showing a very flat distribution for all considered tensor components. Following from that, we establish that the parameters λ 1 and λ 2 are significantly contributing to the standard deviation of the results and consequently to the increase of the approximation difficulty. This is also the main reason for the selection of the third order polynomial as the approximation function for λ 1 and λ 2 and the second order polynomial for e 1 and e 2 . Finally, to draw a conclusion from the above, we give the final values of modified relative errors, in terms of average for each tensor, namely ε ¯ ( K ̲ ) = 0.11 % , ε ¯ ( Ω ̲ ) = 0.28 % and ε ¯ ( Π ̲ ) = 0.31 % .

6.4. Demonstration of the Force and Torque Model Using Parametrically Defined Particles

To evaluate the performance of the derived models on some common particle shapes, we put them to the test by comparing the results to various existing methods that have been extensively employed so far. For testing, we choose five particle shapes, namely the sphere ( I ) , a prolate with λ 1 = 5 ( I I ) , an ellipsoid with λ 1 = 5 and λ 2 = 3 ( I I I ) , a rectangular disc superellipsoid with λ 1 = λ 2 = 5 and e 1 = e 2 = 0.2 ( I V ) and a pyramid-like superellipsoid with λ 1 = λ 2 = 10 and e 1 = e 2 = 1.5 ( V ) . We start by predicting the translation resistance tensor K ̲ components. As already highlighted in the introduction, a simplification of the particle shape to a sphere is still commonly in use, so we first compare to the analytical model for the drag on a sphere. Another readily available analytical model that we include for comparison, is the drag on a prolate, first derived by Oberbeck. For more irregular, non-spherical particles, a number of empirical models, based on experimental results, are available. We use the models of Haider and Levenspiel [27], Leith [28] and Holzer and Sommerfeld [29] for our comparison. The results in terms of predicted K ̲ tensor components are given in Table 2. The shaded area in the last row of each particle section is the average of all component errors, computed by the modified relative error expression (24). For particles, where analytical results are available, we use those as a reference, while for other particles we use the results as obtained by the direct simulation. Obviously, particles I and I I are best captured by the corresponding analytical models, where the error is zero. On the other hand, as soon the particle geometry starts to deviate spherical or prolate shape, the errors of the analytical models start to increase significantly. In those cases, all three empirical models perform much better, where the most accurate off all three appears to be the one from Holzer and Sommerfeld. However, we can see that for all particles under consideration, the present model significantly outperforms all of the considered empirical models, while also performing very close to the accuracy of the analytical models, for the particles I and I I . The average errors obtained by the present model are of negligible magnitude, staying well below the order of 1 % .
We continue with the prediction of the rotation resistance tensor Ω ̲ components. By analogy with the K ̲ tensor, we compare the results to other available models. One of the very few models available for the rotational dynamics of non-spherical particles is Jefferys analytical model for prolate ellipsoids. Despite our greatest efforts, we were not able to find any empirical models based on experiments that would be appropriate for modelling general non-spherical particles. Therefore, we use Jefferys model to produce the results for the sphere and for the prolate ellipsoid (using the particle λ 1 as the axial ratio). These are then used as a comparison for the effectiveness of the present approximation scheme, which is listed in Table 3. The fact that the availability of rotational dynamics models for non-spherical particles (other than prolate ellipsoids) is practically non-existent only further highlights the importance of the present model. Up until now, authors researching distinctively non-spherical particles, such as for example particles I I I , I V or V , have often neglected the rotational dynamics. The only practical alternative so far has been to simplify the particle shape to prolate and model it with the Jefferys model. Although this is still better than not considering the rotations at all, it is evident from Table 3 that the accuracy of such assumption quickly degrades when the actual particle shape migrates away from the prolate ellipsoid. For exactly this purpose, the advantage of the present model shows its true potential. One can observe that much like for the K ̲ tensor, the average prediction errors for all considered particles are well below the order of 1 % . This also applies to predicting the sphere or the prolate particle, where the present model is able to almost perfectly reconstruct the analytical results.
As already mentioned, flow shear also affects the rotational dynamics of the particle, which we capture with the deformation resistance tensor Π ̲ . We predict its components in the same way as for the Ω ̲ tensor, where we also use the same comparison method. The results are presented in Table 4, from which we can draw a similar conclusion to Ω ̲ and K ̲ tensors, as far as the present model performance is concerned. Unlike for the Ω ̲ and K ̲ , in case of a Π ̲ tensor, some of its components are essentially zero, where the absolute error is few times greater than the target value. However, if we compare the magnitude of this error to the magnitude of the other non-zero tensor components, the ratio is actually negligible. From that we can assume that the practical consequences of this, in terms of particle rotational dynamics in the flow, would be essentially unnoticeable for any realistic engineering application.

6.5. Demonstration of the Force and Torque Model Using a Realistic Particle

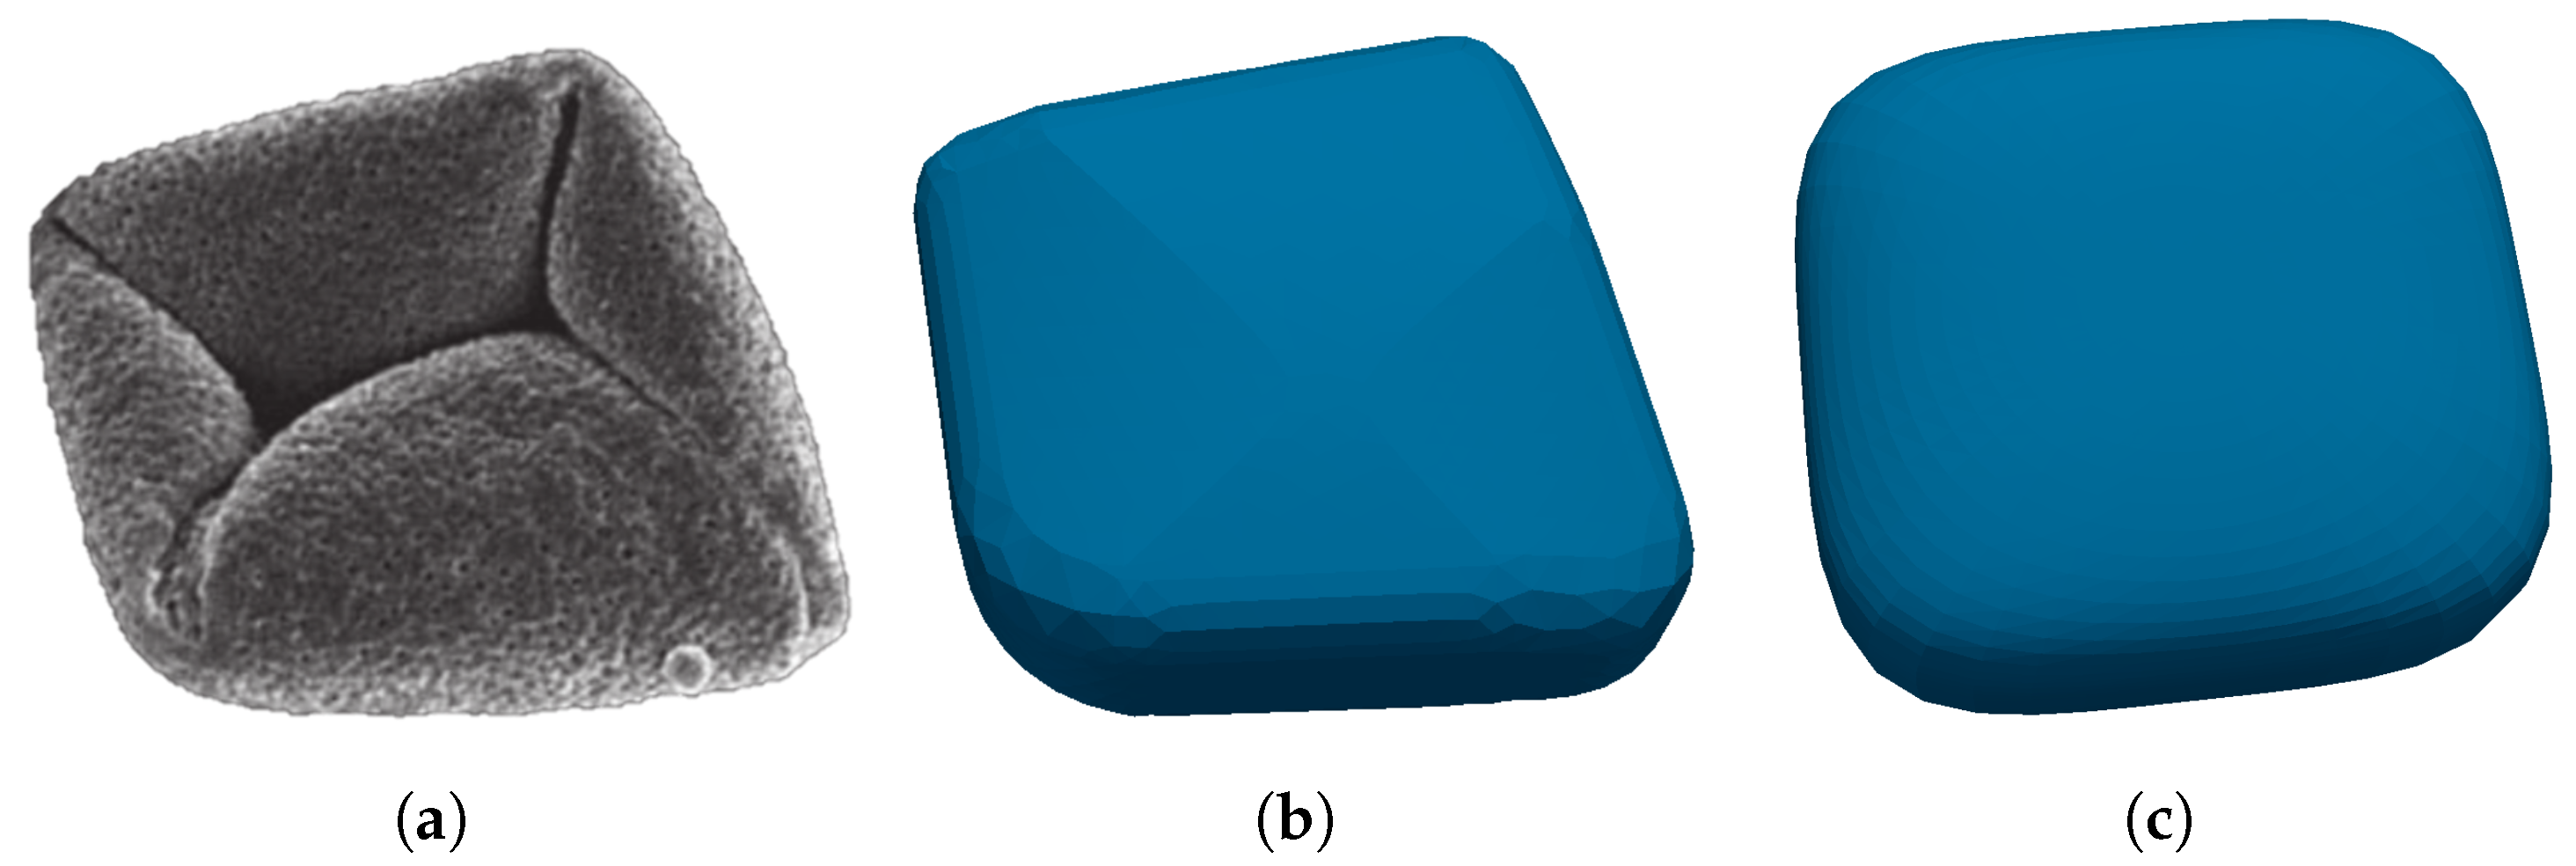
To show the applicability of the present model to a realistic engineering problem, we decide to demonstrate the process of predicting the translation, rotation and deformation resistance tensor components on an example of the realistic pollen particle [51]. In Figure 10a we present a microscope image of the pollen grain under consideration. We begin by creating a 3D reconstruction of the particle, which was employed to the best of our abilities, using all of the available information from [51], the result of which is the surface shown in Figure 10b.
To generate reference results, we employ the presented numerical model on the geometry of the reconstructed particle. We use the same set-up as established in the section of mesh study and model validation. Prior to obtaining the tensor components in question from our approximation scheme, we need to determine the four superellipsoidal parameters for the considered shape. We determine the bounding box of the particle, by finding its most-outer points. To obtain the optimal position in space, we rotate the particle so that we get the smallest possible bounding box. In the next step, we use bounding box edge lengths to identify the approximate axial ratios λ 1 and λ 2 and assume e 1 = e 2 = 1 to first obtain the ellipsoid shape that approximately fits the particle in question. The surface of an superellipsoid is given by (12), which yields unity for all points that lie on the surface. From that, we can form a numerical optimization problem, by writing an objective function [ S ( x , y , z ) 1 ] 2 , which we try to minimise for the given set of parameters λ 1 , λ 2 , e 1 , e 2 . The resulting superellipsoidal particle, as obtained from the GEKKO optimization suite [50], has the parameters λ 1 = 1.96 , λ 2 = 1.83 , e 1 = 0.564 , e 2 = 0.472 and is displayed in Figure 10c. We repeat the same process of determining the tensor coefficients as above, including the comparison with all available correlations. The results are presented in Table 5.
If we focus initially on the translation resistance, we see again that the analytical models for the sphere or prolate produce quite poor results, which is unsurprising, since the particle shape is very different from the sphere or the prolate. As expected, the empirical correlations from [27,28,29] definitely provide some improvement to that. Much like with the results for particles I V , the present approximation scheme offers the best replicate of the numerically obtained results, with almost perfect accuracy. In case of the rotation and deformation resistance tensors, the gap between the accuracy of currently available models and the present model is even more pronounced. We already established that the analytical model of Jeffery was essentially the only available approximation so far, which performs poorly for particles very different to prolates. Especially in this cases, the results of the present model, offer by far the greatest improvement. Overall we see that the average errors range from less than 1% for the translation, to ≈2% and ≈3% for the rotation and deformation resistance tensors respectively.

7. Conclusions

In the present work, we first describe the numerical framework for the prediction of forces and torques on non-spherical particles in Stokes flow. Due to the nature of the problem, we employ the BEM approach, which is proven to be superior in terms of computational cost and accuracy for the proposed problem set-up, as it enables a direct evaluation of the boundary tractions, leading to excellent accuracy of computed forces and torques acting on a particle. Additionally we also show the advantages of BEM for the problems where a large computational domain size is required, by including the comparison with similar approaches, employed by other authors. The numerical setup is described along with boundary conditions and the results of the mesh study and model validation are presented, where the final parameters for the parametric study are selected. This is followed by the presentation of the numerical study results, where a few examples of 3D data visualizations are given, on a limited range of parameters. The methods of data simplification are explained, where the initial, approximate relationships are first found on a limited data range, by fixing some of the parameters to constant, and thus temporarily reducing the dimensionality of the data. After that, the reconstruction of the simplified relationships into a functional multivariate approximation scheme is presented. Next, we demonstrate the reconstructed model functionality on various different particle examples, where we examine the model performance in terms of predicting the translation, rotation and deformation resistance tensors. The results of the present model are compared with different readily available models, where it is established that the present model delivers significantly improved results as compared to existing models. Furthermore, we identify that the existing models were only able to predict the translation resistance of the non-spherical particles with fairly acceptable accuracy. As it turns out, there is a significant lack of models that are able to account for the rotational dynamics of the non-spherical particles (other than prolates). As a result, researchers were often forced to neglect the rotational dynamics, or they had to rely on the simplification of the particle shape, which we demonstrate to be very inaccurate for most of complex particles. That said, we prove that the present model offers significant advantages, especially in modelling the rotational dynamics, as it can predict the rotation and deformation tensor components with essentially the same accuracy as for the translation resistance. As a final result, we have established that the average modified errors remain well below the order of 1 % for all particles used for comparison. Even when trying to approximate a complex, non-symmetrical pollen particle, with a best-fitting superellipsoid, we are able to reconstruct the tensor components with the accuracy in the order of 1 % for the translation, 2 % for the rotation and 3 % for the deformation resistance. To the best of our knowledge, the present model is outperforming currently available models in terms of accuracy for all non-spherical particles (except for the sphere and the prolate, where the analytical models are obviously superior), within the considered parameter range. Moreover, it is also one of the first models to account for both, the translational and rotational dynamics, on such a wide range of complex, non-spherical particles. With the derivation of the approximation scheme it is also very simple to implement in practically any numerical Lagrangian particle tracking framework and it comes with a very moderate computational cost, as compared to some of the empirical model approaches, which require complicated projection area computation with every position change, relative to the flow. With this in mind, we are convinced that this is a significant step towards closing the gap in research, when it comes to modelling distinctively non-spherical particles.

Author Contributions

M.Š. designed the model and performed the calculations; J.R. designed the computational framework and planned the study; M.H., J.W. and P.S. contributed to the design and implementation of the research; M.Š. took the lead in writing the manuscript. All authors provided critical feedback and helped shape the research, analysis and manuscript. All authors have read and agreed to the published version of the manuscript.

Funding

Deutsche Forschungsgemeinschaft (project STE 544/58), Slovenian Research Agency (research core funding No. P2-0196).

Data Availability Statement

The model is available at https://github.com/transport-phenomena/superellipsoid-force-torque-model, accessed on 2 February 2022. Other data is available upon request.

Acknowledgments

The authors thank the Deutsche Forschungsgemeinschaft for the financial support in the framework of the project STE 544/58. Furthermore, the authors acknowledge the financial support from the Slovenian Research Agency (research core funding No. P2-0196). The authors also gratefully acknowledge the HPC RIVR consortium (www.hpc-rivr.si, accessed on 2 February 2022) and EuroHPC JU (eurohpc-ju.europa.eu, accessed on 2 February 2022) for supporting this research by providing computing resources of the HPC systems Maister and Vega at the Institute of Information Science (www.izum.si, accessed on 2 February 2022).

Conflicts of Interest

The authors declare no conflict of interest.

Appendix A. Coefficient Matrices A for Closing the Approximation Scheme (22)

The C++ code of the presented approximation scheme, with resulting coefficient matrices A, is available on https://github.com/transport-phenomena/superellipsoid-force-torque-model, accessed on 2 February 2022.

Appendix A.1. Coefficient Matrices A ̲ for Range R 1

R 1 parameter limits: λ 1 5 , λ 2 λ 1 , 0.2 e 1 1.8 , 0.2 e 2 1.8 ;
A ̲ R 1 ( K x x ) = 3.533 0.3393 0.0457 0.6900 0.0458 0.0147 0.0215 0.0156 0.0117 2.316 0.2352 0.0511 0.4720 0.0758 0.0043 0.0391 0.0169 0.0017 0.6592 0.0422 0.0489 0.1128 0.0240 0.0167 0.0144 0.0115 0.0121 0.1833 0.0082 0.0028 0.0298 0.0288 0.0 0.0058 0.0168 0.0032 1.762 0.2668 0.0475 0.3260 0.0118 0.0067 0.0155 0.0288 0.0015 0.6936 0.2035 0.0297 0.1883 0.1422 0.0512 0.0419 0.0650 0.0311 0.5351 0.0361 0.0036 0.1449 0.0507 0.0133 0.0090 0.0113 0.0032 0.1226 0.0028 0.0036 0.0255 0.0338 0.0065 0.0041 0.0154 0.0041 0.1682 0.1056 0.0252 0.0992 0.1517 0.0604 0.0281 0.0691 0.0344 0.0176 0.0837 0.0056 0.1172 0.2400 0.0816 0.0812 0.1181 0.0399 0.0573 0.0486 0.0059 0.0499 0.1213 0.0396 0.0439 0.0649 0.0211 0.0191 0.0097 0.0024 0.0062 0.0101 0.0038 0.0055 0.0060 0.0020 0.0176 0.0142 0.0024 0.0165 0.0297 0.0111 0.0072 0.0146 0.0062 0.0146 0.0176 0.0005 0.0286 0.0493 0.0159 0.0168 0.0246 0.0081 0.0018 0.0095 0.0010 0.0140 0.0251 0.0078 0.0088 0.0130 0.0041 0.0006 0.0017 0.0003 0.0020 0.0031 0.0010 0.0012 0.0016 0.0005
A ̲ R 1 ( K y y ) = 3.213 0.3366 0.0043 0.6481 0.0555 0.0189 0.0116 0.0166 0.0097 1.714 0.2129 0.0357 0.3708 0.0646 0.0166 0.0072 0.0005 0.0040 0.0296 0.0423 0.0929 0.0180 0.1294 0.1085 0.0335 0.0800 0.0481 0.0717 0.0758 0.0697 0.1254 0.1038 0.0479 0.0739 0.0486 0.0108 2.910 0.3564 0.1581 0.5437 0.0758 0.0782 0.0607 0.0385 0.0264 1.116 0.3027 0.1089 0.2787 0.2685 0.1618 0.0764 0.1402 0.0781 0.5947 0.1243 0.0638 0.2458 0.1977 0.0875 0.0648 0.0851 0.0349 0.0346 0.0273 0.0212 0.0384 0.0005 0.0071 0.0296 0.0013 0.0092 0.1413 0.2751 0.1095 0.1922 0.4022 0.2229 0.0859 0.1960 0.1082 0.2840 0.1968 0.0590 0.1334 0.4317 0.2073 0.1031 0.2120 0.1026 0.1962 0.0546 0.0027 0.0087 0.1374 0.0640 0.0256 0.0733 0.0362 0.0194 0.0149 0.0048 0.0146 0.0180 0.0053 0.0104 0.0090 0.0021 0.0089 0.0406 0.0161 0.0286 0.0720 0.0381 0.0150 0.0364 0.0193 0.0225 0.0415 0.0139 0.0339 0.0913 0.0435 0.0215 0.0462 0.0222 0.0176 0.0143 0.0032 0.0104 0.0349 0.0159 0.0076 0.0182 0.0086 0.0020 0.0024 0.0006 0.0023 0.0043 0.0016 0.0015 0.0022 0.0008
A ̲ R 1 ( K z z ) = 2.925 0.2980 0.0088 0.7012 0.0307 0.0395 0.0446 0.0306 0.0271 1.766 0.1977 0.0128 0.4014 0.0314 0.0281 0.0131 0.0174 0.0161 0.2646 0.0449 0.0394 0.0875 0.2642 0.1379 0.0978 0.1467 0.0665 0.0892 0.0737 0.0389 0.2074 0.1791 0.0698 0.1464 0.1007 0.0277 2.566 0.3583 0.0354 0.5645 0.1516 0.0859 0.1845 0.1009 0.0440 1.304 0.3333 0.0464 0.3465 0.4116 0.2022 0.1908 0.2330 0.1082 0.3678 0.1076 0.0438 0.3958 0.3362 0.1174 0.1411 0.1510 0.0466 0.0522 0.0248 0.0092 0.0459 0.0037 0.0039 0.0534 0.0111 0.0013 0.2885 0.2573 0.0643 0.3579 0.6030 0.2768 0.2048 0.3138 0.1418 0.0446 0.2332 0.0650 0.3200 0.6713 0.2786 0.2091 0.3312 0.1348 0.0238 0.0872 0.0153 0.0470 0.2037 0.0871 0.0543 0.1086 0.0475 0.0264 0.0184 0.0040 0.0220 0.0257 0.0092 0.0200 0.0172 0.0057 0.0355 0.0404 0.0117 0.0588 0.1075 0.0478 0.0349 0.0561 0.0246 0.0300 0.0493 0.0141 0.0754 0.1413 0.0576 0.0463 0.0715 0.0285 0.0131 0.0202 0.0048 0.0247 0.0537 0.0214 0.0165 0.0279 0.0111 0.0036 0.0032 0.0007 0.0042 0.0065 0.0024 0.0030 0.0037 0.0013
A ̲ R 1 ( Ω x x ) = 1.530 0.0802 0.0048 1.705 1.172 0.3209 0.4999 0.4237 0.0973 2.856 1.652 0.2931 3.825 3.882 1.012 1.527 1.920 0.5521 2.445 0.5882 0.1653 0.4062 1.185 0.7360 0.1420 0.3930 0.1911 2.483 0.7415 0.3376 1.518 0.4010 0.0556 0.1488 0.8736 0.3046 3.299 0.7844 0.2134 0.5807 4.582 1.308 1.296 2.828 0.8607 5.805 3.474 0.8165 6.745 6.235 1.921 2.473 2.740 0.8742 2.379 0.0626 0.4867 2.121 4.348 1.679 1.309 1.738 0.5614 0.4023 0.3133 0.0527 0.1211 1.873 0.6395 0.4777 1.192 0.3833 2.347 3.495 1.123 6.566 9.142 3.103 3.084 4.040 1.321 3.847 5.550 1.677 11.70 15.87 5.050 5.616 7.513 2.349 1.145 2.020 0.5611 4.597 6.484 1.953 2.235 3.365 1.054 0.2762 0.2458 0.0733 0.5747 0.4863 0.1281 0.1911 0.2159 0.0680 0.5603 0.8035 0.2565 1.484 2.076 0.6906 0.7108 0.9488 0.3078 0.9329 1.320 0.4085 2.579 3.558 1.144 1.247 1.680 0.5320 0.3547 0.5538 0.1660 1.108 1.587 0.4982 0.5433 0.7868 0.2492 0.0552 0.0726 0.0219 0.1429 0.1838 0.0562 0.0634 0.0899 0.0288
A ̲ R 1 ( Ω y y ) = 1.714 0.6730 0.2218 0.6564 1.346 0.2460 0.6540 0.7029 0.1396 1.783 0.5335 0.3550 1.990 2.878 0.9027 1.754 1.708 0.4544 0.2501 3.438 1.617 6.675 12.86 5.415 4.652 7.236 2.858 2.693 3.300 1.317 10.03 11.44 3.763 6.489 6.686 1.940 4.165 3.737 1.388 11.02 11.40 3.937 5.796 6.131 2.021 5.087 5.968 2.072 10.43 15.77 6.327 5.182 8.301 3.383 1.686 3.718 1.735 8.155 14.45 5.888 5.929 8.410 3.093 1.372 0.6839 0.1234 3.414 1.351 0.1683 2.022 0.8915 0.0984 0.7674 5.161 2.531 8.961 20.61 8.972 6.368 11.63 4.848 7.682 8.830 3.063 12.23 22.94 9.705 7.004 12.50 5.191 1.084 2.187 0.8160 2.549 6.205 2.736 0.9169 3.081 1.467 0.5051 0.4709 0.1319 1.114 1.052 0.2638 0.5652 0.5592 0.1399 1.158 1.035 0.4646 1.789 3.392 1.462 1.092 1.925 0.7896 0.3451 1.126 0.5215 2.235 4.515 1.896 1.339 2.519 1.031 0.1999 0.5194 0.2133 0.7835 1.754 0.7405 0.4021 0.9317 0.3997 0.0614 0.0870 0.0296 0.1594 0.2366 0.0830 0.0802 0.1244 0.0444
A ̲ R 1 ( Ω z z ) = 1.170 1.438 0.4035 1.019 0.8623 0.1765 0.3390 0.2791 0.0683 0.7566 1.343 0.9077 0.7364 1.943 1.027 0.6665 0.7848 0.3533 1.334 5.122 2.817 4.247 12.27 5.863 2.940 5.797 2.636 5.055 5.979 3.034 7.411 9.358 3.910 3.593 3.923 1.397 2.761 7.227 3.324 5.353 10.16 4.691 2.655 4.106 1.854 5.091 9.853 3.608 7.992 16.35 6.996 3.646 7.304 3.249 0.2710 4.330 2.861 6.092 12.85 5.934 3.874 6.195 2.565 1.586 1.381 0.6613 1.879 0.4370 0.1120 0.7569 0.1011 0.2458 1.067 9.581 4.372 7.640 21.90 9.890 4.927 10.42 4.655 7.161 11.50 4.475 12.20 23.53 10.03 5.882 11.08 4.719 0.8921 1.796 0.5394 2.570 5.670 2.328 1.116 2.875 1.265 0.4428 0.4891 0.1834 0.7005 0.6898 0.1903 0.2936 0.2903 0.0729 1.623 1.729 0.7693 2.039 3.813 1.659 0.9840 1.841 0.7858 0.8699 1.943 0.8299 2.459 4.874 2.024 1.231 2.348 0.9702 0.2667 0.6012 0.2297 0.8262 1.705 0.6921 0.4026 0.8433 0.3497 0.0567 0.0875 0.0321 0.1249 0.1934 0.0689 0.0572 0.0919 0.0332
A ̲ R 1 ( Π x x ) = 3.748 1.302 0.2267 1.975 0.9820 0.2835 0.4802 0.4509 0.1819 0.1292 0.6995 0.3404 0.8403 1.839 0.6828 0.5277 1.000 0.3357 2.166 0.1699 0.0287 0.8437 2.159 0.6454 0.7226 0.8160 0.1732 1.618 0.4623 0.0136 1.086 0.1598 0.3145 0.1594 0.6834 0.3727 4.291 1.656 0.6669 3.818 3.223 1.164 1.286 1.766 0.6342 1.542 3.183 0.9262 3.901 6.616 2.126 2.143 3.049 0.9578 2.465 0.2377 0.1621 2.208 3.396 1.005 1.228 1.172 0.2319 0.3622 0.6040 0.2407 0.6454 1.590 0.6411 0.5051 0.9315 0.3329 2.702 3.728 1.274 6.526 9.068 2.940 3.147 3.905 1.156 3.587 5.490 1.967 10.01 14.17 4.614 4.893 6.436 1.954 0.9581 2.161 0.8689 3.926 6.103 2.071 2.005 3.096 1.022 0.0599 0.1734 0.0646 0.3609 0.4797 0.1413 0.1543 0.2364 0.0766 0.5474 0.7718 0.2505 1.382 1.911 0.6042 0.6795 0.8600 0.2564 0.8248 1.236 0.4167 2.220 3.131 1.005 1.096 1.447 0.4422 0.3124 0.5464 0.1974 0.9642 1.441 0.4775 0.4851 0.7033 0.2265 0.0346 0.0647 0.0232 0.1145 0.1692 0.0551 0.0557 0.0841 0.0276
A ̲ R 1 ( Π y y ) = 4.277 2.147 0.6511 4.000 2.857 0.6945 1.389 1.163 0.2510 3.098 2.321 0.9326 5.153 4.989 1.515 2.569 2.391 0.6060 3.100 5.413 2.425 9.077 15.34 6.311 5.406 8.033 3.085 2.940 5.048 2.088 10.47 13.84 4.686 6.705 7.381 2.146 0.1596 4.872 2.342 8.429 13.59 4.930 5.619 6.986 2.235 2.085 6.494 2.802 8.060 16.85 7.114 4.881 8.728 3.573 2.880 5.304 2.303 9.867 16.32 6.589 6.380 8.884 3.263 0.7478 1.090 0.3729 2.811 2.003 0.1138 1.904 1.082 0.0512 0.4975 6.750 3.420 9.989 22.99 10.04 6.915 12.40 5.129 7.650 9.782 3.672 12.16 23.85 10.46 6.944 12.64 5.402 0.4569 1.773 0.7901 1.768 5.478 2.659 0.6915 2.798 1.440 0.2411 0.4633 0.1712 0.8270 1.029 0.2937 0.4904 0.5370 0.1379 1.246 1.304 0.6081 1.992 3.779 1.643 1.183 2.048 0.8403 0.4044 1.386 0.6703 2.345 4.826 2.091 1.378 2.599 1.089 0.1590 0.5273 0.2403 0.7360 1.729 0.7695 0.3880 0.9116 0.4073 0.0367 0.0844 0.0341 0.1313 0.2276 0.0861 0.0722 0.1189 0.0442
A ̲ R 1 ( Π z z ) = 0.2800 0.7054 0.0663 1.529 1.107 1.384 0.9328 1.102 0.6447 2.354 2.407 1.158 3.633 4.450 0.9444 1.322 1.744 1.101 3.725 4.619 2.627 3.559 8.825 3.706 1.745 3.683 2.901 0.8505 2.750 1.572 2.885 6.942 2.368 2.375 3.435 1.736 2.510 5.485 2.490 6.074 10.73 4.845 3.254 5.176 2.456 0.7440 3.324 2.214 1.311 7.671 5.564 1.016 4.980 1.332 3.264 3.914 1.682 2.960 6.491 5.343 1.778 5.088 0.8775 0.1875 0.8596 0.3780 1.336 1.467 0.4652 0.9917 0.3078 0.3107 5.049 3.377 2.408 1.794 9.458 6.131 0.5574 5.435 3.665 2.687 3.996 2.023 0.7138 6.241 4.466 0.2884 3.403 3.421 0.1238 0.1652 0.2285 1.148 0.5375 0.3593 0.7191 0.1168 0.9900 0.0659 0.1937 0.0936 0.2054 0.3006 0.1028 0.1422 0.0133 0.1301 0.7150 0.4185 0.3489 0.1269 1.071 0.8511 0.0387 0.7120 0.5443 0.3736 0.1028 0.2386 0.7584 0.7587 0.7871 0.3077 0.5735 0.6092 0.1246 0.0042 0.0548 0.3282 0.1700 0.2030 0.1618 0.1051 0.2151 0.0041 0.0123 0.0099 0.0091 0.0307 0.0059 0.0019 0.0072 0.0233

Appendix A.2. Coefficient Matrices A ̲ for Range R 2

R 2 parameter limits: λ 1 > 5 , λ 2 λ 1 , 0.2 e 1 1.8 , 0.2 e 2 1.8 ;
A ̲ R 2 ( K x x ) = 1.490 2.399 0.1400 6.755 1.714 4.288 3.356 1.606 2.604 9.752 6.779 0.6789 11.02 3.714 3.013 4.401 0.1966 2.298 2.572 2.880 0.5147 4.044 3.221 0.0292 1.695 1.094 0.2095 0.2896 0.3609 0.0886 0.4715 0.5215 0.1110 0.2014 0.2032 0.0309 3.211 0.7074 0.1795 2.646 1.628 2.086 1.103 0.9978 1.163 1.809 1.585 0.0625 3.202 0.0264 1.704 1.333 0.4379 1.079 0.7137 0.8092 0.1274 1.243 0.7535 0.1736 0.5319 0.2375 0.1487 0.0865 0.1093 0.0262 0.1498 0.1515 0.0241 0.0649 0.0592 0.0049 0.2177 0.0251 0.0452 0.2431 0.3170 0.3082 0.1068 0.1687 0.1619 0.1998 0.1364 0.0154 0.3142 0.1293 0.2639 0.1325 0.1045 0.1523 0.0733 0.0765 0.0085 0.1255 0.0479 0.0387 0.0542 0.0119 0.0246 0.0090 0.0110 0.0025 0.0156 0.0142 0.0013 0.0068 0.0055 0.0 0.0073 0.0011 0.0027 0.0072 0.0171 0.0142 0.0032 0.0085 0.0072 0.0070 0.0033 0.0015 0.0099 0.0098 0.0124 0.0042 0.0060 0.0068 0.0025 0.0023 0.0 0.0041 0.0004 0.0021 0.0018 0.0 0.0012 0.0003 0.0004 0.0 0.0005 0.0004 0.0 0.0002 0.0002 0.0
A ̲ R 2 ( K y y ) = 0.3007 0.6187 1.125 6.742 1.878 3.724 3.887 0.0099 1.257 7.634 5.645 0.0882 10.86 3.813 2.832 4.876 1.572 1.444 2.044 2.407 0.2709 3.713 2.687 0.2134 1.655 1.191 0.1423 0.2343 0.3167 0.0692 0.4388 0.4648 0.0839 0.1945 0.2053 0.0315 3.970 0.1213 0.5496 2.662 1.904 1.972 1.272 0.4568 0.6909 1.574 1.060 0.2897 3.137 0.0296 1.678 1.495 0.0711 0.7663 0.5838 0.6230 0.0146 1.118 0.5807 0.2621 0.5164 0.2830 0.1195 0.0717 0.0932 0.0176 0.1381 0.1344 0.0152 0.0625 0.0614 0.0060 0.2126 0.0737 0.0886 0.2312 0.3570 0.2980 0.1259 0.1084 0.1075 0.1731 0.0684 0.0576 0.3030 0.1368 0.2643 0.1513 0.0483 0.1173 0.0596 0.0534 0.0057 0.1102 0.0272 0.0496 0.0523 0.0168 0.0215 0.0075 0.0091 0.0014 0.0142 0.0123 0.0003 0.0065 0.0058 0.0001 0.0066 0.0052 0.0044 0.0064 0.0193 0.0142 0.0039 0.0065 0.0053 0.0059 0.0005 0.0031 0.0093 0.0105 0.0126 0.0049 0.0040 0.0055 0.0020 0.0014 0.0005 0.0035 0.0004 0.0026 0.0017 0.0 0.0011 0.0003 0.0003 0.0 0.0005 0.0004 0.0 0.0002 0.0002 0.0
A ̲ R 2 ( K z z ) = 3.140 2.016 1.139 10.86 1.631 6.289 5.876 1.229 3.626 10.84 6.973 0.0368 15.42 4.424 5.036 7.211 0.5423 3.710 2.944 3.060 0.4173 5.397 4.039 0.2280 2.577 1.635 0.4040 0.3515 0.4171 0.0979 0.6390 0.7097 0.1434 0.3082 0.3113 0.0419 4.184 0.3349 0.6674 3.973 2.253 3.144 1.976 1.096 1.657 1.775 1.348 0.3146 4.571 0.3903 2.793 2.157 0.5979 1.727 0.7563 0.7896 0.0512 1.625 0.8371 0.3710 0.7818 0.3425 0.2579 0.1006 0.1220 0.0261 0.1999 0.2007 0.0272 0.0969 0.0902 0.0058 0.2466 0.0455 0.1134 0.3700 0.4440 0.4599 0.1960 0.1998 0.2284 0.2016 0.0861 0.0712 0.4347 0.2431 0.4209 0.2096 0.1502 0.2387 0.0745 0.0667 0.0039 0.1578 0.0375 0.0706 0.0769 0.0155 0.0406 0.0101 0.0118 0.0022 0.0204 0.0182 0.0009 0.0099 0.0084 0.0002 0.0080 0.0047 0.0057 0.0110 0.0243 0.0211 0.0062 0.0106 0.0101 0.0069 0.0005 0.0040 0.0132 0.0165 0.0194 0.0065 0.0087 0.0104 0.0024 0.0017 0.0005 0.0050 0.0006 0.0036 0.0025 0.0003 0.0019 0.0003 0.0004 0.0 0.0007 0.0005 0.0 0.0003 0.0002 0.0
A ̲ R 2 ( Ω x x ) = 273.2 85.28 7.823 393.2 62.92 91.68 192.9 78.95 21.80 368.9 128.8 11.81 560.3 135.2 119.5 289.9 151.8 17.26 158.1 68.97 3.403 263.2 118.1 18.90 144.5 102.9 11.42 21.20 11.28 1.935 34.14 19.44 0.6740 18.98 13.99 2.156 93.42 20.30 6.431 115.4 6.066 41.68 52.91 12.87 11.89 111.7 28.37 9.739 151.4 4.372 55.19 76.67 30.94 11.92 56.24 21.33 0.3608 79.12 27.41 10.80 42.36 28.44 2.165 6.509 3.270 0.4724 10.44 5.360 0.1577 5.738 4.077 0.5664 9.341 1.219 1.140 10.38 3.383 5.614 4.441 0.0482 1.731 11.82 1.773 1.683 13.82 3.285 7.468 6.482 1.490 1.864 5.461 1.643 0.2638 7.623 1.768 1.608 3.986 2.526 0.0899 0.6953 0.3195 0.0358 1.049 0.4751 0.0538 0.5682 0.3889 0.0479 0.3244 0.0184 0.0530 0.3158 0.1912 0.2283 0.1212 0.0329 0.0722 0.4022 0.0302 0.0757 0.4081 0.2063 0.2991 0.1755 0.0092 0.0777 0.1903 0.0491 0.0138 0.2470 0.0400 0.0646 0.1253 0.0792 0.0016 0.0246 0.0107 0.0010 0.0353 0.0150 0.0025 0.0188 0.0128 0.0016
A ̲ R 2 ( Ω y y ) = 1021 796.8 72.69 2117 1586 25.31 1172 1159 213.8 1414 1564 335.3 2901 2939 424.2 1498 1655 306.3 462.6 581.0 146.7 952.5 1126 234.7 481.6 604.9 138.6 51.09 68.35 19.76 104.5 137.5 36.97 51.78 69.83 19.09 343.6 222.5 5.137 705.9 433.8 60.86 402.2 371.3 53.71 482.4 504.5 93.92 979.9 929.7 89.97 515.9 551.1 88.53 158.0 190.9 45.14 322.1 366.1 66.91 164.7 203.1 43.59 17.46 22.87 6.435 35.56 45.96 11.85 17.73 23.75 6.332 32.94 16.94 4.898 72.67 33.22 15.84 43.84 37.49 3.360 59.89 55.88 8.348 109.6 95.75 3.764 58.51 60.04 8.091 17.92 20.68 4.516 35.67 38.98 6.069 18.44 22.34 4.482 1.974 2.524 0.6897 3.968 5.046 1.248 1.990 2.649 0.6904 2.011 0.4005 0.3403 2.626 0.5020 0.9803 1.598 1.154 0.0145 1.939 1.730 0.1727 3.964 3.095 0.1366 2.157 2.107 0.2147 0.6495 0.7175 0.1416 1.290 1.345 0.1668 0.6752 0.8019 0.1491 0.0727 0.0909 0.0241 0.1451 0.1816 0.0431 0.0732 0.0969 0.0248
A ̲ R 2 ( Ω z z ) = 741.2 473.0 40.33 1528 1093 18.68 861.0 971.2 258.5 1002 1013 215.9 2059 2016 264.6 1080 1278 289.4 327.5 388.6 98.26 674.2 770.4 150.2 346.3 448.4 112.4 38.74 49.61 15.26 75.29 98.75 27.10 37.44 52.04 15.27 240.5 102.9 19.01 495.7 250.1 71.40 290.4 299.7 65.52 336.0 296.9 46.14 686.3 589.8 23.32 368.2 411.8 78.19 114.8 122.9 26.90 226.7 239.3 34.82 117.5 147.0 33.35 12.81 16.12 4.721 25.39 32.36 8.251 12.71 17.48 4.942 18.89 2.770 6.956 47.87 10.64 18.51 30.86 28.38 3.967 40.29 30.32 2.407 75.31 54.25 5.544 40.99 42.62 6.014 12.52 12.27 2.197 24.58 23.60 1.872 12.92 15.50 3.056 1.431 1.722 0.4779 2.798 3.439 0.8015 1.409 1.905 0.5144 1.600 0.2451 0.4632 1.800 0.4119 1.159 1.110 0.7885 0.0228 1.317 0.7700 0.0789 2.649 1.459 0.5536 1.476 1.413 0.1051 0.4467 0.3898 0.0468 0.8713 0.7468 0.0084 0.4650 0.5342 0.0870 0.0522 0.0599 0.0156 0.1012 0.1199 0.0251 0.0513 0.0683 0.0176
A ̲ R 2 ( Π x x ) = 166.0 198.3 85.24 365.6 559.7 234.6 244.5 406.5 166.2 250.4 234.7 87.14 515.4 634.4 226.3 333.2 475.0 176.7 109.3 85.57 26.55 219.6 234.5 70.97 144.3 183.6 62.96 15.16 10.34 2.730 26.71 24.29 5.842 17.52 18.73 5.499 49.07 68.83 30.87 109.4 191.7 85.33 73.77 138.2 59.70 82.33 81.44 32.45 155.4 212.7 83.70 98.35 157.7 63.61 41.41 31.73 10.18 67.96 78.14 26.43 43.57 60.68 22.63 4.561 3.288 0.9384 8.135 7.866 2.129 5.309 6.055 1.938 6.059 8.640 4.049 11.78 22.86 10.77 7.527 15.86 7.224 9.194 10.10 4.358 16.04 25.05 10.83 9.694 17.77 7.731 4.069 3.534 1.315 6.965 8.948 3.396 4.356 6.740 2.723 0.4975 0.3774 0.1188 0.8339 0.8732 0.2692 0.5361 0.6570 0.2288 0.2254 0.3534 0.1703 0.4248 0.9152 0.4464 0.2621 0.6137 0.2897 0.3391 0.4159 0.1895 0.5652 1.005 0.4635 0.3261 0.6806 0.3132 0.1490 0.1430 0.0577 0.2444 0.3544 0.1471 0.1477 0.2548 0.1098 0.0181 0.0148 0.0051 0.0290 0.0336 0.0117 0.0182 0.0243 0.0091
A ̲ R 2 ( Π y y ) = 735.4 331.3 87.57 1590 684.6 299.3 961.0 787.6 77.30 1006 911.6 119.3 2152 1680 16.52 1199 1137 120.1 323.9 358.3 72.18 690.1 697.0 85.76 375.6 430.0 76.91 37.12 46.81 12.45 77.91 95.85 22.52 40.98 52.85 13.16 238.4 61.48 59.88 519.6 125.7 170.3 328.7 245.2 8.104 346.0 279.6 19.97 723.6 496.1 60.25 412.7 373.1 25.25 109.5 113.7 19.57 230.0 218.0 16.06 127.5 142.7 22.56 12.58 15.43 3.932 26.26 31.61 6.920 13.94 17.90 4.311 21.42 0.9438 10.90 52.23 0.4598 27.59 35.80 23.83 1.467 43.94 30.45 0.1742 79.95 47.03 12.75 46.63 40.12 1.157 12.33 11.95 1.664 25.10 22.28 0.4269 14.17 15.55 2.156 1.415 1.683 0.4099 2.901 3.427 0.6992 1.555 1.989 0.4658 1.587 0.2462 0.5531 1.885 0.6894 1.385 1.310 0.6787 0.1772 1.340 0.7944 0.1219 2.858 1.319 0.7252 1.717 1.386 0.0306 0.4398 0.3952 0.0380 0.8942 0.7321 0.0366 0.5157 0.5537 0.0657 0.0517 0.0598 0.0139 0.1051 0.1219 0.0231 0.0569 0.0727 0.0166
A ̲ R 2 ( Π z z ) = 378.7 643.4 260.8 590.8 773.6 221.9 183.2 19.01 106.8 73.69 193.2 92.26 13.26 36.60 4.668 39.65 121.0 83.56 80.27 88.71 27.99 191.9 282.9 111.3 92.95 147.5 60.73 13.23 18.62 6.444 32.10 50.50 19.87 14.79 24.12 9.606 268.8 413.0 162.4 485.2 701.8 247.8 187.0 192.7 32.86 149.0 241.5 97.01 265.6 421.4 159.7 102.1 139.2 40.82 4.910 11.18 5.472 5.213 2.424 0.4955 5.553 8.341 4.222 3.118 3.892 1.265 7.317 11.12 4.289 3.448 5.497 2.172 54.03 71.43 27.62 94.05 134.3 49.29 37.68 45.74 12.62 29.16 46.14 18.19 61.56 96.55 36.97 25.81 37.90 13.00 3.549 5.598 2.221 6.446 10.71 4.216 2.535 4.086 1.459 0.1492 0.1551 0.0391 0.3873 0.5519 0.2047 0.1938 0.2982 0.1178 1.699 3.562 1.368 4.687 7.207 2.684 2.013 2.682 0.8437 1.819 2.609 0.9750 3.572 5.503 2.094 1.543 2.278 0.8064 0.2655 0.3827 0.1425 0.5168 0.8129 0.3124 0.2198 0.3431 0.1255 0.0024 0.0049 0.0022 0.0025 0.0054 0.0023 0.0004 0.0009 0.0002

References

  1. Crowe, C.T.; Sommerfeld, M.; Tsuji, Y. Multiphase Flows with Droplets and Particles; CRC Press: Boca Raton, FL, USA, 1998. [Google Scholar]
  2. Maxey, M.R.; Riley, J.J. Equation of motion for a small rigid sphere in a nonuniform flow. Phys. Fluids 1983, 26, 883. [Google Scholar] [CrossRef]
  3. Kuerten, J.G.M. Point-Particle DNS and LES of Particle-Laden Turbulent flow—A state-of-the-art review. Flow Turbul. Combust. 2016, 97, 689–713. [Google Scholar] [CrossRef] [PubMed] [Green Version]
  4. Balachandar, S.; Eaton, J.K. Turbulent Dispersed Multiphase Flow. Annu. Rev. Fluid Mech. 2010, 42, 111–133. [Google Scholar] [CrossRef]
  5. Armenio, V.; Fiorotto, V. The importance of the forces acting on particles in turbulent flows. Phys. Fluids 2001, 13, 2437–2440. [Google Scholar] [CrossRef]
  6. Oseen, C. Neuere Methoden und Ergebnisse in der Hydrodynamik; Akademische Verlagsgesellschaft: Leipzig, Germany, 1927. [Google Scholar]
  7. Schiller, L.; Naumann, A. Über die grundlegenden Berechnungen bei der Schwerkraftaufbereitung. Verein Deutscher Ingenieure 1933, 77, 318–320. [Google Scholar]
  8. Happel, J.; Brenner, H. Low Reynolds Number Hydrodynamics; Martinus Nijhoff Publishers, Kluwer: The Hague, The Netherlands, 1983. [Google Scholar] [CrossRef]
  9. Koullapis, P.; Kassinos, S.C.; Muela, J.; Perez-segarra, C.; Rigola, J.; Lehmkuhl, O.; Cui, Y.; Sommerfeld, M.; Elcner, J.; Jicha, M.; et al. Regional aerosol deposition in the human airways: The SimInhale benchmark case and a critical assessment of in silico methods. Eur. J. Pharm. Sci. 2017, 113, 77–94. [Google Scholar] [CrossRef] [Green Version]
  10. Wedel, J.; Steinmann, P.; Štrakl, M.; Hriberšek, M.; Ravnik, J. Can CFD establish a connection to a milder COVID-19 disease in younger people? Aerosol deposition in lungs of different age groups based on Lagrangian particle tracking in turbulent flow. Comput. Mech. 2021, 67, 1497–1513. [Google Scholar] [CrossRef]
  11. Wedel, J.; Steinmann, P.; Štrakl, M.; Hriberšek, M.; Ravnik, J. Risk Assessment of Infection by Airborne Droplets and Aerosols at Different Levels of Cardiovascular Activity. Arch. Comput. Methods Eng. 2021, 28, 4297–4316. [Google Scholar] [CrossRef]
  12. Radhika, T.; Raja Rani, T.; Dwivedi, D. Creeping flow of a viscous fluid past a pair of porous separated spheres. Bull. Pure Appl. Sci. Sec. E Math. Stat. 2020, 39e, 58. [Google Scholar] [CrossRef]
  13. Vogel, A.; Durant, A.J.; Cassiani, M.; Clarkson, R.J.; Slaby, M.; Diplas, S.; Krüger, K.; Stohl, A. Simulation of volcanic ash ingestion into a Large Aero Engine: Particle-Fan interactions. J. Turbomach. 2019, 141, 011010. [Google Scholar] [CrossRef] [Green Version]
  14. Oberbeck, A. Ueber stationäre flüssigkeitsbewegungen mit berücksichtigung der inneren reibung. J. Fur Die Reine Und Angew. Math. 1876, 1876, 62–80. [Google Scholar] [CrossRef]
  15. Dassios, G.; Hadjinicolaou, M.; Protopapas, E. Blood plasma flow past a red blood cell: Mathematical modelling and analytical treatment. Math. Methods Appl. Sci. 2012, 35, 1547–1563. [Google Scholar] [CrossRef]
  16. Dassios, G.; Hadjinicolaou, M.; Payatakes, A.C. Generalized eigenfunctions and complete semiseparable solutions for Stokes flow in spheroidal coordinates. Q. Appl. Math. 1994, 52, 157–191. [Google Scholar] [CrossRef] [Green Version]
  17. Hadjinicolaou, M.; Protopapas, E. Eigenfunction Expansions for the Stokes Flow Operators in the Inverted Oblate Coordinate System. Math. Probl. Eng. 2016, 2016, 9049131. [Google Scholar] [CrossRef] [Green Version]
  18. Marchioli, C.; Soldati, A. Rotation statistics of fibers in wall shear turbulence. Acta Mech. 2013, 224, 2311–2329. [Google Scholar] [CrossRef]
  19. Ravnik, J.; Marchioli, C.; Soldati, A. Application limits of Jeffery’s theory for elongated particle torques in turbulence: A DNS assessment. Acta Mech. 2018, 229, 827–839. [Google Scholar] [CrossRef]
  20. Zhang, H.; Ahmadi, G.; Fan, F.G.; McLaughlin, J.B. Ellipsoidal particles transport and deposition in turbulent channel flows. Int. J. Multiph. Flow 2001, 27, 971–1009. [Google Scholar] [CrossRef]
  21. Jeffery, G.B. The motion of ellipsoidal particles immersed in a viscous fluid. Proc. R. Soc. A 1922, 102, 161–179. [Google Scholar]
  22. Koch, D.L.; Subramanian, G. Collective Hydrodynamics of Swimming Microorganisms: Living Fluids. Annu. Rev. Fluid Mech 2011, 43, 637–659. [Google Scholar] [CrossRef]
  23. Meyer, C.R.; Byron, M.L.; Variano, E.A. Rotational diffusion of particles in turbulence. Limnol. Oceanogr. Fluids Environ. 2013, 3, 89–102. [Google Scholar] [CrossRef] [Green Version]
  24. Sturm, R. A computer model for the simulation of nonspherical particle dynamics in the human respiratory tract. Phys. Res. Int. 2012, 2012, 142756. [Google Scholar] [CrossRef] [Green Version]
  25. Lundell, F.; Söderberg, L.D.; Alfredsson, P.H. Fluid mechanics of papermaking. Annu. Rev. Fluid Mech. 2011, 43, 195–217. [Google Scholar] [CrossRef]
  26. Hazelton, R. Characteristics of Fuel Crud and Its Impact on Storage, Handling, and Shipment of Spent Fuel; Technical Report; Pacific Northwest National Laboratory (PNNL): Richland, WA, USA, 1987. [Google Scholar] [CrossRef] [Green Version]
  27. Haider, A.; Levenspiel, O. Drag coefficient and terminal velocity of spherical and nonspherical particles. Powder Technol. 1989, 58, 63–70. [Google Scholar] [CrossRef]
  28. Leith, D. Drag on nonspherical objects. Aerosol Sci. Technol. 1987, 6, 153–161. [Google Scholar] [CrossRef] [Green Version]
  29. Hölzer, A.; Sommerfeld, M. New simple correlation formula for the drag coefficient of non-spherical particles. Powder Technol. 2008, 184, 361–365. [Google Scholar] [CrossRef]
  30. Witham, C.; Hort, M.; Thomson, D.; Leadbetter, S.; Devenish, B.; Webster, H.; Beckett, F.; Kristiansen, N. The current volcanic ash modelling set-up at the London VAAC. In Met Office Technical Summary; Met Office: London, UK, 2021; p. 12. [Google Scholar]
  31. Saxby, J.; Rust, A.; Beckett, F.; Cashman, K.; Rodger, H. Estimating the 3D shape of volcanic ash to better understand sedimentation processes and improve atmospheric dispersion modelling. Earth Planet. Sci. Lett. 2020, 534, 116075. [Google Scholar] [CrossRef]
  32. Norde, E.; Senoner, J.m.; Der, E.T.A.V.; Trontin, P.; Willem, H.; Hoeijmakers, M.; Villedieu, P.; Norde, E.; Senoner, J.m.; Theodorus, E.; et al. Eulerian and Lagrangian Ice Crystal Trajectory Simulations in a Generic Turbofan Compressor. J. Propuls. Power 2019, 35, 26–40. [Google Scholar] [CrossRef]
  33. Gomez Bonilla, J.S.; Dechet, M.A.; Schmidt, J.; Peukert, W.; Bück, A. Thermal rounding of micron-sized polymer particles in a downer reactor: Direct vs indirect heating. Rapid Prototyp. J. 2020, 26, 1637–1646. [Google Scholar] [CrossRef]
  34. Bagheri, G.; Bonadonna, C. On the drag of freely falling non-spherical particles. Powder Technol. 2016, 301, 526–544. [Google Scholar] [CrossRef] [Green Version]
  35. Williams, J.R.; Pentland, A.P. Superquadrics and modal dynamics for discrete elements in interactive design. Eng. Comput. 1992, 9, 115–127. [Google Scholar] [CrossRef]
  36. Tropea, C.; Yarin, L.A.; Foss, F.J. Springer Handbook of Experimental Fluid Mechanics; Springer: Berlin/Heidelberg, Germany, 2007. [Google Scholar] [CrossRef]
  37. Pozrikidis, C. A Practical Guide to Boundary Element Methods with the Software Library BEMLIB; CRC Press: Boca Raton, FL, USA, 2002. [Google Scholar]
  38. Šušnjara, A.; Verhnjak, O.; Poljak, D.; Cvetković, M.; Ravnik, J. Stochastic-deterministic boundary element modelling of transcranial electric stimulation using a three layer head model. Eng. Anal. Bound. Elem. 2021, 123, 70–83. [Google Scholar] [CrossRef]
  39. Šušnjara, A.; Verhnjak, O.; Poljak, D.; Cvetković, M.; Ravnik, J. Uncertainty quantification and sensitivity analysis of transcranial electric stimulation for 9-subdomain human head model. Eng. Anal. Bound. Elem. 2022, 135, 1–11. [Google Scholar] [CrossRef]
  40. Jaklič, A.; Leonardis, A.; Solina, F. Segmentation and Recovery of Superquadrics; Computational Imaging and Vision Book Series; Springer Netherlands: Dordrecht, The Netherlands, 2000; Volume 20. [Google Scholar] [CrossRef]
  41. Jaklič, A.; Solina, F. Moments of superellipsoids and their application to range image registration. IE Trans. Syst. Man Cybern. Part B Cybern. 2003, 33, 648–657. [Google Scholar] [CrossRef] [PubMed] [Green Version]
  42. You, Y.; Zhao, Y. Discrete element modelling of ellipsoidal particles using super-ellipsoids and multi-spheres: A comparative study. Powder Technol. 2018, 331, 179–191. [Google Scholar] [CrossRef]
  43. Lorentz, H.A. A general theorem concerning the motion of a viscous fluid and a few consequneces derived from it. In Collected Papers; Martinus Nijhoff Publishers, Kluwer: The Haque, The Netherlands, 1937. [Google Scholar]
  44. Chadil, M.A.; Vincent, S.; Estivalezes, J.L. Accurate estimate of drag forces using particle-resolved direct numerical simulations. Acta Mech. 2019, 230, 569–595. [Google Scholar] [CrossRef] [Green Version]
  45. Zastawny, M.; Mallouppas, G.; Zhao, F.; van Wachem, B. Derivation of drag and lift force and torque coefficients for non-spherical particles in flows. Int. J. Multiph. Flow 2012, 39, 227–239. [Google Scholar] [CrossRef]
  46. Andersson, H.I.; Jiang, F. Forces and torques on a prolate spheroid: Low-Reynolds-number and attack angle effects. Acta Mech. 2019, 230, 431–447. [Google Scholar] [CrossRef]
  47. Štrakl, M.; Wedel, J.; Steinmann, P.; Hriberšek, M.; Ravnik, J. Numerical drag and lift prediction framework for superellipsoidal particles in multiphase flows. Int. J. Comput. Methods Exp. Meas. 2022, 10, 38–49. [Google Scholar] [CrossRef]
  48. Gallily, I.; Cohen, A.H. On the orderly nature of the motion of nonspherical aerosol particles II. Inertial collision between a spherical large droplet and axially symmetrical elongated particle. J. Colloid Interface Sci. 1979, 68, 338–356. [Google Scholar] [CrossRef]
  49. Macedo, H.D.; Oliveira, J.N. Typing linear algebra: A biproduct-oriented approach. Sci. Comput. Program. 2013, 78, 2160–2191. [Google Scholar] [CrossRef] [Green Version]
  50. Beal, L.; Hill, D.; Martin, R.; Hedengren, J. GEKKO Optimization Suite. Processes 2018, 6, 106. [Google Scholar] [CrossRef] [Green Version]
  51. Matamoro-Vidal, A.; Prieu, C.; Furness, C.A.; Albert, B.; Gouyon, P.H. Evolutionary stasis in pollen morphogenesis due to natural selection. New Phytol. 2016, 209, 376–394. [Google Scholar] [CrossRef] [PubMed] [Green Version]
Figure 1. Examples of superellipsoids with particle frame of reference defined. From the left a triaxial ellipsoid, oval, cylinder, cuboid, rhomboid and octahedron are shown. All shapes are formed from the same axes (a, b, c), by only altering the exponential parameters ( e 1 , e 2 ).
Jmse 10 00369 g001
Figure 2. Numerical domain in the shape of a sphere, with the diameter of the 1024 d p . The particle under consideration is positioned in the centre of the domain, with its volume equivalent diameter d p . The boundary condition, on the surface of the outer sphere is a constant velocity field u , while a no slip condition u | p = 0 is imposed on the particle surface.
Jmse 10 00369 g002
Figure 3. Boundary traction magnitude | | q | | 2 at the surface of a rectangular disc particle, shown for the uniform flow (left), rotational flow (centre) and the shear flow (right).
Jmse 10 00369 g003
Figure 4. Surface meshes A , B , C and D on the example of rectangular disc particle. Mesh elements in the bottom right corner of the particle are displayed in magnified detail, to show the quality of the captured rounded edge.
Jmse 10 00369 g004
Figure 5. Demonstration of mesh convergence, by comparing the components of: (a) translation, (b) rotation and (c) deformation resistance tensors, for two superellipsoids: the rectangular disc ( λ 1 = 5 , λ 2 = 5 , e 1 = 0.2 , e 2 = 0.2 ) and pyramid-like particle ( λ 1 = 10 , λ 2 = 10 , e 1 = 1.5 , e 2 = 1.5 ).
Jmse 10 00369 g005
Figure 6. Tensor component values are presented with respect to λ 1 and λ 2 , for the examples of tensor components K z z , Ω z z and Π z z , shown at (ac) sections respectively. Parameters e 1 and e 2 are fixed to unity. Note the triangular shape of the plot surface, due to the imposed limitation λ 2 λ 1 . Black and blue dotted lines are displaying the one-dimensional fit functions, which are positioned at the fixed values of λ 1 and λ 2 as indicated in the plot legend.
Jmse 10 00369 g006
Figure 7. Tensor component values are presented with respect to e 1 and e 2 , for the examples of tensor components K z z , Ω z z and Π z z , shown at (ac) sections respectively. Parameters λ 1 and λ 2 are fixed to the values of 5 and 3. Black and blue dotted lines are displaying the one-dimensional fit functions, which are positioned at the fixed values of e 1 and e 2 as indicated in the plot legend.
Jmse 10 00369 g007
Figure 8. Modified relative errors ε are presented, with respect to λ 1 and λ 2 , for the examples of tensor components K z z , Ω z z and Π z z , shown at (ac) sections respectively. Parameters e 1 and e 2 are fixed to unity. The average error for the plot is displayed in the top right corner.
Jmse 10 00369 g008
Figure 9. Modified relative errors ε are presented, with respect to e 1 and e 2 , for the examples of tensor components K z z , Ω z z and Π z z , shown at (ac) sections respectively. Parameters λ 1 and λ 2 are fixed to 5 and 3. The average error for the plot is displayed in the top right corner.
Jmse 10 00369 g009
Figure 10. Pollen grain in consideration for testing the performance of the present model. The picture of the original particle [51] is shown in (a), reprinted with permission from [51], copyright 2016 John Wiley and Sons. In (b) the reconstructed 3D surface of the particle is displayed and in (c) the best matching superellipsoid ( λ 1 = 1.96 , λ 2 = 1.83 , e 1 = 0.564 , e 2 = 0.472 ) is given.
Jmse 10 00369 g010
Table 1. Comparison of the analytical and numerical values of the translation and rotation tensors in the case of a sphere and two prolate ellipsoids.
λ 1 ValueAnalyticalMesh A Mesh B Mesh C Mesh D
1 K i i 65.9536.0026.0096.012
1 Ω i i 87.7597.9547.9837.993
1 Π i i 00.0060.0020.0040.000
2 K x x 7.2247.1507.2197.2307.234
2 K y y = K z z 8.2738.2178.2748.2858.289
2 Ω x x 12.9112.3512.7912.8612.88
2 Ω y y = Ω z z 24.0823.5823.9324.0124.04
2 Π x x 00.0160.004−0.0080.000
2 Π z z = Π y y 14.4514.4214.4014.4314.46
5 K x x 10.7110.5010.6910.7210.72
5 K y y = K z z 14.2314.0014.2214.2514.26
5 Ω x x 28.2425.4427.7628.0528.14
5 Ω y y = Ω z z 185.6179.2184.3185.0185.3
5 Π x x 0−0.3200.021−0.0050.069
5 Π z z = Π y y 171.3166.4170.3170.8171.1
Table 2. K ̲ tensor coefficients are determined for particles I V , using different methods. First, the analytical result is presented for the considered particle (applies only for particles I and I I ). In the next column, a direct result from the present BEM code is presented. This is followed by the results obtained analytically with two simplified particle representations, namely the sphere and the prolate (considering λ 1 of the particle). After that, the empirical models from Haider and Levenspiel [27], Leith [28] and Holzer and Sommerfeld [29] follow. In the last column, the result of the derived approximation scheme is shown.
Particle aCoeff. KAn. Res.Pres. BEMSphereProlate ell. b[27][28][29]Approx.
Scheme
Jmse 10 00369 i001 K x x 6.06.0026.06.06.0465.8455.8716.003
K y y 6.06.0026.06.06.0465.8945.8766.003
K z z 6.06.0026.06.06.0465.8455.8546.004
Average error:0.0%0.0%0.44%1.34%1.28%0.03%
Jmse 10 00369 i002 K x x 10.7110.696.010.7110.549.72811.1610.70
K y y 14.2314.226.014.2310.5412.2312.0314.23
K z z 14.2314.226.014.2310.5412.1211.9714.24
Average error:30.95%0.00%11.04%7.44%7.17%0.05%
Jmse 10 00369 i003 K x x 15.506.010.7115.2414.7316.3915.50
K y y 17.076.014.2315.2415.8216.6217.06
K z z 20.566.014.2315.2418.8718.4020.57
Average error:37.91%15.08%8.00%4.00%3.78%0.02%
Jmse 10 00369 i004 K x x 24.736.010.7122.3722.1825.2724.83
K y y 24.736.014.2322.3722.2225.2924.82
K z z 30.926.014.2322.3727.9728.2530.98
Average error:44.54%29.44%9.48%5.72%2.69%0.17%
Jmse 10 00369 i005 K x x 32.336.015.8829.7630.0035.3932.40
K y y 32.316.022.8729.7630.4135.4332.35
K z z 45.876.022.8729.7642.1641.4445.98
Average error:47.62%25.16%10.93%4.08%5.47%0.11%
aI: λ1 = λ2 = e1 = e2 = 1.0, II: λ1 = 5.0, λ2 = e1 = e2 = 1.0, III: λ1 = 5.0, λ2 = 3.0, e1 = e2 = 1.0, IV: λ1 = λ2 = 5.0, e1 = e2 = 0.2, V: λ1 = λ2 = 10, e1 = e2 = 1.5; b λ = λ1.
Table 3. Ω ̲ tensor coefficients are determined for particles I V , using different methods. First, the analytical result is presented for the considered particle (applies only for particles I and I I ). In the next column, a direct result from the present BEM code is presented. This is followed by the results obtained analytically with two simplified particle representations, namely the sphere and the prolate (considering λ 1 of the particle). In the last column, the result of the derived approximation scheme is shown.
Particle aCoeff. Ω ̲ An. Res.Pres. BEMSphereProlate ell. bApprox. Scheme
Jmse 10 00369 i001 Ω x x 8.07.9548.08.07.978
Ω y y 8.07.9548.08.07.978
Ω z z 8.07.9548.08.07.968
Average error:0.0%0.0%0.18%
Jmse 10 00369 i002 Ω x x 28.2427.768.028.2427.91
Ω y y 185.6184.48.0185.6185.2
Ω z z 185.6184.28.0185.6185.0
Average error:47.41%0.0%0.19%
Jmse 10 00369 i003 Ω x x 155.18.028.24154.9
Ω y y 316.38.0185.6316.8
Ω z z 303.08.0185.6303.3
Average error:53.83%26.89%0.06%
Jmse 10 00369 i004 Ω x x 782.08.028.24784.5
Ω y y 782.08.0185.6784.0
Ω z z 10238.0185.61025
Average error:56.71%48.40%0.14%
Jmse 10 00369 i005 Ω x x 24438.054.442465
Ω y y 24438.01069.42466
Ω z z 26568.01069.42677
Average error:57.51%40.91%0.50%
aI: λ1 = λ2 = e1 = e2 = 1.0, II: λ1 = 5.0, λ2 = e1 = e2 = 1.0, III: λ1 = 5.0, λ2 = 3.0, e1 = e2 = 1.0, IV: λ1 = λ2 = 5.0, e1 = e2 = 0.2, V: λ1 = λ2 = 10, e1 = e2 = 1.5; b λ = λ1.
Table 4. Π ̲ tensor coefficients are determined for particles I V , using different methods. First, the analytical result is presented for the considered particle (applies only for particles I and I I ). In the next column, a direct result from the present BEM code is presented. This is followed by the results obtained analytically with two simplified particle representations, namely the sphere and the prolate (considering λ 1 of the particle). In the last column, the result of the derived approximation scheme is shown.
Particle aCoeff. Π ̲ An. Res.Pres. BEMSphereProlate ell. bApprox. Scheme
Jmse 10 00369 i001 Π x x 0.00.0010.00.00.001
Π y y 0.00.0040.00.00.002
Π z z 0.00.0010.00.00.000
Average error:
Jmse 10 00369 i002 Π x x 0.00.0210.00.00.021
Π y y −171.3−170.40.0−171.3−171.1
Π z z 171.3170.20.0171.3170.8
Average error:47.14%0.0%0.11%
Jmse 10 00369 i003 Π x x 124.10.00.0123.7
Π y y −292.00.0−171.3−292.3
Π z z 142.70.0171.3143.2
Average error:53.54%26.20%0.11%
Jmse 10 00369 i004 Π x x 672.90.00.0676.1
Π y y −671.90.0−171.3−675.2
Π z z −0.0830.0171.3−0.006
Average error:47.14%47.14%0.23%
Jmse 10 00369 i005 Π x x 24160.00.02440
Π y y −24140.0−1048.3−2440
Π z z 0.7440.01048.3−0.011
Average error:47.15%47.13%0.49%
aI: λ1 = λ2 = e1 = e2 = 1.0, II: λ1 = 5.0, λ2 = e1 = e2 = 1.0, III: λ1 = 5.0, λ2 = 3.0, e1 = e2 = 1.0, IV: λ1 = λ2 = 5.0, e1 = e2 = 0.2, V: λ1 = λ2 = 10, e1 = e2 = 1.5; b λ = λ1.
Table 5. K ̲ , Ω ̲ and Π ̲ tensor coefficients are determined for an example of the pollen grain. First the present BEM code result is presented, obtained for the actual reconstructed particle geometry, as illustrated in Figure 10b. This is followed by the results obtained analytically with two simplified particle representations, namely the sphere and the prolate (considering λ 1 of the particle). After that, the empirical models from Haider and Levenspiel [27], Leith [28] and Holzer and Sommerfeld [29] follow (applies only for the K ̲ tensor components). In the last column, the result of the approximation scheme is shown, for the superellipsoid ( λ 1 = 1.96 , λ 2 = 1.83 , e 1 = 0.564 , e 2 = 0.472 ) , that best matches the pollen grain.
Coeff. K ̲ , Ω ̲ , Π ̲ Pres. BEMSphereProlate ell. b[27][28][29]Approx. Scheme
K x x 10.776.07.1749.5059.3249.92210.58
K y y 10.806.08.1849.5059.4319.96810.71
K z z 12.016.08.1849.50510.3610.4611.86
Average error:26.76%17.24%8.70%7.68%5.56%0.74%
Ω x x 50.078.012.7047.23
Ω y y 50.888.023.1450.71
Ω z z 63.208.023.1461.65
Average error:49.00%36.77%1.60%
Π x x 25.310.00.023.51
Π y y −26.220.0−13.57−27.56
Π z z 0.860.013.573.791
Average error:47.90%46.34%2.36%
b λ = λ1.
Publisher’s Note: MDPI stays neutral with regard to jurisdictional claims in published maps and institutional affiliations.