Abstract
The decision-making process of the coastal defence measures (CDMs) is complex and filled with uncertainties due to site-specific interactions between hydrodynamic and geomorphological conditions, which have repercussions on the ecological and social aspects of coastal communities. Scientific knowledge of the effects of CDMs contributes to the reduction in inherent uncertainties and facilitates the decision-making and design processes. The goal of this article is to present an algorithm designed to evaluate and hierarchize CDMs in relation to different coastal environments. Drawn from 411 published scientific case studies, a total of 1709 authors’ observation statements regarding the effects of CDMs on the study sites’ environmental features (type of coast, type of substrate, tidal range, and wave climate) were entered in a database, categorized, and weighted according to a qualitative scale. The algorithm processes the information by establishing a correspondence between user-selected environment features and those stocked in the database, and it evaluates user-selected CDMs in relation to the specified coastal characteristics by identifying, collating, and rating the effects as observed in similar contexts. The result is a tool able to process, structure, and concretize scientific knowledge regarding CDMs and their effects on coastal systems. It is complementary to existing tools currently used in the decision-making and design processes of the CDMs. The results present the hierarchization of CDMs according to a multilevel aggregated structure, which can be used in different ways by coastal managers, decision-makers, and engineers. The algorithm, based on standardized coastal characteristics, can be applied to any shoreline worldwide.
1. Introduction
Coastal systems are affected by coastal hazards such as erosion, flooding, and landslides. Coastal defence measures (CDMs) have been implemented to mitigate these hazards since the establishment of human societies along shorelines [1]. However, coastal erosion and flooding have been exacerbated in recent decades by the effects of climate change, sea-level rise [2,3,4,5], and anthropogenic activities [6,7,8], which have led to an increase in shoreline armouring worldwide [9,10,11,12].
The dynamics of coastal systems consist of multi-scale, non-linear processes, resulting from the interaction between hydrodynamic and morphological conditions [13], which have feedback effects on ecosystems and on the social aspects of coastal communities [14]. Historically, hard reflective coastal defence structures have been implemented on shorelines without consideration for coastal dynamics and with potentially negative environmental impacts [9,15,16,17,18]. The selection of this type of CDM can be explained by a lack of knowledge regarding coastal dynamics and a lack of tools available to make sound decisions [12,19,20,21,22,23]. In addition, the effect of climate change on coastal systems renders their behaviour more difficult to predict and increases the uncertainty of their analysis [13,14,24]. In general, integration of the most current scientific knowledge into coastal management approaches tends to be slow [13]. However, given the unpredictability brought on by climate change, such knowledge is becoming more and more critical and can greatly contribute to the integrality of the CDM decision-making process by reducing inherent uncertainties [14].
The data acquisition methods and tools already in use, such as field measurements and analysis, physical and numerical modelling, and decision-support tools, provide important information to the planification process and design of CDMs [24,25]. Currently, the design of CDMs is mostly based on the technical aspects meant to solve shoreline retreat issues, rather than on a complete analysis of the effects of CDMs on the socio-ecological system [12]. Generally, scientific information regarding the effects of CDMs is integrated into the planification or design process in the form of a brief pros and cons lists. Still, to the authors’ knowledge, a tool with the capacity to directly and efficiently integrate scientific knowledge of the effects of CDMs into the evaluation process is not currently available. Scientific knowledge regarding the effects of CDMs remains unbalanced as the majority of case studies have been conducted on beach nourishment, seawalls, and breakwaters, mainly in a context of low-lying sandy coasts [26]. Thus, there is a need for the development of a tool that is flexible enough to allow easy integration of new scientific data as they become available, to allow the data to be structured in a way that is useful to the direct evaluation of CDMs, and to allow variations in the environmental features between the implementation sites and the case studies.
Based on a literature review of case study publications regarding the effects of coastal defence measures (CDMs) on coastal systems, the purpose of this article is to present the development of an algorithm capable of conducting a dynamic meta-analysis of relevant publications and forming a qualitative synthesis to be used in the CDM decision-making process. The idea is to use this algorithm for the purpose of the characterization and pre-analysis of CDMs in relation to different coastal contexts. More specifically, the sub-objectives are (1) to extract and store in a database information regarding CDMs and their effects on the coastal system, as well as the physical characteristics of the environment in which the case studies were carried out and (2) to aggregate these observed effects based on systemic indicators and a qualitative rating scale. The algorithm should therefore make it possible to identify and hierarchize CDMs with the lowest impact on specified coastal systems.
2. Methods
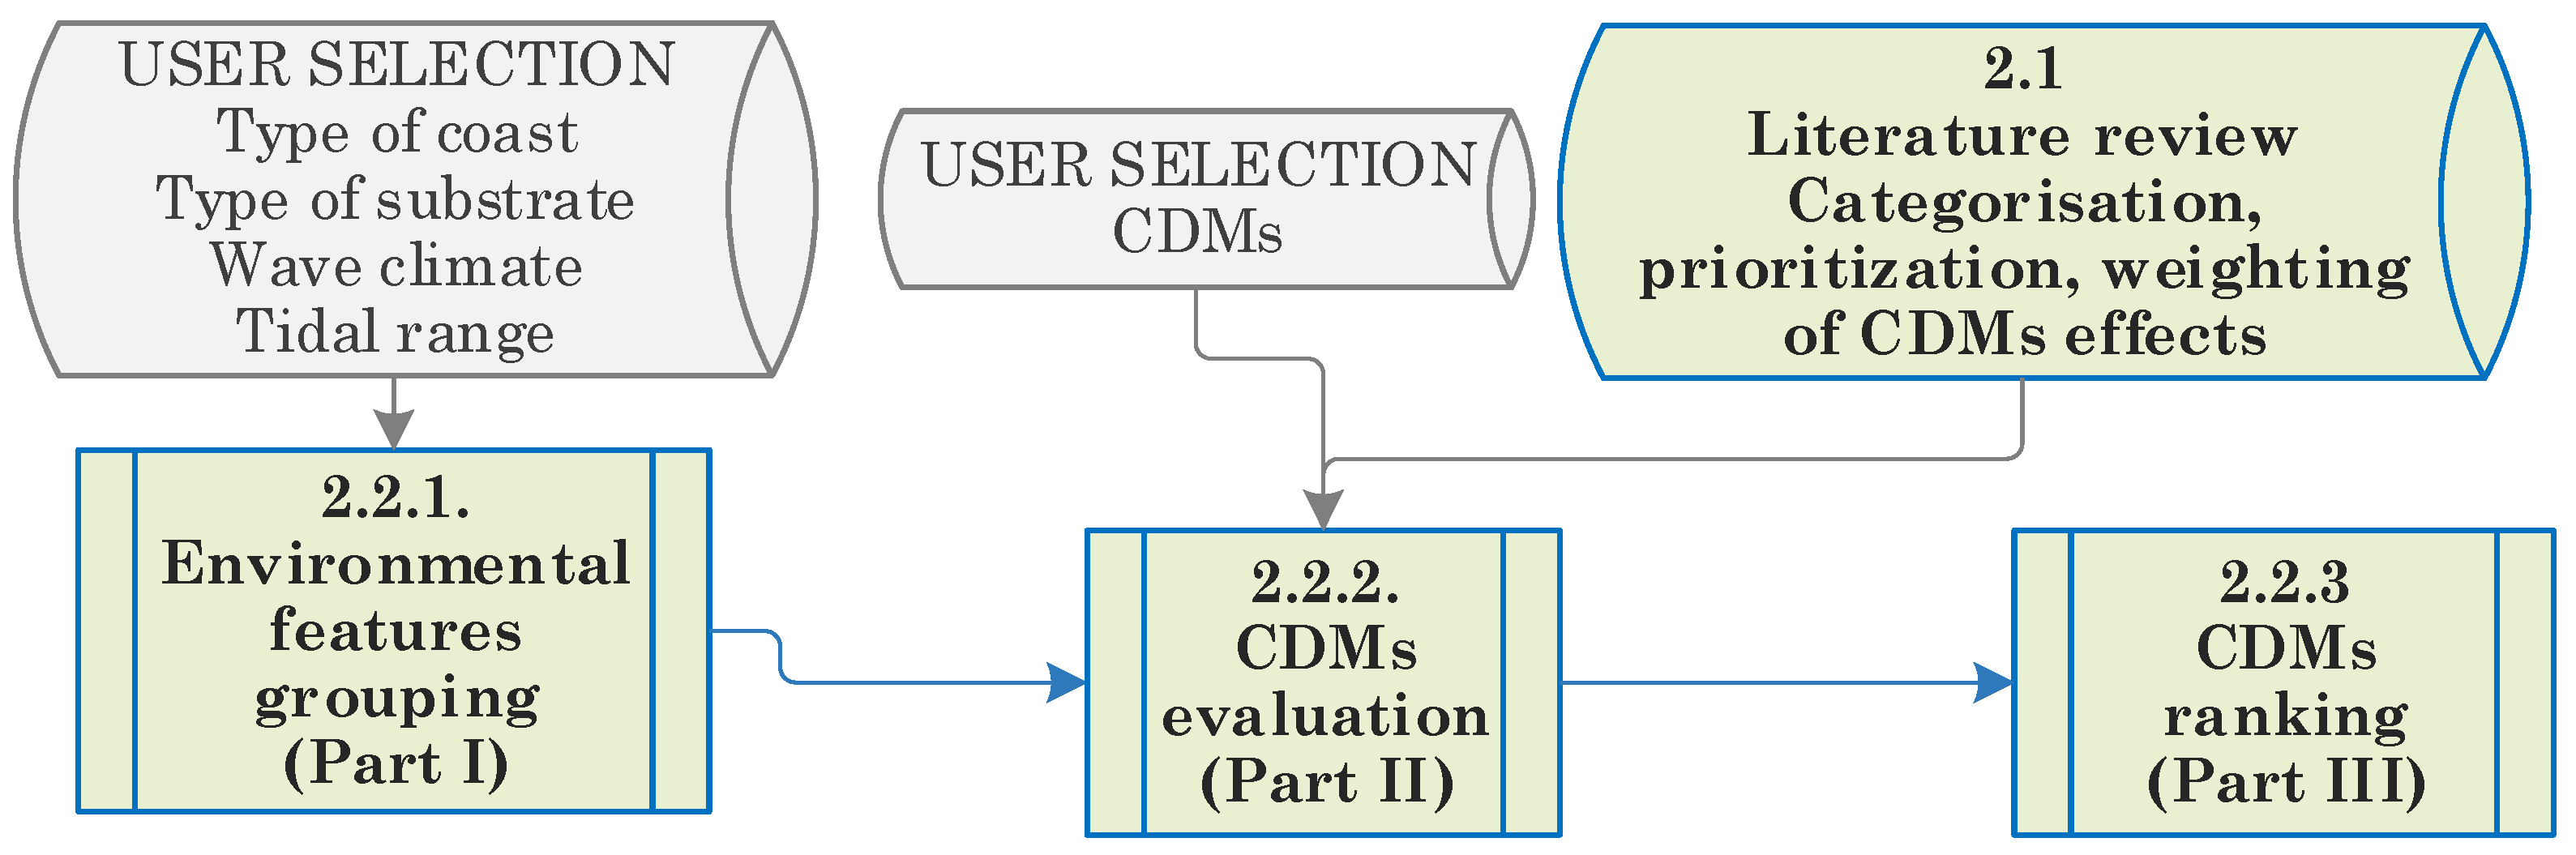
The coastal defence measure identification algorithm (CDMIA) is developed to (1) conduct a dynamic meta-analysis of the effects of CDMs on coastal systems, (2) centralize and structure the existing scientific knowledge drawn from published studies, (3) evaluate, compare, and rank CDMs in different environmental contexts, and (4) yield useful information to support the decision-making process. A graphical synthesis of the CDMIA is presented in Figure 1. First, the CDMIA is based on the evaluation of the authors’ observation statements of the effects of CDMs (Figure 2, Section 2.1). Second, the user selects from a pre-established list the relevant environmental features and CDMs to be evaluated. Third, the CDMIA is executed in three consecutive steps leading to the evaluation and ranking of the CDMs (Section 2.2).
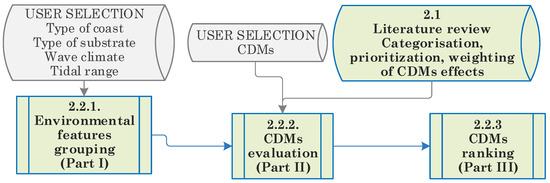
Figure 1.
Graphical synthesis of the CDMIA.
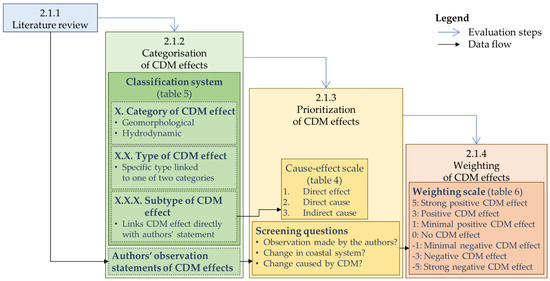
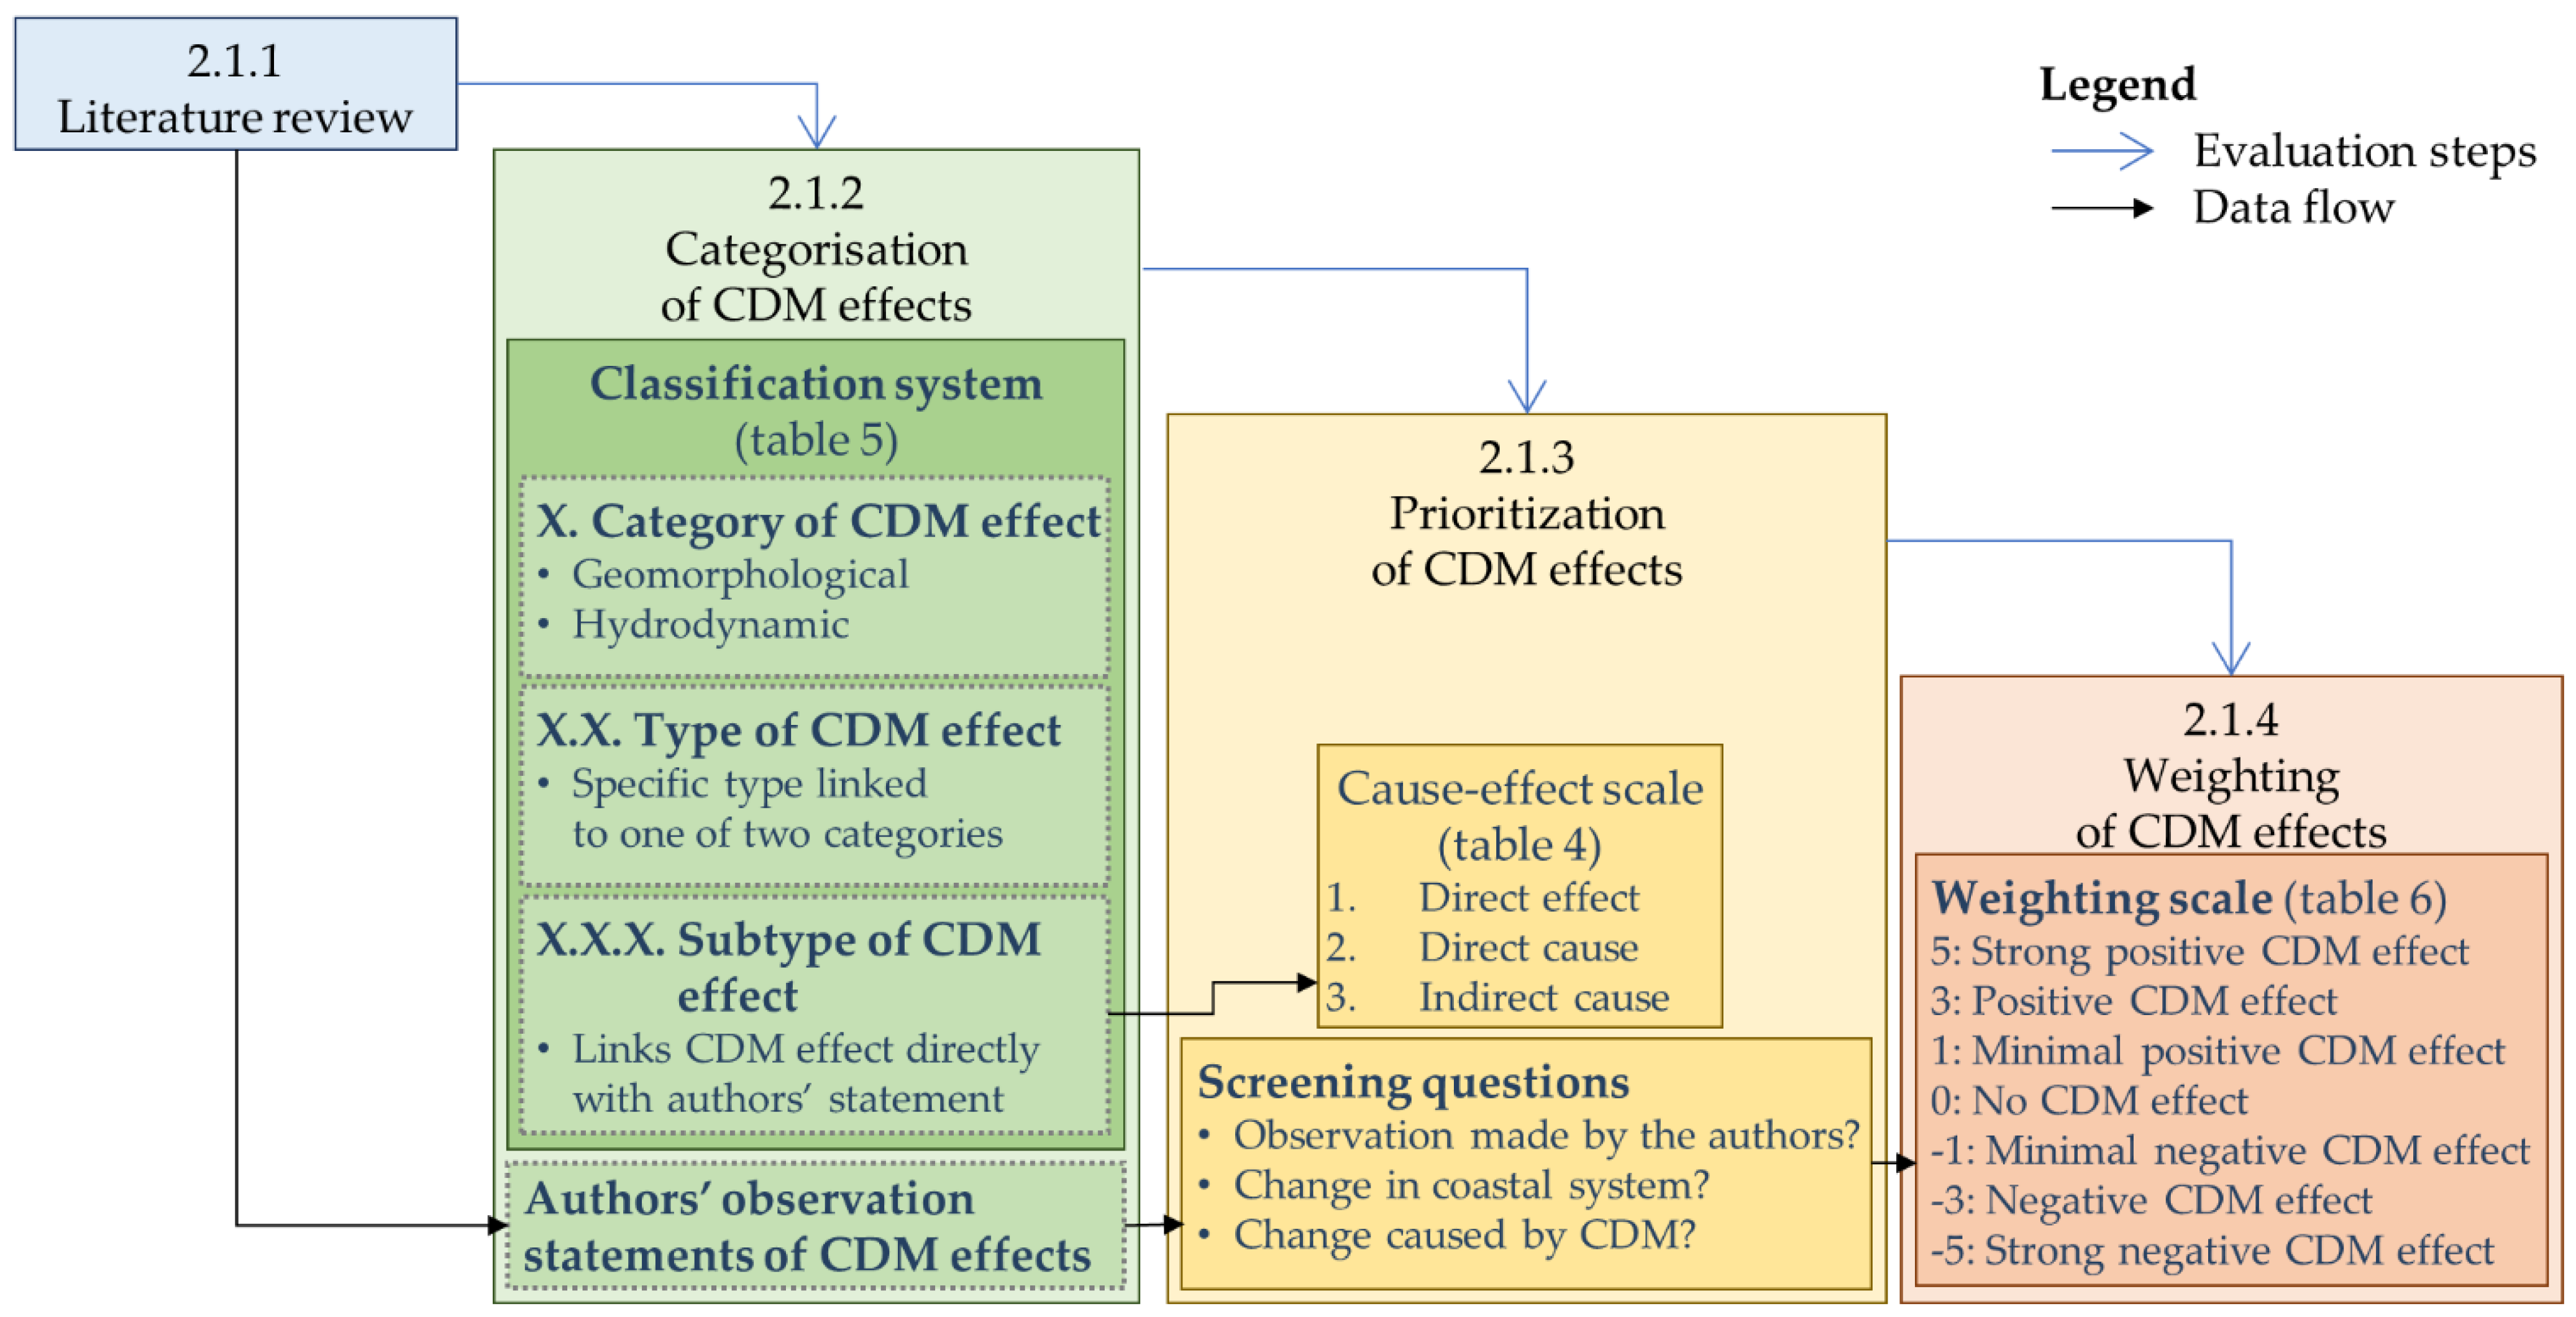
Figure 2.
Logical schema for the evaluation of authors’ observation statements of the effects of CDMs.
2.1. Evaluation of Authors’ Observation Statements of the Effects of CDMs
The evaluation of CDM effects is based on (1) a literature review, (2) the categorization of CDM effects, (3) the prioritization of observed CDM effects at the subtype level, and (4) the weighting of the CDM effects statements (Figure 2). The first version of the CDM identification algorithm (CDMIA) has the capacity to evaluate CDMs according to their geomorphological and hydrodynamic effects. The CDMIA was developed with the possibility of integrating plugins in order to add further extension modules and allow the evaluation of CDMs according to their ecological and social effects as well. Modules evaluating the ecological and social effects will be included in a future version of the CDMIA.
2.1.1. Literature Review
The methodology employed for the literature review is based on research conducted via Scopus, Web of Science, and Google scholar and was limited to CDM studies dated between 1970 and 2019, inclusively. CDMs are coastal adaptation measures implemented to limit or prevent coastal erosion, flooding, or landslides. The CDM categories included in the meta-analysis are presented and described in Table 1.

Table 1.
Definition of coastal defence measure categories integrated into the meta-analysis (category, subcategory, type).
A three-level screening process was used to select relevant publications:
- Step 1: Case studies were exclusively selected from field measurements and analysis and numerical and physical models.
- Step 2: Articles selected in step 1 were screened out when they did not evaluate one or more of the following CDM effects: geomorphological or hydrodynamic.
- Step 3: The remaining articles were retained only if they responded positively to all of the three following questions: (1) does the article include observations made directly by the authors (i.e., with original data)? (2) If so, do the observations indicate changes to the coastal system relative to a baseline condition? (3) If so, were the changes caused by a CDM?
A total of 411 publications were retained; they contained 1709 statements of observed CDM effects (supplementary S1). Information was extracted from the selected publications and organized in the database using three levels (Table 2).
Table 2.
Structure of the database which contains the information extracted from each of the selected publications.
The environmental characteristics, as described by the authors of the study sites (level 2), were homogenized using adapted classification systems (Table 3). The currents were not classified, due to the scarcity and disparity of information.
Table 3.
Classification systems used to homogenize four types of study site environmental features, as described by the authors in scientific publications. These four types are used in the algorithm as base variables to evaluate CDMs according to different coastal systems.
2.1.2. Categorization of CDM Effects
A three-level classification system for CDM effects (category, type, and subtype) was developed to facilitate the analysis of the authors’ observation statements in the database. The first level allows a sorting under one of two categories, either geomorphological or hydrodynamic. The second level allows the grouping of statements according to a broad type of observed effect. The third level links the specific CDM effect directly with the authors’ statement. The categorized CDM effects used in the analysis are presented in Table 4 (columns entitled CDM effect categorization and Description).
Table 4.
Cause–effect scale for the prioritization of CDM effects at the subtype level.
2.1.3. Prioritization of CDM Effects at the Subtype Level
The CDM effect subtypes are classified in a priority order based on a three-level cause–effect scale: direct effect, direct cause, and indirect cause (Table 4). This scale is added to Table 5 (column entitled Level on the cause–effect scale and justification). Level 1 corresponds to the observation of the direct effect of a CDM on coastal erosion or accretion. Direct effects are prioritized as they are related to the observation of a tangible change in coastal erosion or the accretion processes which the implementation of a CDM is meant to control. Level 2 corresponds to the observation of a phenomenon that leads to coastal erosion or accretion. Direct causes are classified in second order as they lead to processes that can cause coastal erosion or accretion but are not the main intended effect related to the implementation of a CDM. Still, CDMs, such as breakwater or groin, can be implemented to control the process at that level. Level 3 corresponds to the observation of a phenomenon that indirectly causes coastal erosion or accretion. Indirect causes are classified in third order as they lead to processes that can indirectly cause coastal erosion or accretion.
Table 5.
Categorization system (category, type, subtype) and prioritization of CDM effects.
2.1.4. Weighting of Authors’ Observation Statements
The significance of the CDM effects, as observed by the authors in the scientific literature, was evaluated using a weighting scale. As the majority of the authors’ observations present in the scientific literature are qualitative, the weighting scale is a qualitative scale from strong negative (−5) to strong positive (+5) (Table 5). Where quantitative results were provided in the observation statement, a ratio was established, and the quantitative value was transposed into the qualitative scale (Table 6, third column). The quantitative ratio is related to the percentage of change observed by an author or by an estimation of the change based on the data presented in a publication.
Table 6.
Weighting scale used for the evaluation of authors’ observation statements.
2.2. Coastal Defence Measure Identification Algorithm
The purpose of the coastal defence measure identification algorithm (CDMIA) is to evaluate the performance of CDMs in relation to specific coastal characteristics. First, a correspondence is established between user-selected environmental features (type of coast (TC), type of substrate (TS), wave climate (WC), and tidal range (TR)) and those available in the database. Then, the user-selected CDMs are evaluated according to their effects on the specified environmental features.
The CDMIA execution is divided into three successive parts (Figure 1). In the first part, groups are created from the user-selected environmental features, each group comprised of one environmental feature from each of the four types (TC, TS, WC, and TR, Table 3). In the second part, for each CDM and for each group of environmental features (part I), a correspondence is established with similar variables present in the database. The associated authors’ observed CDM effects are then selected by the CDMIA and evaluated according to their category and weight. In the third part, the CDMs are ranked in connection with the evaluation made in part II.
The CDMIA was developed using Visual Basic for Applications with Microsoft Excel ©, which was chosen for its accessibility. In the following sections, the words in brackets are related to functions or variables in the CDMIA procedure figures.
2.2.1. Environmental Features Grouping (Part I)
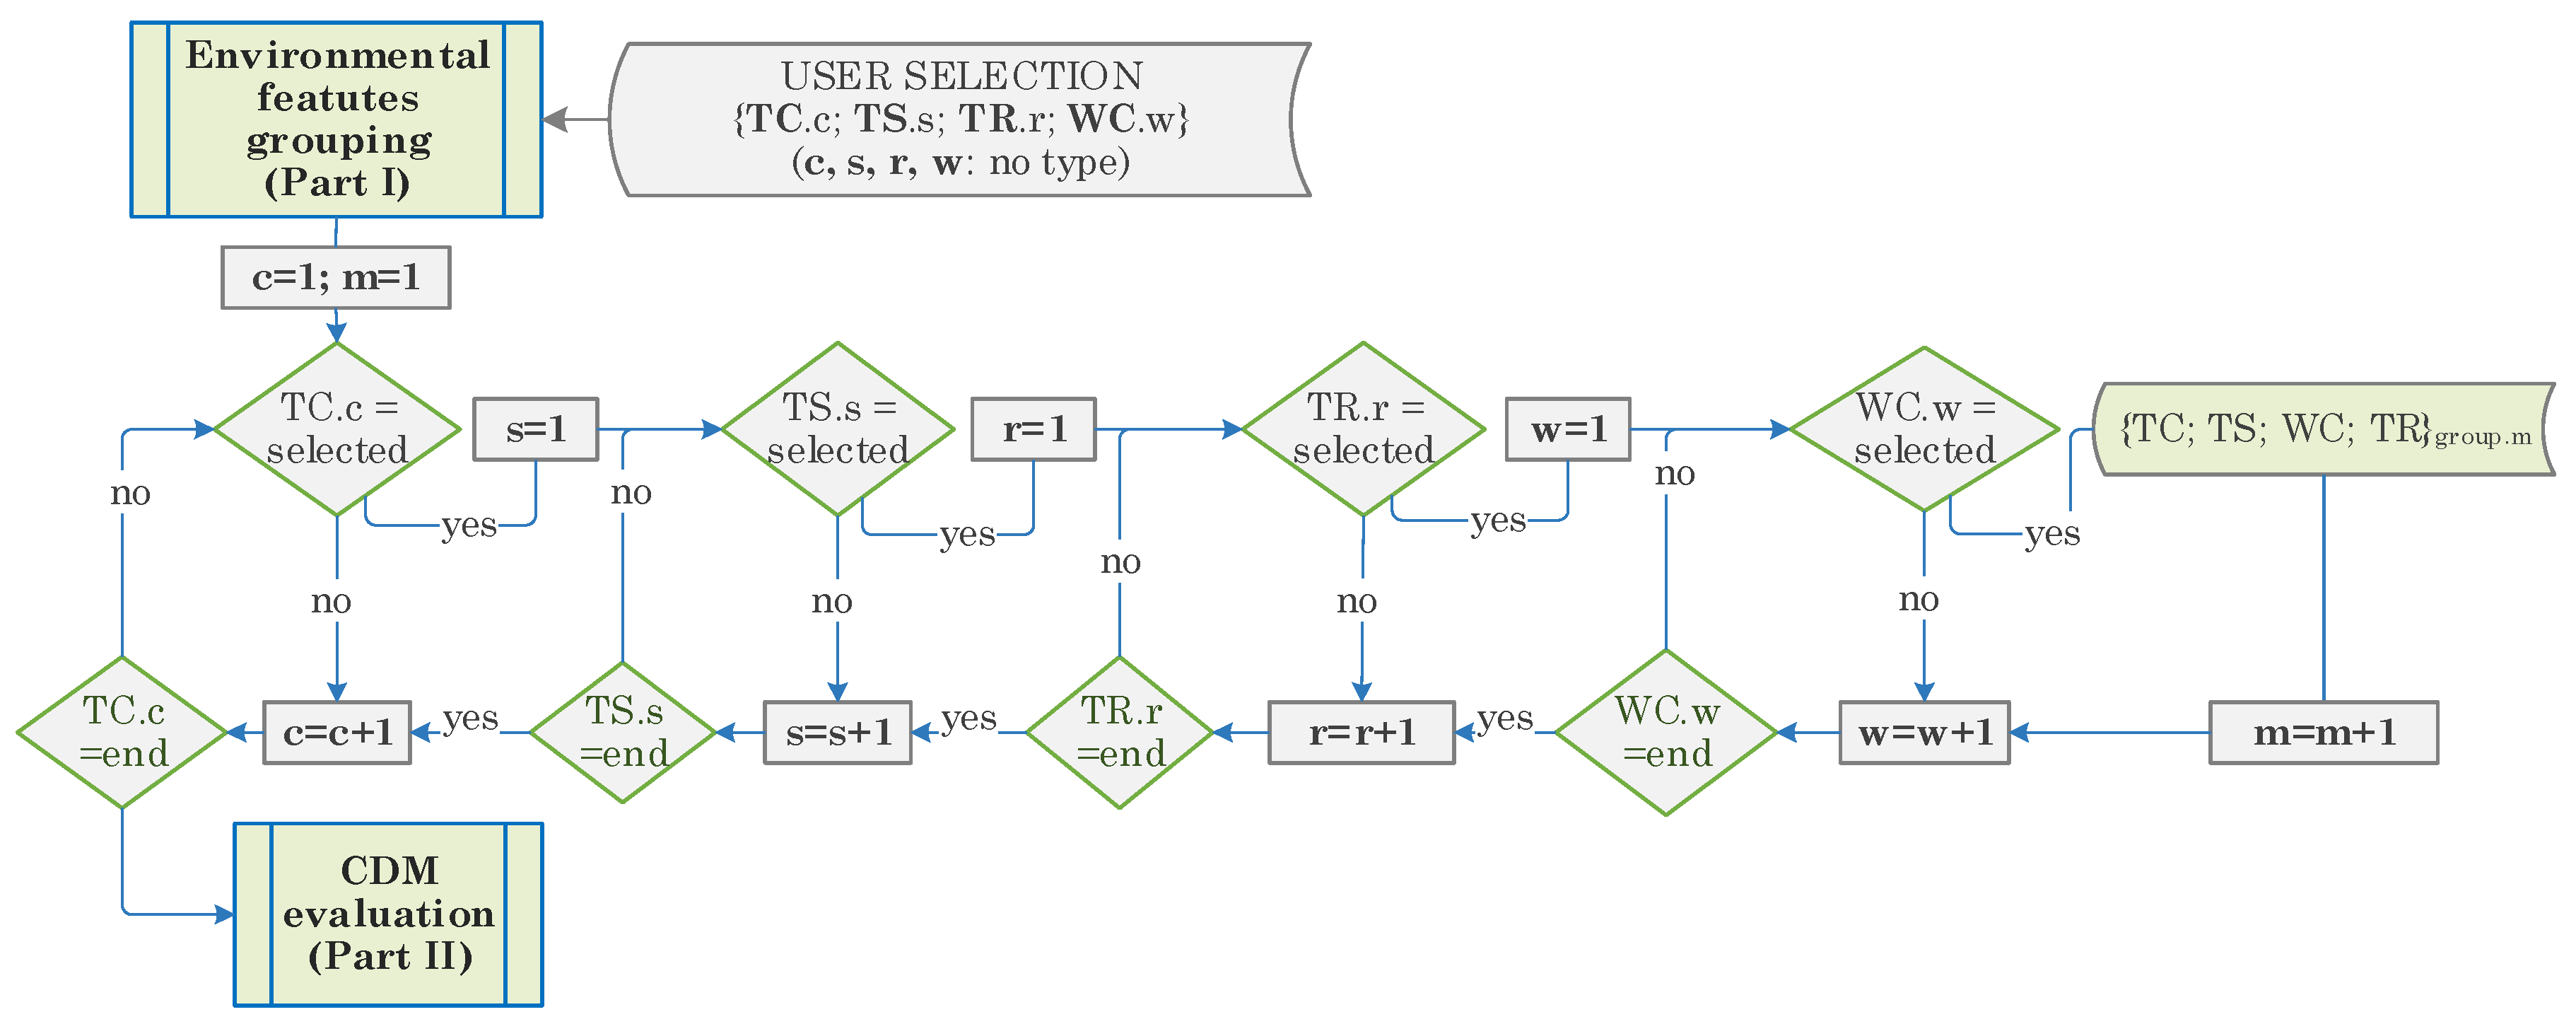
The first action of the CDMIA is a manual selection, by the user, of environmental features from four pre-established lists consisting of the elements itemized under each of the four types of environmental features, as presented in Table 3. For each type, any number of elements can be selected by the user. Based on the user selection, the first part of the CDMIA procedure is the creation of groups (a group) of environmental features that will define the specific environmental conditions against which the CDMs will be evaluated.
The CDMIA will create individual groups composed of one element from each type of environmental feature: type of coast (TC), type of substrate (TS), wave climate (WC), and tidal range (TR). It will then combine each environmental feature from one type with one feature from each of the remaining 3 types (Figure 3 and Table 7). This action will be repeated until every possible combination is achieved, thus forming multiple groups.
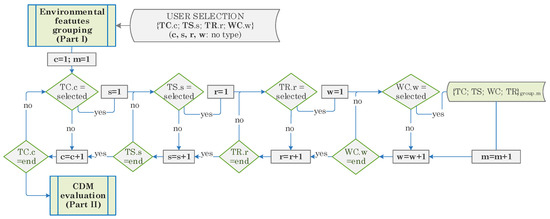
Figure 3.
CDMIA procedure for the grouping of environmental features.
Table 7.
Example grouping of environmental features according to a hypothetical user selection.
The central element of the CDMIA is divided in two fields; under the characterization fields is a list of environmental features (TC, TS, WC, and TR) with a CDM, and under the result fields is a list of evaluation criteria (Table 8). For each user-selected CDM, an evaluation is performed in relation to each group of environmental features. The results of the evaluation are compiled in the result fields. Two main loops make up the CDMIA: CDM (CDM.k) and group (group.m). The relation between the loops can be translated as follows: CDM.k ⊆ group.m. It allows the evaluation of each CDM against each group of environmental features. The results of the different analyses are recorded in the result fields and will be used to ultimately establish a hierarchy between the CDMs in relation to each group of environmental features.
Table 8.
Fields with their list of evaluation criteria.
2.2.2. CDM Evaluation (Part II)
The second part of the CDMIA is the CDM evaluation process (Figure 4). For each CDM and for each group of environmental features selected by the user (Part I), a correspondence is established with similar variables present in the database (FCT nb.obs.effect); then, the number of observed effects (nb.OE) associated with these variables is tallied up.
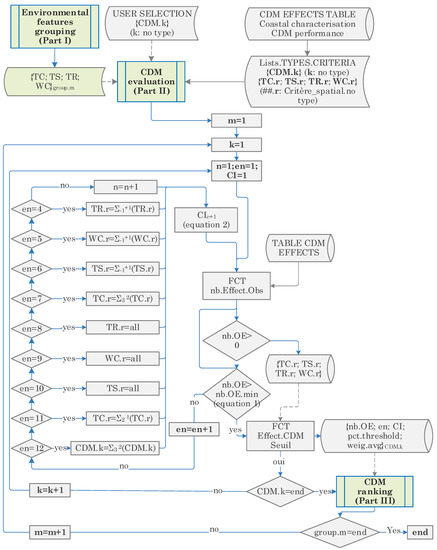
Figure 4.
Graphic illustration of CDMIA procedure for CDM evaluation.
If the nb.OE is larger than 0, the related environmental features (TC, TS, WC, and TR) are registered in a secondary table. If the nb.OE is larger than a minimum number of observed CDM effects determined by Equation (1) below (nb.OE.min, Equation (1)), the evaluation of the CDM effects is based on the environmental features entered in the secondary table. The results of the evaluation are recorded in the result fields (Table 8). If the nb.OE is smaller than the nb.OE.min, an enlargement (en, Table 9) of the original environmental features is conducted, which results in a decrease in the value of the correspondence index (CI, Equation (2)), an indicator of uncertainty. Following the enlargement process, the nb.OE is retallied. This loop is carried out until the nb.OE is larger than the nb.OE.min or until the highest degree of enlargement (en) has been reached. At that point, if the nb.OE is still smaller than the nb.OE.min, the CDM is rejected.
Table 9.
Degrees of enlargement of user-selected environmental features.
Once each CDM selected by the user has been evaluated in relation to each group of environmental features, a ranking of CDMs (part III) is carried out.
The tally of observed CDM effects defines whether the available information related to that CDM, in a given coastal system context, is sufficient to be used in the decision-making process. The purpose of this function is to extract from the database, and record in a separate table, the observed effects of a CDM (CDM.k) in combination with the associated environmental features (TC, TS, WC, and TR) and then to tally up the number of occurrences (nb.OE).
The minimum number of observed CDM effects (nb.OE.min) deemed acceptable to support the decision-making process is calculated based on the total number of observed effects in the context of the broad coastal category to which the specific type of coast, originally selected, is related (nb.OE.tot). For example, if the originally selected type of coast (TC) is a beach terrace, the nb.OE.tot will be calculated based on all types of coast in the category of “unconsolidated coast” (beach terrace, dune, littoral spit, barrier island, and unconsolidated cliff). Once calculated, the nb.OE.min is used to determine whether an enlargement of the original environmental features (en, Table 9) is required.
The calculation of the nb.OE.min is based on a polynomial equation which delineates an attenuation ratio between the nb.OE.min and the nb.OE.tot (Equation (1)). The equation was built by the authors to obtain a high ratio value (approx. 0.3) when the nb.OE.tot is low and a progressive attenuation which converges toward a minimal increase around a nb.OE.tot value of 350 (ratio of 0.14). The analysis is therefore based on a lower number of observed effects but a better match with the environmental characteristics of the study area.
The relationships between the different types of environmental features and the different types of CDMs are not fully covered in the scientific literature [12]. A function to expand the user-selected environmental features was therefore developed to enlarge the applicability of the available information. This is necessary, even though the enlargement (en) of the user-selected environmental features will result in a decrease in accuracy with the corresponding characteristics compiled in the database. In order to reach an acceptable compromise, twelve degrees of enlargement were defined (Table 9).
A correspondence index (CI) was integrated into the CDMIA to characterize the uncertainty of the information used in the evaluation of the CDM effects. CI has an initial value of 1 and is reduced according to a polynomial function (Equation (2)), which is directly related to the degree of enlargement (en). This equation was built to represent the exponential decreasing rate of accuracy between the degrees of enlargement. A visual analysis resulted in the definition of the parameters of the third-degree polynomial equation.
The function Effect.CDM was developed to evaluate the CDM effects on specific environmental features. First, in connection with the environmental features selected by the function nb.OE, and recorded in the secondary table, the function Effect.CDM tallies the number of observed CDM effects (nb.OE) per each level of the weighting scale (−5 to 5, Table 6). Second, Effect.CDM classifies and tallies the number of observed CDM effects by subtype, type, and category. The sum of the subtypes is the total of a type, and the sum of the types is the total of a category.
2.2.3. CDM Ranking
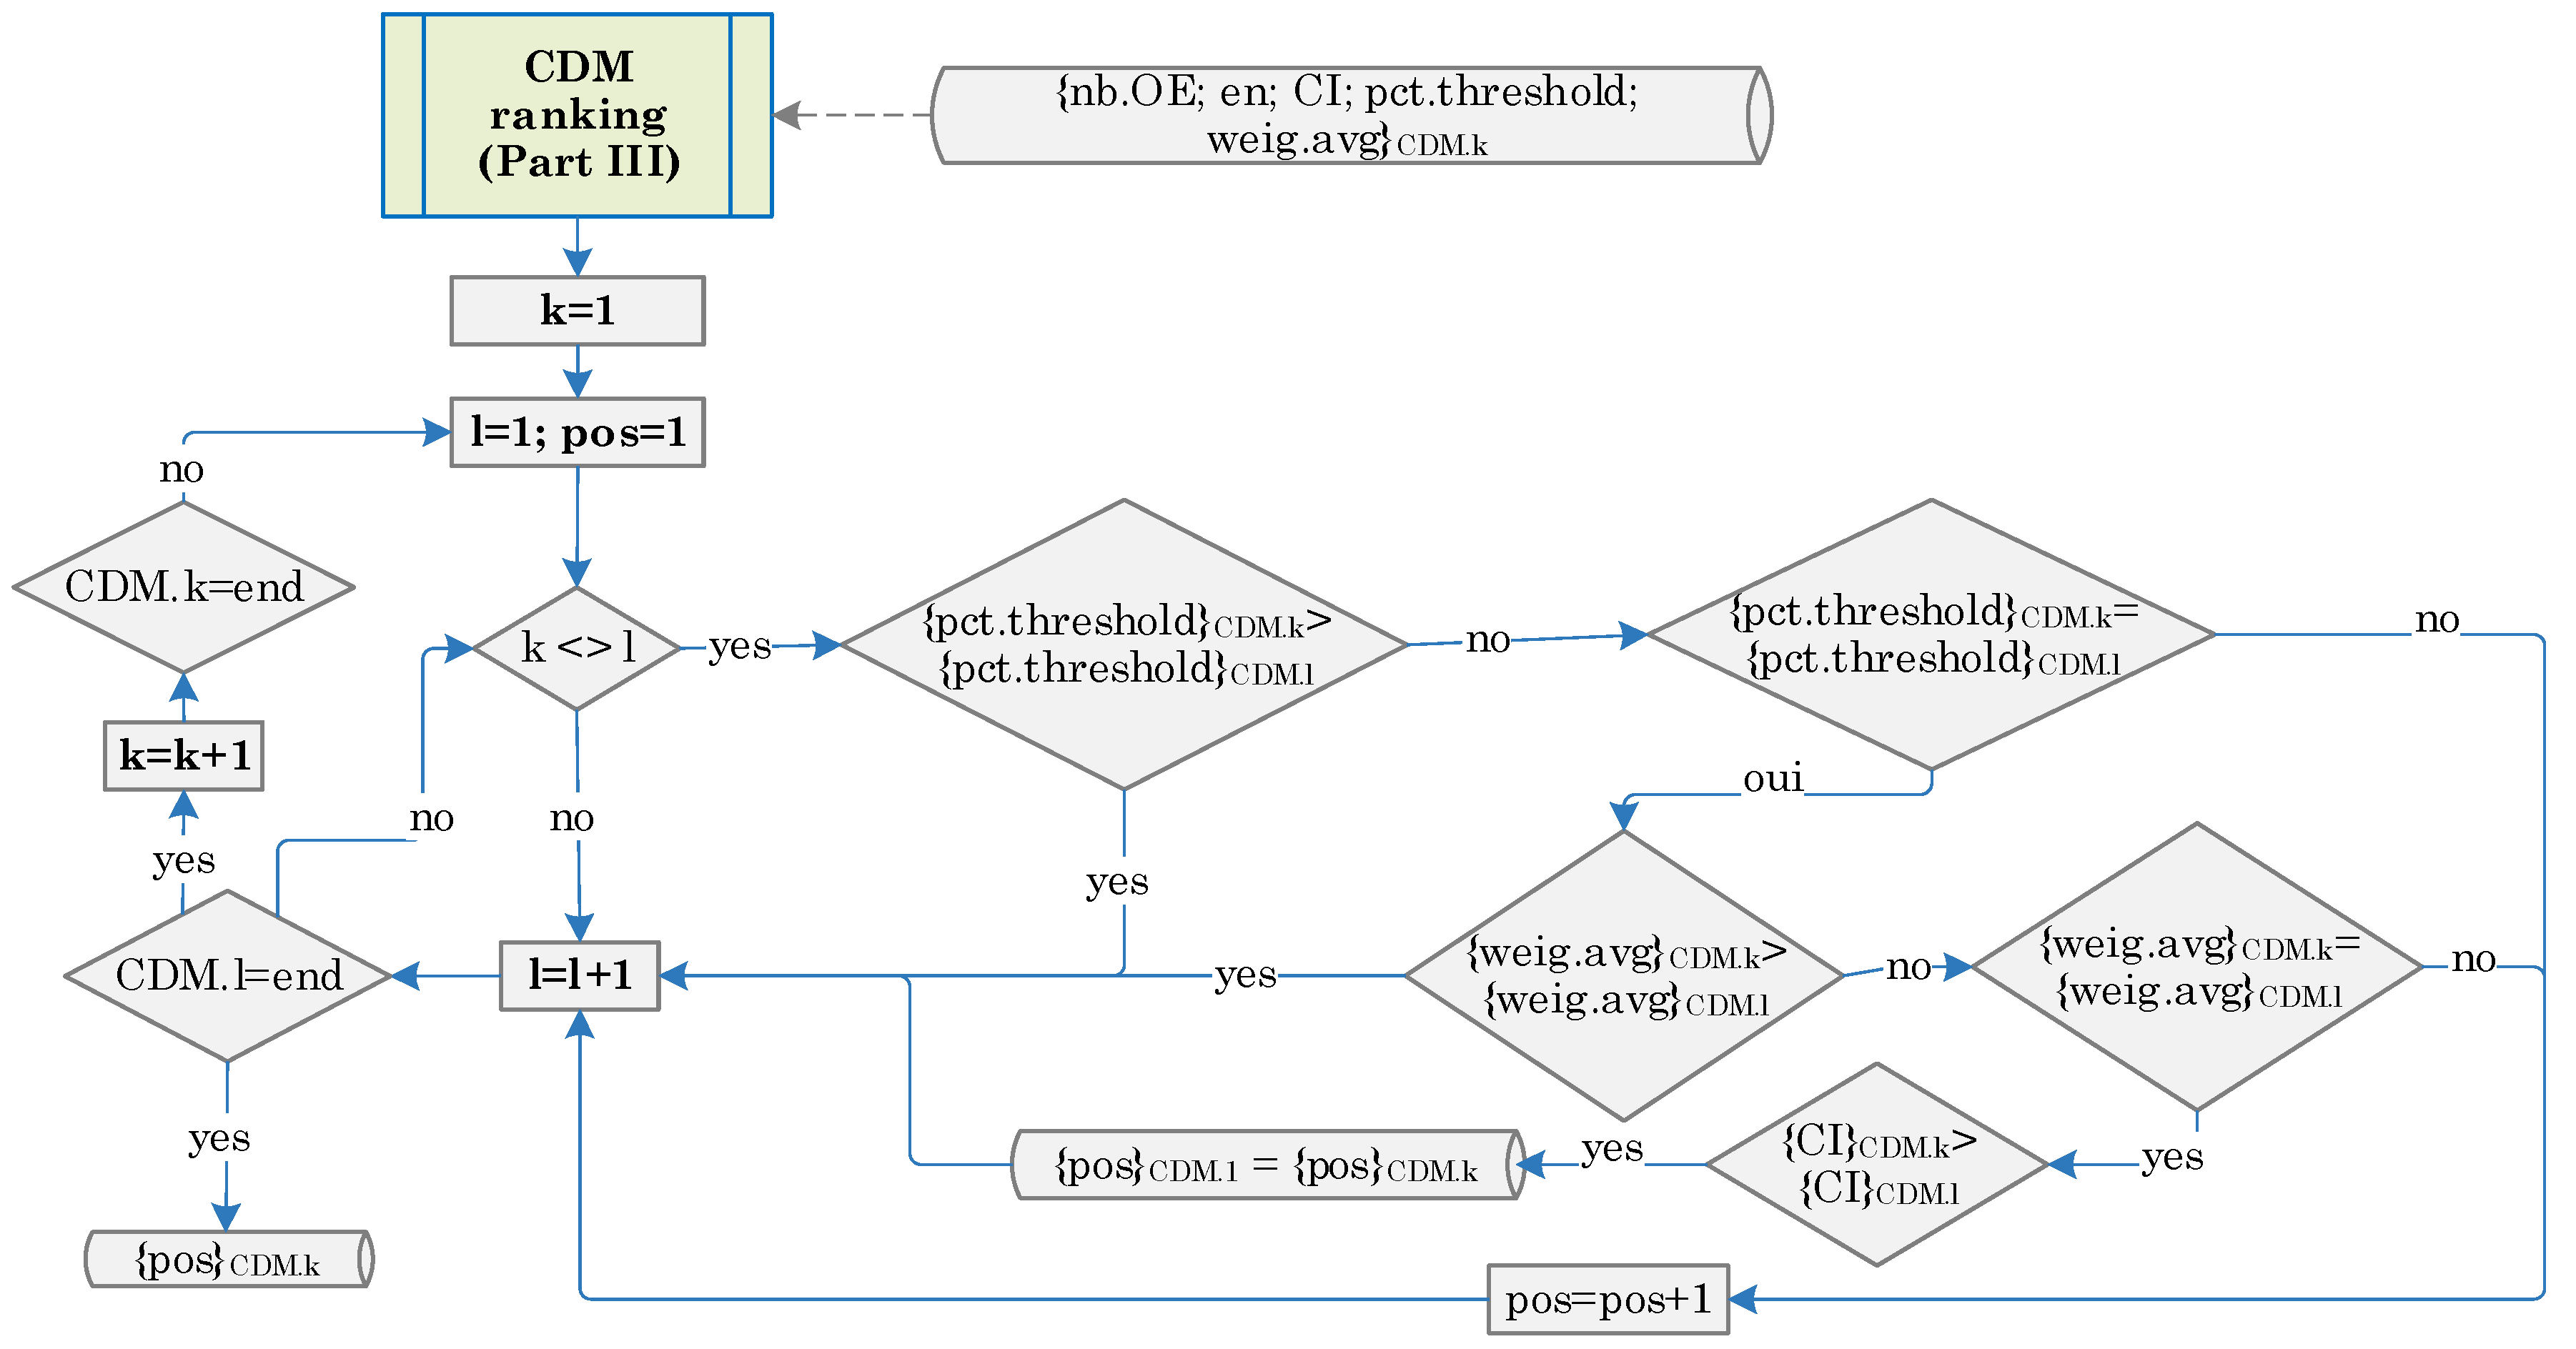
The CDM ranking is based on three criteria: the threshold percentage reached (thres.pct), the weighted average (weig.avg), and the correspondence index (CI) (Figure 5). In the case of a tie, the weighted average has precedence over the correspondence index. A selected CDM is removed from the ranking when the observed effects are null following a 12-degree enlargement of the initial environmental context.

Figure 5.
Ranking procedure.
A threshold percentage (thres.pct) is used to identify at which level of the weighting scale a defined percentage value of observed effects is reached. Following a sensitivity analysis, the thres.pct value was set at 60%. Under each level of the weighting scale, the percentage of observed effects in relation to the total number of observed effects is calculated. The thres.pct function calculates, for each CDM, the cumulative percentages from the highest level of the weighting scale (5) to the lowest (−5). The level at which the cumulative percentage of 60% is reached becomes one of the CDM performance indicators.
A weighted average (weig.avg) is used to obtain an overall score on the weighting scale. For each level of the weighting scale, the number of observed effects is multiplied by their corresponding level value. The results are then added up, and the sum is divided by the total number of observed effects.
3. Results
3.1. CDMIA Contextualized Results
The next two subsections present, as an example, the CDMIA results in the context of a littoral sandy spit, a mesotidal coast, and a low energy wave climate (Hs < 1.0 m). More CDMIA results examples are presented in supplementary materials (S2).
3.1.1. Summary Hierarchization
Table 10 presents an example of a summary hierarchization generated by the CDMIA. Column 3 shows the level on the weighting scale at which the threshold percentage (pct.thres) is reached, and column 4 shows the weighted average (avg). These two indicators give information on the performance of the CDM. The correspondence index (CI) and the number of observed CDM effects included in the evaluation (nb.OE) are shown in columns 5 and 6. These two indicators give information on the uncertainty of the results. Columns 7 to 13 show the distribution of the nb.OE for each level of the weighting scale.
Table 10.
Summary hierarchization resulting from the evaluation of CDM geomorphological effects. The results presented, as an example, are in an environmental context described as littoral sandy spit, mesotidal coast, and low energy wave climate (Hs < 1.0 m). The background blue shades is used to give a visual indication of the distribution of the nb.OE on the weighting scale.
There is a complementarity between pct.thres and avg: when both numbers are fairly close in value, the results can be considered conclusive, but when there is a significant difference between the two numbers, a threshold effect occurs and indicates the necessity to scrutinize the results. For example, with a pct.thres set at 60%, a threshold effect will occur when 59% of the observed effects is reached at level 3 on the weighting scale, and 60% is reached at level −1. In Table 10, a threshold effect occurs in the case of low-crested breakwater, which reaches the pct.thres at level −3 but has an avg of −0.588, a fairly large difference between the two values. A closer look at the results shows that even though the two values are in the negative range, a large number of observed effects (41.1%) are actually in the positive range of the weighting scale.
3.1.2. Detailed Results
The hierarchization of the information provides detailed results according to several levels of aggregation. The analysis of the CDM effects can be adapted to the user’s needs, while maintaining a proximity to the raw data (characteristics of the study area and the observed CDM effects) which were processed and structured in a way to provide relevant information for the CDM decision-making and design processes.
A detailed results list (Table 11) presents the observed CDM effects subdivided by the three levels of the cause–effect scale (Table 4) and the three levels of classified CDM effects (Table 5). The top line is the aggregation of all the observed effects within the geomorphological category (Agg, Table 11, column 3) and corresponds to the results presented in the summary hierarchization (see Table 10, rnk 10, Beach nourishment). The first degree of data disaggregation is by level on the cause–effect scale ([DirE = direct effect; DirC = Direct cause; IndC = Indirect cause], Table 11, column 3). The second and third are by type and subtype of observed effects, respectively.
Table 11.
Detailed results list of the observed effects of beach nourishment subdivided into geomorphological categories (category, type, subtype). The results presented, as an example, are in an environmental context described as litoral spit, sand, mesotidal coast, and low energy wave climate (Hs < 1.0 m). The background blue shades is used to give a visual indication of the distribution of the nb.OE on the weighting scale.
The disaggregated information shows both the positive and negative CDM effects, which are indicators of a CDM’s strengths and weaknesses. This information can be used to improve CDM design. Improvements can also sometimes be achieved by using a combination of complementary CDMs. For example, when looking at the broad Erosion/Accretion classification, based on a large number of observations (Table 11, nb.OE, column 5, nb.OE = 67), beach nourishment has a generally positive effect. Still, drilling down into the details reveals that 83.3% of the observed effects under the subtype “erosion” (observation of erosion in general, Table 5) are neutral or show no evidence that beach nourishment has a positive or negative effect on the general erosion of the beach. Thus, an engineer could use this information to improve the efficiency of beach nourishment against erosion, by combining it with a complementary CDM. Moreover, under the subtype beach profile beach nourishment shows a negative average (−0.111) based on nine observations. However, this average is close to a neutral effect as 33.3% of the observations are at the −3 level on the weighting scale, 33.3% are at level 3, and 22.2% are at level 0. Therefore, the negative average (Table 11, column 6: avg) is based on only a ninth of the observations (i.e., 11.1% at level −1). Again, an engineer could adjust the design by using, for example, a better adapted granulometry.
3.2. CDMIA Overall Results
The CDMIA was developed with the objective of obtaining a detailed assessment of CDMs in relation to a specific group of environmental features. In order to evaluate the overall performance of the CDMIA according to variations in environmental features, an analysis of the results, based on the averaging of correspondence indexes (CI), was conducted for each group of features. Moreover, the overall performance of CDMs, in each group of environmental features, was conducted through an averaging of the weighted averages.
The averages of the CI values vary between 1 and 0 and are presented in Table 12. A value of 1 indicates a perfect correspondence, while a value near 0 indicates an absence of correspondence. The averaging of the CI values gives an indication of the accuracy of the results in each group of environmental features.
Table 12.
Average correspondence index (CI) and number of CDMs evaluated (CI (nb.CDM)) for each group of environmental features (type of coast, type of substrate, tidal range, and wave climate). The background colours are associated with CI values (red [0] < yellow [0.5] < green [1]).
The CDMIA’s highest level of accuracy is associated with unconsolidated low coast (littoral split, beach terrace, barrier island, and welded barrier/tombolo) with substrates corresponding to silt, sand, or pebbles. Eighteen CDMs were evaluated in relation to these coastal characteristics, and the resulting average CI values varied between 0.665 and 0.770.
Table 12 shows a sampling of the results and the average values of the correspondence index (CI). The detailed results are not presented here due to lack of space, but it is worth mentioning that the lowest CI value was 0.375, and the highest values varied between 0.794 and 1. The lowest CI was associated with either mega-nourishment, rip-rap or land vegetation and can be explained by the low number of observed effects found in the literature in relation to these protection measures, and the fact that enlargement had to be used in these cases in order to reach the nb.OE.min (see Section 2.2.2). At the other end of the spectrum, maximum CI values were obtained when the number of observed effects was higher than the nb.OE.min, and enlargement was not necessary. In such cases, there is a better match between the study area features and those compiled in the database and thus better accuracy in the results. A perfect correspondence (CI = 1) was reached in seven of the 4374 cases (0.160%) (combination of a set of environmental features and a CDM). Of these seven cases, the nb.OE was higher or equal to 10 in two cases, between 5 and 9 in two cases, and lower than 5 in the remaining three cases.
Salt marsh, with clay or silt substrate, presents an adequate accuracy with an average CI value varying between 0.628 and 0.648. However, this result was based on only five CDMs with a sufficient number of observed effects to be included in the analysis. Meanwhile, the data for the unconsolidated cliff were based on the evaluation of 18 different CDMs, but the accuracy was low, with an average CI value varying between 0.385 and 0.406. A CI value of zero occurs when there is no observed effect associated with a CDM, or when illogical groups of environmental features are formed (e.g., dune with substrates other than sand; salt marsh with sand, pebbles, cobbles, and boulders, etc.). Rocky cliff behind an unconsolidated beach was retained in the analysis because a few sites in which CDM effects were observed consisted of an unconsolidated coast backed by a rocky cliff. Still, only two CDMs were evaluated in such environments.
The performance evaluation of each CDM in different environmental contexts was calculated by averaging the weighted average values of the CDM effects for each type of coast (Table 13). The average number of observed effects (avg. nb.OE) was included in Table 13 to contextualize the averaging results.
Table 13.
Averaging of weighted average values of CDM effects by type of coast. Average nb.OE is written between brackets (avg. nb.OE)).
In general, soft techniques score higher than rigid structures for all types of coasts. All soft techniques present a weighted average higher than 1 in the analyzed coastal types. Land vegetation, aquatic vegetation, and permeable drainage layers present the highest average, with a value of 3 when associated with unconsolidated coasts. However, the results of the latter two are based on only one observed effect. Mega-nourishment, sediment derivation, and sediment trapping, in connection with unconsolidated coasts (sediment trapping only applies to dunes), present results higher than 2.5 with minimum and maximum values of 2.54 (all unconsolidated coasts combined with all other environmental features) and 3.80 (beach terrace, sand, microtidal, and high energy waves). Sediment derivation methods are generally used as a corrective measure when a primary CDM causes sediment retention (e.g., jetty or groin). Frequently used CDMs, such as beach nourishment, dune nourishment, and nearshore nourishment, present an averaging of weighted average values between 1.42 and 2.03, with minimum and maximum values of 1.31 (dune, sand, and high energy waves) and 2.03 (all unconsolidated low coasts, sand or pebbles, and high-energy waves). As for rigid structures, emerged breakwater in a salt marsh context and jetty in six of the eight coastal types showed the best performances. However, their averaging of weighted average values was based on only one and two observed effects, respectively. In association with all unconsolidated coasts, permeable groin presents results higher than 1, as does emerged breakwater, except in a dune context for the latter. Lastly, rock armour, seawall, low-crested breakwater, rip-rap, and submerged breakwater all show negative results in most types of coasts.
4. Discussion
Uncertainties are inherent to coastal systems, therefore decision-makers must take them into consideration when evaluating coastal defence measures [13,14]. In recent years, decision-support tools have been increasingly used in environmental management [24,70,71] to help decision-makers assess, in an objective way, multiple potential solutions to solve complex and inherently uncertain problems [70,71]. Ultimately, decision-support tools act as an objective support which structures information in a way that hierarchizes CDMs in relation to their effects on the systems’ dynamics [72,73]. It also allows decision-makers to choose the best solution in accordance with their priorities and preferences [74,75].
In coastal engineering, solutions are generally site specific, designed with standard procedures but without a design code [76]. The construction of a CDM best adapted to the needs of a specific site can only be accomplished through a multiphase process in which a variety of scenarios are evaluated in order to solve a predefined problem before moving on to the design phase [25]. In addition, cutting-edge scientific knowledge is essential to the planification and design processes in order to reduce uncertainties [76,77,78]. Therefore, there is a need for the use of decision-support tools to facilitate the evaluation of scenarios and answer the predefined project objectives, while considering the relation between the CDMs and the environmental characteristics [73].
Examples of decision-support tools used for different aspects of coastal zone management are models for climate and offshore and nearshore wave climate, geographical information systems, Bayesian network, and multicriteria decision analysis (MCDA) [24]. Still, to the authors’ knowledge, a decision-support tool that integrates scientific knowledge into the CDM decision-making process has not been developed to date for use in the field of coastal engineering and management.
4.1. Contribution to Coastal Engineering and Management
The coastal defence measure identification algorithm (CDMIA) was developed to answer a need to integrate the most current site-specific scientific knowledge into the decision-making process and as a tool to facilitate the selection of the best adapted CDMs [12,19,79,80]. Once the relevant information found in multiple scientific publications is entered in the database, the CDMIA organizes and processes the data. It establishes links between the coastal features, defining an intervention site and features already present in the database, and it ranks selected CDMs against these site-specific features, using the most recent scientific knowledge. This assures that the site-specific complexity is integrated into the analysis, and the results are presented in a multilevel aggregated structure, offering several options to select from, including design adaptations to achieve the best CDM performance [81]. The CDMIA can be applied at different levels to accommodate the users’ (coastal managers, decision-makers, and engineers) requirements. It establishes a variety of scenarios to be considered, and it also provides information that is helpful to the design process. Moreover, it has the capacity to analyze the accuracy of the results for each CDM in relation to multiple sets of environmental features, thus adding a level of confidence to the decision-making process.
The optimal use of the highest aggregation level (summary hierarchization) is in the phase of establishing CDM scenarios. As a pre-selection tool, it provides the users with an overall CDM evaluation. At this level, all of the authors’ observation statements of CDM effects (nb.OE), drawn from the scientific literature, are aggregated to generate a global evaluation. The CDMIA facilitates the integration of scientific knowledge in a concise and structured manner and is meant to be used in connection with existing technical tools, such as numerical models and decision-support systems. The purpose of these tools is to help decision-makers understand the interactions between variables in the natural and social systems [73] in order to better assess the individual CDM’s characteristics and behaviour in different environmental contexts. The disaggregated data (detailed results list) allows the results to accurately represent the primary authors’ observation statements of CDM effects. At the design phase, it offers information useful to the assessment of the strengths and weaknesses of CDMs and of the possible benefits of using complementary CDMs in combination with each other. It therefore contributes to the comprehensive analysis of CDMs at the scale of a coastal system rather than at the conventional local scale based solely on technical aspects [12].
As mentioned above, the processed data provided by the CDMIA can give an overview of the general accuracy of the results for all CDMs in relation to multiple sets of environmental features. This can be helpful to coastal managers or engineers who wish to make a quick assessment of CDM performance against characteristics of a specific intervention site.
4.2. CDMIA Analysis
Based on observations of the algorithm dynamics and on a sensitivity analysis, the number of observed CDM effects (nb.OE) proved to be a key parameter within the CDMIA because it relates to all the internal parameters, and it has an influence on the accuracy and the uniformization of the results. While scientific knowledge contributes to the reduction in the coastal system’s inherent uncertainty [82], the nb.OE is directly related to the reliability of the CDMIA results. The CDMIA was designed for continuous improvement by the addition of information from new scientific publications. Thus, the accuracy of the results obtained with the first version of the CDMIA will be improved in future versions with the addition of new data and an increased number of observed CDM effects (nb.OE).
The addition of observed effects will lead, in three possible ways, to a substantiation of the information and a reduction in uncertainty, depending on whether the information being added is related to a new CDM or new environmental features. First, new observed effects related to a CDM and a set of environmental features that are both already present in the database will lead to an increase in the nb.OE and, therefore, a concretization of the information related to that specific CDM. Second, new observed effects related to a CDM already present in the database, but in a new environmental context, will lead to an increase of the CI value and to a global increase in the nb.OE. Therefore, the uncertainty will be reduced by a better correspondence between the environmental characteristics of the intervention site and those stocked in the database. Third, new observed effects related to a CDM that is not present in the database will increase the diversity of CDMs associated with specific environmental features and potentially widen the choice of appropriate solutions for intervention sites in a similar context. Ultimately, the ongoing integration of scientific knowledge contributes to the continuous improvement of the decision-making process [14,83]. It is also in keeping with adaptive management approaches, which are useful when making decisions within the inherent uncertainty and unpredictability of complex coastal systems [84,85]. Additionally, it contributes to the increase in the coastal communities’ overall resilience [78,86].
4.2.1. Accuracy of the Results
The accuracy of the CDMIA results is related to both exogenous and endogenous sources of uncertainty. The exogenous uncertainty is directly related to the number of observed effects (nb.OE) associated with each CDM and found in the scientific literature: a larger nb.OE leads to the consolidation of the observations and lowers the uncertainty of the results. Still, a minimum number of observed effects (nb.OE.min) is required to ensure the reliability of the results. The correspondence index (CI), strictly a function of the degree of enlargement (en), was incorporated into the CDMIA as an indicator of uncertainty when the nb.OE was initially lower than the nb.OE.min, and enlargement is necessary in order to broaden the analytical framework. A joint interpretation of the results must be performed between the CI and the nb.OE because of their interdependency: (i) an increased nb.OE leads to a decrease in uncertainty; (ii) an increased nb.OE, through enlargement, lowers the CI and leads to an increase in uncertainty. Therefore, a balance must be reached between the nb.OE and the CI.
The endogenous uncertainty is related to internal parameters in the CDMIA (i.e., nb.OE.min and en). Even though these parameters were validated through a sensitivity analysis, their variation can influence the results of the CDMIA. However, if the nb.OE were the same for all CDMs, the endogenous uncertainty would be eliminated because the nb.OE.min would have the same value for all CDMs. The application of the nb.OE.min, as a threshold, corroborates the results by ensuring that the effects, at the subtype level, were observed a minimum number of times. The very low number of cases where a perfect correspondence was reached with an nb.OE higher than 5 (4 out of 4374 cases) shows the need for the application of the nb.OE.min equation and for the use of an enlargement function to increase the nb.OE. As a reduction in accuracy ensues from these actions, a validation of the results is necessary. As new studies in different environmental contexts emerge and are integrated into the database, the accuracy of the results will improve. That is why the CDMIA was designed to accommodate new scientific research.
4.2.2. Uniformization of the Results
A uniformization of the results tends to occur with two of the CDMIA’s internal functions: the degree of enlargement (en) and the minimum number of observed CDM effects (nb.OE.min). The uniformization is directly proportional to the degree of enlargement. For example, two different CDMs, but of the same type and in the same subcategory of coast, with an enlargement of 12, would have an identical evaluation. However, this uniformization tendency would be attenuated by the integration into the system of data from new scientific publications, which would contribute to an increase in the nb.OE, and a decrease in enlargement degree necessary to attain the nb.OE.min.
The value of the minimum number of observed CDM effects (nb.OE.min) is important in order to balance the correspondence index (CI) against the nb.OE. For instance, in the context of a low number of study sites for a specific coastal type, if the value of the nb.OE.min is high it will lead to a high nb.OE but also to a low CI value as a high degree of enlargement will be needed in order to meet the minimal requirements. This will lead to a uniformization of the results. It is therefore preferable to have a lower nb.OE.min in order to reduce the degree of enlargement and increase the variability of the results. In the end, the nb.OE will be lower but with a higher correspondence index (CI) and thus higher accuracy.
4.2.3. Comparison with Other Decision-Support Tools
While CDMIA contains sources of exogenous and endogenous uncertainties, each decision-support tool generally used in coastal management, such as numerical modelling and multicriteria decision analysis (MCDA), has its own uncertainties.
The uncertainties in numerical models of climate change projections are related to unknown future emissions, internal climate variability, and inter-model differences [87,88,89]. Concerning nearshore models, Kroon et al. [90] have demonstrated that, in mega-nourishment, 50% of the variance in the loss of sedimentary volume, over a 2.5-year period, is attributed to the models’ uncertainties. In MCDA, which allows the integration of local actors in the decision-making process, uncertainties arise from the elicitation of criteria weights by different stakeholders and also from the process of aggregating criteria weights [91,92,93]. However, these uncertainties can be mitigated by combining MCDA with other analytical methods [94,95].
Despite their drawbacks, these tools are relevant to the decision-making process [70,71]. Considering the inherent uncertainties of coastal systems, different sources of information add knowledge to the decision-making process, thus widening the choices and improving the suitability of adaptation solutions. The combination of pertinent decision-support tools provides more suitable and reliable information [96]. Combining CDMIA with other decision-support tools is worthwhile when considering the multiple aspects of coastal systems in the decision-making process, because each has a different purpose. For instance, while the climate models’ projections provide data that are at the basis of the analysis, the CDMIA helps concretize and structure the information in a comprehensive and useful way for decision-makers.
5. Conclusions
An identification algorithm was developed to (1) conduct a dynamic meta-analysis of CDM effects on coastal systems, (2) centralize and structure the existing scientific knowledge drawn from published studies, (3) evaluate, compare, and rank CDM in different environmental contexts, and (4) yield useful information to support the decision-making process. The evaluation starts with the establishment of a correspondence between environmental features characterizing an intervention site and information from the case study publications previously stocked in a database. Once a correspondence is established, the evaluation is formulated according to a qualitative weighting scale (−5 to 5) used to hierarchize the CDMs. Based on two performance indicators (weighted average and threshold percentage reached) and two accuracy indicators (correspondence index and number of observed CDM effects), the results are structured under the several levels of aggregation meant to be used by coastal decision-makers and engineers for different purposes and at different stages of the decision process. First, a summary hierarchization presents the ranking of CDMs at the highest aggregation level. It provides an overall evaluation of CDMs and can optimally be used as a pre-selection tool for decision-makers. Second, the detailed results are presented under several disaggregated levels, providing information on the CDM’s strengths and weaknesses, which can be used in the design stage of the process. In addition, a macro analysis gives an idea of the overall accuracy of the results, and the overall evaluation of the CDMs under different sets of environmental features. Moreover, CDMIA could be used in combination with other decision-support tools to widen its scope and to include into the decision-making process multiple aspects of coastal systems. The database will be updated on a regular basis to ensure the continuous relevance of the CDMIA. In the future, extension modules will be developed and integrated into the programme to allow the evaluation of the CDMs in relation to their ecological and social effects. Finally, the operationalization of the CDMIA will eventually be possible by completing a form in Microsoft Excel © or through a geographical information system via a linkage to the type of coast, type of substrate, tidal range, and wave climate.
Supplementary Materials
The following are available online at https://www.mdpi.com/article/10.3390/jmse10030394/s1, Supplementary S1: Database references list, Supplementary S2: CDMIA results examples.
Author Contributions
Conceptualization, P.S. and M.G.; methodology, P.S.; validation, P.S., P.B., and M.G.; formal analysis, P.S. and M.G.; writing—original draft preparation, P.S.; writing—review and editing, P.B. and M.G. All authors have read and agreed to the published version of the manuscript.
Funding
This research was funded by Ministère de la Sécurité publique du Québec, grant number CPS 16-17-07 project and by Natural Resources Canada, grant number AP660 V205 28 December 2017.
Institutional Review Board Statement
Not applicable.
Informed Consent Statement
Not applicable.
Data Availability Statement
The list of 411 published scientific case studies included in the database. Four examples of the results (summarized and detailed) are given in different environmental contexts. The CDMIA code will be sent on request.
Acknowledgments
The authors would like to thank Maude Corriveau, Stéphanie Friesinger, and Susan Drejza from the Research Chair in Coastal Geoscience for their contribution to the development of the module. Finally, a special thank you to Danielle Allard for the English revision.
Conflicts of Interest
The authors declare no conflict of interest.
References
- Charlier, R.H.; Chaineux, M.C.P.; Morcos, S. Panorama of the History of Coastal Protection. J. Coast. Res. 2005, 21, 79–111. [Google Scholar] [CrossRef] [Green Version]
- Church, J.A.; White, N.J. Sea-Level Rise from the Late 19th to the Early 21st Century. Surv. Geophys. 2011, 32, 585–602. [Google Scholar] [CrossRef] [Green Version]
- Nicholls, R.J.; Cazenave, A. Sea-Level Rise and Its Impact on Coastal Zones. Science 2010, 328, 1517–1520. [Google Scholar] [CrossRef] [PubMed]
- Ranasinghe, R. Assessing climate change impacts on open sandy coasts: A review. Earth-Sci. Rev. 2016, 160, 320–332. [Google Scholar] [CrossRef] [Green Version]
- Wong, P.P.; Losada, I.J.; Gattuso, J.-P.; Hinkel, J.; Khattabi, A.; McInnes, K.L.; Saito, Y.; Sallenger, A. Coastal Systems and Low-Lying Areas. In Climate Change 2014: Impacts, Adaptation, and Vulnerability. Part A: Global and Sectoral Aspects. Contribution of Working Group II to the Fifth Assessment Report of the Intergovernmental Panel on Climate Change; Cambridge University Press: Cambridge, UK, 2014; pp. 361–409. [Google Scholar]
- Dafforn, K.A.; Glasby, T.M.; Airoldi, L.; Rivero, N.K.; Mayer-Pinto, M.; Johnston, E.L. Marine urbanization: An ecological framework for designing multifunctional artificial structures. Front. Ecol. Environ. 2015, 13, 82–90. [Google Scholar] [CrossRef]
- Manno, G.; Anfuso, G.; Messina, E.; Williams, A.T.; Suffo, M.; Liguori, V. Decadal evolution of coastline armouring along the Mediterranean Andalusia littoral (South of Spain). Ocean Coast. Manag. 2016, 124, 84–99. [Google Scholar] [CrossRef]
- Vousdoukas, M.I.; Ranasinghe, R.; Mentaschi, L.; Plomaritis, T.A.; Athanasiou, P.; Luijendijk, A.; Feyen, L. Sandy coastlines under threat of erosion. Nat. Clim. Chang. 2020, 10, 260–263. [Google Scholar] [CrossRef]
- Dugan, J.E.; Airoldi, L.; Chapman, M.G.; Walker, S.J.; Schlacher, T.A. Estuarine and Coastal Structures: Environmental Effects, A Focus on Shore and Nearshore Structures. In Treatise on Estuarine and Coastal Science; Wolanski, E., McLusky, D.S., Eds.; Elsevier Inc.: Amsterdam, The Netherlands, 2011; Volume 8, pp. 17–41. ISBN 9780080878850. [Google Scholar]
- Gittman, R.K.; Fodrie, F.J.; Popowich, A.M.; Keller, D.A.; Bruno, J.F.; Currin, C.A.; Peterson, C.H.; Piehler, M.F. Engineering away our natural defenses: An analysis of shoreline hardening in the US. Front. Ecol. Environ. 2015, 13, 301–307. [Google Scholar] [CrossRef]
- Horstman, E.M.; Wijnberg, K.M.; Smale, A.J.; Hulscher, S.J.M.H. On the consequences of a long-term perspective for coastal management. Ocean Coast. Manag. 2009, 52, 593–611. [Google Scholar] [CrossRef]
- Sauvé, P.; Bernatchez, P.; Glaus, M. The role of the decision-making process on shoreline armoring: A case study in Quebec, Canada. Ocean Coast. Manag. 2020, 198, 105358. [Google Scholar] [CrossRef]
- Baquerizo, A.; Losada, M.A. Human interaction with large scale coastal morphological evolution. An assessment of the uncertainty. Coast. Eng. 2008, 55, 569–580. [Google Scholar] [CrossRef]
- Polasky, S.; Carpenter, S.R.; Folke, C.; Keeler, B. Decision-making under great uncertainty: Environmental management in an era of global change. Trends Ecol. Evol. 2011, 26, 398–404. [Google Scholar] [CrossRef] [PubMed]
- Moschella, P.S.; Abbiati, M.; Åberg, P.; Airoldi, L.; Anderson, J.M.; Bacchiocchi, F.; Bulleri, F.; Dinesen, G.E.; Frost, M.; Gacia, E.; et al. Low-crested coastal defence structures as artificial habitats for marine life: Using ecological criteria in design. Coast. Eng. 2005, 52, 1073–1087. [Google Scholar] [CrossRef]
- Martin, D.; Bertasi, F.; Colangelo, M.A.; de Vries, M.B.; Frost, M.; Hawkins, S.J.; Macpherson, E.; Moschella, P.S.; Satta, M.P.; Thompson, R.C.; et al. Ecological impact of coastal defence structures on sediment and mobile fauna: Evaluating and forecasting consequences of unavoidable modifications of native habitats. Coast. Eng. 2005, 52, 1027–1051. [Google Scholar] [CrossRef] [Green Version]
- Bernatchez, P.; Fraser, C.; Lefaivre, D.; Dugas, S. Integrating anthropogenic factors, geomorphological indicators and local knowledge in the analysis of coastal flooding and erosion hazards. Ocean Coast. Manag. 2011, 54, 621–632. [Google Scholar] [CrossRef]
- Airoldi, L.; Abbiati, M.; Beck, M.W.; Hawkins, S.J.; Jonsson, P.R.; Martin, D.; Moschella, P.S.; Sundelöf, A.; Thompson, R.C.; Åberg, P. An ecological perspective on the deployment and design of low-crested and other hard coastal defence structures. Coast. Eng. 2005, 52, 1073–1087. [Google Scholar] [CrossRef] [Green Version]
- Marie, G.; Bernatchez, P.; Fraser, C.; Touchette, M.; Papageorges, S.; Coulombe, D.; Arsenault, E.; Friesinger, S.; Sauvé, P.; Lapointe-St-Pierre, M. L’adaptation aux Aléas Côtiers Dans un Contexte de Changements Climatiques: Portrait des Besoins Exprimés et des Outils Proposés à L’échelle des MRC de l’Est du Québec; LDGIZC, UQAR: Rimouski, QC, Canada, 2017. [Google Scholar]
- Fraser, C.; Bernatchez, P.; Dugas, S. Development of a GIS coastal land-use planning tool for coastal erosion adaptation based on the exposure of buildings and infrastructure to coastal erosion, Québec, Canada. Geomat. Nat. Hazards Risk 2017, 8, 1103–1125. [Google Scholar] [CrossRef]
- Betzold, C.; Mohamed, I. Seawalls as a response to coastal erosion and flooding: A case study from Grande Comore, Comoros (West Indian Ocean). Reg. Environ. Chang. 2017, 17, 1077–1087. [Google Scholar] [CrossRef]
- Bruun, P. Rationalities of coastal erosion and protection: An example from Hilton Head Island, South Carolina. J. Coast. Res. 1988, 4, 129–138. [Google Scholar]
- Huang, J.; Ells, K. Risk Here vs. Risk There: Intention to Seek Information About Gulf Coastal Erosion. Environ. Commun. 2020, 15, 386–400. [Google Scholar] [CrossRef]
- Barzehkar, M.; Parnell, K.E.; Soomere, T.; Dragovich, D.; Engström, J. Decision support tools, systems and indices for sustainable coastal planning and management: A review. Ocean Coast. Manag. 2021, 212, 105813. [Google Scholar] [CrossRef]
- USACE. Coastal Engineering Manual; U.S. Army Corps of Engineers: Washington, DC, USA, 2006.
- Sauvé, P.; Moisset, S.; Bernatchez, P.; Glaus, M.; Goudreault, M.-O. Case studies on coastal defence measures: A meta-analysis of literature to ultimately improve decision-making. Ocean. Coast. Manag. 2022; submitted. [Google Scholar]
- Kraus, N.C. The Effects of Seawalls on the Beach: An Extended Literature Review. J. Coast. Res. 1988, 1–28. Available online: https://www.jstor.org/stable/25735349 (accessed on 25 February 2022).
- Griggs, G.B.; Fulton-Bennett, K. Rip rap revetments and seawalls and their effectiveness along the Central California Coast. Shore Beach 1988, 56, 3–11. [Google Scholar]
- CIRIA; CUR; CETMEF. The Rock Manual. The Use of Rock in Hydraulic Engineering, 2nd ed.; CIRIA: London, U.K, 2007. [Google Scholar]
- Kraus, N.C.; McDougal, W.G. The effects of seawalls on the beach: Part I, an updated literature review. J. Coast. Res. 1996, 12, 691–701. [Google Scholar]
- Burcharth, H.F.; Steven, A.H. Types and functions of coastal structures. Coast. Eng. Man. 2003, 6, VI-2. [Google Scholar]
- Chasten, M.A.; Rosati, J.D.; McCormick, J.W.; Randall, R.E. Engineering Design Guidance for Detached Breakwaters as Shoreline Stabilization Structures; U.S. Army Corps of Engineers: Washington, DC, USA, 1993.
- Van Rijn, L.C. Coastal erosion and control. Ocean Coast. Manag. 2011, 867–887. [Google Scholar] [CrossRef]
- Nordstrom, K.F. Living with shore protection structures: A review. Estuar. Coast. Shelf Sci. 2014, 150, 11–23. [Google Scholar] [CrossRef]
- Dally, W.R.; Pope, J. Detached Breakwaters for Shore Protection; U.S. Army Corps of Engineers: Washington, DC, USA, 1986.
- USACE Types and Functions of Coastal Structures. In Coastal Engineering Manual; Elsevier: Amsterdam, The Netherlands, 2006.
- Bertasi, F.; Colangelo, M.A.; Abbiati, M.; Ceccherelli, V.U. Effects of an artificial protection structure on the sandy shore macrofaunal community: The special case of Lido di Dante (Northern Adriatic Sea). Hydrobiologia 2007, 586, 277–290. [Google Scholar] [CrossRef]
- Jackson, N.L.; Harley, M.D.; Armaroli, C.; Nordstrom, K.F. Beach morphologies induced by breakwaters with different orientations. Geomorphology 2015, 239, 48–57. [Google Scholar] [CrossRef]
- Balsillie, J.H.; Berg, D.W. State of Groin Design and Effectiveness. Coast. Eng. Proc. 1972, 1367–1383. [Google Scholar]
- Kraus, N.C.; Hanson, H.; Blomgren, S.H. Modern Functional Design of Groin Systems. Coast. Eng. Proc. 1994, 96, 1327–1342. [Google Scholar] [CrossRef]
- Rankin, K.L.; Herrington, T.O.; Bruno, M.S.; Burke, P.B.; Pence, A.M.; Rankin, K.L.; Herrington, T.O.; Bruno, M.S.; Burke, P.B.; Pence, A.M. Cross-shore Distribution of Alongshore Currents and Sediment Fluxes in the Vicinity of Notched Groins. J. Coast. Res. 2004, 33, 255–268. [Google Scholar]
- Trampeneau, T.; Oumeraci, H.; Dette, H.H. Hydraulic functioning of permeable pile groins. J. Coast. Res. 2004, 33, 160–187. [Google Scholar] [CrossRef] [Green Version]
- Basco, D.R.; Pope, J. Groin Functional Design Guidance from the Coastal Engineering Manual. J. Coast. Res. 2004, 121–130. Available online: https://www.jstor.org/stable/25736249 (accessed on 25 February 2022).
- Campbell, T.; Benedet, L. Beach nourishment magnitudes and trends in the U.S. J. Coast. Res. 2006, 2006, 57–64. [Google Scholar]
- Hamm, L.; Capobianco, M.; Dette, H.H.; Lechuga, A.; Spanhoff, R.; Stive, M.J.F. A summary of European experience with shore nourishment. Coast. Eng. 2002, 47, 237–264. [Google Scholar] [CrossRef]
- Hanson, H.; Brampton, A.; Capobianco, M.; Dette, H.H.; Hamm, L.; Laustrup, C.; Lechuga, A.; Spanhoff, R. Beach nourishment projects, practices, and objectives—A European overview. Coast. Eng. 2002, 47, 81–111. [Google Scholar] [CrossRef]
- Dean, R.G. Beach Nourishment: Theory and Practice; World Scientific Publishing Company: Singapore, 2002; Volume 18, ISBN 9813103302. [Google Scholar]
- Li, B.; Sherman, D.J. Aerodynamics and morphodynamics of sand fences: A review. Aeolian Res. 2015, 17, 33–48. [Google Scholar] [CrossRef]
- Khalil, S.M. The Use of Sand Fences in Barrier Island Restoration: Experience on the Louisiana Coast; U.S. Army Corps of Engineers: Washington, DC, USA, 2008. [Google Scholar]
- Gouguet, L. Guide de Gestion des Dunes et Des Plages Associées. 2018. Available online: https://www.onf.fr/onf/+/21f::guide-de-gestion-des-dunes-et-des-plages-associees.html (accessed on 25 February 2022).
- Grafals-Soto, R.; Nordstrom, K. Sand fences in the coastal zone: Intended and unintended effects. Environ. Manag. 2009, 44, 420–429. [Google Scholar] [CrossRef]
- Bouma, T.J.; van Belzen, J.; Balke, T.; Zhu, Z.; Airoldi, L.; Blight, A.J.; Davies, A.J.; Galvan, C.; Hawkins, S.J.; Hoggart, S.P.G.; et al. Identifying knowledge gaps hampering application of intertidal habitats in coastal protection: Opportunities & steps to take. Coast. Eng. 2014, 87, 147–157. [Google Scholar] [CrossRef]
- Ciavola, P.; Vicinanza, D.; Aristodemo, F.; Contestabile, P. Large-scale morphodynamic experiments on a beach drainage system. J. Hydraul. Res. 2011, 49, 523–528. [Google Scholar] [CrossRef]
- Bird, E. Coastal Geomorphology: An Introduction, 2nd ed.; Wiley: Hoboken, NJ, USA, 2008; ISBN 9780470517291. [Google Scholar]
- Davidson-Arnott, R. Introduction to Coastal Processes and Geomorphology, 1st ed.; Cambridge University Press: Cambridge, UK, 2010; ISBN 0521874459. [Google Scholar]
- Davis, R.A.; Fitzgerald, D.M. Beaches and Coasts, 2nd ed.; Wiley: Hoboken, NJ, USA, 2020. [Google Scholar]
- Friedman, G.M.; Sanders, J.E. Principles of Sedimentology; Wiley: New York, NY, USA, 1978. [Google Scholar]
- Davies, J.L. Geographical Variation in Coastal Development; Longman: New York, NY, USA, 1964. [Google Scholar]
- Levoy, F.; Anthony, E.J.; Monfort, O.; Larsonneur, C. The morphodynamics of megatidal beaches in Normandy, France. Mar. Geol. 2000, 171, 39–59. [Google Scholar] [CrossRef]
- Aminti, P.; Cammelli, C.; Cappietti, L.; Jackson, N.L.; Nordstrom, K.F.; Pranzini, E. Evaluation of beach response to submerged groin construction at Marina di Ronchi, Italy, using field data and a numerical simulation model. J. Coast. Res. 2004, 214, 99–120. [Google Scholar] [CrossRef]
- Wang, P.; Kraus, N.C. Movable-bed model investigation of groin notching. J. Coast. Res. 2004, 33, 342–367. [Google Scholar]
- Barnard, P.L.; Erikson, L.H.; Hansen, J.E. Monitoring and Modeling Shoreline Response Due to Shoreface Nourishment on a High-Energy Coast. J. Coast. Res. 2009, 2009, 29–33. [Google Scholar]
- Turner, I.L.; Leyden, V.M.; Cox, R.J.; Jackson, L.A.; McGrath, J.E. Physical model study of the Gold Coast artificial reef. J. Coast. Res. 2001, 29, 131–146. [Google Scholar]
- Cáceres, I.; Sánchez-Arcilla, A.; Zanuttigh, B.; Lamberti, A.; Franco, L. Wave overtopping and induced currents at emergent low crested structures. Coast. Eng. 2005, 52, 931–947. [Google Scholar] [CrossRef]
- Vaselli, S.; Bulleri, F.; Benedetti-Cecchi, L. Hard coastal-defence structures as habitats for native and exotic rocky-bottom species. Mar. Environ. Res. 2008, 66, 395–403. [Google Scholar] [CrossRef] [Green Version]
- Martinelli, L.; Zanuttigh, B.; Clementi, E.; Guerrero, M.; Lamberti, A. Experimental analysis and 2DH numerical simulations of morphodynamics around Low-Crested Structures. In Proceedings of the ICCE 2004, Lisbon, Portugal, 19–24 September 2004; p. 14. [Google Scholar]
- Bernatchez, P.; Fraser, C. Evolution of Coastal Defence Structures and Consequences for Beach Width Trends, Québec, Canada. J. Coast. Res. 2012, 28, 1550–1566. [Google Scholar] [CrossRef]
- Heerhartz, S.M.; Dethier, M.N.; Toft, J.D.; Cordell, J.R.; Ogston, A.S. Effects of Shoreline Armoring on Beach Wrack Subsidies to the Nearshore Ecotone in an Estuarine Fjord. Estuaries Coasts 2014, 37, 1256–1268. [Google Scholar] [CrossRef]
- Lamberti, A.; Mancinelli, A. Italian Experience on Submerged Barriers as Beach Defence Structures. Coast. Eng. Proc. 1996, 2352–2365. [Google Scholar] [CrossRef]
- Walling, E.; Vaneeckhaute, C. Developing successful environmental decision support systems: Challenges and best practices. J. Environ. Manag. 2020, 264, 110513. [Google Scholar] [CrossRef] [PubMed]
- Wong-Parodi, G.; Mach, K.J.; Jagannathan, K.; Sjostrom, K.D. Insights for developing effective decision support tools for environmental sustainability. Curr. Opin. Environ. Sustain. 2020, 42, 52–59. [Google Scholar] [CrossRef]
- Gamper, C.D.; Turcanu, C. On the governmental use of multi-criteria analysis. Ecol. Econ. 2007, 62, 298–307. [Google Scholar] [CrossRef]
- Westmacott, S. Developing decision support systems for integrated coastal management in the tropics: Is the ICM decision-making environment too complex for the development of a useable and useful DSS? J. Environ. Manag. 2001, 62, 55–74. [Google Scholar] [CrossRef]
- McIntosh, B.S.; Ascough, J.C.; Twery, M.; Chew, J.; Elmahdi, A.; Haase, D.; Harou, J.J.; Hepting, D.; Cuddy, S.; Jakeman, A.J.; et al. Environmental decision support systems (EDSS) development-Challenges and best practices. Environ. Model. Softw. 2011, 26, 1389–1402. [Google Scholar] [CrossRef]
- Saaty, T.L. Decision making with the analytic hierarchy process. Int. J. Serv. Sci. 2008, 1, 83–98. [Google Scholar] [CrossRef] [Green Version]
- Kamphuis, J.W. Introduction to Coastal Engineering and Management; World Scientific: Singapore, 2000; Volume 16, ISBN 9811208018. [Google Scholar]
- Folke, C.; Hahn, T.; Olsson, P.; Norberg, J. Adaptive Governance of Social-Ecological Systems. Annu. Rev. Environ. Resour. 2005, 30, 441–473. [Google Scholar] [CrossRef] [Green Version]
- Pahl-Wostl, C. A conceptual framework for analysing adaptive capacity and multi-level learning processes in resource governance regimes. Glob. Environ. Chang. 2009, 19, 354–365. [Google Scholar] [CrossRef]
- Guénette, C.; Marie, G.; Bernatchez, P.; Paul-Hus, C.; Ricard, M.; Fraser, C.; Touchette, M. L’adaptation aux Aléas Côtiers dans un Contexte de Changements Climatiques: Portrait des Besoins Exprimés et des Outils Proposés à l’échelle des MRC de l’Estuaire Moyen du St-Laurent; LDGIZC, UQAR: Rimouski, QC, Canada, 2019. [Google Scholar]
- Friesinger, S.; Bernatchez, P. Perceptions of Gulf of St. Lawrence coastal communities confronting environmental change: Hazards and adaptation, Québec, Canada. Ocean Coast. Manag. 2010, 53, 669–678. [Google Scholar] [CrossRef]
- Jones, R.N.; Patwardhan, A.; Cohen, S.J.; Kumar, P.; Barros, R.; Dokken, D.J.; Mach, K.J.; Bilir, T.; Chatterjee, M.; Ebi, K.L.; et al. Foundations for Decision Making. In Climate Change 2014: Impacts, Adaptation, and Vulnerability. Part A: Global and Sectoral Aspects. Contribution of Working Group II to the Fifth Assessment Report of the Intergovernmental Panel on Climate Change; Field, C.B., Barros, V.R., Dokken, D.J., Mach, K.J., Mastrandrea, M.D., Bilir, T.E., Chatterjee, M., Ebi, K.L., Estrada, Y.O., Genova, R.C., et al., Eds.; Cambridge University Press: Cambridge, UK; New York, NY, USA, 2014; pp. 195–228. [Google Scholar]
- Koontz, T.M.; Gupta, D.; Mudliar, P.; Ranjan, P. Adaptive institutions in social-ecological systems governance: A synthesis framework. Environ. Sci. Policy 2015, 53, 139–151. [Google Scholar] [CrossRef]
- André, P.; Delisle, C.E.; Revéret, J.-P. L’évaluation des Impacts sur L’environnement: Processus, Acteurs et Pratique Pour un Développement Durable, 3rd ed.; Presses internationales Polytechnique: Montréal, QC, Canada, 2010; ISBN 2553011326. [Google Scholar]
- Allen, C.R.; Fontaine, J.J.; Pope, K.L.; Garmestani, A.S. Adaptive management for a turbulent future. J. Environ. Manag. 2011, 92, 1339–1345. [Google Scholar] [CrossRef] [PubMed] [Green Version]
- Folke, C. Resilience (Republished). Ecol. Soc. 2016, 21, 44. [Google Scholar] [CrossRef]
- Lebel, L.; Anderies, J.M.; Campbell, B.; Folke, C.; Hatfield-Dodds, S.; Hugues, T.P.; Wilson, J. Governance and the Capacity to Manage Resilience in Regional Social-Ecological Systems. Ecol. Soc. 2006, 11, 1–19. [Google Scholar] [CrossRef] [Green Version]
- Hawkins, E.; Sutton, R. The potential to narrow uncertainty in regional climate predictions. Bull. Am. Meteorol. Soc. 2009, 90, 1095–1107. [Google Scholar] [CrossRef] [Green Version]
- Hawkins, E.; Sutton, R. The potential to narrow uncertainty in projections of regional precipitation change. Clim. Dyn. 2011, 37, 407–418. [Google Scholar] [CrossRef]
- Kirtman, B.; Power, S.B.; Adedoyin, A.J.; Boer, G.J.; Bojariu, R.; Camilloni, I.; Doblas-Reyes, F.; Fiore, A.M.; Kimoto, M.; Meehl, G.; et al. Near-term climate change: Projections and predictability. In Climate Change 2013: The Physical Science Basis. Contribution of Working Group I to the Fifth Assessment Report of the Intergovernmental Panel on Climate Change; Cambridge University Press: Cambridge, UK, 2013; pp. 953–1028. ISBN 9781107415324. [Google Scholar]
- Kroon, A.; de Schipper, M.A.; van Gelder, P.H.A.J.M.; Aarninkhof, S.G.J. Ranking uncertainty: Wave climate variability versus model uncertainty in probabilistic assessment of coastline change. Coast. Eng. 2020, 158, 103673. [Google Scholar] [CrossRef]
- Hyde, K.M.; Maier, H.R.; Colby, C.B. Reliability-Based Approach to Multicriteria Decision Analysis for Water Resources. J. Water Resour. Plan. Manag. 2004, 130, 429–438. [Google Scholar] [CrossRef]
- Moshkovich, H.M.; Schellenberger, R.E.; Olson, D.L. Data influences the result more than preferences: Some lessons from implementation of multiattribute techniques in a real decision task. Decis. Support Syst. 1998, 22, 73–84. [Google Scholar] [CrossRef]
- Kheireldin, K.; Fahmy, H. Multi-criteria approach for evaluating long term water strategies. Water Int. 2001, 26, 527–535. [Google Scholar] [CrossRef]
- Marttunen, M.; Lienert, J.; Belton, V. Structuring problems for Multi-Criteria Decision Analysis in practice: A literature review of method combinations. Eur. J. Oper. Res. 2017, 263, 1–17. [Google Scholar] [CrossRef] [Green Version]
- Mardani, A.; Jusoh, A.; Zavadskas, E.K. Fuzzy multiple criteria decision-making techniques and applications-Two decades review from 1994 to 2014. Expert Syst. Appl. 2015, 42, 4126–4148. [Google Scholar] [CrossRef]
- Barzehkar, M.; Parnell, K.E.; Mobarghaee Dinan, N.; Brodie, G. Decision support tools for wind and solar farm site selection in Isfahan Province, Iran. Clean Technol. Environ. Policy 2021, 23, 1179–1195. [Google Scholar] [CrossRef]

Publisher’s Note: MDPI stays neutral with regard to jurisdictional claims in published maps and institutional affiliations. |
© 2022 by the authors. Licensee MDPI, Basel, Switzerland. This article is an open access article distributed under the terms and conditions of the Creative Commons Attribution (CC BY) license (https://creativecommons.org/licenses/by/4.0/).