Article

Development of Numerical Modelling Techniques for Composite Cylindrical Structures under External Pressure

1
Department of Naval Architecture and Marine Systems Engineering, Pukyong National University, Busan 48513, Korea
2
Department of Marine Design Convergence Engineering, Pukyong National University, Busan 48513, Korea
3
Marine and Arctic Technology, Department of Mechanical Engineering, Aalto University, 00076 Espoo, Finland
4
Department of Marine Environment and Engineering, National Sun Yat-sen University, Kaohsiung 804, Taiwan
*
Author to whom correspondence should be addressed.
J. Mar. Sci. Eng. 2022, 10(4), 466; https://doi.org/10.3390/jmse10040466
Submission received: 22 February 2022 / Revised: 23 March 2022 / Accepted: 23 March 2022 / Published: 25 March 2022
(This article belongs to the Section Ocean Engineering)

Abstract

:
Submarine hulls are pressure vessels for which excellent structural integrity under underwater pressure loads is essential. The use of light-weight materials contributes to reduced fuel consumption, improved speed, and increased payload while strength properties are retained. The focus of this paper is on the collapse behavior of a filament-wound cylindrical structure that serves as the main hull of a submarine subject to hydrostatic pressure loads. This paper presents a computational modelling approach for the prediction of the collapse behavior mechanism using a commercial finite element (FE) solver. The collapse strength obtained from the numerical model corresponded closely to available experimental data. The composite and aluminum material models were compared and the effects of stacking angle and thickness portion in the ply sequence on collapse strength were investigated. The advantages and disadvantages of available design codes (i.e., American Society of Mechanical Engineers (ASME) BPVC-X and National Aeronautics and Space Administration (NASA) SP-8007) were reviewed by direct comparison with numerical results. It is concluded that the application of effective engineering constants for the prediction of the collapse pressure of submarine hulls may be feasible.

1. Introduction

Submarines are important for naval, recreational, and research purposes. A submarine hull is typically composed of a thin-walled cylinder with end closures, and it should be able to carry the hydrostatic compressive loads without buckling. Often, the hull is ring-stiffened and doubled-skinned to prevent flooding in the case of failure of the outer shell. The strength of the hull depends on principal particulars (diameter, length, etc.), and the design should satisfy the structural safety against the pressure at the designed diving depth. Most submarine structures are made of carbon steel, or composite and lightweight materials (e.g., titanium, aluminum, etc.). Composite materials can offer improved structural integrity, lower weight, better space-utilization, and improved fuel consumption, as well as improvements in speed and maneuverability.
Over the years, several studies that focused on composite submarine pressure hulls have been carried out. For example, Graham [1] realized excellent agreement with finite element analysis for displacement, stress, and strain prediction of a thick, overall orthotropic cylinder-type structure. Helal et al. [2] simulated sensitivity and optimization studies of sandwich composite deep submarine pressure hulls using T700 and B(4)5505 Epoxy. Their results revealed that the core thickness played a minor role at extreme depths and the laminated angle had a major effect on the strength. Franco et al. [3] reported that carbon fiber reinforced polymer yields a 60% structural weight savings in submarine pressure hulls. Craven et al. [4] suggested a robust composite pressure hull with a glass and carbon skin and a syntactic foam core with a weight (9t) that is considerably lower than that of steel (20t). Wang [5] demonstrated that pressure hulls made of composite sandwich designs offered at least a 28% weight reduction with respect to the conventional design.
Pressure hulls may be prone to buckling and may fail considerably below their yield strength. Thus, improved understanding of their buckling behavior is essential for safe submarine design and to ensure asset and people safety. Table 1 summarizes recent research papers of relevance to the mechanics of conventional and composite materials hulls. To date, researchers focused on understanding the collapse (or buckling) strength by experiments and numerical studies. As applicable, the majority of these studies assume constant thickness for composite stacking sequences.
The collapse pressure of composite submarine hulls could vary as it depends on material lay-ups. It is therefore significant to identify a suitable ply sequence that can ensure good hull strength. To address the problem, this paper investigates the effect of stacking angle and thickness portion on ply sequences and questions the efficient use of the method of “effective engineering constants” used in the design of submarine hulls [15]. Special focus is attributed to the potential use of collapse pressure predicted by finite element (FE) solvers. Strain-hardening, durability, and fracture strain are not considered. This is because experimental results for composite materials depend on lay-ups and are not readily available.
The remaining part of the paper is structured as follows. Section 2 presents computational methods for the prediction of the collapse pressure and buckling behavior of cylindrical aluminum and composite material models using ANSYS and ANSYS Composite Pre-post (ACP) [16]. Comparisons of buckling characteristics of aluminum and composite material models for a given geometry, weight, and strength are given in Section 3. Section 4 presents a range of FE-based parametric studies by varying the stacking angle and thickness portions of the ply sequences. Section 5 and Section 6 compare ANSYS ACP numerical results against available engineering standards (National Aeronautics and Space Administration (NASA) SP-8007 [17] and American Society of Mechanical Engineers (ASME) BPVC-X [18]). They also discuss the feasibility of using effective engineering constants (obtained from three-dimensional laminate theory and numerical analysis tensile tests) for the prediction of collapse strength. Conclusions and future research directions are presented in Section 7.

2. Computational Method

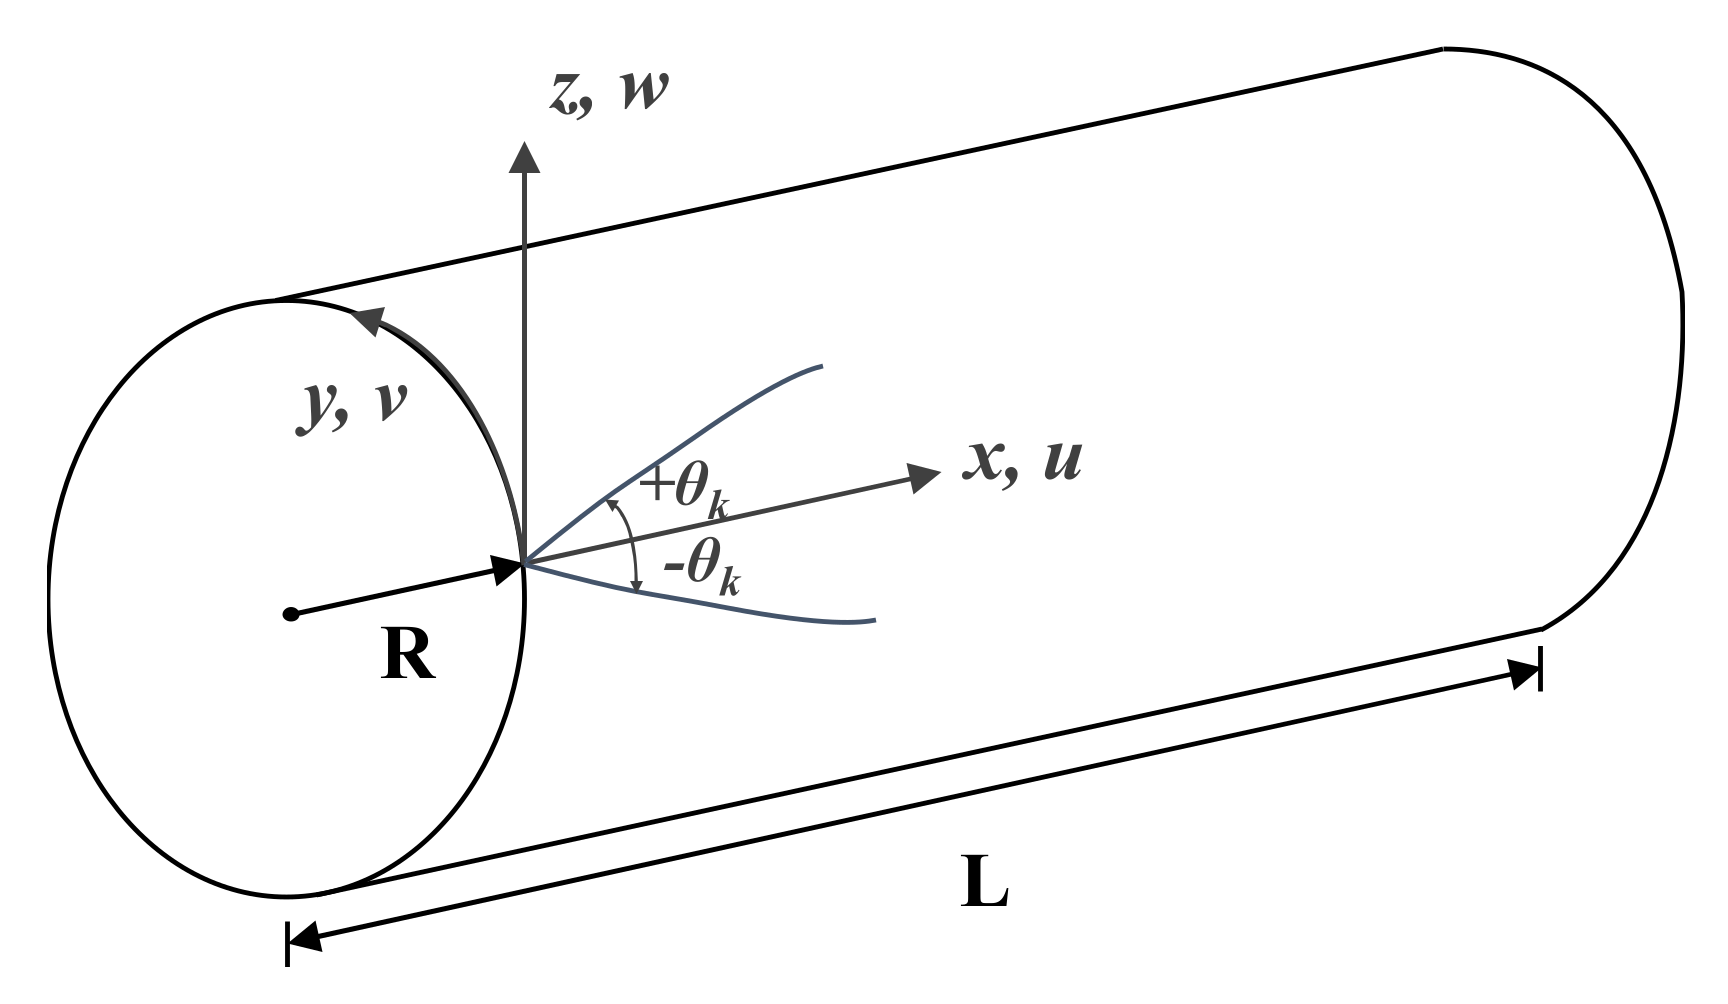
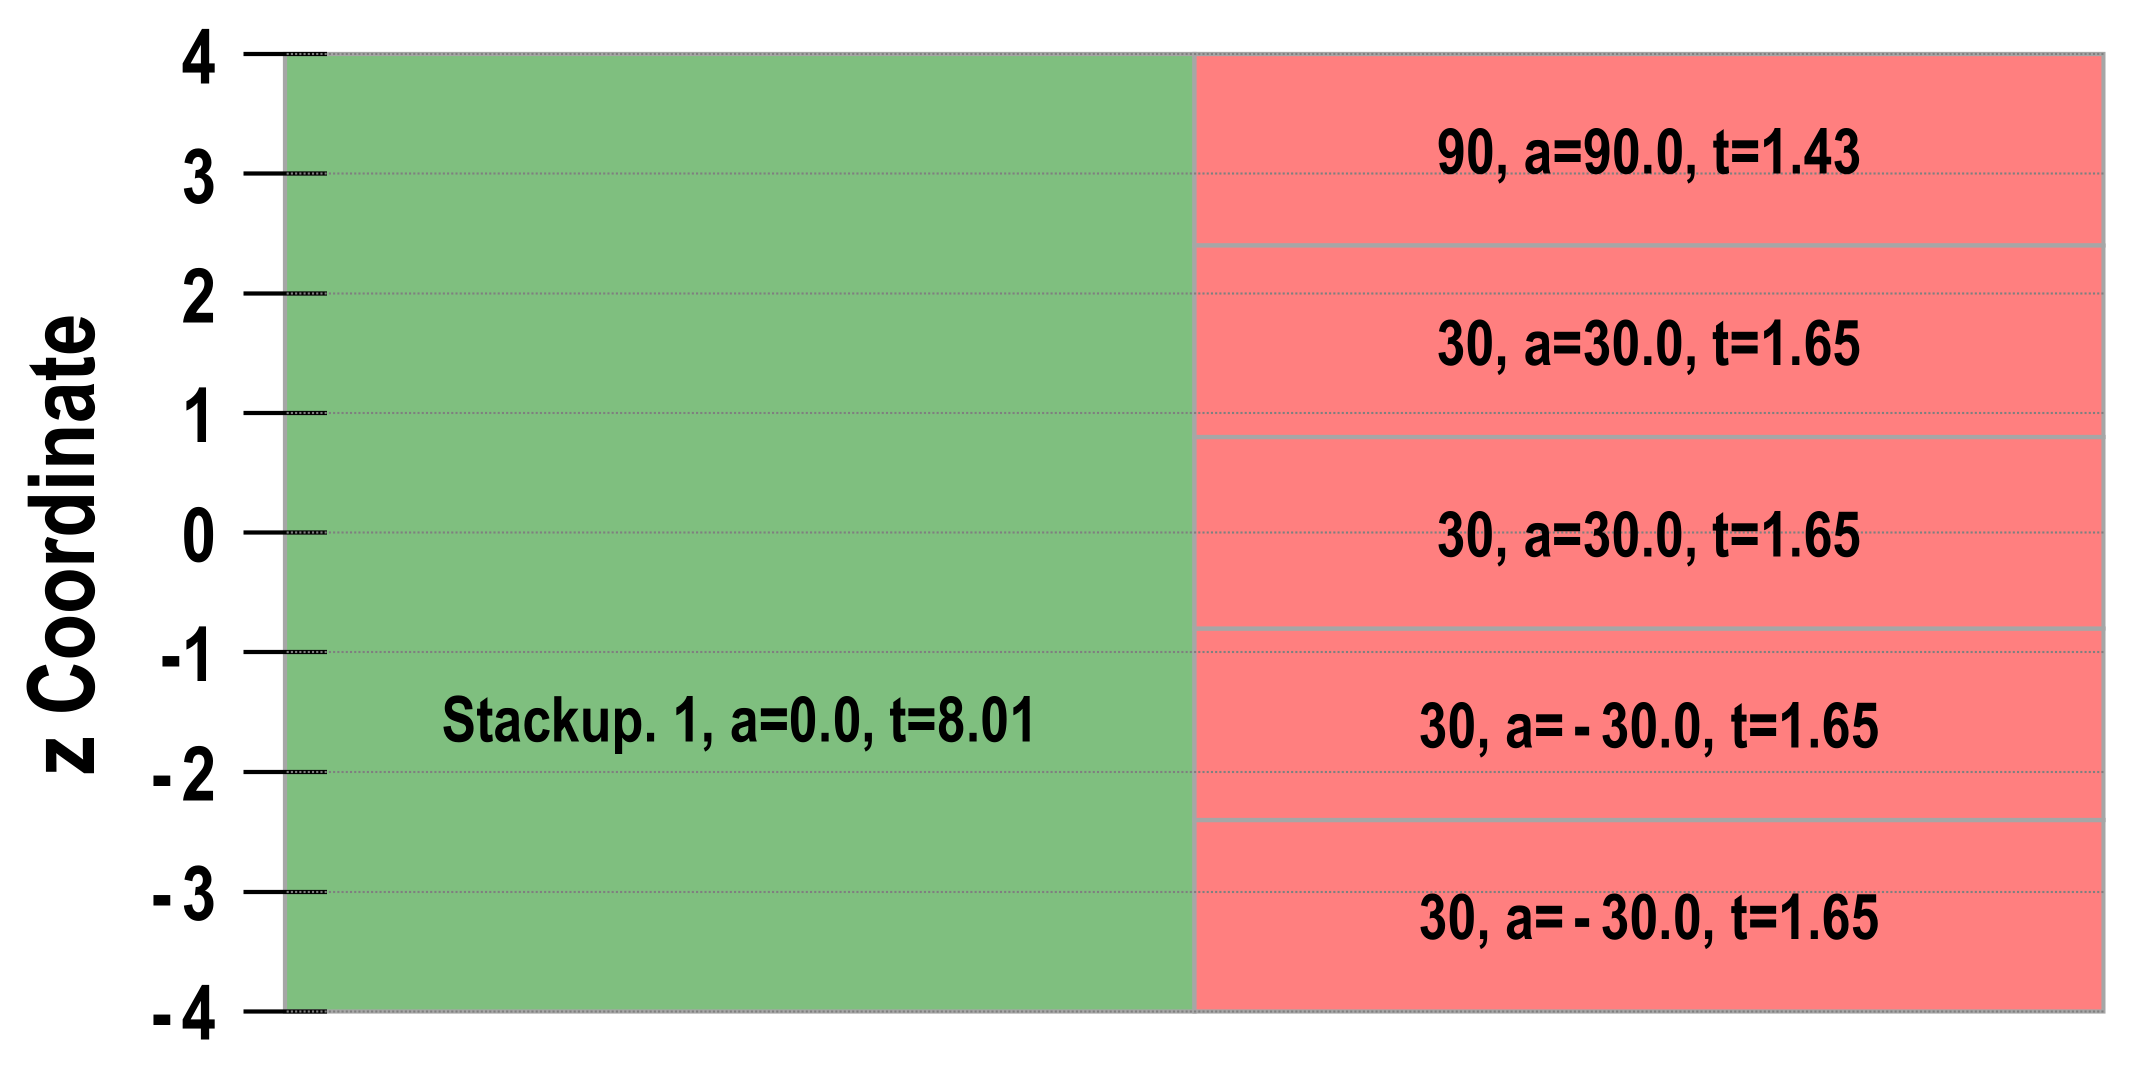
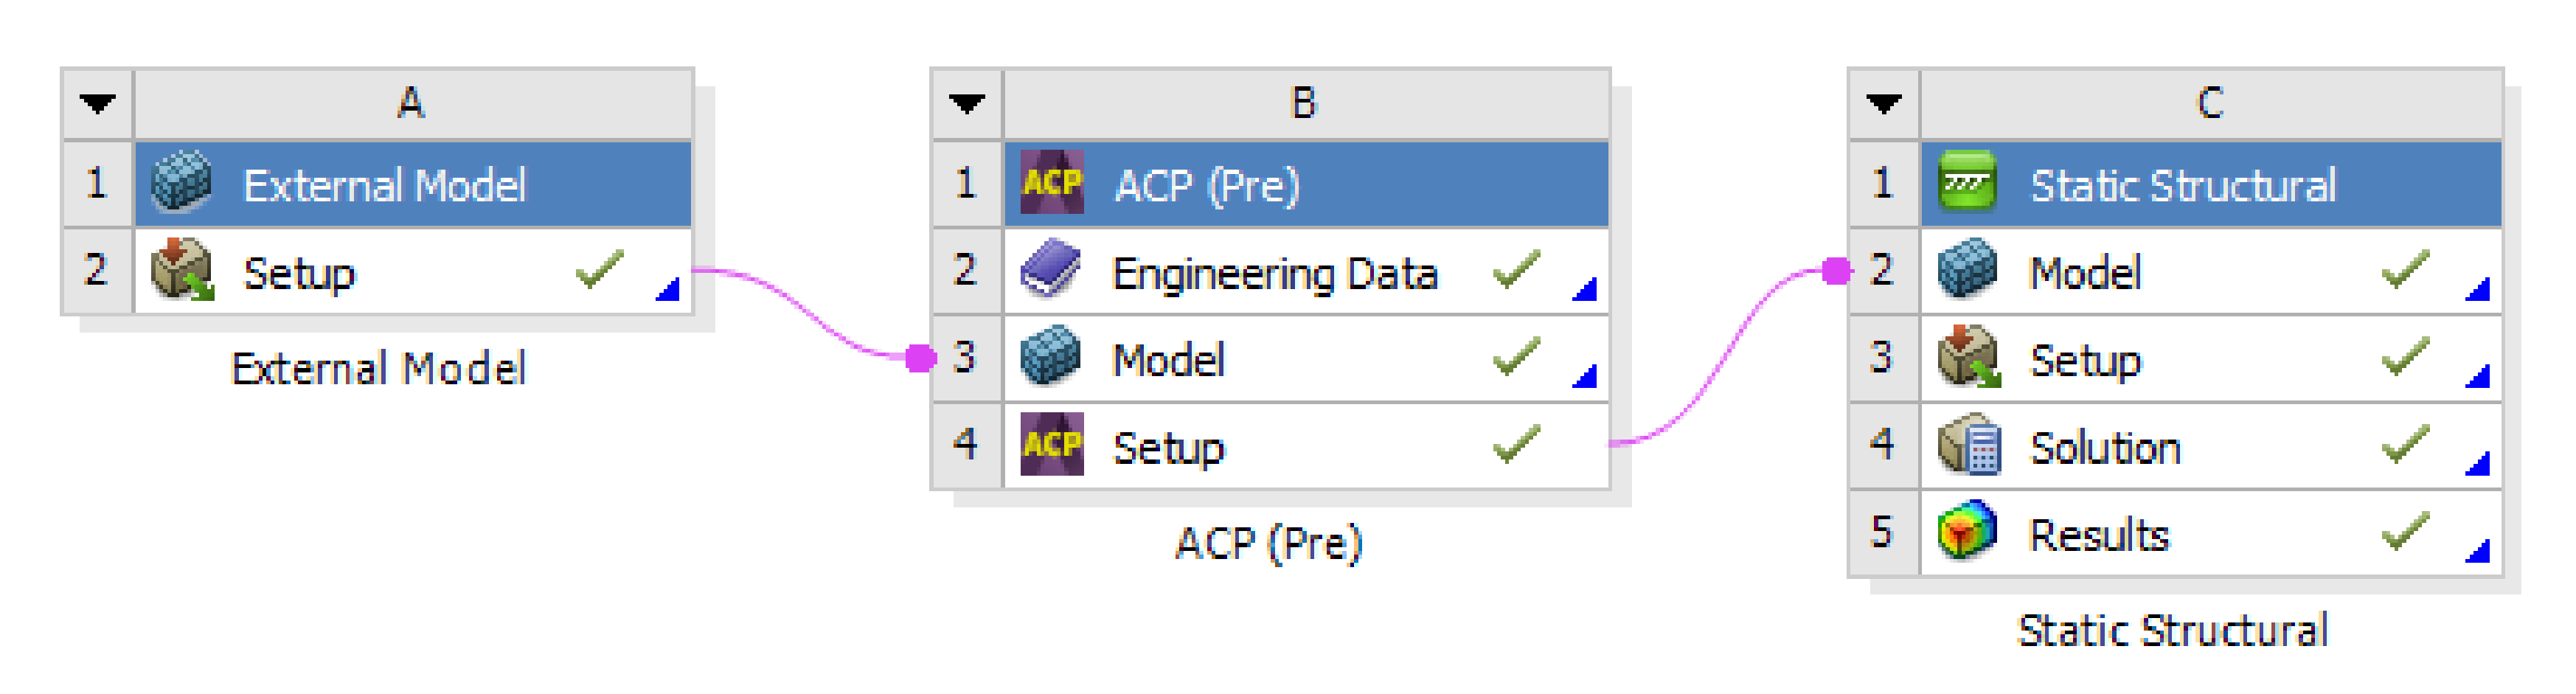
2.1. Numerical Modelling

ANSYS and ANSYS Composite Prep/Post-processors were used to model the layered composite structures presented in this section. Figure 1 shows the procedure followed for the prediction of collapse strength. Material nonlinearity was not considered. Accordingly, ANSYS Composite Post assumptions accounting for through-thickness stress/strain, failure, progressive damage, and interface delamination were not considered.
At pre-processing stage, stacking sequences and ply properties were defined. This composite definition was then transferred to an FE model in which the mesh, load, and boundary conditions were defined. Geometrically non-linear analysis was carried out by the ANSYS mechanical solver with the aim of predicting the shape of initial imperfections. Consequently, a small multiplier was used to initiate the non-linear analysis. The arc-length method was implemented to describe the post-buckling behavior and compute the collapse pressure of the structure.

2.2. Numerical Validation

2.2.1. Aluminum Material

Six test models (see Figure 2) were selected to develop (and validate) the FE modelling techniques used for the prediction of collapse pressure. The geometrical parameters and material properties obtained from tensile tests are summarized in Table 2 [19]. There are based on the work of Muttaqie [19] who examined the collapse pressure and structural failure modes of an aluminium alloy used in a commercial pipe 6061-T6 extruded tube via experimental and numerical methods. The radial and axial gridlines on the outer surface of the test models were used to measure the initial ovality. Initial imperfections were applied to the FE model from available measurement data. Figure 2c shows an example of the FE model for C4B using 4-node shell elements in ANSYS, with an irregular shape resulting from the geometrical measuring values [19]. Since the end plugs were not modelled, the end-plug penetration was represented by applying constrained boundary conditions in six-degrees-of-freedom. An external pressure of 5MPa was applied to the entire cylinder.
Comparisons of the collapse strength values calculated from ANSYS, test, and commercial FE solver ABAQUS [20] data presented by Muttaqie were used in the numerical benchmark (see Figure 3 and Table 3). ANSYS data showed a 5% difference in comparison to experimental data and lower values than ABAQUS for Model C6D. The static solver of the Riks arc length method was utilized to analyze the collapse strength. Numerical deviations appeared because of different sub-steps used by FE solvers during the time integration. In specific, the default number of increments used in ABAQUS simulations was 100. For ANSYS, initially 200 were used and this number was automatically changed from 100 to 500 to achieve convergence. In any case, collapse strength values lie within the acceptable numerical margin.
Six models were used to compare the characteristics of strength and weight between the aluminum and composite materials outlined in Section 3. The deformed shapes associated with the shortest and longest models are shown in Figure 4. Buckling numbers 3 and 2 were obtained for the circumferential buckling wave number.

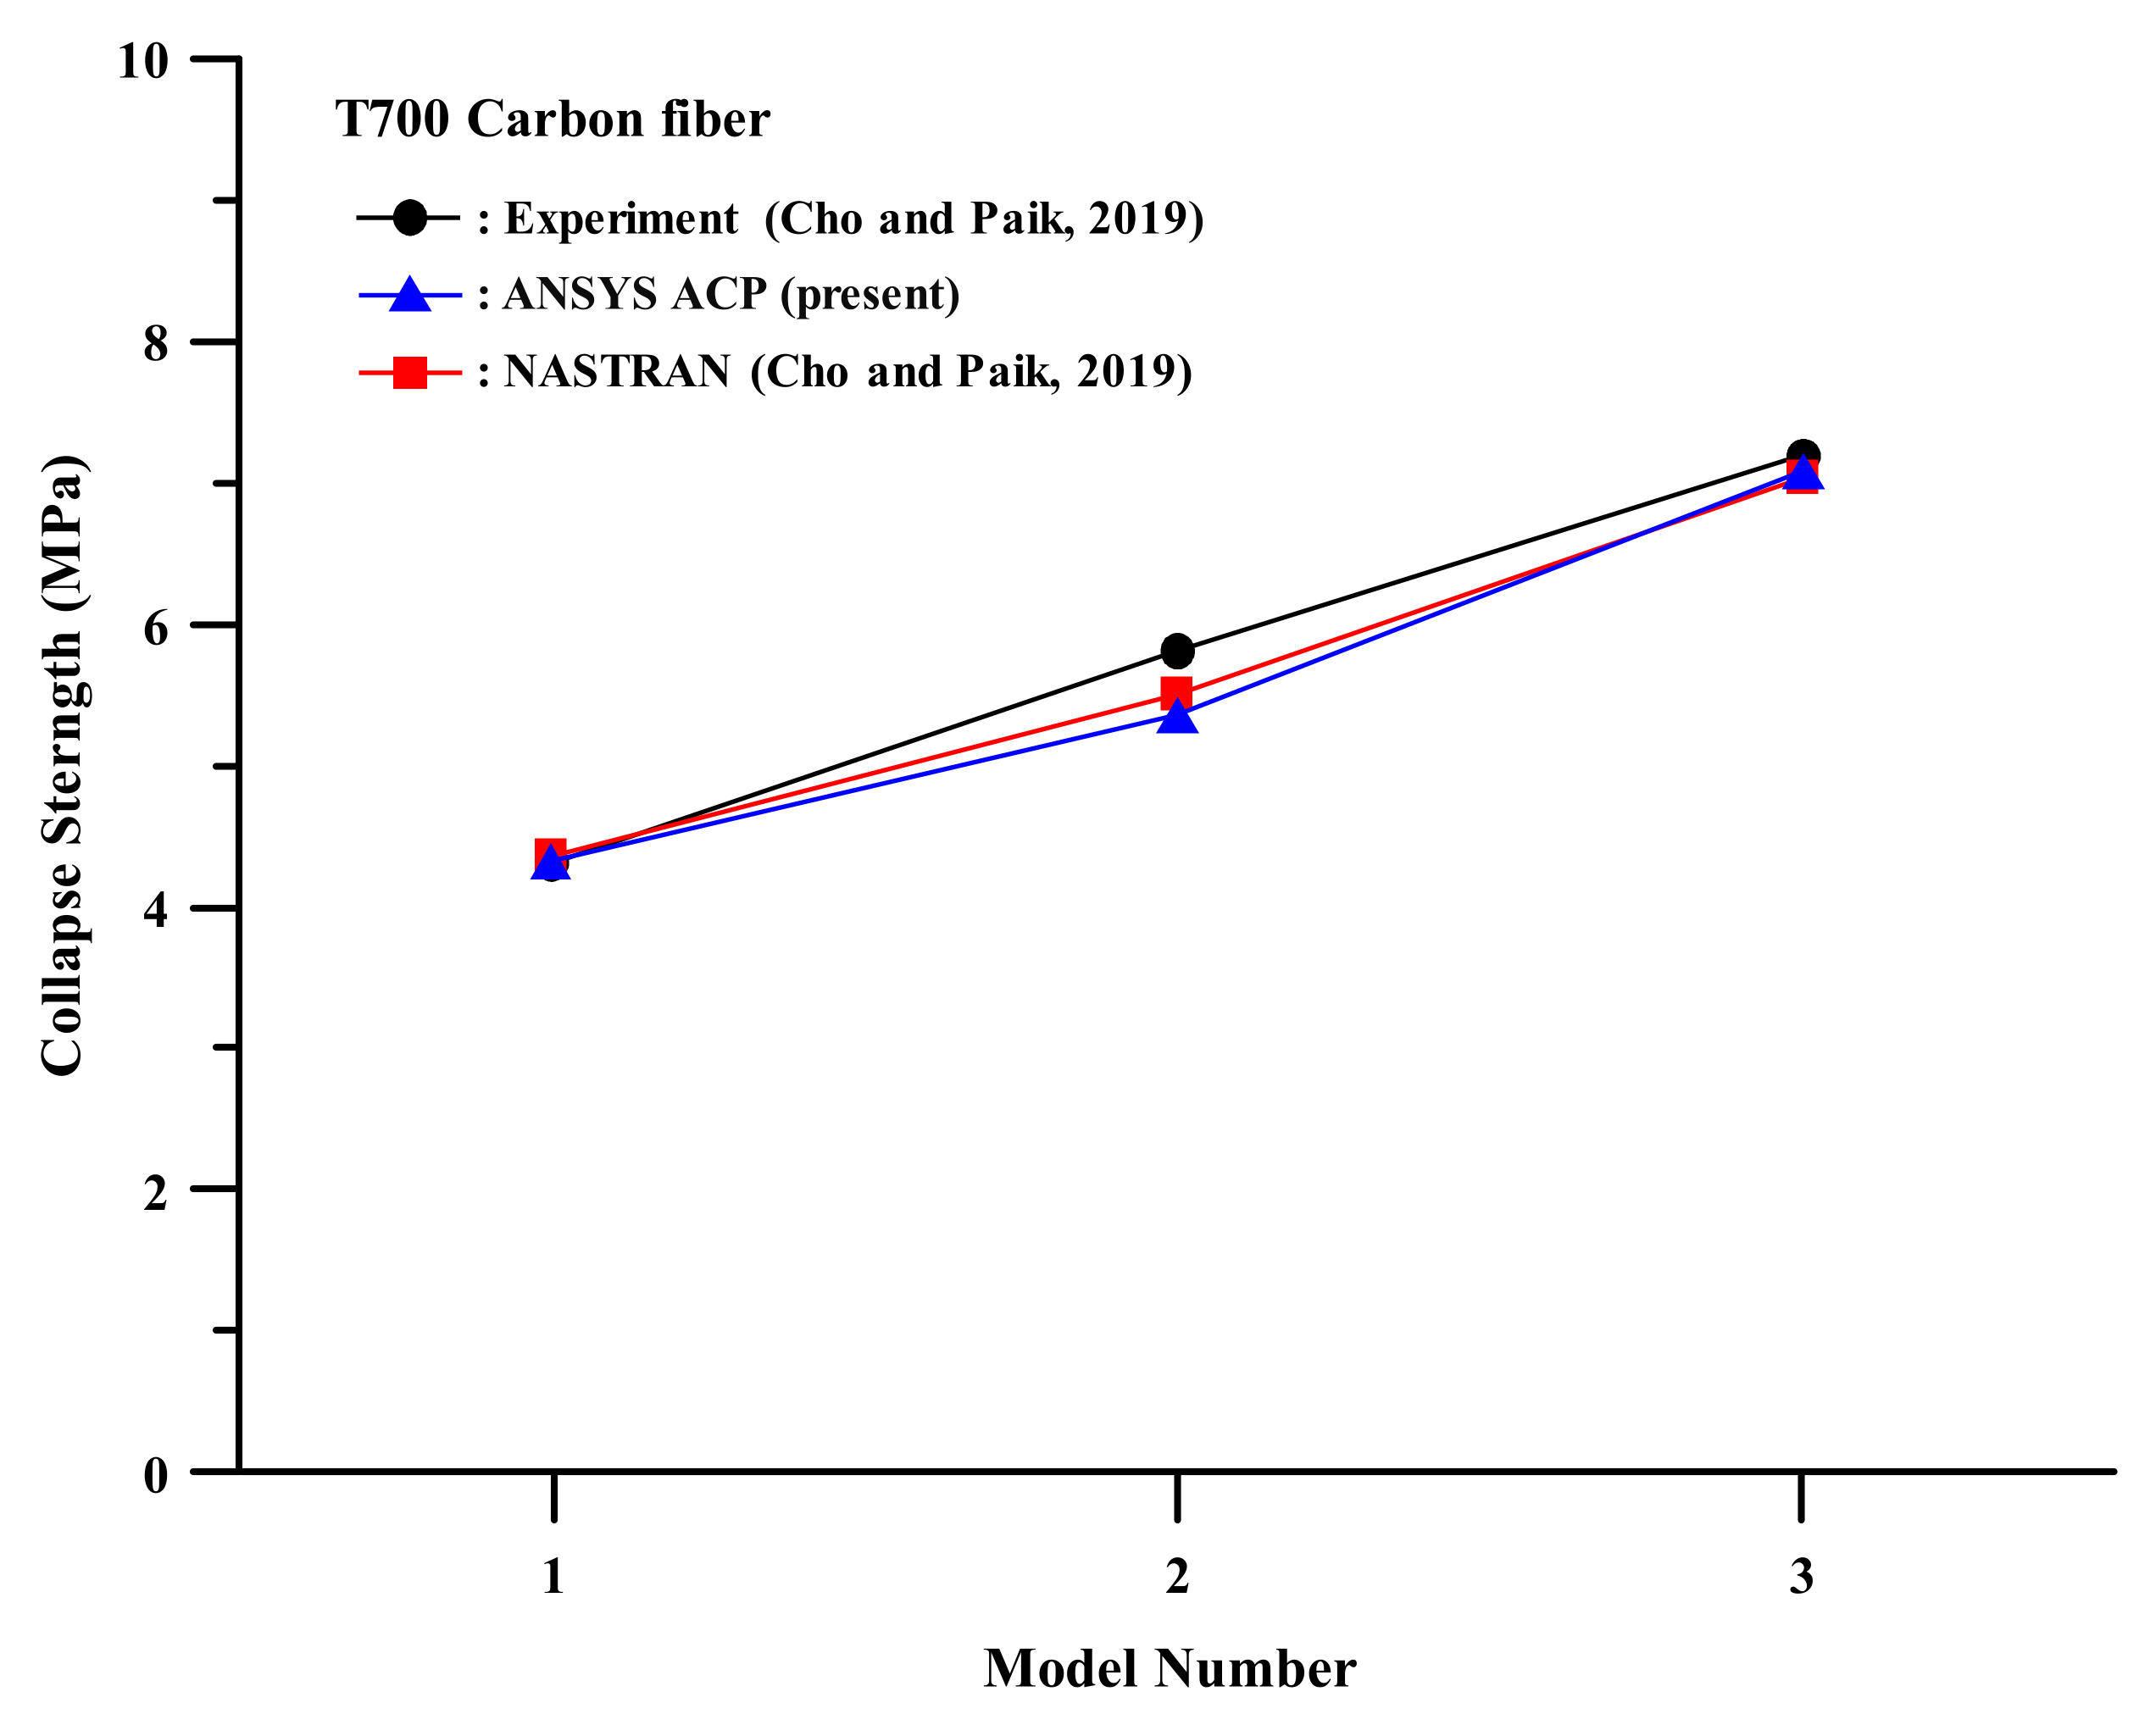
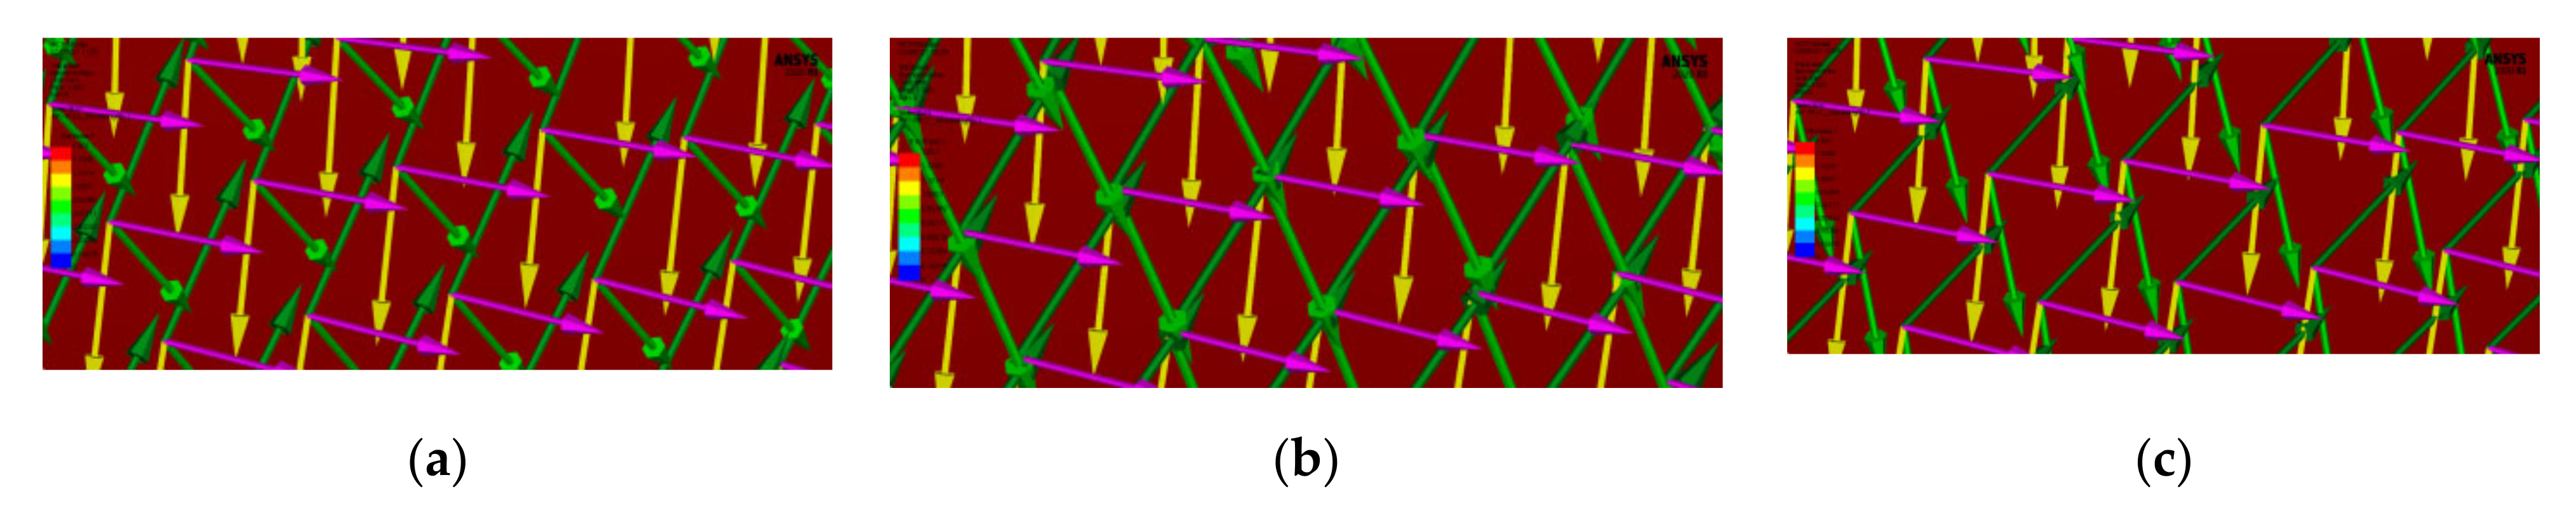
2.2.2. Composite Material

Cho and Paik [14] presented hydrostatic buckling pressures of a filament-wound cylinder. Three 8 mm-thick cylindrical composite tubes with winding angles of [±30/90], [±45/90], and [±60/90] were compared. Figure 5 shows the nomenclature of a cylinder and the direction of the stacking angle (θk). The latter corresponds to the kth layer, which occurs at a certain angle in the longitudinal direction. The dimensions of each model are summarized in Table 4. All layers were assumed to be perfectly bounded and comprised of T700 carbon fibre, which is flexible and reduces the probability of cracking (see Table 5).
ANSYS was used to define the FE model, material properties, linear buckling, and non-linear buckling analysis. Engineering data for orthotropic elasticity were transferred to ANSYS ACP where fabric definitions for the composite material, ply lay-up, thickness, and stacking angle were implemented.
Composite laminates consisted of stacked layers with different fibre orientations in the T700 carbon fibre material. Fabric properties included material type and ply thickness. A rosette was created to set the orientation and material reference (0°) direction of the composite lay-up. After assigning ply properties such as orientation point and direction, ply material, angle, and number of layers, composite plates were created as shown in Figure 6 where a denotes stacking angle, and t represents thickness.
The cylinder composed of 4-node shell elements and was fixed at one end. Uniform pressure was applied to all surfaces including the other end. The collapse strength was determined as the product of the applied load and a time factor that reached a maximum value. Experimental and numerical results are shown in Figure 7 and Table 6. They appear to be in good agreement (difference of less than 8%) [14]. The collapse strength increased with increasing stacking angle. This confirms that appropriate modelling of stacking angles is important in terms of determining the collapse strength.

3. Comparison of Aluminum and Composite Materials

Aluminum (Al) is a lightweight and corrosion-resistant material that reduces fatigue crack growth. Al strength-to-weight ratio exceeds that of steel. This means that a 170 mm thick hull withstands pressures of 52 MPa at a diving depth of 5200 m [21]. Accordingly, the six models described in Section 2.2.1 were used to compare the collapse strength of Al and composite materials with the same geometry, weight, and strength.

3.1. Application Model

The material T700 carbon fibre comprises of three layers with different stacking angles. The thickness of each layer was assumed to be the same to that described in Section 2.2.2. The stacking sequence was defined as ±θ/0. The fibre direction of the layer was in parallel to the longitudinal direction (i.e., set to 0 degrees). Each ply thickness is presented in Table 7. The stacking angle (θ) varied between 15 and 75 degrees in 15-degree intervals. Figure 8 shows the assigned fibre direction for the cases considered. Thirty computations of composite material cylindrical models were conducted using ANSYS and ANSYS ACP with the same loading and boundary conditions described in Section 2.2.1.

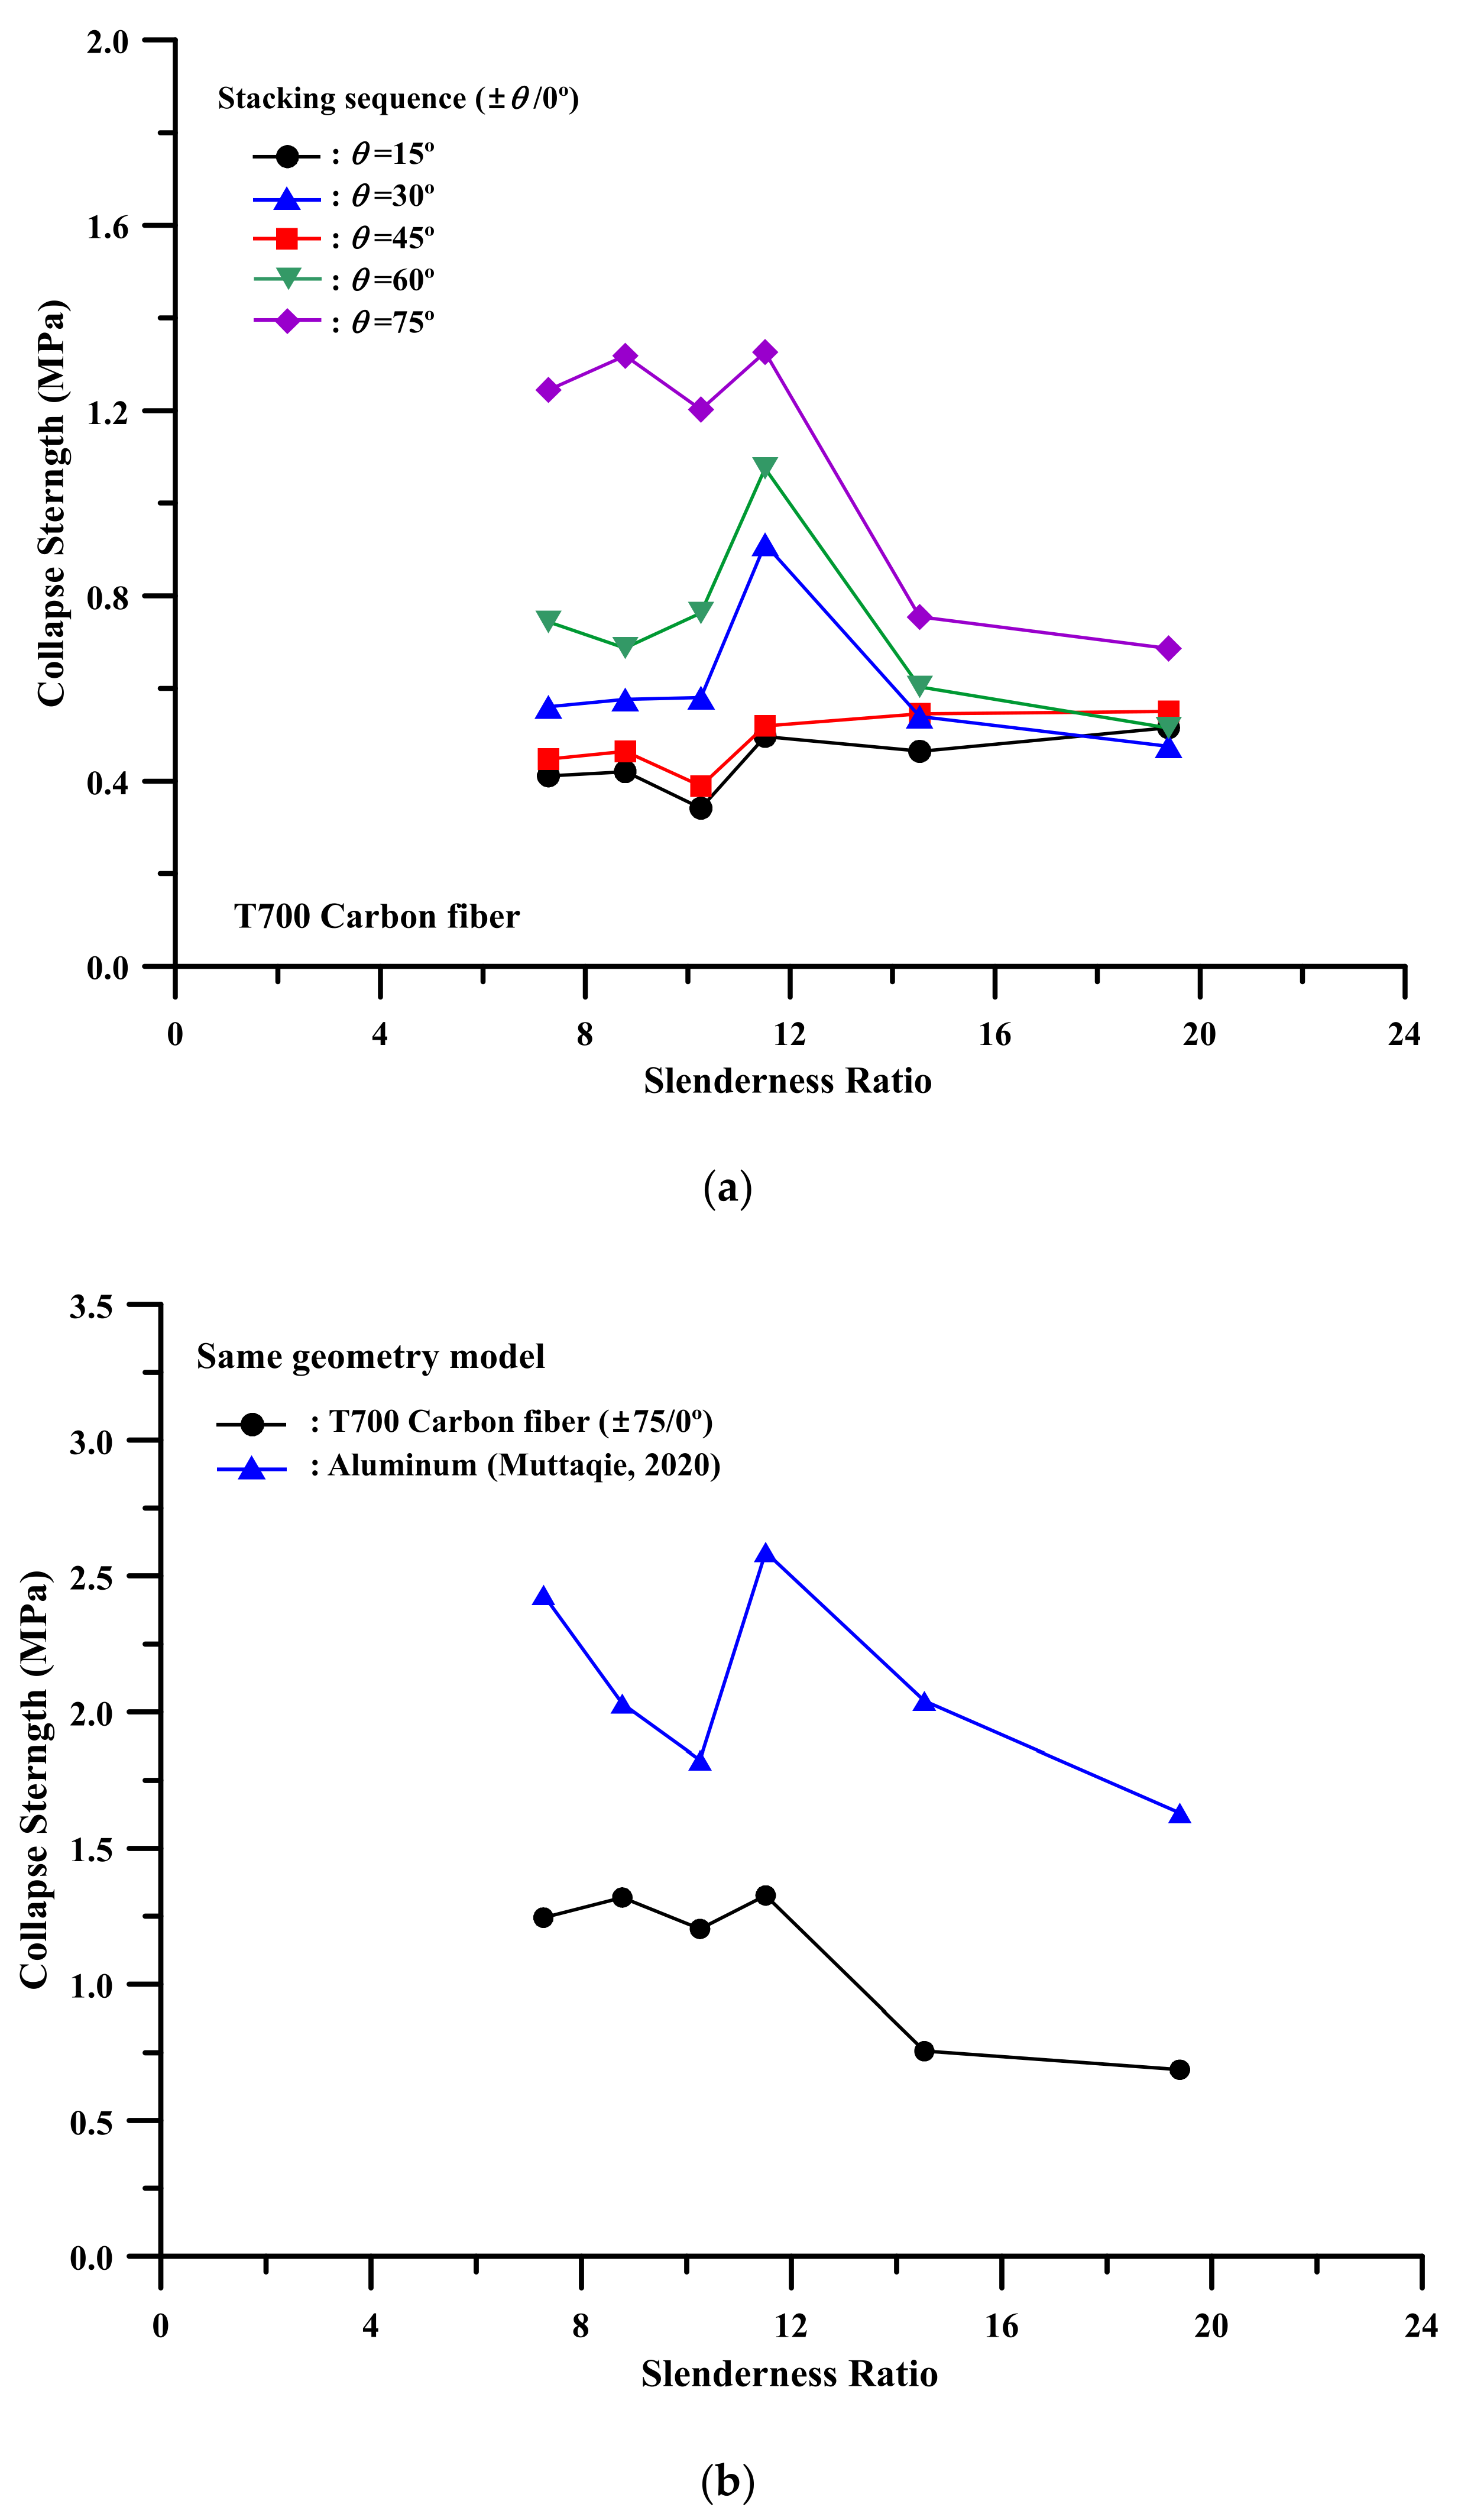
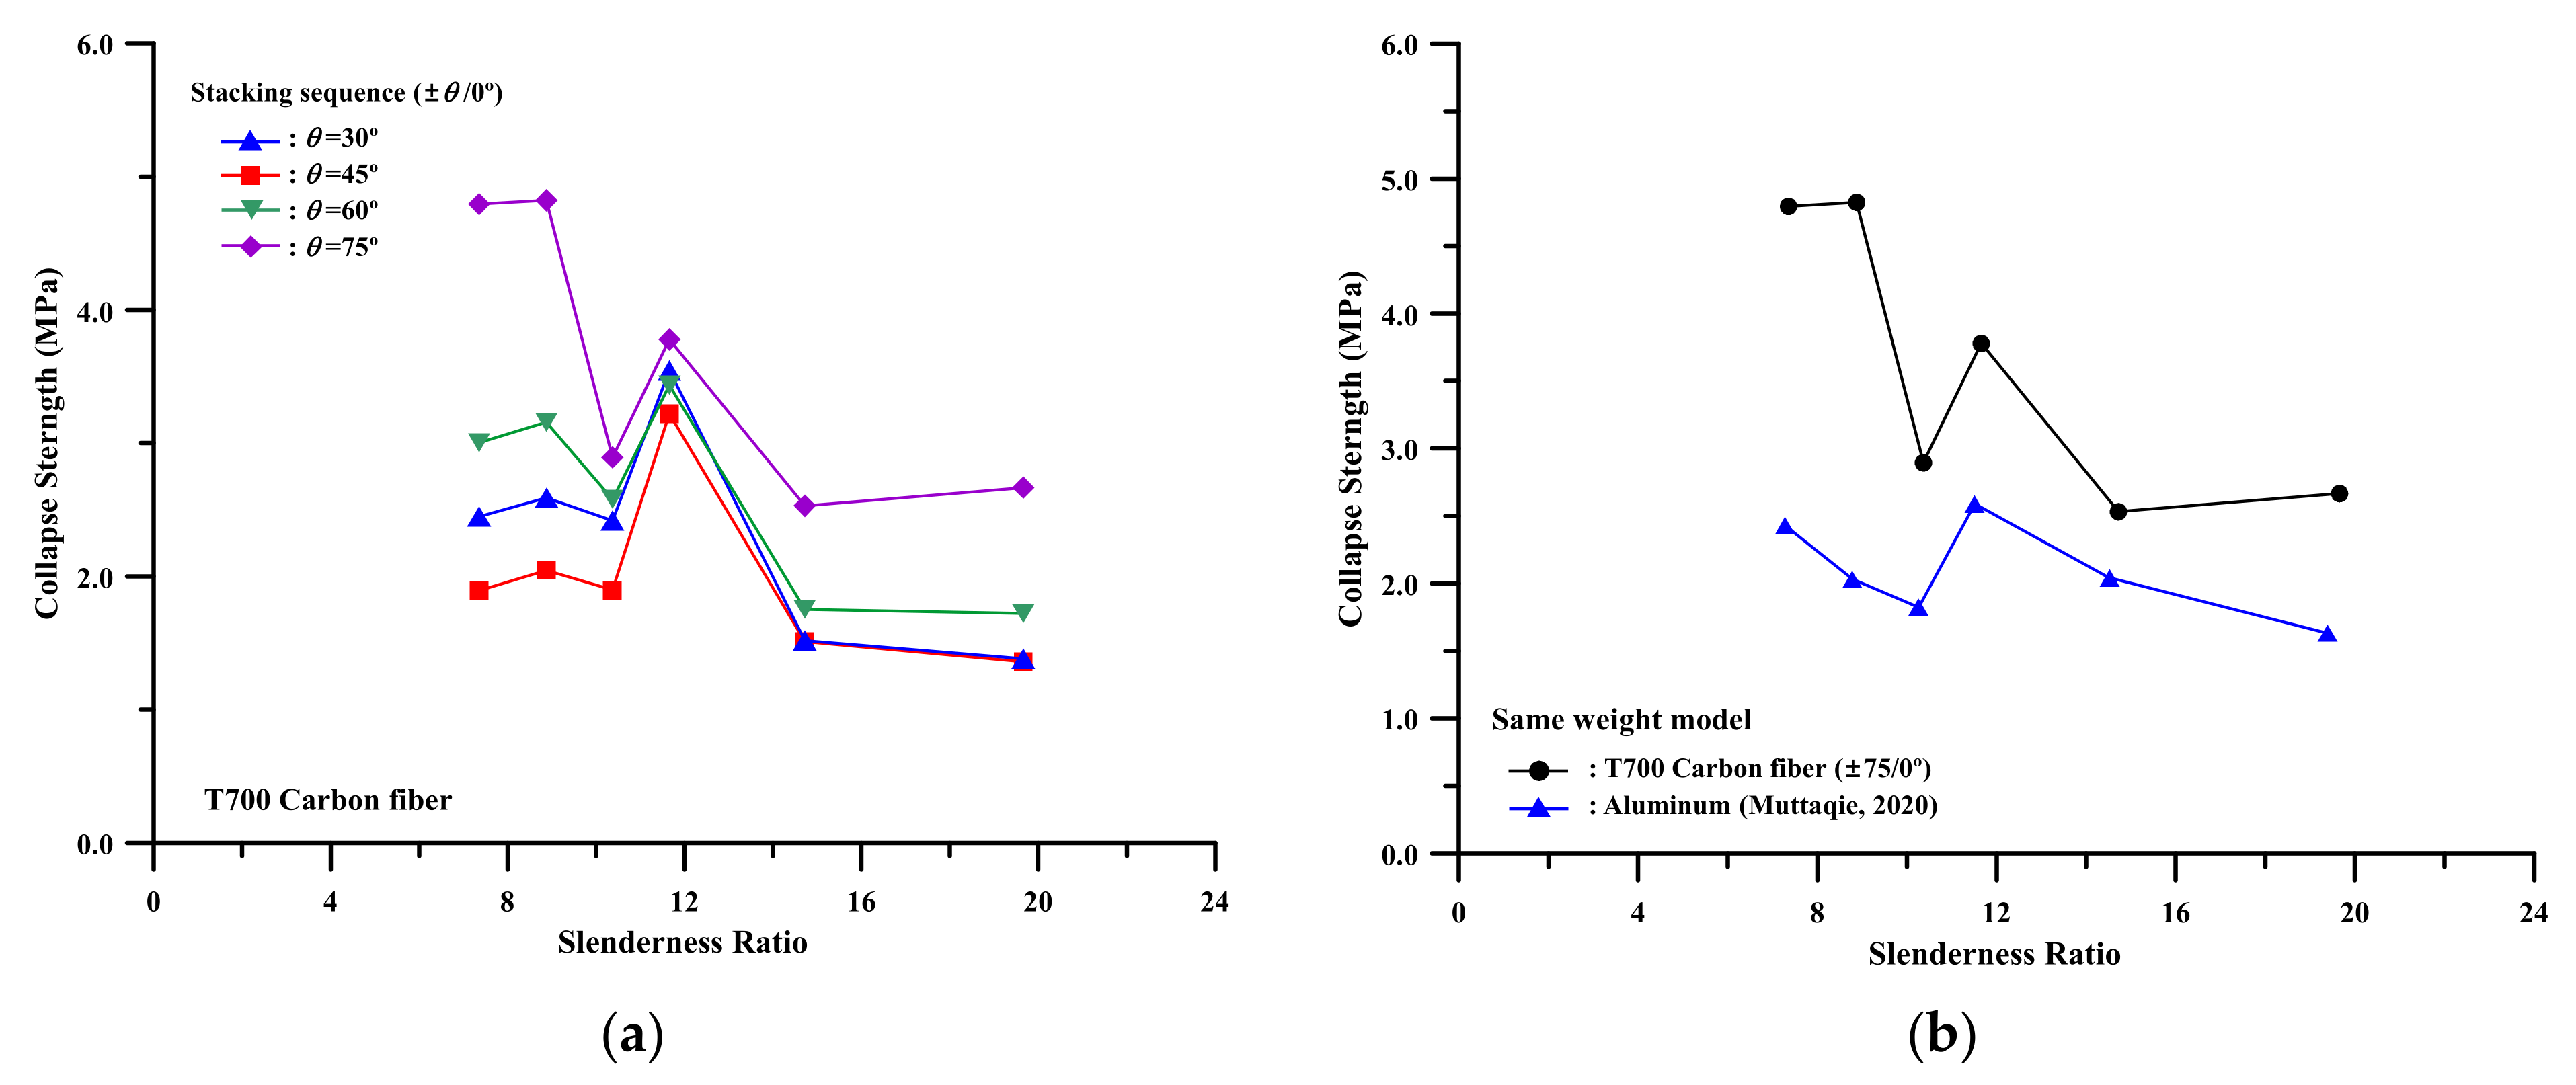
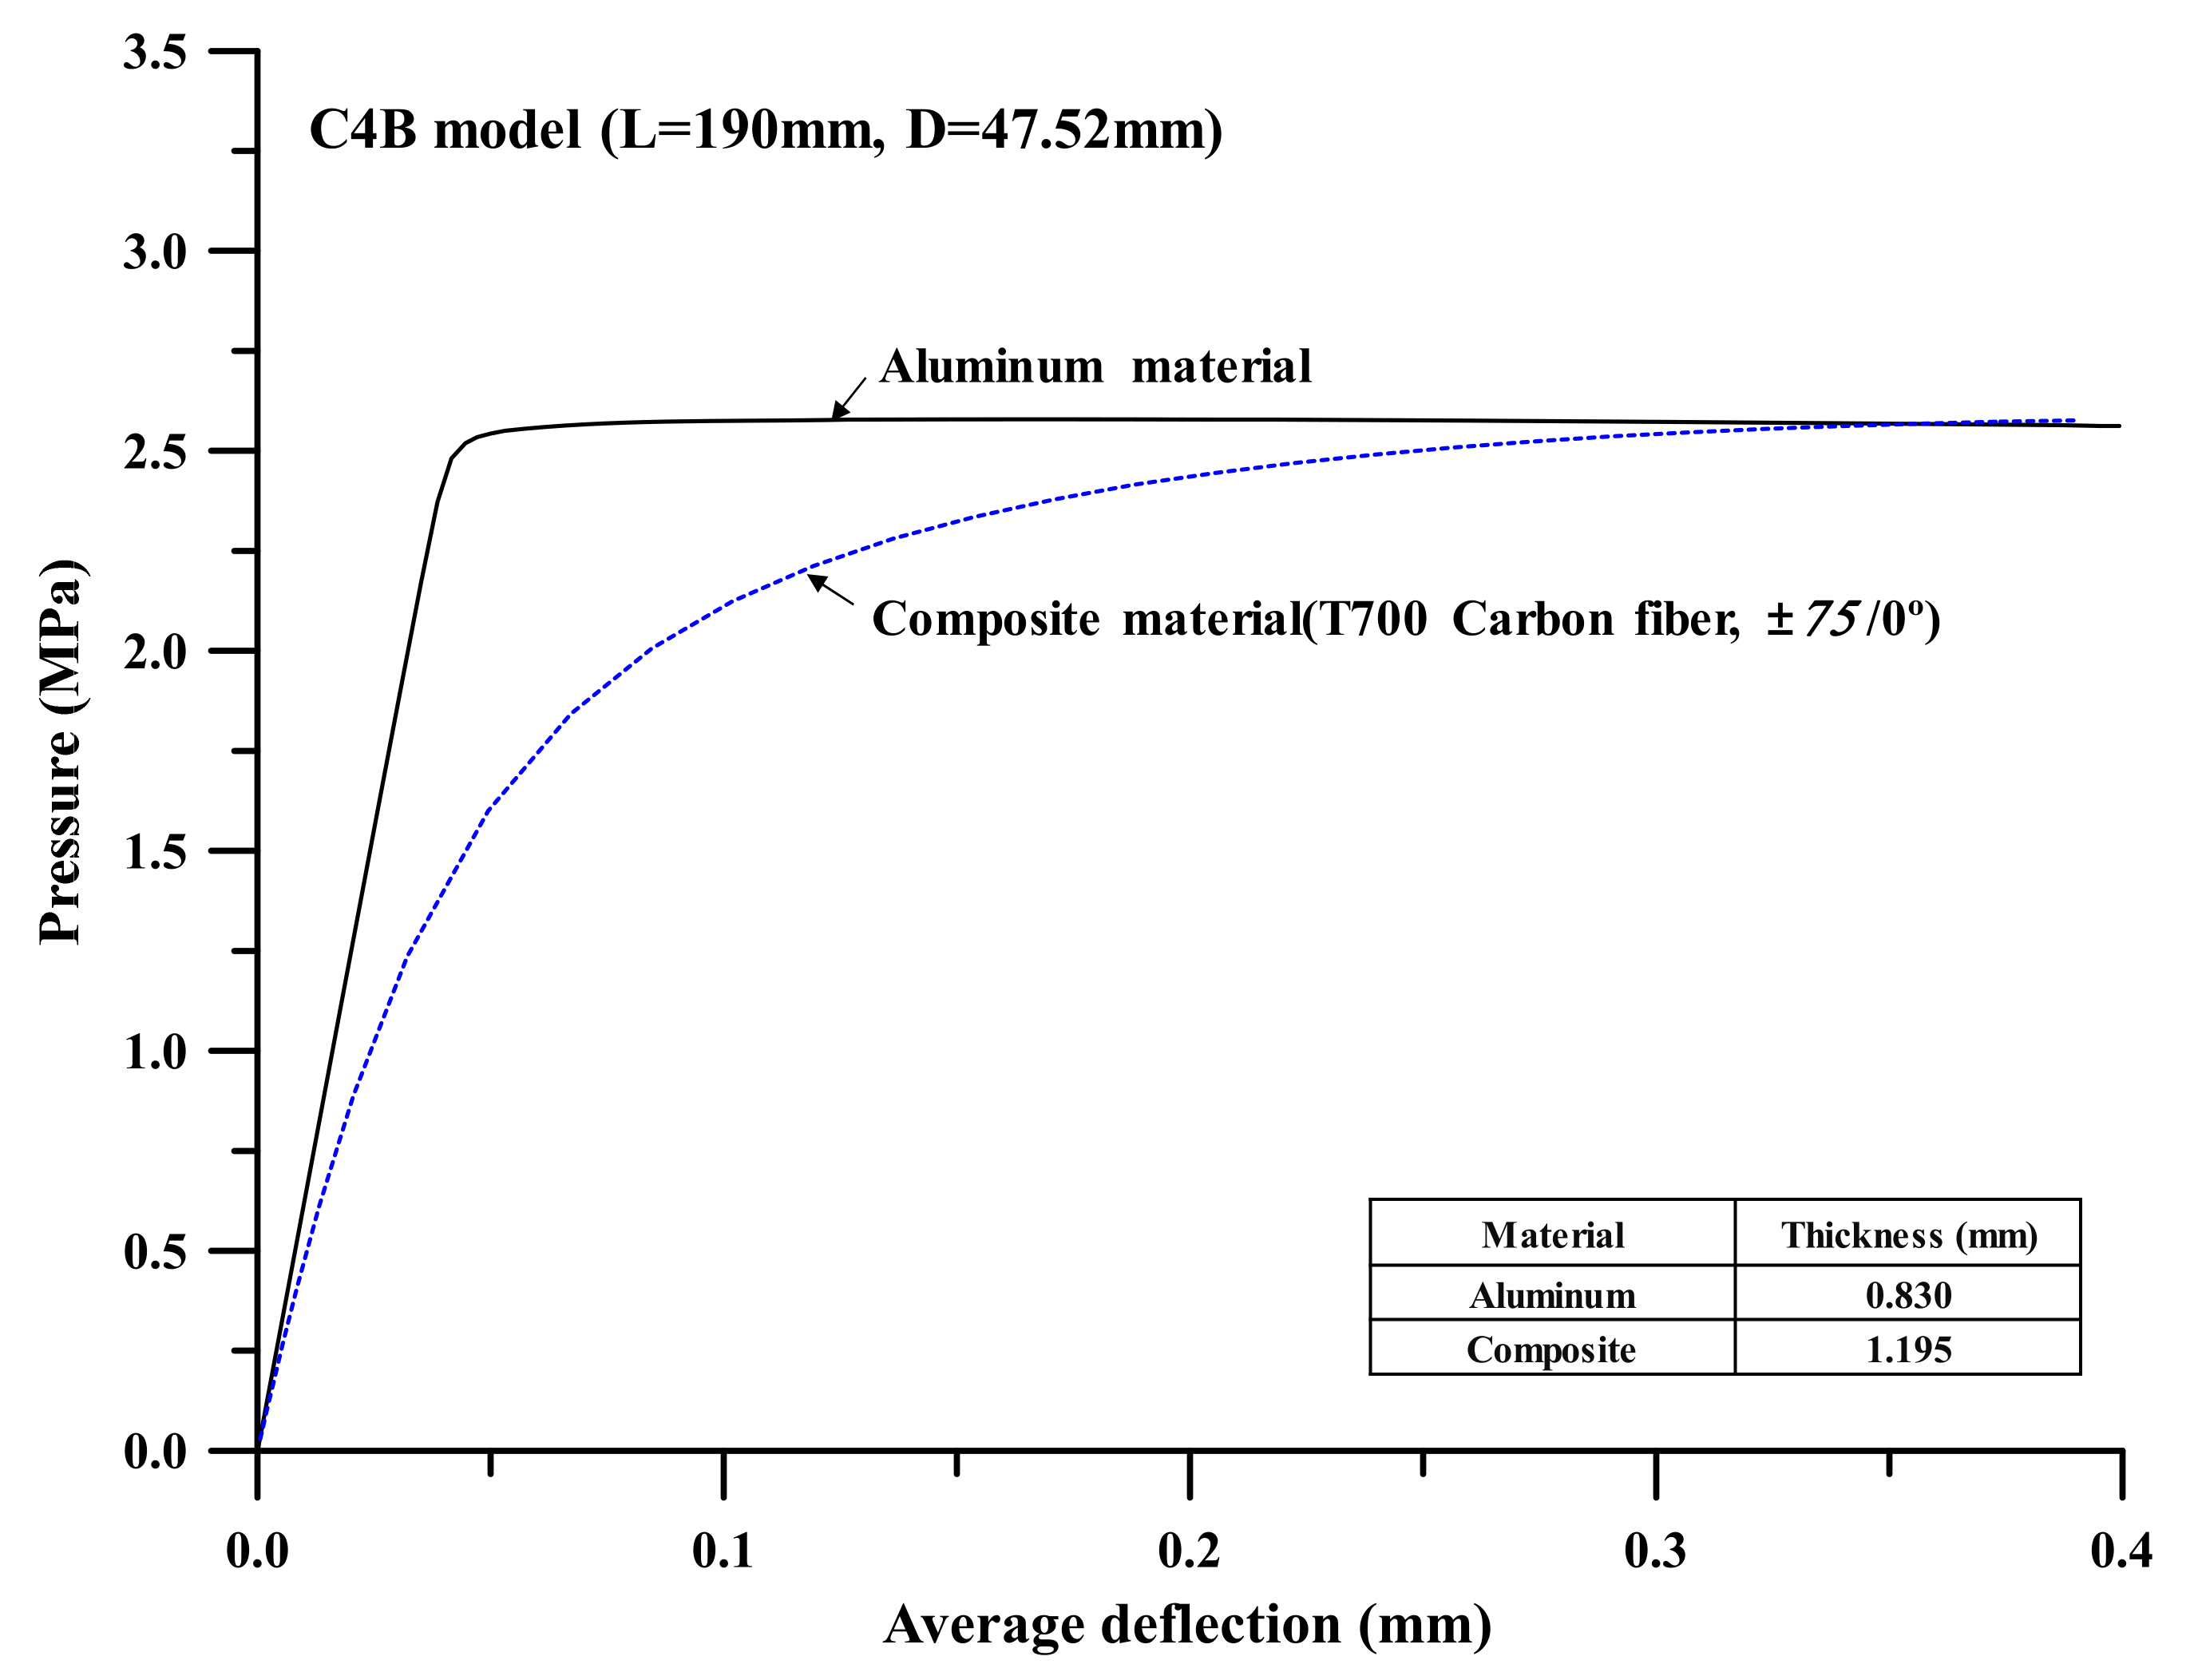
3.2. Results of Comparison

Two hulls of the same dimension and cylindrical structure made of different materials were compared as shown in Table 2. For the composite material model, the collapse strength varied with θ in the stacking sequence (±θ/0); ±75/0 and ±15/0 recorded the highest and lowest strength, respectively, in most of the models. The differences induced by the stacking angle orientation have only a slight effect on the higher slenderness ratio models and varied significantly among the lower slenderness ratio models. All composite material models, regardless of their stacking angle, recorded lower collapse strength values than the aluminum model. Figure 9 presents the results of computations performed for each geometry model.
A given weight model was generated by increasing the total thickness of the composite material model. The same proportion of each ply thickness to the total thickness was used. Figure 10 shows the results of the computations. The collapse strength of all composite material models was superior to the Al model. For a given weight, the cost varied with the manufacturing and material costs.
For a given strength model, a target value with the same strength should be realized by varying the thickness. To address this issue, the stacking angle (θ) was fixed at 75 degrees. This yielded the highest collapse strength. The three example cases considered are demonstrated in Figure 11. Figure 12 presents the pressure-average deflection curve for the Al and composite C4B models. Average deflections were calculated by taking the mean of total deflections at entire nodal points of the FE model under consideration. For Al, the first part of the graph shows a linear increase, and then it starts to flatten. This means that the structure has a short range of elasticity and a wide range of plasticity. In general, the Al displays stiffer behavior than the composite material.
Table 8 summarizes the weight associated with the obtained thickness. The composite models, having the same strength as the Al material model, yielded weight savings of 13–46%. Notwithstanding this, further consideration should be given to lifecycle costs (i.e., cost of pre-fabricated materials, manufacturing and maintenance, inspection and repair, recycling and disposal).

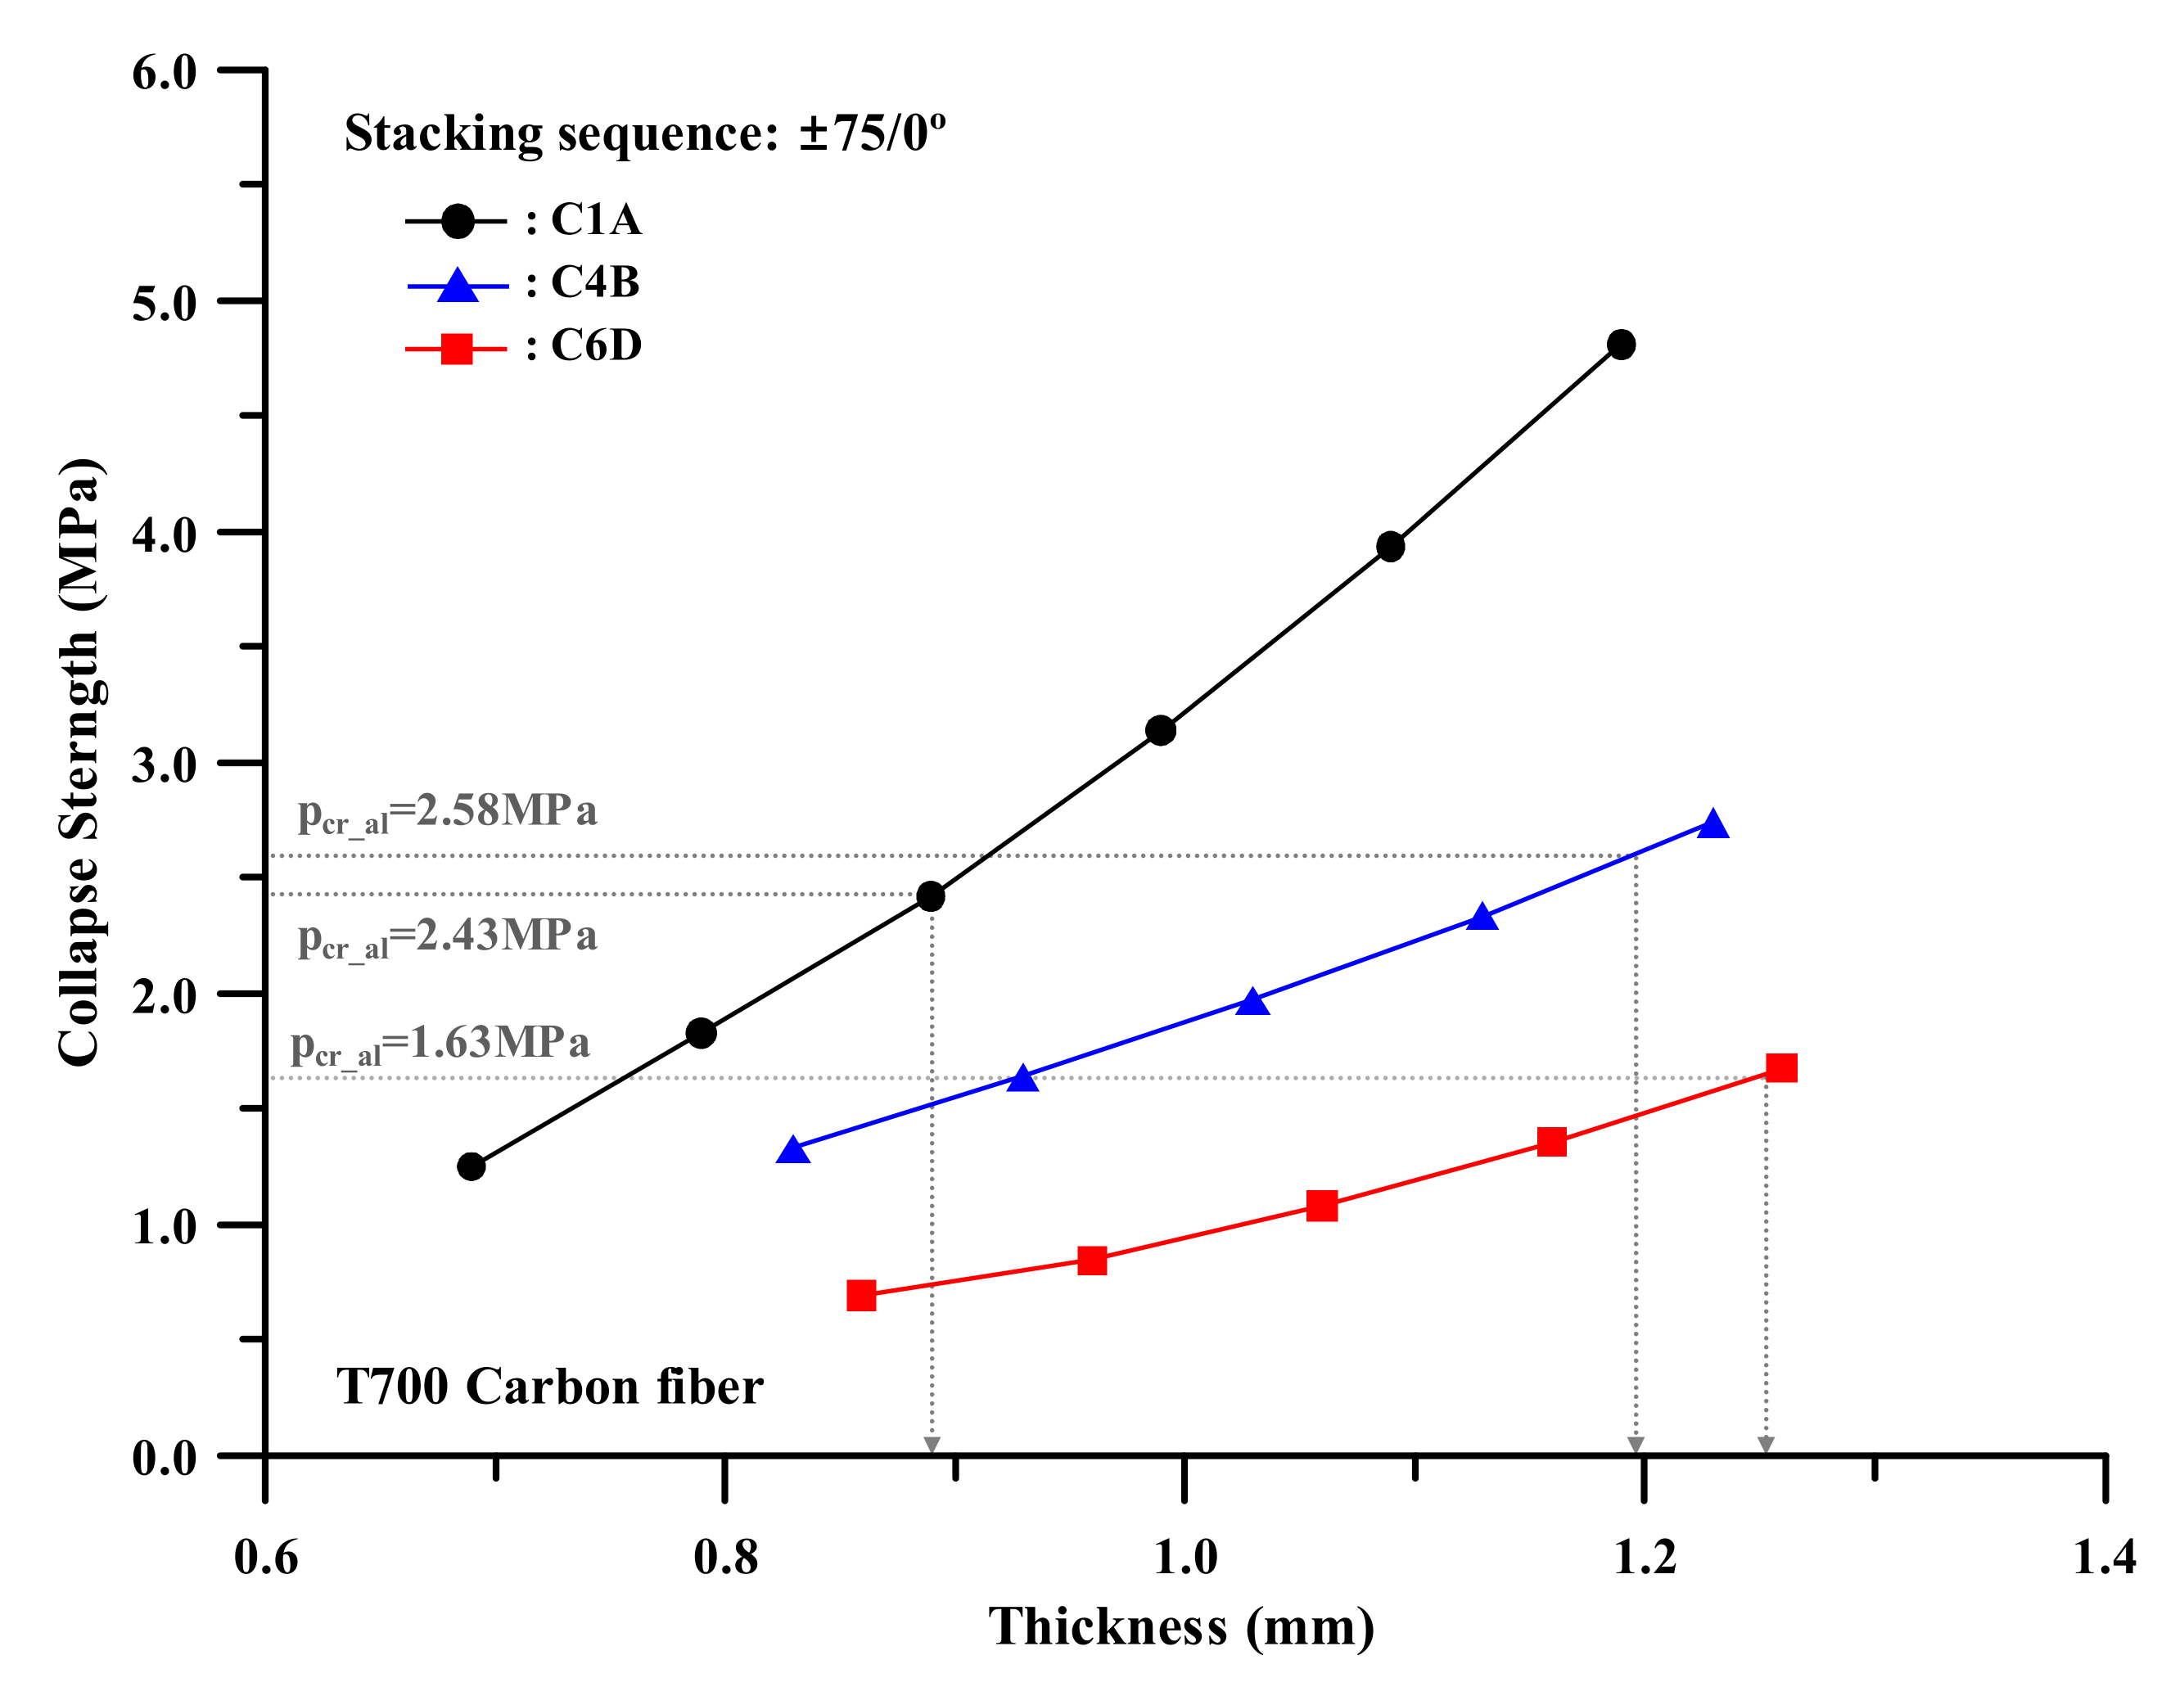
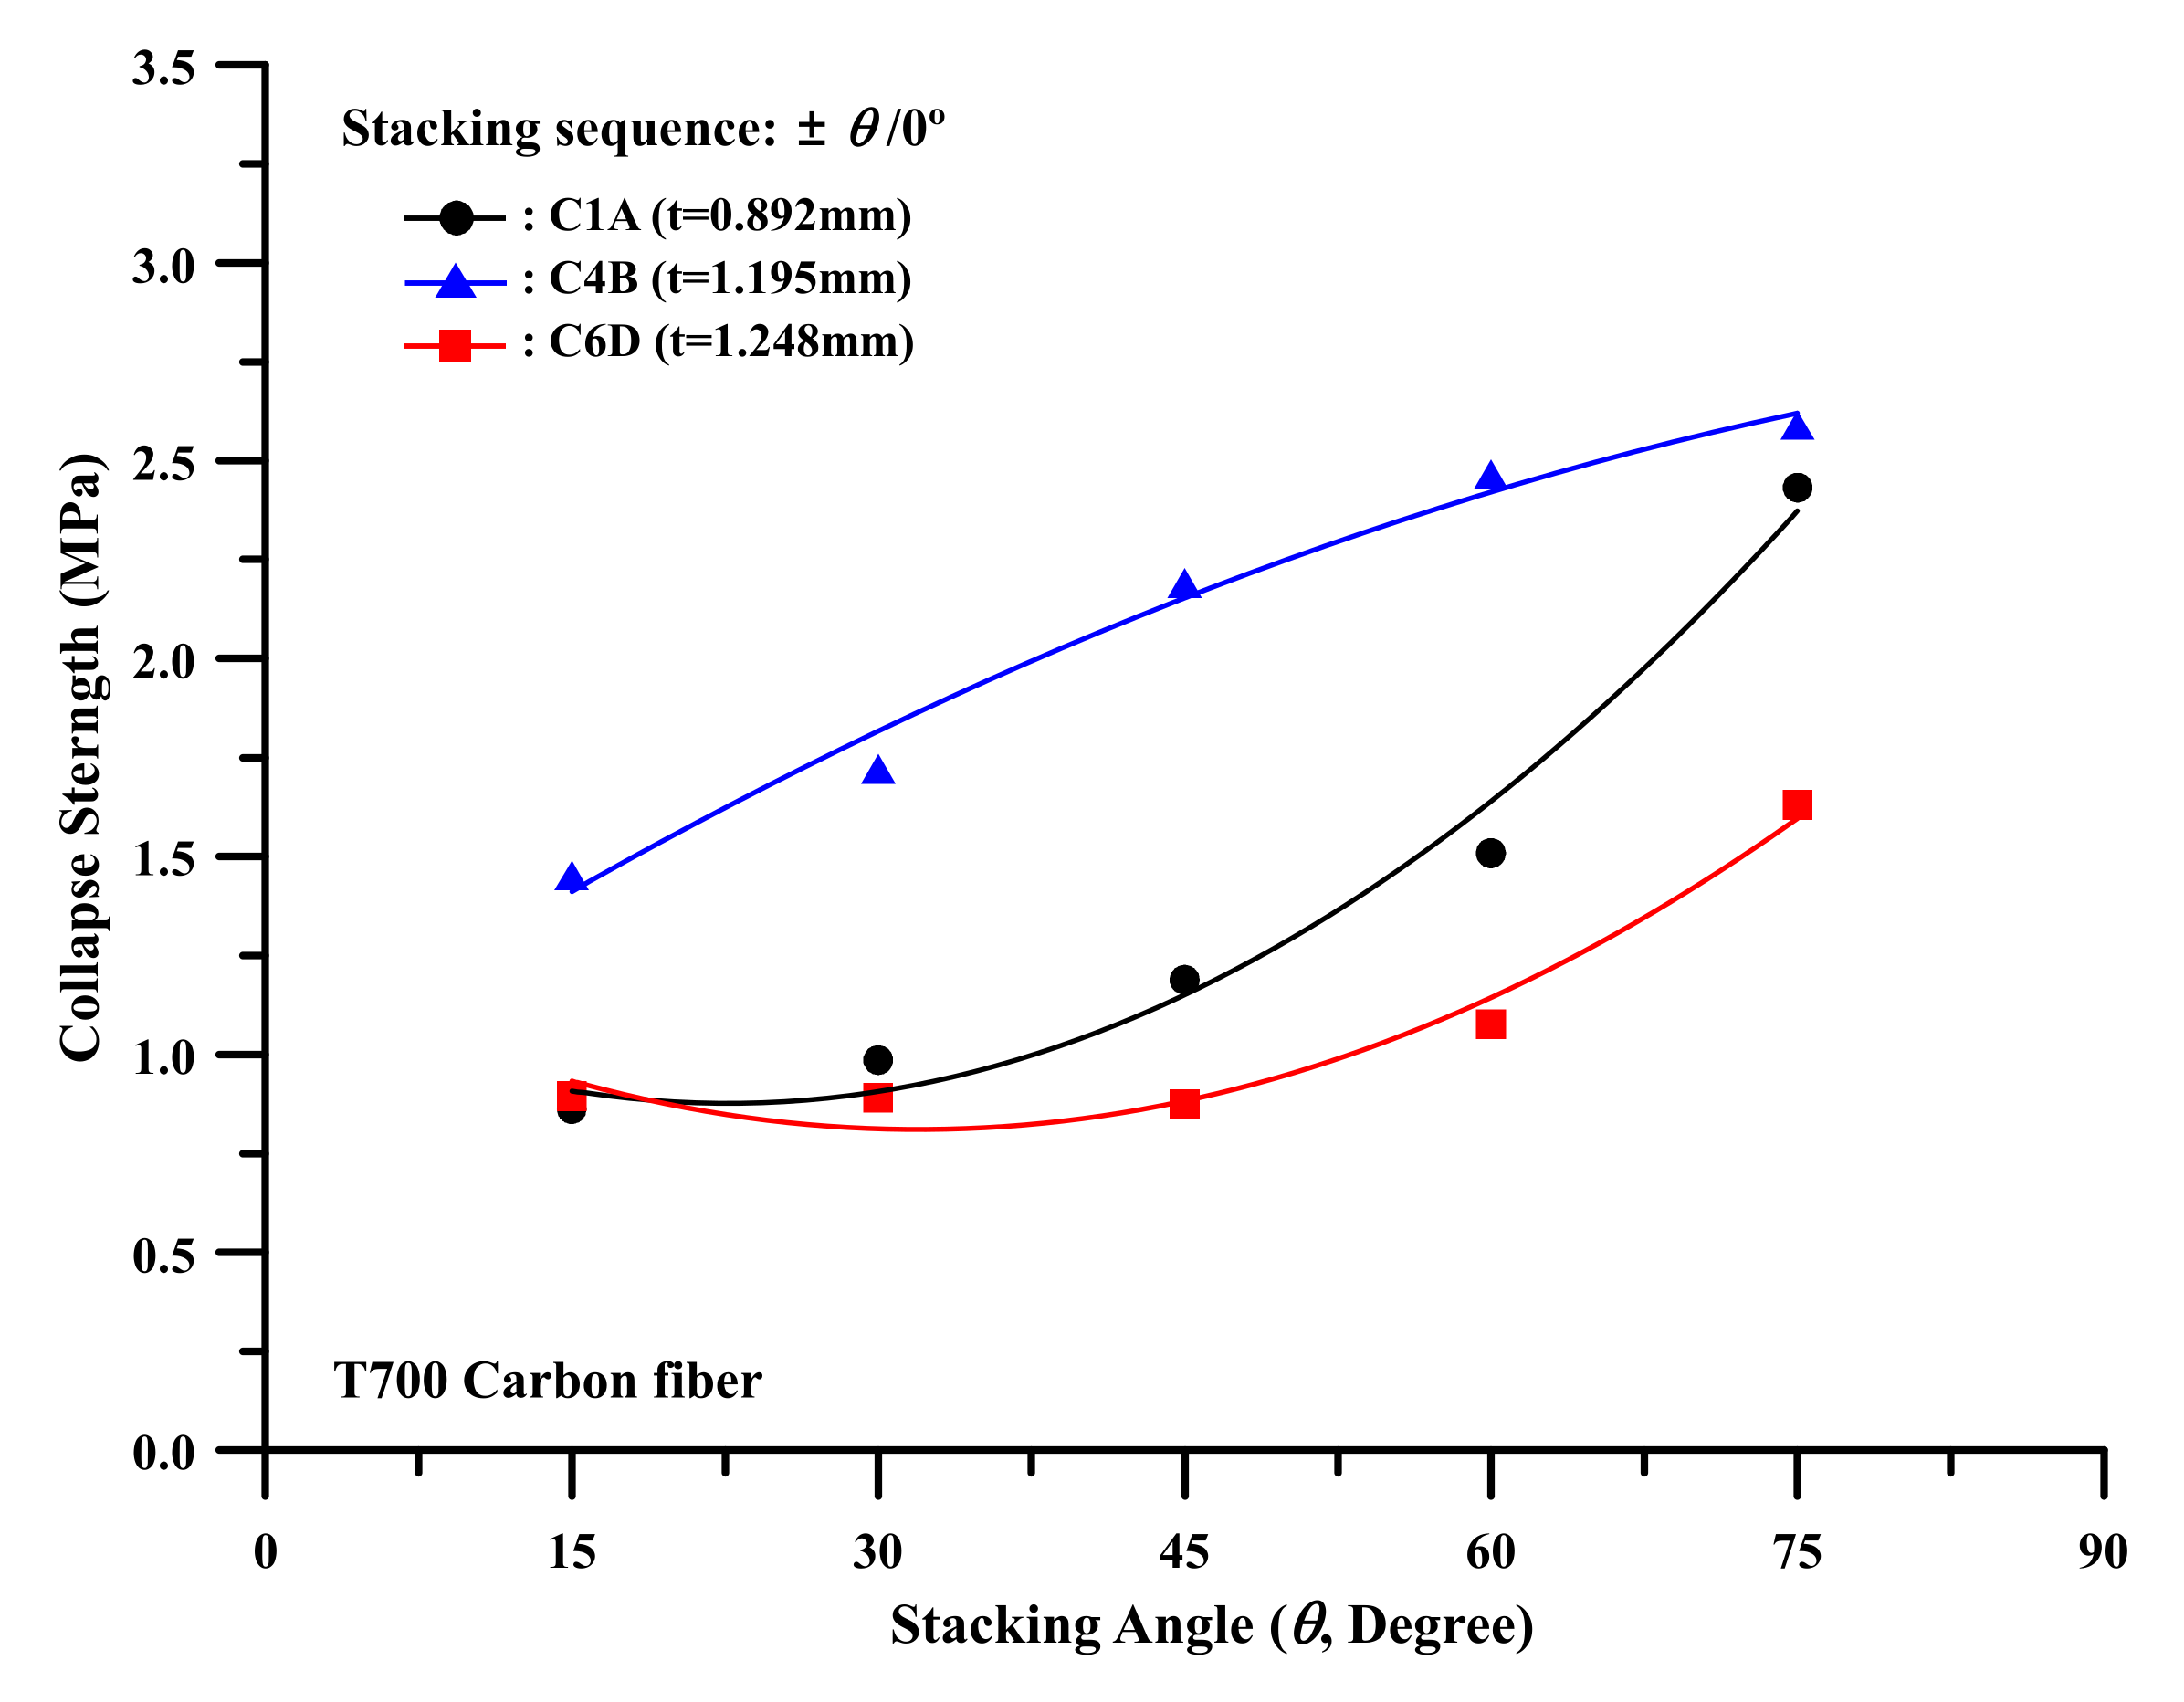
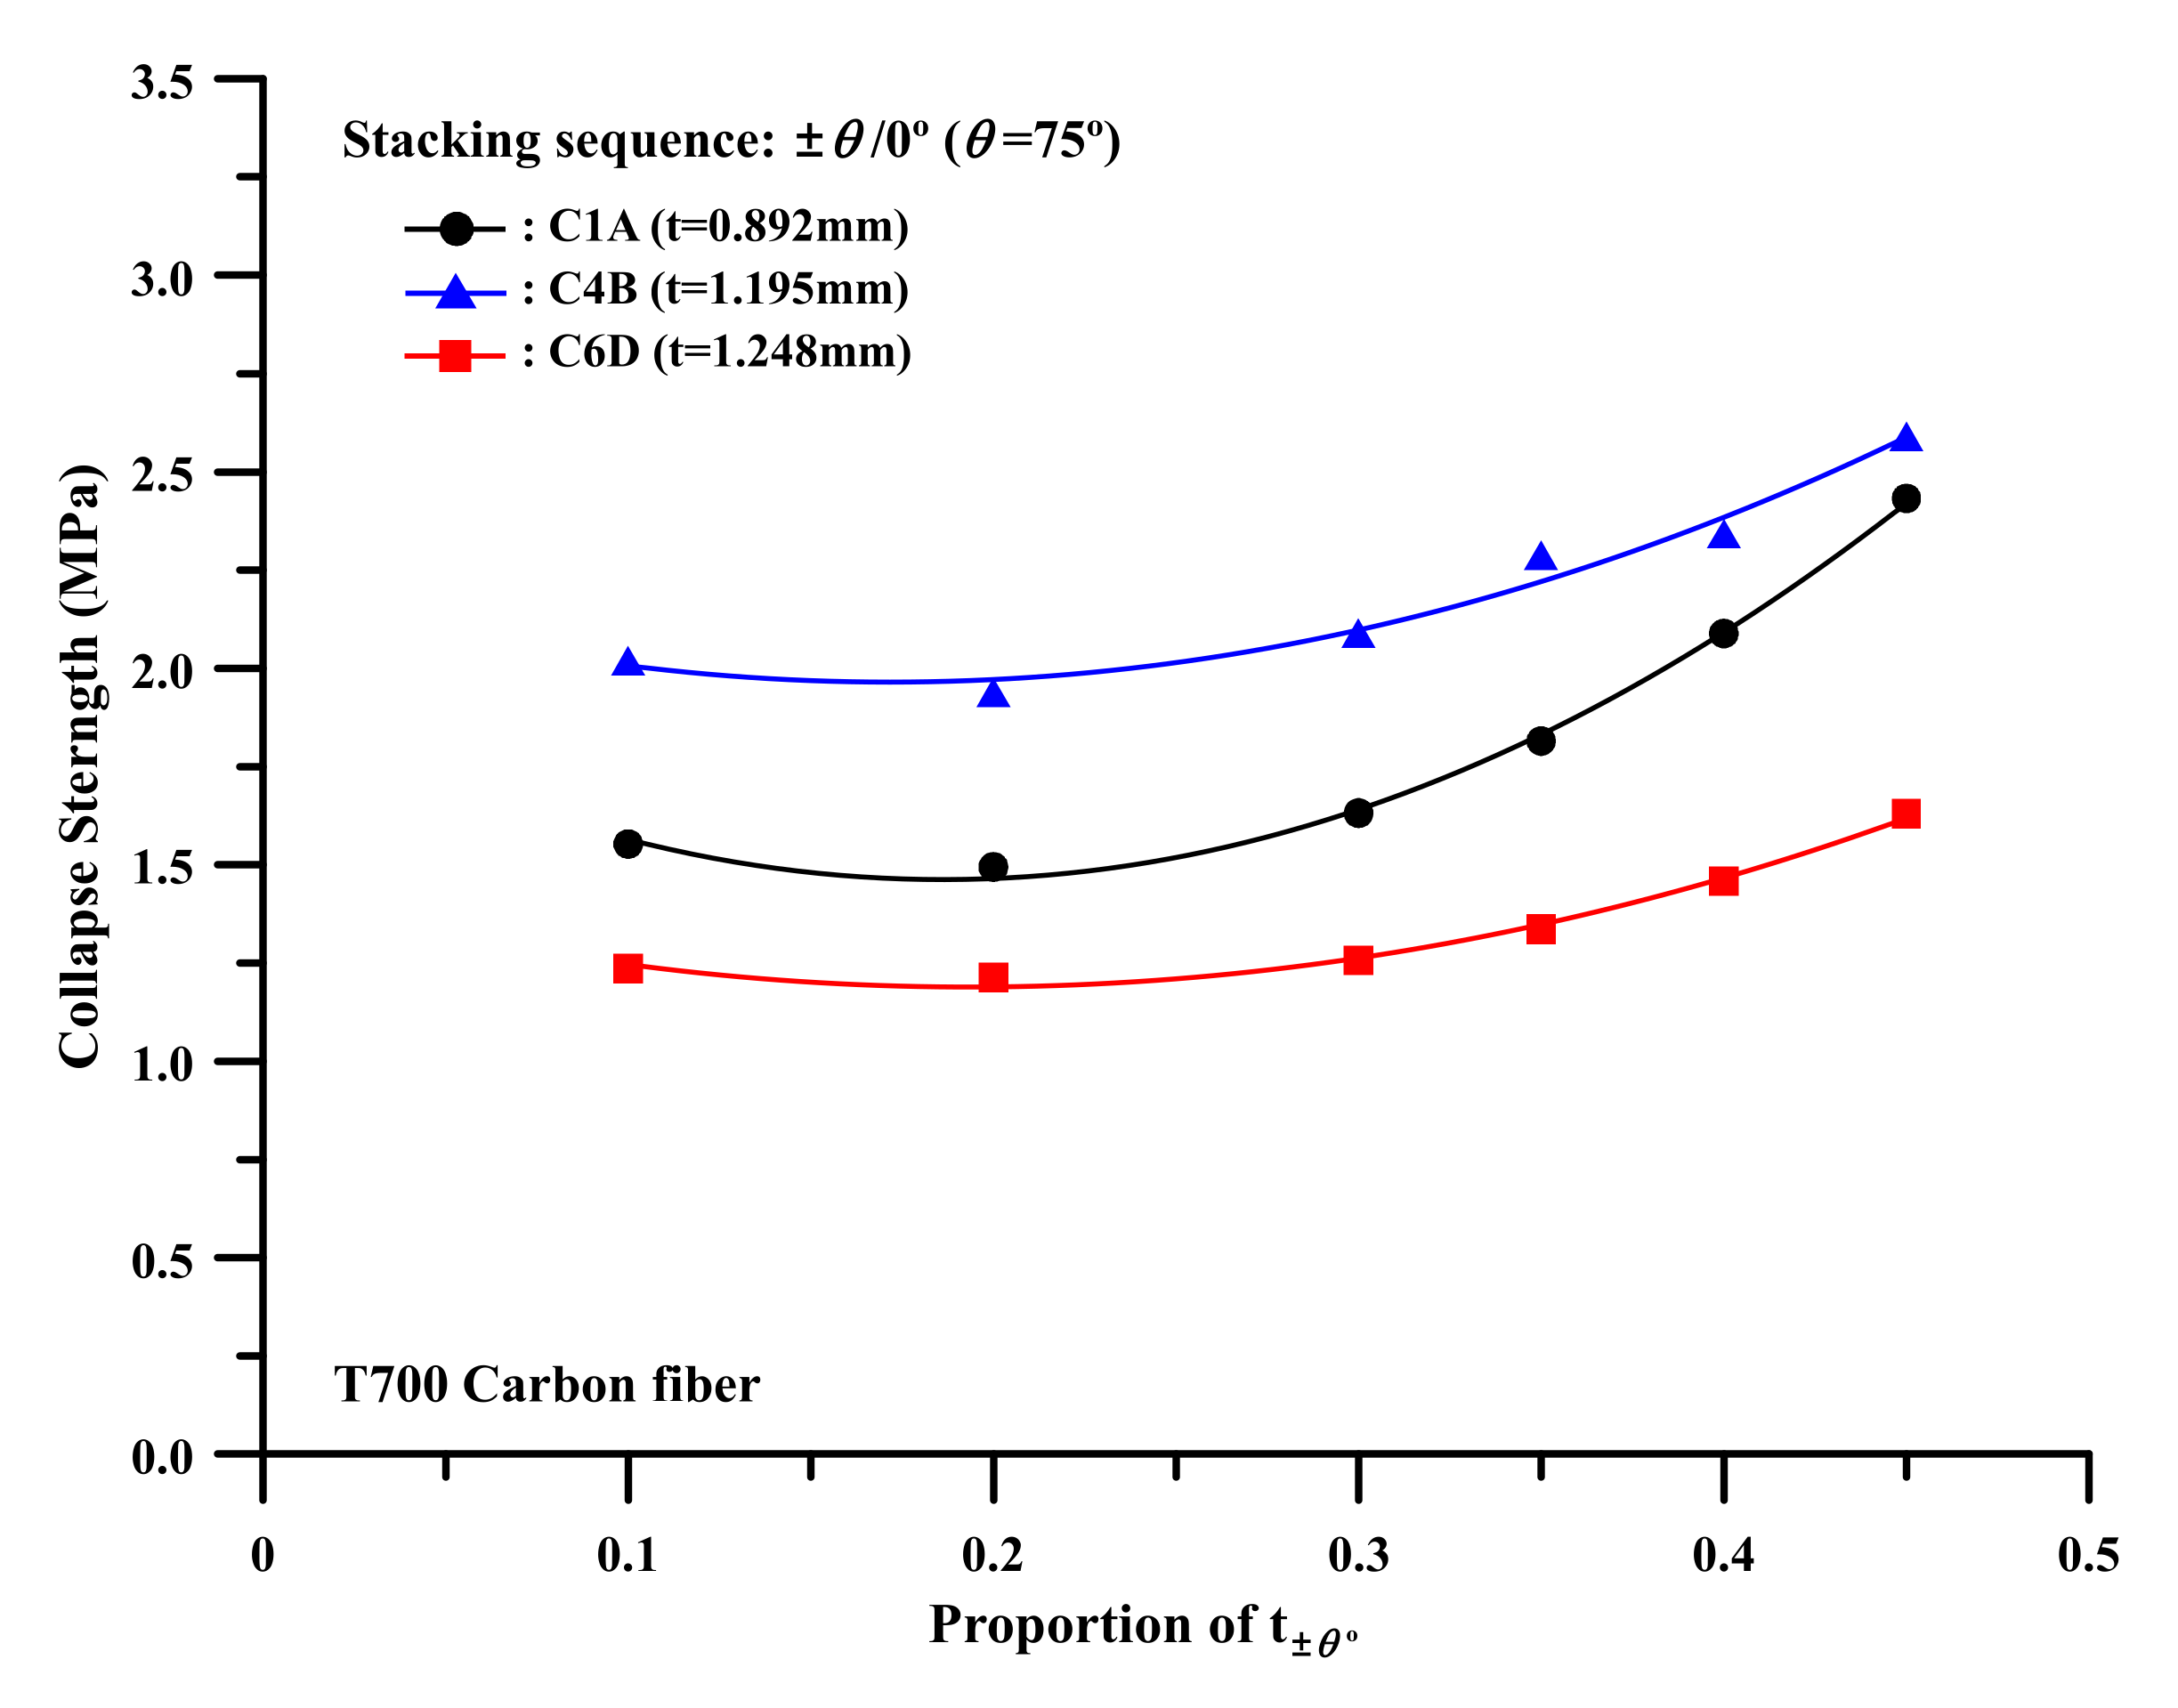
4. Parametric Studies

To better understand the structural behavior resulting from different ply sequences, parametric studies were performed using FE computations for various stacking sequences. Three models with different thicknesses but the same strength as an aluminum model (C1A, C4B, and C6D), were selected.
At first, the effect of stacking angle was re-examined. Figure 13 shows the dependence of the collapse strength on the stacking angle, with 0 degree in the hoop layer. Typically, collapse strength has decreased by increasing L by D or slenderness ratio for the same thickness. However, decreasing D by t causes increasing collapse strength for the same length. The modified C4B model recorded the largest collapse strength, despite being associated with only a medium slenderness ratio. This resulted from the fact that L/D for the C4B model has a medium value, while its D/t has a lower value. The modified C6D model was associated with the highest slenderness ratio. It yielded the lowest values regardless of stacking angle. The collapse strength increased with the increasing stacking angle of the helical layer. For a given model dimension, the strength varied by a factor of 2.82 between the lowest and the highest values in C1A. Therefore, the stacking sequence played a key role in the collapse strength of the composite material models.
In the second parametric study, the influence of the thickness portion in ply sequence (i.e., each layer thickness in relation to the total thickness) on collapse strength was examined. Accordingly, the overall thickness was kept constant, while the thickness of the stacking angles in three laminations (±75/0 deg.) varied (see Table 9). Figure 14 shows the different proportions of helical layers in the composite material model and the corresponding collapse strength of these layers. The strength increased with an increasing ratio of thickness in helical layers (t±75), regardless of the model. The highest slenderness model (C6D) was only slightly affected when the thickness of the helical layer increased. On the other hand, the lowest slenderness model (C1A) was severely affected. It was concluded that the strength can increase substantially by changing the proportion of each layer in a short and stubby cylindrical structure. However, the effect varies with the stacking angle of the ply sequence.

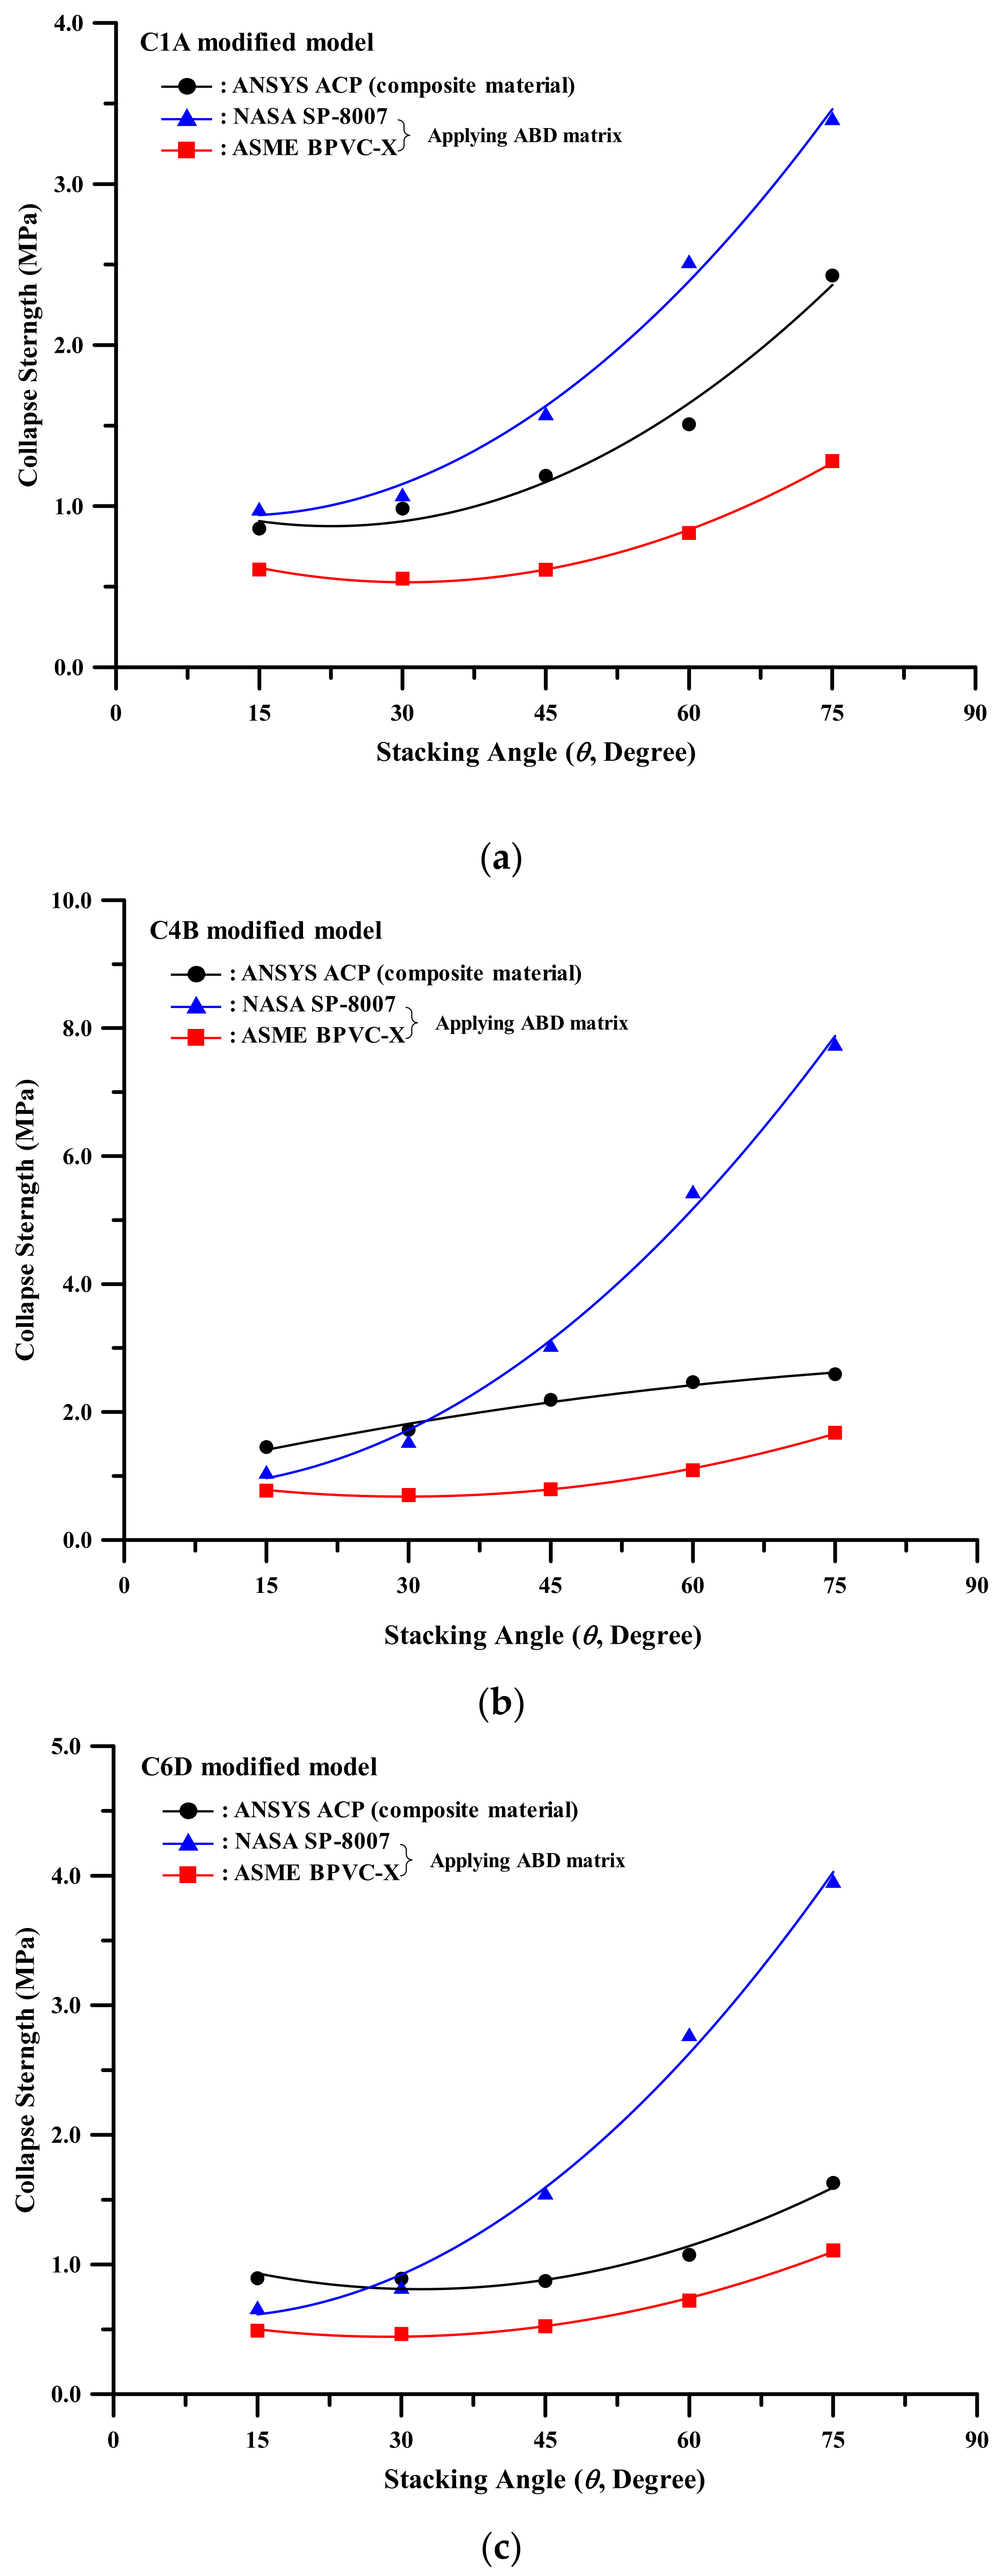
5. Comparison against Engineering Standards

Structural analysis results were compared against the NASA SP-8007 [17] and ASME BPVC-X [18] design codes’ buckling criteria for cylindrical structures under external pressure. The comparison was based on the following assumptions:
(1)
The laminate thickness is very small;
(2)
The layers are perfectly bonded;
(3)
Vertical edges perpendicular to the cross-section surface of the small element in laminate remains straight after deformation;
(4)
The laminate is linear elastic;
(5)
The through-the-thickness stresses and strains are negligible.
The ‘ABD matrix’ below describes the relationship between the loads and deflections of a composite laminate according to Classical Lamination Theory (CLT) [15,22]. A, B and D denote the extensional, coupling and bending stiffnesses of the laminate. And they are defined by using the z-coordinate in ply k (zk), ply k+1 (zk+1), and stress-strain relations ( Q ¯ ) of each ply [22]. It is assumed that the laminate is loaded only in tension or compression along the principal material axes without shear strain. It is noted that couplings between normal stresses and shear deformation and between shear stress and normal strains were not considered in CLT.
N x N y N x y M x M y M x y = A 11 A 12 A 16 B 11 B 12 B 16 A 12 A 22 A 26 B 12 B 22 B 26 A 16 A 26 A 66 B 16 B 26 B 66 B 11 B 12 B 16 D 11 D 12 D 16 B 12 B 22 B 26 D 12 D 22 D 26 B 16 B 26 B 66 D 16 D 26 D 66 ε x ε y γ x y K x K y K x y
A i j = k = 1 n Q ¯ i j n z k z k 1
B i j = 1 2 k = 1 n Q ¯ i j n z k 2 z k 1 2
D i j = 1 3 k = 1 n Q ¯ i j n z k 3 z k 1 3
NASA SP-8007 [17] suggested buckling equations for an orthotropic cylinder under axial compression/bending, external pressure, and torsion. For external pressure, the equations are as follows:
P a = R F n 2 + 1 2 m π R L 2 d e t C 11 C 12 C 13 C 21 C 22 C 23 C 31 C 32 C 33 d e t C 11 C 12 C 21 C 22
C 11 = A 11 m π L 2 + A 66 n R 2
C 12 = C 21 = A 12 + A 66 m π L n R
C 13 = C 31 = A 12 R m π L + B 11 m π L 3 + B 12 + 2 B 66 m π L n R 2
C 22 = A 22 n R 2 + A 66 m π L 2
C 23 = C 32 = B 12 + 2 B 66 m π L 2 n R + A 22 R n R + B 22 n R 3
C 33 = D 11 m π L 4 + 2 D 12 + 2 D 66 m π L 2 n R 2 + D 22 n R 4 + A 22 R 2 + 2 B 22 R n R 2 + 2 B 12 R m π L 2
ASME BPVC-X [18] demonstrated the use of the rigorous NASA SP-8007 solution and presented a simplified equation for cylinder buckling due to external pressure, where,
P a = k D · 0.8531 · γ · E h f 3 / 4 · E a t 1 / 4 t 5 / 2 1 v x v y 3 / 4 · L · D o 2 3 / 2 · F
v x = A B D 1 5 , 4 A B D 1 4 , 4
v y = A B D 1 5 , 4 A B D 1 5 , 5
E a t = A 11 A 22 A 12 2 A 22 t
E h f = 12 t 3 A B D 1 5 , 5
E a f = 12 t 3 A B D 1 4 , 4
Z p = E h f 3 / 2 · E a t 1 / 2 E a f 2 1 v x v y 1 2 · L 2 D 0 2 t
γ = 1 0.001 Z p   Z p 100   o r   0.9   ( Z p > 100 )
A comparison of the collapse strength values calculated by ANSYS ACP and the design codes is shown in Figure 15. The codes applied the coefficients of the ABD matrix and inverse ABD matrix directly to the buckling formula for external pressures. The ABD matrix could be changed by varying the composite information, and the values in the design code could be changed by varying the safety factor, F = 1.
Figure 15 shows that the collapse strength increased with the increasing stacking angle of the ply sequence. The values obtained from NASA SP-8007 increased more sharply than the other values. Collapse pressure values in ASME BPVC-X were recorded as the lowest. This is because in contrast to ASME BPVC-X, NASA SP-8007 requires a longitudinal/circumferential wave number of buckling The FE results match well against the experimental data of Section 2.2.2. This is also confirmed in several references [7,8,9,10,12,14]. Based on these comparisons, the accuracy of design codes for the prediction of collapse strength could be considered insufficient.

6. Effective Engineering Constants of Laminate

FE-based structural analysis of composite materials is time-consuming as it requires the definition of ply sequences. Generally, it may be complex to assign plies by setting lay-ups, stacking thicknesses, and orientations. To overcome these challenges, effective engineering constants can be used to predict stiffening behavior. These constants represent equivalent material properties for the entire ply. Tavakoldavani [23] showed comparisons for longitudinal, transverse, shear modulus, and Poisson’s ratio varying on an orientated angle-ply in unidirectional laminas. Hudisteanu et al. [24] concluded that the angle-ply laminates for all elastic constants show greater values than the orthotropic laminas for specific ranges. Farooq and Myler [25] confirmed that effective engineering constants obtained from various equations have shown a good agreement (over 90%) between laminates having different types of stacking sequences by performing tensile and bending tests. Jung et al. [12] compared the buckling pressure obtained from FE analysis for different stacking and effective material properties. They concluded that a single layer with effective engineering constants is adequate.

6.1. Three-Dimensional Laminate Theory

For a given composite stacking sequence, in-plane effective engineering constants can be determined from the so-called ABD matrix. Engineering constants refer to the extensional modulus in the x, y, and z directions; Poisson’s ratios (υxy, υyz, and υxz), and the shear modulus in the x-y, y-z, and x-z planes. Chou et al. [26] formulated a three-dimensional stress-strain constitutive relation that can be used as an equivalent representation for laminated media. The coefficients of this relation are given as follows:
C i j = C j i i j C j i = 0   i , j = 1 , 2 , 3 , 6 ; j = 4 , 5
C i j = k = 1 n V k C i 3 k C i 3 k C 3 j k C 33 k + C i 3 k l = 1 n V l C 3 j l C 33 l C 33 k l = 1 n V l C 33 l   ( i , j = 1 , 2 , 3 , 6 )
C i j = k = 1 n V k C i j k Δ k k = 1 n l n V k V l Δ k Δ l ( C 44 k C 55 l C 45 k C 54 l )   ( i , j = 4 , 5 )
Δ k = C 44 k C 45 k C 54 k C 55 k
V k = t k t
The laminate compliance matrix ( H i j * ) was obtained as the inverse of the laminate stiffness matrix ( C i j * ) and was directly converted to nine engineering constants. Table 10 lists the effective engineering constants (based on the three-dimensional laminate theory) associated with different stacking angles. For longitudinal modulus (Ex), it shows a gradual drop as the angle increases. It also shows an increasing trend as the angle increases in transverse modulus (Ey). The shear modulus (Gxy) records the highest value in ±45/0. The Poisson’s ratio has a sudden increase at ±30/0.

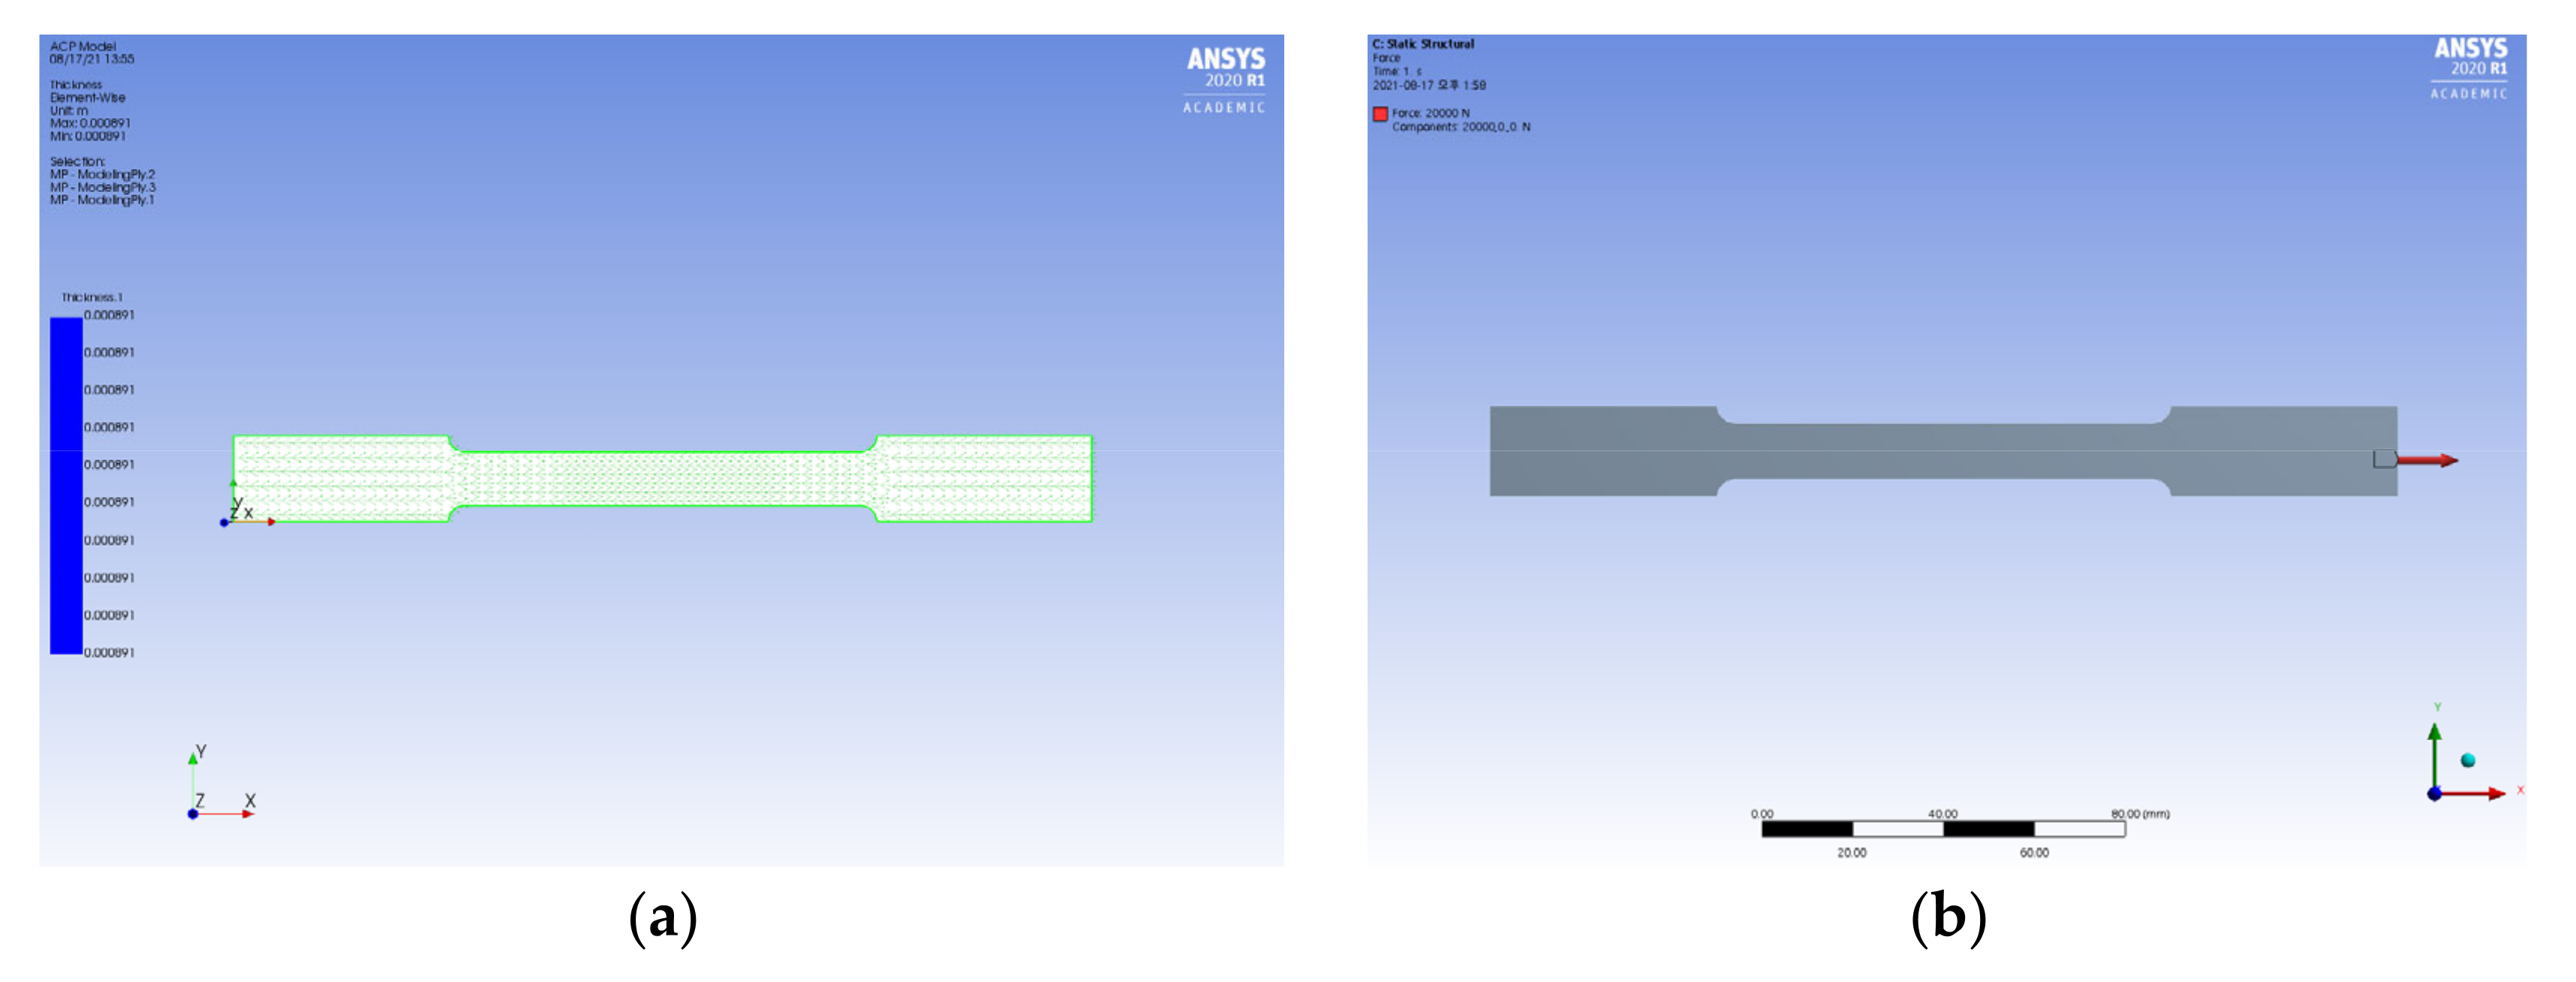
6.2. Numerical Analysis of Tensile Test

Numerical analysis of tensile tests, that comprised of three composite layers with different stacking angles, was used to derive representative engineering constants along the x, y, and z axes. To describe the specific ply sequence of the composite material properties and apply tensile loadings, ANSYS ACP, and ANSYS were interlinked, as shown in Figure 16.
An FE specimen using 8-node solid elements was created. The specific dimensions of the specimen were set in accordance with ASTM E8-04 [27]. The FE model was transferred into the ANSYS ACP environment where the ply thickness and stacking information were assigned. Figure 17 shows the fibre direction in ANSYS ACP and the applied tensile loading in ANSYS. The tensile test was conducted in the x, y, and z directions, respectively.
Effective engineering constants for the elastic modulus, shear modulus, and Poisson’s ratio for the entire thickness are shown in Table 11. As compared to three-dimensional laminate theory, the values decreased in a similar manner in the x direction. A slight difference in the z direction occurred for the elastic modulus. A considerable difference in the transverse elastic modulus was noted. The shear modulus in the y-z and x-z planes exhibited the same properties regardless of the stacking angle, while it shows that a slight difference was noted for the theoretical method. Large shear modulus values and significant differences in Poisson’s ratio were observed in the x-y plane. These differences may have resulted from the thin plate approximation, which stipulates that the laminate remains straight and perpendicular to the surface after deformation. The solid FE model generated more accurate results as it allows modelling the effect of transverse shear deformation. Stacking sequence is not considered in the accumulating laminate stiffness matrix in the CLT theory. This means that it has the same matrix between 30/−30/0 and −30/30/0 when it has the same thickness of each ply.

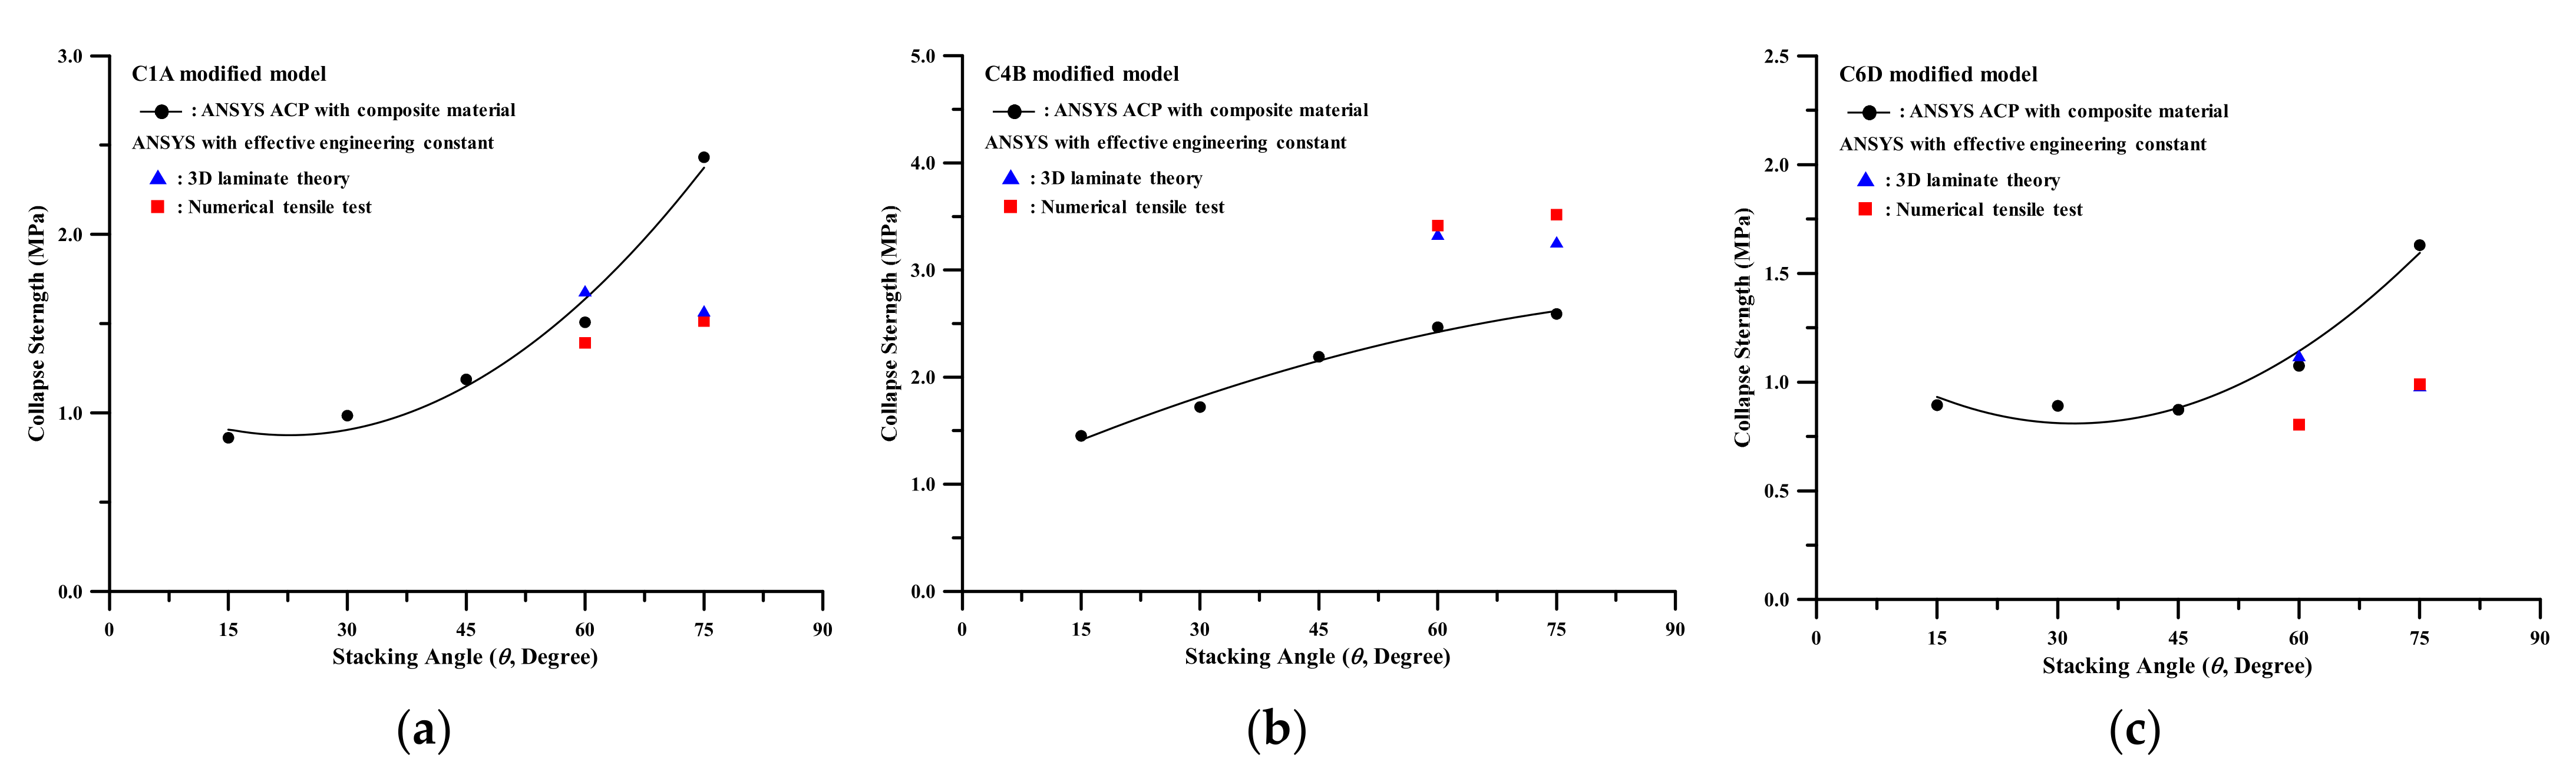
6.3. Application of Strength Analysis

The collapse strength pressure was predicted by applying two effective engineering constants to a composite cylinder. Three modified models, each consisting of five different orthotropic elasticity models that represent ±θ/0, were generated. For running ANSYS computation, the elastic stiffness matrix (stress-strain) matrix must be positive definite [28]. ANSYS checks each material property to ensure that the matrix is indeed positive definite using the following equation:
1 v x y 2 E x E y v y z 2 E y E z v x z 2 E x E z 2 v x y v y z v x z E x E z
Normally, the maximum possible value of Poisson’s ratio for common materials is 0.5. In the cases of ±15/0, ±30/0, and ±45/0, the Poisson’s ratio is larger. This means that the volume decreases when the material is in tension, which is contrary to ordinary physical behaviour. Therefore, a numerical error arises “the stress-strain matrix of a material is not positive definite, which is required for real materials” in ANSYS. Moreover, it leads to a negative value of (25).
Table 12 lists the values generated by Equation (25). It can be solved by reducing the Poisson’s ratio. However, it is not reasonable to proceed with computations by arbitrarily changing the values at the stage of applicability by using effective engineering constants. The values obtained from Equation (25) that were below zero have been excluded from the computations. Figure 18 compares the collapse strengths of the target models. The elastic modulus in the y direction obtained from a three-dimensional laminate theory is three times higher than the values in the numerical analysis of the tensile test. The collapse strength decreased for a stacking angle of ±75/0 when a three-dimensional laminate theory was employed. This is because the shear modulus in the x-y plane for a stacking angle of ±75/0 is lower than ±60/0. This observation leads to the conclusion that the elastic modulus in the y direction and the shear modulus in x-y mostly affect the collapse strength and should be considered in the definition of the ABD-matrix.

7. Conclusions

This paper presented an investigation into the collapse behaviour of a filament-wound cylindrical structure that may serve as the main hull of a submarine subject to hydrostatic pressure loads. This paper presents a computational modelling approach for the prediction of the collapse behaviour mechanism using a commercial Finite Element (FE) solver. Numerical comparisons demonstrated that weight savings when using composite materials may rise to 46% as compared to aluminium structures with similar strength characteristics. Notwithstanding this, composite and lightweight material and fabrication costs may be significant and should be taken under consideration. The results of numerical simulations using ANSYS and ANSYS Composite Pre-post (ACP) for the prediction of the collapse pressure under hydrostatic pressure loadings concurred with those of reference test models. They also verified that changing the stacking sequence may result in different collapse strengths.
Effective engineering constants were introduced to simplify the numerical analysis process by assigning one single material property to composite material models without composing different lay-ups. These values were obtained from three-dimensional laminate theory and numerical analysis of tensile tests. Models with the effective engineering constants from numerical analysis of tensile tests show better results. This is because they account for the influence of transverse shear deformation and stacking order. Whereas this is a practical approach that does not require the definition of composite lay-ups, it is limited to hypothetical material properties used in numerical solvers.
Comparisons against available design codes (i.e., ASME and NASA) justify that, in the future, buckling knockdown factors for composite cylinders should be developed to assist with the rapid evaluation of strength at the preliminary design stage. As part of this process, experimental tensile tests for various combinations of composite materials will be carried out with the aim of determining effective engineering constants. Consequently, applications for submarine design will be considered in greater detail.

Author Contributions

Conceptualization, J.M.S. and S.J.K.; methodology, J.M.S. and S.J.K.; software, J.M.S.; validation, J.M.S.; formal analysis, J.M.S. and S.J.K.; investigation, J.M.S.; resources, J.M.S.; data curation, J.M.S.; writing—original draft preparation, J.M.S. and S.J.K.; writing—review and editing, J.M.S., S.J.K., S.H. and J.R.; visualization, J.M.S.; supervision, S.J.K.; project administration, J.M.S.; funding acquisition, J.M.S. All authors have read and agreed to the published version of the manuscript.

Funding

This research received no external funding.

Institutional Review Board Statement

Not applicable.

Informed Consent Statement

Not applicable.

Data Availability Statement

Not applicable.

Acknowledgments

This work was supported by the Pukyong National University Research Fund in 2020. Part of this work was conceptualized when Sang Jin Kim and Jung Min Sohn resided at Aalto University, Finland.

Conflicts of Interest

The authors declare no conflict of interest.

Nomenclature

DoOuter diameter of cylindertThickness
EElastic modulustkThickness of kth ply
EiElastic modulus in ith-directiontθThickness for layer which has stacking angle of θ
FSafety factorVkVolume fraction of the kth ply
Giji and j axes shear moduluszkz-coordinate of the kth ply
KDKnockdown factor, 0.84γReduction factor
LLength of cylinderγxyShear strain
leLength of end plugεiNormal strain in ith direction
mLongitudinal wave no. of bucklingκCurvature in ith direction
nCircumferential wave no. of bucklingθStacking angle in helical layer
MiMoment resultant in ith directionθkStacking angle in kth layer
NiStress resultant in ith directionλSlenderness ratio
PaAllowable external pressureνijPoisson’s ratio associated with loading in the ith direction and strain in the jth-direction
Q ¯ Lamina stiffness matrixσYYield stress of material
RRadius of cylinderσTTensile stress of material

References

  1. Graham, D. Composite pressure hulls for deep ocean submersibles. Compos. Struct. 1995, 32, 331–343. [Google Scholar] [CrossRef]
  2. Helal, M.; Huang, H.; Wang, D.; Fathallah, E. Numerical analysis of sandwich composite deep submarine pressure hull considering failure criteria. J. Mar. Sci. Eng. 2019, 7, 377. [Google Scholar] [CrossRef] [Green Version]
  3. Franco, J.; Corz, A.; Peña, A. Optimization of pressure hulls of composite materials. In Proceedings of the 16th European Conference on Composite Materials, Seville, Spain, 22–26 June 2014. [Google Scholar]
  4. Craven, R.; Graham, D.; Dalzel-Job, J. Conceptual design of a composite pressure hull. Ocean Eng. 2016, 128, 153–162. [Google Scholar] [CrossRef]
  5. Wang, S.I. On Lightweight Design of Submarine Pressure Hulls. Master’s Thesis, Delft University of Technology, Delft, The Netherlands, 2012. [Google Scholar]
  6. Khalili, F.; Showkati, H. T-ring stiffened cone cylinder intersection under internal pressure. Thin-Walled Struct. 2012, 54, 54–64. [Google Scholar] [CrossRef]
  7. Muttaqie, T.; Thang, D.Q.; Prabowo, A.R.; Cho, S.R.; Sohn, J.M. Numerical studies of the failure modes of ring-stiffened cylinders under hydrostatic pressure. Struct. Eng. Mech. 2019, 70, 431–443. [Google Scholar]
  8. Cho, S.R.; Muttaqie, T.; Lee, S.H.; Paek, J.; Sohn, J.M. Ultimate strength assessment of steel-welded hemispheres under external hydrostatic pressure. J. Mar. Sci. Appl. 2020, 19, 615–633. [Google Scholar] [CrossRef]
  9. Muttaqie, T.; Park, S.H.; Sohn, J.M.; Cho, S.R.; Nho, I.S.; Han, S.; Lee, P.S.; Cho, Y.S. Experimental investigations on the implosion characteristics of thin cylindrical aluminium-alloy tubes. Int. J. Solids Struct. 2020, 200–201, 64–82. [Google Scholar] [CrossRef]
  10. Muttaqie, T.; Park, S.H.; Sohn, J.M.; Cho, S.R.; Nho, I.S.; Han, S.; Cho, Y.S. Implosion tests of aluminium-alloy ring-stiffened cylinders subjected to external hydrostatic pressure. Mar. Struct. 2021, 78, 102980. [Google Scholar] [CrossRef]
  11. Waqas, H.M.; Shi, D.; Imran, M.; Khan, S.Z.; Tong, L.; Ahad, F.; Zaidi, A.A.; Iqbal, J.; Ahmed, W. Conceptual design of composite sandwich structure submarine radome. Materials 2019, 12, 1966. [Google Scholar] [CrossRef] [PubMed] [Green Version]
  12. Jung, H.Y.; Cho, J.R.; Han, J.Y.; Lee, W.H.; Bae, W.B.; Cho, Y.S. A study on buckling of filament-wound cylindrical shells under hydrostatic external pressure using finite element analysis and buckling formula. Int. J. Precis. Eng. Manuf. 2012, 13, 731–737. [Google Scholar] [CrossRef]
  13. Chun, S.K.; Guang, P. Optimizing the buckling strength of filament winding composite cylinders under hydrostatic pressure. J. Reinf. Plast. Compos. 2018, 37, 892–904. [Google Scholar] [CrossRef]
  14. Cho, Y.S.; Paik, J.K. Optimal lamination design of composite cylinders using an empirical ultimate pressure load formula. J. Soc. Nav. Archit. Korea 2019, 56, 316–326. [Google Scholar] [CrossRef]
  15. Sun, C.T.; Li, S. Three-dimensional effective elastic constants for thick laminates. J. Compos. Mater. 1988, 22, 629–639. [Google Scholar] [CrossRef]
  16. ANSYS. User’s Manual of ANSYS; ANSYS Inc.: Canonsburg, PA, USA, 2020. [Google Scholar]
  17. NASA. Space Vehicle Design Criteria; NASA SP-8007. In Buckling of Thin-Walled Circular Cylinders; National Aeronautics and Space Administration: Washington, DC, USA, 1968. [Google Scholar]
  18. ASME. Boiler and Pressure & Vessel Code; Section X. In Fiber Reinforce Plastic Pressure Vessel; American Society for Testing and Materials: West Conshohocken, PA, USA, 2017. [Google Scholar]
  19. Muttaqie, T. Ultimate Strength Investigations of Pressure Hull Structures Subjected to External Hydrostatic Pressure. Ph.D. Thesis, Pukyong National University, Busan, Korea, 2020. [Google Scholar]
  20. ABAQUS. Analysis User’s Manual Version 6.14; SIMULIA: Johnston, RI, USA, 2016. [Google Scholar]
  21. Wikia. Available online: https://military.wikia.org/wiki/Aluminaut (accessed on 2 February 2022).
  22. NASA. Space Vehicle Design Criteria; RP-1351. In Basic Mechanics of Laminated Composite Plates; National Aeronautics and Space Administration: Washington, DC, USA, 1994. [Google Scholar]
  23. Tavakoldavani, K. Composite Materials Equivalent Properties in Lamina, Laminate and Structure Levels. Master’s Thesis, University of Texas, Arlington, TX, USA, 2014. [Google Scholar]
  24. Hudisteanu, I.; Taranu, N.; Maxineasa, S.G.; Lupășteanu, V. Engineering constants of laminated composites. In Proceedings of the 15th International Scientific Conference VSU, Sofia, Bulgaria, 4–5 June 2015. [Google Scholar]
  25. Farooq, U.; Myler, P. Efficient determination of mechanical properties of carbon fibre-reinforced laminated composite Panels. J. Eng. Appl. Sci. 2017, 12, 1375–1392. [Google Scholar]
  26. Chou, P.C.; Carleone, J.; Hsu, C.M. Elastic constants of layered media. J. Compos. Mater. 1972, 6, 80–93. [Google Scholar] [CrossRef]
  27. ASTM. Standard Test Method for Tension Testing of Metallic Materials; American Society for Testing and Materials: West Conshohocken, PA, USA, 2004. [Google Scholar]
  28. ANSYS. Theory Reference; ANSYS Inc.: Canonsburg, PA, USA, 2022. [Google Scholar]
Figure 1. A process of ANSYS Composite Prep.
Jmse 10 00466 g001
Figure 2. Cylindrical tube model (reproduced from [19], with permission from Pukyong National University, 2022). (a) Test model, (b) Model assembly, (c) FE model (C4B).
Jmse 10 00466 g002
Figure 3. Comparison of collapse strength obtained for the aluminum material.
Jmse 10 00466 g003
Figure 4. Examples of comparison of failure modes (reproduced from [19], with permission from Pukyong National University, 2022). (a) C1A, (b) C6D.
Jmse 10 00466 g004
Figure 5. Notation of filament-wound cylinder.
Jmse 10 00466 g005
Figure 6. An example of stack-up layers comprising the composite material shell.
Jmse 10 00466 g006
Figure 7. Comparison of collapse strength obtained for composite material.
Jmse 10 00466 g007
Figure 8. Lay-ups direction of θ degree of composite material (Light green arrows denote the fibre direction; Green arrows denote the transverse direction of fibre, and purple indicates the normal (out of plane) direction in defining orientation for ANSYS ACP). (a) −30 degree, (b) −45 degree, (c) −60 degree.
Jmse 10 00466 g008
Figure 9. Collapse strength comparison depending on stacking angle or material with identical geometry. (a) Variation in composite material with stacking angle, (b) Comparison between aluminum and composite material of ±75/0.
Jmse 10 00466 g009
Figure 10. Collapse strength comparison depending on stacking angle or material with identical weight. (a) Variation in composite material with stacking angle, (b) Comparison between aluminum and composite material of ±75/0.
Jmse 10 00466 g010
Figure 11. Search for the same collapse strength in the composite material model (See Table 7).
Jmse 10 00466 g011
Figure 12. Pressure-average deflection curve for C4B model.
Jmse 10 00466 g012
Figure 13. Dependence of collapse strength on stacking angle (±θ/0).
Jmse 10 00466 g013
Figure 14. Three models with different thickness portion in helical layers (±75/0 deg.).
Jmse 10 00466 g014
Figure 15. Comparison of ANSYS ACP and design codes. (a) Modified C1A, (b) Modified C4B, (c) Modified C6D.
Jmse 10 00466 g015
Figure 16. Workflow for numerical analysis of tensile test.
Jmse 10 00466 g016
Figure 17. A specimen for the tensile coupon simulation. (a) Assigned ply information in ANSYS ACP, (b) Applied load in ANSYS.
Jmse 10 00466 g017
Figure 18. A comparison of the collapse strength using the effective engineering constant. (a) Modified C1A, (b) Modified C4B, (c) Modified C6D.
Jmse 10 00466 g018
Table 1. Research publications with focus on the collapse strength of pressure hull [6,7,8,9,10,11,12,13,14].
MaterialAuthor (Year)Pressure HullMethodStacking Sequence (Case of Composite Material)
TypeFeatureLay-UpDesign Variablet
Variation
Effective Engineering Constant
SteelKhalili and Showkati (2012)Cone-cylinderStiffened structureE, N-
Muttaqie et al. (2019)CylinderN
Cho et al. (2020) Hemisphere-E, N, D
AluminumMuttaqie et al. (2020)Cylinder E, N-
Muttaqie et al. (2021)CylinderStiffened structureE, N
GFRP
CFRP
Waqas et al. (2019)HemisphereSandwich
Structure
N[±45i],[0j/90j]i = 4, 5, 11 j = 3, 4, 11OX
Carbon fibreJung et al. (2012)Cylinder N, D[±θ/90]θ = 30°, 45°, 60°XO
Chun and Guang (2018)Cylinder-N[±θ10/904]θ = 30°, 45°, 60°XX
Cho and Paik
(2019)
Cylinder-N[90i/θ/15j/θ/90i]θ = 30°, 45°, 60°, 75°
i = 2,3, j = 2–6
XX
PresentCylinder-N, D[±θ/0]θ = 15°, 30°, 45°, 60°, 75°OO
Note: E: Experimental method N: Numerical FE analysis, D: Design code; GFRP denotes Glass Fibre Reinforced Polymer, CFRP corresponds to Carbon Fibre Reinforced Polymer.
Table 2. Geometrical and material information (reproduced from [19], with permission from Pukyong National University, 2022).
ModelParameters (mm)Material Properties (MPa)
LtDo l e EσYσT
C1A1200.6947.331569,700267298
C2A1450.7147.3915
C3C1700.7147.5815
C4B1900.8347.523067,000301334
C5C2400.8247.543069,900332364
C6D3200.8647.521571,400294322
Table 3. Summary of collapse strength obtained for the aluminum material.
No.Collapse Strength (MPa)Notation
[19]
ExperimentFinite Element Analysis
ANSYS
ACP
Error
(%)
ABAQUSError
(%)
12.332.434.292.382.15C1A
21.932.035.181.911.04C2A
31.801.821.111.821.11C3C
42.722.585.152.594.78C4B
52.142.044.672.063.74C5C
61.511.637.951.6811.26C6D
Table 4. Geometrical and material information (reproduced from [14], with permission from The Society of Naval Architects of Korea, 2022).
ModelStacking Angle (°)Length (mm)Inner Radius (mm)Thickness (mm)Hoop Thickness (mm)Notation
[14]
1±30/906861508.011.43FWT8 30/90-1
2±45/906951508.120.97FWT8 45/90-1
3±60/906951507.800.99FWT8 60/90-1
Note: The ±θ angle denotes the helical layer, 90 corresponds to the hoop layer.
Table 5. Material properties of T700 carbon fibre (reproduced from [14], with permission from The Society of Naval Architects of Korea, 2022).
DescriptionDirectionValues
Elastic modulus (GPa)In-plane121.0
Transverse8.6
Shear modulus (GPa)In-plane3.35
Transverse2.68
Poisson’s ratioIn-plane0.253
Transverse0.421
Tensile strength (MPa)In-plane2060
Transverse32
Shear strength (MPa)In-plane45
Transverse64
Table 6. Summary of collapse strength obtained for the composite material.
No.Collapse Strength (MPa)Notation
[14]
ExperimentFinite Elemetn Analysis
ANSYS
ACP
Error
(%)
NASTRANError
14.304.310.234.3511.19FWT8 30/90-1
25.805.357.765.4985.21FWT8 45/90-1
3e7.187.071.537.0342.03FWT8 60/90-1
Table 7. Geometrical information for application models.
Notation
[19]
Dimension (mm)nSlenderness
Ratio
Ply Thickness (mm)
LDt+θθ
C1A12047.330.6937.280.310.310.07
C2A14547.390.7138.780.320.320.07
C3C17047.580.71310.260.320.320.07
C4B19047.520.83311.510.370.370.08
C5C24047.540.82214.530.370.370.08
C6D32047.520.86219.390.390.390.09
Table 8. Obtained thickness and weight information.
Notation
[19]
Dimension (mm)λWeight (kg)Weight Saving (%)
LDtAluminumComposite
(±75/0°)
C1A12047.330.8927.310.3300.25032
C2A14547.390.8438.810.0410.02846
C3C17047.580.84710.290.0480.03345
C4B19047.521.19511.600.0620.05219
C5C24047.541.25114.660.0780.06913
C6D32047.521.24819.550.1090.09120
Table 9. Each ply thickness for three lamination stacking sequence.
Modelttotal
(mm)
Thickness in Helical Layers
t±75
(mm)
Proportion
(%)
Thickness in Hoop Layer
t0
(mm)
Proportion
(%)
C1A0.8920.4010.450.0890.10
0.3570.400.1780.20
0.3120.350.2680.30
0.2680.300.3570.40
0.1780.200.5350.60
0.0890.100.7140.80
C4B1.1950.5380.450.1200.10
0.4780.400.2390.20
0.4180.350.3590.30
0.3590.300.4780.40
0.2390.200.7170.60
0.1200.100.9560.80
C6D1.2480.5620.450.1250.10
0.4990.400.2500.20
0.4370.350.3740.30
0.3740.300.4990.40
0.2500.200.7490.60
0.1250.100.9980.80
Table 10. Effective engineering constants (three-dimensional laminate theory).
PropertiesStacking Sequence
±15/0±30/0±45/0±60/0±75/0
Ex (GPa)100.4847.4623.3219.5419.61
Ey (GPa)8.419.2517.5348.9093.58
Ez (GPa)8.709.319.999.859.60
νxy0.9341.4050.8230.3210.087
νyz0.3940.3090.1600.0550.195
νxz−0.033−0.2050.0700.2820.383
Gxy (GPa)9.6722.3228.6522.329.67
Gyz (GPa)2.712.812.953.103.22
Gxz (GPa)3.303.173.012.872.77
Table 11. Effective engineering constants (numerical analysis of tensile test).
PropertiesStacking Sequence
±15/0±30/0±45/0±60/0±75/0
Ex (GPa)71.9539.7023.1518.6018.63
Ey (GPa)8.428.289.3715.1432.86
Ez (GPa)10.1510.2110.3010.3510.39
νxy0.5890.8240.6160.3010.095
νyz0.3930.3320.2400.1920.259
νxz0.1340.0540.1530.2890.377
Gxy (GPa)5.065.6816.3722.0826.82
Gyz (GPa)2.682.682.682.682.68
Gxz (GPa)2.682.682.682.682.68
Table 12. The values obtained by Equation (25).
MethodStacking Sequence
±15/0±30/0±45/0±60/0±75/0
3D laminate theory−9.2921−8.5383−0.00210.76620.3015
Numerical analysis of tensile test−2.6608−2.4705−0.14270.62420.4950
Publisher’s Note: MDPI stays neutral with regard to jurisdictional claims in published maps and institutional affiliations.

