Abstract
Indigenous communities on the Pribilof Islands have longstanding cultural and economic ties to their marine ecosystem and, in particular, to laaqudan (in Unangam Tunuu) or northern fur seals (NFS; Callorhinus ursinus). Indigenous and Local Knowledge holders from the Pribilof Islands have long expressed concerns about declines in NFS abundance, and research increasingly suggests that nutritional limitation is a key factor in the decline. Using a co-production of knowledge approach, we explore perceptions of NFS ecology and commercial fishery interactions in the Pribilof Islands Marine Ecosystem (PRIME). We synthesize results from community surveys and analyses of commercial pollock (Gadus chalcogrammus) fishery catch data from 2004–2018 relative to documented NFS foraging areas. Community survey results highlighted ecosystem changes and nutritional limitation as primary drivers of recent declines in Pribilof Islands NFS. Consistent with these results, pollock catch data indicate there are concentrated areas of pollock harvest over time near the Pribilof Islands where female NFS forage. These results reinforce the value of considering Indigenous and Local Knowledge and western science together to better understand ecosystem interactions. Our findings also support the consideration of Indigenous and Local Knowledge-based approaches in combination with spatiotemporal management to mitigate NFS nutritional limitation and Pribilof Islands NFS declines.
1. Introduction
1.1. The Pribilof Islands Marine Ecosystem (PRIME)
Coastal areas in the Bering Sea are home to more than 70 Alaska Native communities of the Iñupiat, Central Yup’ik, Cup’ik, St. Lawrence Island Yupik, and Unangan Peoples [1,2], diverse fish, seabird and marine mammal populations [3], as well as some of the world’s largest commercial fisheries [4]. The region surrounding the Pribilof Islands includes a unique hydrographic domain that is oceanographically distinct from the surrounding Bering Sea shelf waters and is key to the overall structure and function of the broader Bering Sea marine ecosystem [5,6,7]. Primary production associated with the bathymetry and oceanographic fronts around the Pribilof Islands provides enhanced feeding opportunities for higher trophic level species that support traditional activities such as hunting and harvesting [7,8,9,10]. In this study, we define this productive region as the “Pribilof Islands Marine Ecosystem (PRIME)”. The minimum extent of the PRIME is an area encompassing 100 nautical miles (nm; ~185 km) around the islands. This boundary is based on Indigenous Knowledge (IK–held exclusively by Indigenous Peoples; see Section 2.2), Local Knowledge (LK–held by Indigenous and/or non-Indigenous individuals; see Section 2.2), physical oceanography, and ecosystem modeling [6,7,8,9,11,12,13] (Figure 1).

Figure 1.
Map showing northern fur seal (NFS) outermost boundary of all meta-home ranges (MHRs) as defined by Robson et al. (2004) around St. George and St. Paul Islands, Alaska (black dashed polygon), and the 0–50 nm and 50–100 nm subzones of the Pribilof Islands Marine Ecosystem (PRIME, black solid polygons). The Pribilof Islands Habitat Conservation Zone (PIHCZ) is shown as a solid white line.
The eastern Bering Sea (EBS), including the PRIME, is experiencing biotic and abiotic changes at unprecedented rates. IK and LK holders from the Pribilof Islands have described changes in terms of extremes: warmer summers, reduced sea ice extent, longer and colder winters, stronger storms in winter, major declines in NFS, and changes in the distribution of fish species [12,13]. Winter sea ice extent in the Bering Sea in 2018 and 2019 was at the lowest levels on record, and the region exhibited warming trends not predicted to occur by regional climate models for another 10–15 years [14]. These exceptional warming conditions are impacting species at all trophic levels and are occurring at an order of magnitude capable of reorganizing ecosystems [6,15,16].
While climate change has been directly linked to changes in distribution, abundance, and body condition of some fish species, seabirds, and marine mammals [16,17,18,19,20], these linkages are not as well-established for NFS, a cultural keystone species for Pribilof Islands Unangan [21]. The Eastern Pacific stock of NFS is declining [22], and the current breeding population is estimated to be roughly one quarter of the historic maximum [22,23]. Ongoing NFS declines in the Pribilof Islands have significantly impacted the communities on St. Paul and St. George, which remain inextricably connected with marine resources as a cornerstone of Unanga culture, economy, and subsistence ways of life.
The EBS (which encompasses the PRIME) supports large- and small-scale commercial fisheries and small-scale subsistence fisheries. In addition to flatfish, crab, and Pacific cod (Gadus macrocephalus) fisheries, the EBS is home to the walleye pollock (Gadus chalcogrammus) fishery, the largest trawl fishery in the world. The pollock fishery has an expansive footprint in the EBS, and pollock first wholesale value (first sale after initial processing) averaged $1.34 billion annually from 2015–2018 [24]. From 2004–2018, an estimated total of 18.8 million tons (t) of pollock were harvested in the EBS (annual average 1.25 million t) [24]. The annual pollock fishery is divided into two seasons: the A-season, running from 20 January into April; and the B-season, running 10 June to 1 November. B-season harvests, which coincide with the NFS breeding season on the Pribilof Islands, account for approximately 55% of total annual pollock harvests [24].
In this study, we use a co-production of knowledge (CPK) approach to provide a more integrated understanding of factors contributing to the NFS decline over time, potential direct and indirect stressors to NFS and Pribilof Islands communities, and impacts on broader ecosystem function and health. Specifically, we consider: (1) survey results from Pribilof Islands community members; and (2) spatial analyses of pollock fishery data in the context of NFS foraging areas defined by Robson et al. (2004) and PRIME boundaries [6,7,8,9,11,12,13]. The combination of methodologies provides context for observed trends and patterns by evaluating multiple ways of knowing (IK, LK, western scientific data) to investigate complex ecosystem-level concerns in the EBS.
1.2. Pribilof Islands Communities and Laaqudan (Northern Fur Seals)
Historically, the Pribilof Islands were not inhabited but were used by Unangan as marine mammal and seabird hunting grounds [21]. In 1787, 137 Unanga hunters were forcibly removed from their permanent villages in the Aleutian Islands and relocated to the Pribilof Islands to harvest NFS pelts as a source of income for the Russian government [21]. The U.S. purchased Alaska from Russia in 1867, and the federal government continued operating the commercial NFS harvest, relying on Unanga laborers, until commercial activities ceased in 1974 on St. George and in 1984 on St. Paul [25].
The present-day communities of St. Paul and St. George remain reliant on NFS for food, crafts, and as a central element of cultural and community health and wellbeing. Traditional hunting (with a firearm) and harvesting (without a firearm) are conducted pursuant to formal co-management agreements between the National Marine Fisheries Service (NMFS) and the Tribal Government of St. Paul [26] and the Traditional Council of St. George Island [27], respectively. The Ecosystem Conservation Office (ECO) on each island organizes and manages hunting and harvesting activities and works with community volunteers and experienced sealers to support traditional activities related to NFS. The Tribal co-managers also conduct NFS research in collaboration with federal, state, and academic scientists.
The Eastern Pacific stock of NFS once numbered more than 2 million animals [28,29]. Commercial harvests of NFS during the 18th to 20th centuries, including directed culling of females, contributed to long-term fluctuations in the abundance of the Pribilof Islands segment of the NFS population [29,30,31,32]. After a brief period of stability and recovery from the early 1980s to the mid-1990s, the population entered a new period of decline that continues today and remains largely unexplained and unmitigated by current management measures [23,33]. The stock was listed as depleted under the Marine Mammal Protection Act (MMPA) in 1988 after declining to less than 50% of historic population levels [28,29].
The portion of the Eastern Pacific stock breeding on the Pribilof Islands is currently estimated to be approximately 458,500 animals [22,23]. In recent decades, declines in pup production have continued on St. Paul Island, but no significant trend has been observed across St. George rookeries since approximately 2002 [22]. The designation as depleted required development and implementation of a conservation plan. That plan was originally created in 1993 and last updated in 2007; it has thus far failed to halt and reverse the decline of the population. The only relevant conservation measure currently in place within the PRIME is the Pribilof Islands Habitat Conservation Zone (PIHCZ; Figure 1); it was established in 1995 to the north and east of the Pribilof Islands to protect areas that are biologically important to certain crab stocks and, as a secondary objective, to reduce potential fishery interference with seabird and marine mammal populations [34]. The PIHCZ has not been formally evaluated since its implementation to determine if any conservation benefits have been realized.
During the winter months, adult NFS are generally pelagic and spend as much as 80% of their time at sea [35]. During the summer breeding season, NFS are central place foragers [36,37]. Females give birth to a single pup at terrestrial breeding rookeries (the central place), typically in July and August, and then undertake foraging trips at sea, interspersed with regular visits to the central breeding site on land to nurse their dependent offspring [38,39,40,41,42,43,44]. This central place foraging behavior continues from July to November annually, at which time most NFS begin overwintering migrations to the broader North Pacific [39].
NFS satellite tracking and diet studies conducted on the Pribilof Islands suggest that “rookery complexes’’ associated with distinct at-sea foraging areas exist on the western and eastern coasts of St. Paul Island, and to a lesser extent on the northern and southern coasts of St. George Island [38,40,41,44]. Zeppelin and Ream (2006) used a primary prey frequency of occurrence analysis to summarize scat samples of NFS across rookeries from 1987–2000 and found that NFS diets were dominated by walleye pollock at all rookery complexes. Pollock accounted for 68–74% of NFS diets at rookeries along the western side of St. Paul Island. Conversely, southern St. George rookeries were relatively less reliant on pollock, which constituted 43–48% of NFS diets [40,45]. Although juvenile pollock (age 0–2) was the most common prey item, adult pollock (e.g., age 3–5+) were also found in both NFS scat and spew (regurgitation) samples at all locations [40]. Gudmundson et al. (2006) also found that larger (i.e., older) pollock and gonatid squid are relatively more common in spew versus scat samples, indicating that sample-type is an important consideration when evaluating the species and size composition of NFS diets.
2. Materials and Methods
2.1. Co-Production of Knowledge Approach
In the development and execution of this research, the authors were guided by principles of co-production of knowledge (CPK). While a full description of the ways in which we sought “true partnership and equity, to enhance, learn, and create new understandings” [46] is beyond the scope of this article, some explanation is warranted. Initially, the research that led to this manuscript was borne out of a series of conversations and collaborations through which the authors and others in their organizations and community identified common concerns and a desire to better understand them. Published literature [12,13], known community needs, and an evaluation of available skills and capacities led to a narrowed focus on spatial analyses as understood by quantitative description and community knowledge understood by qualitative description. From that point, the methodology was co-developed, and the research completed.
The process was not seamless, and there were many difficult conversations and misunderstandings. It was not always apparent whether the quantitative analysis or community dialogue might be overly directive; nor was it a straightforward process to identify ways to interrelate the analyses. Even once a methodology was defined, the words used to describe both the project and the collaboration were not always easy to find. Several other authors have proffered descriptions or definitions of the term “co-production of knowledge” and the ways in which it can be pursued [46,47,48,49,50,51]. We do not offer an opinion about whether this project “counts” as defined in those or other documents and echo the sentiment that “it is far more important to do co-production than it is to talk about it or label things as it” [46].
2.2. Knowledge Systems
For purposes of this project, we define IK as,
A body or system of knowledge that any Indigenous person has. This is in contrast to Traditional Knowledge which is specialized knowledge, with a strong connection to heritage, on a topic or topics. Indigenous Knowledge is a broader term, which encompasses Traditional Knowledge as well as other forms of knowledge. All Indigenous Peoples have Indigenous Knowledge, but only some of them have Traditional Knowledge [52,53].
We define LK as,
The knowledge of Indigenous or non-Indigenous individuals obtained through experiential engagement with a place. LK may encompass language, systems of classification, resource use practices, social interactions, ritual, and spirituality [54].
Pribilof Islands community members represent a unique coalescence of different knowledge systems (IK, LK and western science). Ways of knowing in the Pribilof Islands are interconnected, based on community members’ interactions with one another and with western science and information. This diversity and these linkages in knowledge systems in the Pribilof Islands lend themselves to layered and meaningful analyses of community knowledge and experience.
2.3. Community Surveys
All community members of St. Paul and St. George were invited to complete a 15-question survey (Supplementary Materials Survey S1) via a Google form during July to October 2020. Respondents who did not have access to the online survey were invited to participate over the phone so that their answers could be transcribed into the Google form by the project team and incorporated into the study. Prior to dissemination to the communities, questions were reviewed and approved by a board of St. Paul Tribal members. The sampling method was non-random [55] and targeted all residents on both islands. All participants reviewed a consent form that included the background, goals, objectives, and risks of the study before completing the survey; each participant provided free, informed, and prior consent before completing the survey form, consistent with the ethical standards of human subjects research.
Basic demographic data were collected for each respondent. For instance, a respondent had the option to identify Residency Status (i.e., a community member currently living on St. Paul, “St. Paul Resident”, versus a community member currently living off island, “St. Paul Non-Resident”), Tribal Affiliation, Age, Gender. “Non-Resident” individuals currently live off-island but historically resided on-island and spent the majority of their lives living on-island. Tribal Affiliation denotes community members currently identified as Tribal Members (not all community members are directly affiliated with the Island’s Tribe). Results from the demographic data are summarized in Appendix A Table A1.
In addition to collecting basic demographic information, survey questions were focused around three primary themes: (1) perceived reasons for NFS declines; (2) personal and community impacts as a result of NFS declines; and (3) the relative importance of the 0–100 nm zone around the islands (defined as the PRIME). Survey question formats included Likert scales, multiple choice, and open-ended questions [56,57,58]. Survey responses were compiled and uploaded into Atlas.ti (Atlas.ti Scientific Software Development GmbH, Berlin, Germany). Survey data were inductively coded in Atlas.ti using a grounded theory approach to understand participant perceptions [59,60]. Grounded theory techniques are used to develop codes (Table A2), which can be grouped based on inter-relationships and organized into broader themes [59,61]. Code frequency and co-occurrence were analyzed to identify code and theme commonalities across community respondents. Likert scale responses were evaluated for statistical differences in distribution between demographic groups (e.g., age, sex, residency status) using a non-parametric rank-based Kruskal–Wallis test [62,63]. Due to the complex and integrated nature of the knowledge systems considered in this research (IK, LK), the authors did not attempt to identify the specific type of knowledge associated with each respondent based on demographic information.
2.4. Spatial Extent of the PRIME Relative to NFS Foraging Dynamics
The minimum extent of the PRIME is defined as an area extending 100 nm (107,754 km2) from a point located at approximately the center of the Pribilof Islands (57° N, 170° W) [6,7,8,9,11]. We subdivided the PRIME into a 0–50 nm sub-region (26,938.4 km2) that is broadly representative of the hydrographically defined Pribilof Domain [7] and a surrounding 50–100 nm sub-region (80,815.6 km2) that supports the additional energetic requirements of central place foraging species such as NFS and seabirds that breed on the Pribilof Islands [11]. Within the larger 0–100 nm area, the Pribilof Domain [7], approximated by the 0–50 nm sub-region of the PRIME, is uniquely characterized by the clockwise flow of currents around the Pribilof Islands, heightened primary and secondary productivity, and increased advection and mixing of the water column [5,7,11]. The 0–100 nm spatial extent of the PRIME also coincides with the median foraging trip distance of lactating female NFS [11,38,64] and was proposed by Ciannelli et al. (2004) as the minimum extent of the PRIME based on ecosystem energetics. The maximum extent of the PRIME may be indicated by the full extent of female NFS foraging distance (Figure 1).
We additionally subdivided the PRIME into at-sea foraging areas associated with distinct breeding populations. Robson et al. (2004) used satellite telemetry to examine spatial segregation of foraging habitats among lactating female NFS during the 1995 and 1996 breeding seasons. A 95% fixed kernel home-range model [65] was used to calculate a Meta-Home Range (MHR) area as a spatial measure of habitat use among NFS from each breeding area, in which there is more overlap among members of each MHR than among members of different MHRs (Figure A1). Foraging areas associated with rookery complexes and islands have remained relatively consistent over time [41,44], and subsequent satellite tracking studies have shown markedly consistent patterns of spatial segregation within and between islands during periods of differing environmental conditions [41] and continued declines of the Pribilofs NFS population [44]. The size and location of foraging areas identified in previous studies vary according to methodology, sample size, and natural variability. We consider the MHRs from Robson et al. (2004) as an approximation of the foraging area for associated breeding colonies.
2.5. Commercial Pollock Harvest Data
Pollock catch data from 2004 to 2018 were obtained from the National Marine Fisheries Service (NMFS) Catch Accounting System. To preserve vessel confidentiality, NMFS aggregates vessel and catch data into hexagons measuring approximately 20 km by 20 km (346 km2). B-season pollock landings (tons, t) were summed per hexagon for a given date (standardized as the average of recorded fishing start and end times). Some catch data were excluded due to data confidentiality requirements, including motherships, which comprise a relatively small portion (<10%) of reported pollock catch overall. Pollock catch data during the B-season were analyzed within: (1) the 0–50 nm and 50–100 nm sub-regions; and (2) the entire EBS fishery management area. Within the PRIME, catch data were aggregated by both NFS MHRs and sub-region. For reference to the original Ecopath model by Ciannelli et al. (2004), pollock harvest data for 100–150 nm zone were calculated and reported when appropriate.
Pollock catch data in the PRIME were assessed using three primary approaches: (1) evaluation of temporal pollock harvest (t) trends in MHRs; (2) estimation of average harvest intensity (t/km2) in MHRs; and (3) identification of pollock catch hotspots. Temporal trends in pollock harvests (t) by PRIME sub-regions and MHRs were evaluated using a linear modeling (LM) framework in R Statistical Software (R version 3.3.2 [31 October 2016]):
The response variable, pollock catch aggregated by hexagon grid (tons per hexagon), was log-transformed: denotes the intercept; denotes the linear trend in the explanatory variable (year); and denotes the error [66]. Total pollock landings (t) were also summed by MHRs and PRIME sub-regions and area-standardized (t/km2) to allow for comparative evaluations of “harvest intensity” in smaller areas relevant to NFS rookery complexes and to local communities.
Pollock harvest “hotspots” over time within the PRIME were identified using the ArcGIS Emerging Hot Spot Analysis Tool [Space Time Pattern ArcGIS Pro 2.8.3]. With this approach, data are aggregated into space–time bins and packaged into a NetCDF file (a file format for storing multidimensional scientific data). Space–time cubes enable analyses of catch data in three dimensions with the positions represented on the x and y axes and the years represented on the z axis [67]. Space–time cubes were analyzed using the Getis Ord Gi statistic (ESRI 2019), which considers the value of each bin within the context of neighboring bins and the Mann–Kendall test which compares each bin value with that of previous years [67,68]. Emerging Hot Spot Analysis accounts for the consistency and intensity of each time step in the classification of a significant hotspot. Three categories of hotspots were classified based on the ESRI (2021) classification scheme: (1) “persistent” (a location that has been a statistically significant hotspot for 90% of the time-step intervals with no discernible trend indicating an increase or decrease in the intensity of clustering over time), (2) “intensifying” (a location that has been a statistically significant hotspot for 90% of the time-step intervals, including the final time step and intensity of clustering of high counts in each time step is increasing overall and that increase is statistically significant), or (3) “variable” (a location that is an on-again, off-again hotspot; none of the time-step intervals have been statistically significant cold spots) [68]. Five-year intervals were used for neighborhood time steps for adjacent spatial neighbors [68].
3. Results
3.1. Community Surveys
Thirty-eight surveys were completed either online or with assistance from the project team for those without access to the internet. Forty-five percent (45%) of respondents were younger than 35, 34% were between 35 and 55 years old, and 21% were over 55 years old. The majority of respondents were St. Paul residents and St. Paul Tribal members (Table A1), consistent with the differing population sizes of the two islands (395 people currently reside on St. Paul Island, and 76 people currently reside on St. George Island) [69]. Differences in responses based on age group, Tribal affiliation, residency, and gender were not statistically significant for Likert survey questions (Kruskal–Wallis test; p > 0.05), thus we generally provide results compiled across all demographic groups.
Forty-five codes were identified and refined through iterative thematic coding of the surveys (Table A2). Results are presented in accordance with three primary identified themes, according to the organization of survey questions and dominant responses received: (1) reasons for the NFS decline; (2) importance of the 0–100 nm PRIME to NFS; and (3) personal and community/cultural impacts of the NFS decline. Additional code co-occurrence relationships are explored within the three overarching themes identified.
3.1.1. Reasons for the NFS Decline
In response to the open-ended survey question, “Why do you think NFS are declining?” the most stated reason was nutritional limitation (Table 1A). Nutritional limitation as an ultimate cause co-occurred with changing “NFS foraging areas/distribution of prey”, “competition for prey”, “trawling”, “unspecified or general ecosystem changes/impacts”, “impacts to mothers and pups”, “fisheries-related ecosystem changes/impacts”, and “climate-related ecosystem changes/impacts” (Table 1B).

Table 1.
Co-occurrence frequency for four themes explored in community surveys: (A) “Reasons for the northern fur seal (NFS) decline”, (B) “Nutritional limitation”, (C) “Vessel impacts on northern fur seals (NFS)”, and (D) “Importance of the 0–100 nm Pribilof Islands Marine Ecosystem (PRIME)”.
Of the 38 responses discussing reasons for the NFS decline, 19 respondents (50%) included the word “food”, referring to NFS experiencing a food shortage, lack of access or difficulty finding food, searching longer and farther for food, or competition with commercial fisheries for food. Responses were interconnected, reflecting the multifactorial nature of both direct and indirect factors contributing to the NFS decline. For example, respondents noted that climate change-related ecosystem impacts that result in changes in prey distribution were a driver for NFS declines: “I think they’re [NFS] traveling further north than they used to because of the warming waters causing the fish to move north”. One respondent linked ecosystem-level changes (i.e., prey distribution) to competition for prey (i.e., large-scale fishing activities): “Access to prey and change of distribution of prey is impacted by large fisheries. This leads to reduced [food] availability [for NFS]. Pollock fisheries take their [NFS] main food source, walleye pollock, while maintaining a presence disturbing their habitat”. Another stated, “I believe the factory trawlers chasing pollock are competing directly with the NFS, especially [during] the summer season”.
Regarding fisheries-related factors, respondents were specifically asked about “vessel impacts on NFS” as they related to both vessel presence and fishing activities. “Vessel impacts on NFS” co-occurred with fisheries-related factors such as “competition for prey”, “trawling”, “bycatch” or “acoustic disturbance” (Table 1C). Of the responses that related the NFS decline specifically to impacts from vessel presence and fishing activities, many statements contained multiple explanations, such as, “Fishing the seals’ food, noise, possible debris”, and, “Vessels pollute the water, fish for the seals’ resources, and can even harm the seals’ bodies”. One respondent explained, “[Vessels are] introducing chronic pollution that can lead to entanglement and ingestion of microplastics”.
3.1.2. Importance of the 0–100 nm Pribilof Islands Marine Ecosystem (PRIME)
Nearly all respondents, irrespective of age, Tribal affiliation, or residence status ranked the PRIME as important for NFS (26 responded with a Likert Scale 5, indicating “critically important to NFS”; 10 responded with a Likert Scale 4, indicating “more important than other areas”; Table A3). The PRIME commonly co-occurred with other factors including “essential NFS foraging habitat”; “impacts to mothers, pups, or breeding ecology”; “NFS site fidelity”; and “changing NFS foraging areas or distribution of prey”, “nutritional limitation”, “unspecified/general ecosystem-level changes/impacts”, and “need for conservation or protection” (Table 1D). In an open-ended follow-up question, respondents highlighted the PRIME as the “range of feeding” for NFS, “the area [NFS] reside and feed in”, and “the ideal place for seals to find food.” The consistency across responses to this open-ended question suggested broad agreement that this area has been important for NFS over time.
Responses discussing the changing NFS foraging areas or distribution of prey most often referred to NFS having to forage further than the boundary of the PRIME more often because less food is available closer to the islands (i.e., within 0–100 nm). For example, one respondent stated, “[NFS] pup mortality may be based on the mothers [that] have to venture further and longer for food, leaving the pup alone without nourishment for longer periods. They [NFS pups] have to travel out to open water in the fall, and if malnourished, less will live”. Another stated, “They [vessels] are too close to the island taking away all the resources they [NFS] would have close, [seals] have to travel far now”.
3.1.3. Community/Cultural and Personal Impacts of NFS Decline
Regarding impacts to the community, most respondents (26) ranked the NFS decline as either having “some impact (Likert Scale 4)” or “significant or major impact (Likert Scale 5)”(Table A3). Respondents 35 years old or younger were more likely to respond with a “neutral” or “some impact” response (mean score of 3.6), while respondents older than 35 were more likely to respond with “some impact” or “significant or major impact” (mean score of 4.1).
Thirty-four respondents related the NFS decline to “community/cultural impacts”, and 21 respondents related the NFS decline to “personal impacts”. “Community/cultural impacts” and “personal impacts” also co-occurred frequently, indicating the strong linkage between individual and community and culture. “Community/cultural impacts” most often co-occurred with “traditional activities/food”, “NFS as a food resource”, “food security”, and “ecosystem impacts” (Figure 2). Responses included concern for cultural continuity across younger generations, as reflected in an earlier quotation (“I’m worried about the new generation not being able to subsistence hunt…”) and, “I worry for my children’s connection to the island–fur seals are a foundation of our [Unangan] relationship to St Paul”. Respondents discussed declining access to NFS as a traditional food impacting food security; for example, one respondent stated, “[There are] limited seals to fill freezers, especially with so many that are dependent on [NFS]”.
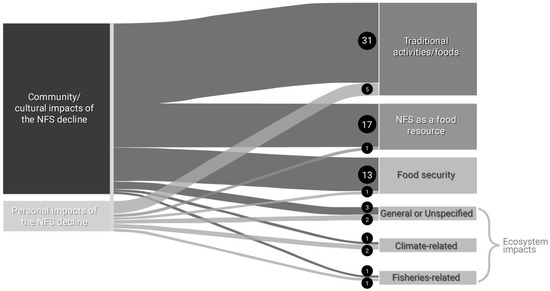
Figure 2.
Sankey diagram depicting the co-occurrence frequency of “personal impacts” and “community/cultural impacts” with aspects of the NFS decline in the Pribilof Islands, Alaska. Numbers in and size of black circles denote the frequency of co-occurrences between codes.
Impacts to community and culture associated with NFS declines were a common concern among respondents. One respondent stated, “NFS is a traditional food source and a cultural focus (clothes were made from seals, stories are told about seals). With the decline of the seal population there has also been a decline in people eating fur seal, … the loss of any traditional food resource is tragic for the community”. Other respondents discussed how traditional activities are changing, “It’s tougher to find the ‘desired’ age and size seals that we want to harvest. Also just hard for folks like me who have seen the decline happen over the last 30 years;” and, “[The NFS decline] is impacting the culture and the nutrition of our people. An animal that used to be the main staple of our diets is now treated as a delicacy, and it’s becoming a race to get seal during the summer”.
Respondents who made the connection relating “personal impacts” and “community/cultural impacts” of the NFS decline to “ecosystem changes/impacts” (Figure 2) emphasized the significance of the health of the Bering Sea to local well-being. For example, one respondent stated, “It’s been a clear decline over the decades of seeing the rookeries dwindling. If their [NFS] complete loss here [The Pribilof Islands] happens that will be detrimental to our subsistence status and the Bering ecosystem”. Another stated, “The fur seal decline is a visible example of climate change in my town”, highlighting how some respondents linked the NFS decline to observed climatic changes.
3.2. Spatial Catch Data for EBS B-Season Pollock Harvests, 2004–2018
B-season pollock harvests (t) in the EBS annually averaged approximately 659,000 t from 2004–2018 and were relatively stable, with the exception of low harvests in 2008–2010 due to pollock biomass declines. B-season pollock harvests were highest in the EBS in July and August each year. Total estimated B-season harvests in the PRIME MHRs 2004–2018 averaged 121,342 t annually (total overall 1.82 million t) and accounted for approximately 18.4% of overall B-season EBS harvests. Pollock fishery data in the PRIME were evaluated at three levels: (1) temporal trends in MHRs (LMs); (2) average harvest intensity (t/km2) in MHRs; and (3) identification of pollock catch hotspots in the PRIME (ArcGIS Emerging Hotspot Analysis).
3.2.1. Temporal and Harvest Intensity Trends in the PRIME
Annual B-season pollock harvests from 2004–2018 within MHRs showed no significant trend over time in the 0–50 nm sub-region (LM; p > 0.05; Figure 3; Table 2A), with an average catch of 39,252 t/year (range = 3045–80,120 t/year). In contrast, annual harvests increased significantly in the 50–100 nm sub-region over time (LM; p < 0.05; Table 2B; Figure 3), averaging 82,090 t/year (range = 19,771–162,195 t/year). Total B-season pollock harvests within the 0–50 nm and 50–100 nm sub-regions accounted for approximately 6.0% and 12.5% of total B-season EBS removals, respectively. Refining in scale to MHRs, several MHRs experienced increasing annual catch over time within the 50–100 nm sub-region including the “All”, “St. George” and “SW St. Paul” MHRs (LM; p < 0.05, Table 2B).
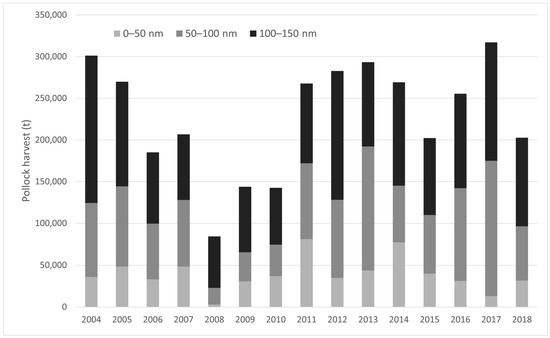
Figure 3.
Annual B-season pollock harvests for MHRs within the 0–50 nm sub-region, 50–100 nm sub-region, and 100–150 nm zone (outside the PRIME) from the Pribilof Islands, 2004–2018.
Table 2.
Area (km2) that encompasses each meta-home range (MHR) and harvest intensity (average annual tons (Avg t) pollock harvested per km2) for: (A) 0–50 nm and (B) 50–100 nm MHR sub-regions. Percentage change represents linear model (LM) coefficients and confidence intervals, and p-values for each sub-region. MHR sub-regions with statistically significant p-values (p < 0.05) are shaded gray. * Indicates MHR sub-regions with statistically significant p-values (p < 0.05).
Highest harvest intensity (t/km2) occurred in July and August for all MHRs. The highest harvest intensities occurred within the 0–50 nm sub-region in “SW St. Paul” and “St. George” MHRs (Table 2A). High harvest intensities were also observed during the study period in the 50–100 nm sub-region where “All” MHRs overlap inshore of the Pribilof Canyon (Table 2B, Figure 4).

Figure 4.
2004–2018 B-season pollock harvest (t) showing meta-home ranges (MHRs) for lactating female northern fur seals (NFS) overlaid, and showing pollock harvest (t) for the entire eastern Bering Sea (inset). SW SNP = MHR representing southwest St. Paul rookeries, NE SNP = MHR representing northeast St. Paul rookeries; STG = MHR representing St. George rookeries; All = MHR representing overlapping use area from all rookeries. Gray circles are labeled at the 50 nm and 100 nm zones around the Pribilof Islands, and the Pribilof Islands Habitat Conservation Zone (PIHCZ) is pictured.
3.2.2. Pollock Catch Hotspots in the PRIME
Pollock harvests were evaluated to identify commercial fishery hotspot areas in the PRIME. Hotspots in this analysis are represented by adjacent and clustering hexagon grid cells that met ESRI-defined hotspot criteria [68]. There were three distinct hotspot areas of B-season pollock removals observed over the study period (Figure 5). There were two hotspots southwest and southeast of the Pribilof Islands spanning the 0–50 nm and 50–100 nm sub-regions. The third, smaller hotspot occurred west-northwest of the Islands in the 50–100 nm sub-region. Together the three hotspot areas encompass 10,392 km2 and account for 41.3% of total PRIME and 7.6% of total EBS B-season catch. Consistent with relative harvest intensity values (Table 2; Figure 5), hotspots occurred in the “SW St. Paul”, “St. George”, “SW St. Paul & St. George” and “All” MHRs in the PRIME (Figure 4).

Figure 5.
Three hotspot areas, categorized as intensifying, persistent, and variable, identified in the Pribilof Islands Marine Ecosystem (PRIME). The Pribilof Islands Habitat Conservation Zone (PIHCZ) is pictured.
3.2.3. Pollock Catch outside the PRIME
From 2004–2018, there was substantial pollock catch within NFS MHRs and immediately outside the PRIME (100–150 nm from the centroid of the islands; Figure 3), annually averaging 106,962 t and accounting for 16% of overall B-season catch (Figure 4). Total harvests in the 100–150 nm sub-region exhibited no trend during the study period (LM; p > 0.05). Two zones of high pollock catch outside the PRIME were evident in the B-season pollock fishery (catch within 0–100 nm is addressed in Section 3.2.1). The first zone occurred northwest of the Pribilof Islands running parallel to the continental shelf around 57° N–59° N and 174° W–177° W in the vicinity of Zhemchug Canyon (Figure 4). The second area of high pollock catch outside the PRIME occurred north of Unalaska Island, north-northwest of Unimak Pass and False Pass around 54° N–56° N and 164° W–166° W (Figure 4).
4. Discussion
Weaving together multiple ways of knowing enables communities and western scientists to better understand the ecological and socio-cultural implications of the changing PRIME ecosystem for Pribilof Island communities, NFS, and the broader EBS. Overall, St. Paul and St. George Tribal and community members pointed to climate- and fishery-related ecosystem changes (both of which are indirect effects leading to nutritional limitation and were often specifically linked by respondents to competition with large-scale industrial fisheries), as primary drivers of NFS population declines on the Pribilof Islands. Impacts to food security and traditional activities, such as harvesting of NFS and other wildlife resources in the Bering Sea, were predominant within the community and personal impact themes from the surveys. Consistent with community perceptions of fishing activity in proximity to the islands, harvest intensity (t/km2) was high and persistent in three regions of the PRIME. The importance of the PRIME to NFS foraging during the breeding season has been well-documented in scientific literature [11,38,41,44,70,71] as well as by IK and LK holders in the Pribilof Islands [12,13]. High pollock harvests in July and August, combined with IK and LK related to NFS behavior and demographics, reinforce the linkages between pollock catch as an indicator of prey removal and indirect effects contributing to NFS nutritional limitation [13,32,71].
4.1. Nutritional Limitation and Climate Change-Related Ecosystem Changes/Impacts
Nutritional limitation was the most commonly identified driver of NFS declines in community surveys and was often linked to competition for prey with fisheries. Nutritional limitation was also linked to depletion of prey resources due to climate-related or general ecosystem changes/impacts, including reduced prey abundances and/or shifting prey distribution. Nutritional limitation can result from reduced access to prey due to localized depletion or disturbance of fish stocks and/or reduced abundance of preferred prey species that results in either the quantity or quality of food being insufficient for the recovery or maintenance of a population [72]. NFS nutritional limitation can be manifested directly as starvation and/or indirectly as reduced reproductive success or increased susceptibility to disease [73].
Climate change-related ecosystem changes/impacts were the second most common reason for the NFS decline articulated by community members. One community member stated, “Ocean temperatures and environments are changing and affecting the seals’ food source. They’re not finding enough food to survive”. Pollock is a key component of NFS diets on the Pribilof Islands [64,70,74,75]. Research suggests pollock distribution and productivity has been and will continue to be impacted by climate change [76,77,78]. In addition to changing distributions, the EBS is projected to continue warming [17,79,80,81], and simulations under two future emissions scenarios predict unfished pollock spawning stock biomass in the EBS could decline by as much as 47–70% by 2100 [82]. During periods of reduced pollock availability or abundance due to poor year-class survival and/or poor body condition, alternate prey resources may be insufficient to replace pollock in NFS diets, especially in rookery complexes in which NFS consistently consume a high proportion of pollock over time [8,42]. Predicted reductions in pollock productivity and/or biomass [82] during successive warm years could have longer-term negative implications for central place foragers constrained by the need to provision dependent offspring, thus negatively impacting lactating female NFS and their pups [40,42,75]. If prey availability is consistently low in the future, NFS may continue to experience long-term declines due to reduced survival of young NFS resulting from diminished ability of post-parturient females to obtain sufficient food [42,71].
Community concerns associated with shifting or declining species due to climate-related changes/impacts also extended to other marine resources important to the Pribilof Islands communities. For example, fishermen from St. Paul have indicated that chagi, or Pacific halibut (Hippoglossus stenolepis), an important traditional resource and focus of a small-scale commercial fishery in the Pribilof Islands, are traveling farther north because it is too warm for them under current conditions near the Pribilof Islands [13,83]. Community surveys, although focused on impacts to NFS, included answers concerning climate change- and fisheries-related impacts to a wide range of species, including birds, fish (Flatfish spp., Pacific halibut, Pacific herring [Clupea pallassi], Salmon spp.) and the “entire food chain” of the EBS. These concerns reflect how intertwined the future of Pribilof Islands Unangan is with the health and biodiversity of the marine ecosystem and show that climate change- and fisheries-related ecosystem impacts extend well beyond single species impacts or concerns.
4.2. Fisheries-Related Ecosystem Changes/Impacts and Competition for Prey Resources
Community respondents linked NFS nutritional limitation to commercial fishery impacts regionally. More than half of the survey respondents discussed nutritional limitation in conjunction with “overfishing”, “trawling”, and/or “competition for prey”. One respondent noted, “Because of the trawlers around here, they [NFS] have to swim farther away to get their food”. As noted above, another respondent stated, “Pollock fisheries take their [NFS] main food source, walleye pollock, while maintaining a presence disturbing their habitat”. The body of scientific evidence in support of this view is growing [32,71,84]. Short et al. (2021) characterized the pollock fishery as “a major new predator” introduced into the EBS ecosystem that directly competes with NFS for high-density aggregations of pollock and leaves fragmented and dispersed schools of pollock in their wake.
The occurrence of hotspots observed in this study implies that the pollock fishery functions in a manner similar to NFS by returning inter-annually to predictable high-density prey aggregations. Data analyses confirm the presence of three distinct hotspot areas of intense localized pollock harvests in the PRIME (Figure 5). The first hotspot occurs in the 0–50 nm sub-region where “St. George” and “southwest St. Paul” MHRs (and their overlapping areas) occur. The additional two hotspot areas primarily occur in the 50–100 nm sub-region, southeast of the Pribilof Islands in the “All” and “St. George” MHRs, and northwest of the Pribilof Islands in the “southwest St. Paul” MHR (Figure 4, Table 2). Pollock harvests remained relatively stable in the 0–50 nm sub-region and generally increased in the 50–100 nm sub-region of the PRIME over the study period (Figure 3, Table 2).
Relatively high localized harvest intensities could result in reduced foraging efficiency for females [32,84,85,86]. Smaller marine mammals, such as pinnipeds, are the most likely to experience negative effects of localized resource depletion as a result of fishery harvests because smaller species acutely balance energy needs, such as nursing, on a shorter time scale and in smaller areas when compared with larger more pelagic marine-mammal species, such as baleen whales [86]. It is possible that localized prey depletion associated with commercial fishery hotspots could differentially impact NFS rookery complexes based on relative reliance on pollock in their diet. For example, the highest frequencies of occurrence of pollock were found in samples from rookeries along the western side of St. Paul Island, where pollock comprised as much as 68–74% of diet [40]. These rookeries have also exhibited some of the steepest declines in pup production since 2004 [23]. Conversely, St. George rookeries exhibit some of the lowest frequencies of occurrence of pollock in diet (43–48%) [40]. Thus, NFS foraging overlap with commercial fishery hotspots in the St. George MHR may be less impactful to St. George Island pup production, which has been relatively stable since 2002 [23]. While this study intentionally focuses on the PRIME, significant pollock harvests in NFS foraging areas outside the PRIME (>100 nm) could also negatively impact prey availability and metabolic demands for lactating NFS.
This study’s analyses focused on NFS interactions with the commercial pollock fishery during the B-season due to identified community concerns and the overlap of the pollock commercial fishery in space and time with lactating female NFS foraging areas [24,32,71,84]. There is, however, the potential for additional NFS-fishery interactions during the A-season (January–May) when NFS are in their pelagic phase, which can extend throughout the Bering Sea as far south as California [35]. While NFS distribution is more dispersed during the winter months, it is possible that remaining adult and/or juvenile NFS in the EBS could be impacted by pollock fishery operations through prey dispersal or reductions in total available prey biomass [32]. The impacts of NFS-fishery interactions during the A-season are likely to be less acute than B-season interactions, especially for central place foraging female NFS provisioning their offspring in July and August.
Recent studies suggest that NFS may have hit a “metabolic ceiling” early in their recent decline (mid-1990s), and reductions in pup production may be a result of this long-term prey limitation [71,84]. Consistent with views expressed by survey respondents, research suggests that high metabolic costs associated with longer foraging trips reduce the energy available for lactation and also likely preclude females from accumulating fat reserves to compensate for periods of poor foraging success [71]. McHuron et al. (2020) concluded that increases in localized prey densities are the most feasible mechanism to reduce maternal foraging effort and consequently increase pup growth rates. Increasing catches in the 50–100 nm sub-region and hotspots of pollock catch documented in the study area suggest that management measures designed to increase prey availability in closer proximity to the rookeries might be considered to reduce foraging trip distance and duration as longer trips adversely impact pup growth [71].
Short et al. (2021) inferred a significant inverse correlation between NFS pup births and total annual pollock catch within a broadly defined NFS foraging area within approximately 300 km (~162 nm) of the Pribilof Islands. Drawing on the bioenergetic modeling from McHuron et al. (2019, 2020), Short et al. (2021) propose that the reduced foraging efficiency of females results in low pup growth rates and lower mass at weaning, leading to reduced first year survival and causing subsequent declines in the Pribilof NFS population. Short et al. (2021) further hypothesize that the pollock fishery catch reduced female NFS foraging efficiency through repeated trawling through high density aggregations of pollock, which effectively reduces the size of pollock schools and disperses prey patches within NFS foraging habitat. The occurrence of persistent hotspots within the PRIME lends support to this hypothesis.
In a management context, competition for prey between upper trophic level predators and commercial fisheries is usually characterized as an “indirect effect”. Indirect effects are typically difficult to prove through western scientific research, and they are identified as possible explanations for species declines by community members who rely on these species for traditional harvesting. This dichotomy highlights the need to better understand and address the indirect effects of commercial fisheries, especially in combination with ongoing changes to marine ecosystems due to climate change.
4.3. Other Considerations in the NFS Decline
In addition to climate and ecosystem-level changes/impacts, survey respondents mentioned a number of direct and indirect factors that contribute to the NFS decline, including: acoustic disturbance, contaminants and pollution, marine debris and entanglement, and predation on NFS [29,87]. These additional direct and indirect factors likely compound the primary factors identified by community surveys and spatial data presented here (e.g., ecosystem changes/impacts, prey competition); the relative contribution of these additional direct and indirect factors to the overall decline of NFS remains undetermined [28,29].
Traditional harvests of NFS (i.e., harvests after the cessation of commercial operations in the Pribilof Islands) by Tribal members are not considered a factor in the broader Eastern Pacific NFS stock decline. Local harvests exclusively target juvenile males and male pups, and harvest levels have remained well below the potential biological removal (PBR) level as defined by the MMPA and established annually by NMFS [22]. Conversely, the long term NFS population decline is considered to be at least partially responsible for declines in the number of NFS traditionally harvested in recent years as tribal members self-limit consumption and opportunities to access NFS become less abundant. For example, one respondent stated, “With the decline in the seal population there has also been a decline in people eating fur seal, too. I don’t know if the two declines are related or are people eating less seal because there are fewer seals, or for other reasons? But the loss of any traditional resource is tragic for a community”. Another predicted, “[We have enough seal] for now but will get worse, the local people [will] not be able to subsistence hunt and collect meat for the winter”.
4.4. Importance of the PRIME to NFS
It is important to note several points regarding the 100 nm boundary of PRIME. First, the boundary is approximately equal to the median foraging distance (97 nm) for lactating NFS during 1995–1996 [38,64]. Second, the circular shape of the PRIME used by Ciannelli et al. (2004) for computational convenience was used in this analysis for consistency with existing scientific information and IK and LK. However, Ciannelli et al. (2004) noted that NFS foraging distances are measured from the rookery of origin, and therefore the actual median foraging distance may slightly exceed the 100 nm boundary. In this regard, an elongated shape defined by the combined circular boundaries measured from the centroid of both St. Paul and St. George Island may better represent the area defined as the PRIME. Importantly, Ciannelli et al. (2004) also noted that the full foraging range of the most distant central-place foragers (e.g., NFS) may better indicate the maximum spatial extent of an open marine ecosystem. The mean maximum distance for foraging trips during the 1995–1996 study was 130.4 nm (~241.4 km), indicating that lactating NFS spent considerable time foraging outside of the 100 nm boundary of the PRIME [11,64]. The mean maximum foraging trip distance reported by Kuhn et al. (2014) for lactating NFS tracked during 2010 was 133.7 nm (247.7 km), a remarkably similar result despite the fact that the population was 1.8 times greater in 1995–1996 than in 2010 [44]. The consistency in foraging distance over time indicates the importance of both the PRIME and more distant foraging areas and may also serve as a useful metric for evaluating measures that may be implemented to increase the allocation of NFS foraging effort closer to the breeding rookeries [71].
Irrespective of age, Tribal affiliation, and gender, survey respondents consistently expressed that the PRIME provides essential foraging habitat for NFS. One respondent noted, “Fur seals haul out and breed on the Pribilof Islands. Once pups are born, mothers need to return to the waters for food to feed themselves and their newborns. The waters 0–100 miles off the coasts of the Pribilofs are critically important because the ideal place for a seal to find food is nearby”. As a species with a remarkable history of management research and experimentation, NFS provide a unique opportunity to develop novel spatio-temporal management approaches.
When coupled with existing literature about the potential nutritional limitations on NFS, the results of the present study indicate that the significant amounts of pollock harvested annually in close proximity to the Pribilof Islands may contribute to the long-term decline at some NFS rookeries. Measures to address the concentration of this catch and including NFS in multi-species stock assessment models for the EBS as recommended by McHuron et al. (2020) should be considered as part of efforts to stabilize the Pribilof Islands NFS population and begin to reverse the population decline.
4.5. Community/Cultural and Personal Impacts
Studies that use detailed community input and the documentation of IK and LK are invaluable when addressing complex ecosystem interactions. Results from the community survey highlighted the community/cultural and personal impacts that the NFS decline has had on food security, traditional activities, and other wildlife resources in the PRIME. The observed pattern in responses is not surprising given the deep interconnectedness among biophysical, spiritual, and emotional health and wellbeing experienced by engaging in traditional activities such as hunting and harvesting or preparing and sharing a traditional meal with family and friends. The dominance of “traditional activities”, “NFS as a food resource”, and “food security” based on co-occurrence frequencies in relation to “community/cultural and personal impacts” underscores the importance of NFS to maintaining food security and cultural continuity in the Pribilof Islands.
The relationship between the overall NFS population decline and the decline of traditional harvest opportunities is complex, as described in survey responses. For example, one respondent described warming waters from climate change and bycatch from trawl fisheries as compounding reasons for the NFS decline and linked the population decline to a reduction in traditional harvests, which has negatively impacted the transfer of IK in the community. Another Tribal member noted that global warming and overharvest of fish was impacting “not only the seals, but the entire food chain,” and expressed a desire to remove seal from their diet to reduce impacts to NFS. These comments highlight the potential for a food security crisis in the Pribilof communities in relation to the decreased availability of NFS and other traditional food resources.
Access to traditional, culturally preferred foods through engaging in traditional harvesting and hunting is especially important in remote areas where access to imported foods (e.g., from the local grocery store) may be limited due to long flight times and distances, canceled flights, and high prices. Even with access to imported foods, traditional foods are central to culture and identity and are critical to achieve food security, as defined by the Inuit Circumpolar Council [88] and the Aleut Community of St. Paul Island (M. Merculieff, pers. comm.). Thus, the decline of NFS has resulted in a myriad of spiritual, emotional, cultural, and non-consumptive impacts, as well as reduced availability of a nutrient-dense traditional food resource. Conservation and recovery of the NFS population on the Pribilof Islands is critical to mitigate these observed impacts as well as future potential individual, community, and cultural impacts.
5. Conclusions
The body of IK and LK reflected in community surveys is consistent with the spatial analyses of pollock harvest presented here and in recent scientific literature [32,44,71,78], and indicates the need to evaluate dynamic (spatiotemporal) management solutions within the PRIME in order to reduce competition for prey with lactating female NFS in close proximity to the Pribilof Islands rookeries. Survey results also highlight the value of IK- and LK-based approaches when evaluating relationships between discrete and diffuse indicators, such as reproductive failure and decreased foraging success, over a period of multiple decades.
There are opportunities for Indigenous and non-Indigenous groups and agencies interested in cooperative management approaches to evaluate linkages between pollock catch and NFS population status. For example, explicit inclusion of NFS predation in multi-species stock assessment models [71], in combination with reductions in spatial harvest intensity within 100 nm of the Pribilof Islands, may result in increased prey abundance closer to rookeries. This, in turn, could result in shorter travel distances and trip durations, and therefore less energy expenditure for lactating NFS. In the short term, this may result in increased pup weights at weaning, which has been shown to be a factor contributing to increased over-winter survival [89]. In the long-term, higher pup survival could result in overall population increases [32].
This study also highlights the need to further investigate the effects of fisheries and climate change impacts on NFS in the context of a changing Bering Sea ecosystem and food web to enhance food security in the Pribilof Islands. These linkages could be evaluated in conjunction with synergistic factors, including competition for prey with fisheries (described above) to develop NFS conservation and recovery strategies designed to address issues of food insecurity and ensure cultural continuity for generations to come.
As one St. Paul resident communicated, “Emotionally, I feel sad to see noticeably less fur seals each year and I have lived here five years but it’s apparent. As a citizen, I wonder why better alternatives or ways are not more part of our culture as humans. I feel like we, as humans, could do so much better”. Survey respondents also discussed the need for conservation measures, such as, “We need to know what threatens seals and their food sources in these waters [0–100 miles] and take steps to protect these waters for the fur seals’ sake”.
Supplementary Materials
The following is available online at https://www.mdpi.com/article/10.3390/jmse10040467/s1, Survey S1: Community survey distributed online to St. Paul and St. George Community Members.
Author Contributions
As a body of work following a Co-Production of Knowledge approach, L.D., M.J.P.W., J.D., M.L. and B.R. contributed to conceptualization; methodology; software; validation; formal analysis; investigation; resources; data curation; writing—original draft preparation; writing—review and editing; visualization; supervision; project administration; funding acquisition. All authors have read and agreed to the published version of the manuscript.
Funding
This research received no external funding.
Institutional Review Board Statement
Ethical review and approval were waived for this study because all study methods were reviewed and approved by the St. Paul Island Tribal Council and/or designated Tribal representatives, which can serve as a substitute for the Institutional Review Board process in the case of Tribally-led research.
Informed Consent Statement
Informed consent was obtained from all subjects involved in the study.
Data Availability Statement
Not Applicable.
Acknowledgments
The authors would like to acknowledge and thank the Unanga communities of St. Paul and St. George Islands, AK, for their strong Indigenous leadership in marine mammal research and monitoring. The Aleut Community of St. Paul Island Tribal Council provided feedback and support throughout this project and to the contributing authors. We especially appreciate guidance and review of early drafts from Paul Melovidov, Aaron Lestenkof, Christopher Tran, Noah Oppenheim, and Marissa Merculieff, as well as four independent reviewers including Henry Huntington, Anna Zivian, and Lowell Fritz. We thank the National Marine Fisheries Service for providing fishery data as well as Patricia Chambers for digital support. The authors also gratefully acknowledge the contributions of two Pribilof Elders: the late Father Michael Lestenkof for discussions leading to the early formulation of the concept of separation of foraging habitats among NFS; and the late Mayor St. George Patrick Pletnikoff for his steadfast and visionary contributions to efforts to protect the Pribilof Islands marine ecosystem. The authors wish to note the difficult but worthwhile efforts that were undertaken by all participants to co-produce this manuscript. In so doing, they strove to develop research questions and methods together, to interpret and understand the data and information collectively and within the context of the communities needs and perspectives, and to produce a document that reflects the understanding and expertise of the communities and the authors, and that respects the existing body of information and science on laaqudan, or northern fur seals. The Aleut Community of St. Paul Island appreciates the expertise, willingness to listen and learn together, and capacity shared by Ocean Conservancy and Community and Ecology Resources, LLC. Ocean Conservancy is grateful to the Aleut Community of St. Paul Island and Community and Ecology Resources, LLC for the trust, sharing, and partnership reflected in this document and the significant investment in the process leading to it. Community and Ecology Resources, LLC is grateful to the Aleut Community of St. Paul Island for the invitation to participate in this process and Ocean Conservancy for support to facilitate full and active participation by all authors. The collaborative approach taken here made the final product much stronger. We hope to carry forward the lessons learned and to provide a meaningful example of the ways in which partnership- and equity-based research can be beneficial.
Conflicts of Interest
The authors declare no conflict of interest.
Appendix A
Table A1.
Community survey respondent general demographics.
Table A1.
Community survey respondent general demographics.
| Demographics Summary | ||
| (A) | Age Category | |
| 18–24 years old | 2 | |
| 25–35 years old | 16 | |
| 36–45 years old | 6 | |
| 46–55 years old | 6 | |
| 56–65 years old | 5 | |
| 66–75 years old | 3 | |
| (B) | Tribal Status | |
| St. George Tribal Member | 5 | |
| ACSPI Tribal Member | 23 | |
| Non–Tribal Member | 8 | |
| Prefer Not to Say | 2 | |
| (C) | Residency Status | |
| St. George Resident | 5 | |
| St. Paul Resident | 30 | |
| St. Paul Non–Resident | 3 | |
| (D) | Gender | |
| Female | 23 | |
| Male | 15 | |
Table A2.
Code groups/themes, code names and definitions for Atlas.ti Codes.
Table A2.
Code groups/themes, code names and definitions for Atlas.ti Codes.
| Code Groups/Themes | Codes | Definition of Code |
|---|---|---|
| Possible reasons for NFS decline | Climate change–related ecosystem–level impact or change | Discussion of climate change and/or warming conditions in the region |
| Fisheries-related ecosystem–level impact or change | Discussion of fisheries-related impacts to the larger ecosystem in the region | |
| General/unspecified ecosystem–level impact or change | Discussion of changing environmental conditions generally in the region | |
| Contaminants | Reference to contaminants impacting NFS declines | |
| Entanglement | Reference to entanglement of NFS in human-made/synthetic materials | |
| Marine debris | Reference to marine debris or garbage impacting NFS declines | |
| NFS emigration | Reference to NFS permanently leaving Pribilof Islands rookeries | |
| NFS winter habitat | Habitat where NFS spend time at sea excluding summer breeding season | |
| Nutritional limitation | Negative impacts to NFS due to lack of food availability | |
| Pollution | Reference to materials or chemicals that contribute to pollution of the environment | |
| Predation on NFS | Mortality of NFS by other animal predators, such as killer whales and Steller sea lions | |
| Decline of shelf forage species (junk food hypothesis) | Reference to reduced prey quality and abundance of shelf forage species | |
| Acoustic disturbance | Anthropogenic sounds in the ocean that negatively impact NFS | |
| Personal and community/cultural impacts | Personal impacts of the NFS decline | Perceived impacts to individuals on St. Paul and/or St. George due to declining abundance of NFS in the Pribilofs. |
| Community/cultural impacts of the NFS decline | Perceived impacts to the community well being of St. Paul and/or St. George due to declining abundance of NFS in the Pribilofs OR perceived impacts to the cultural continuity or ability to participate in traditional and cultural ways of life on St. Paul and/or St. George due to declining abundance of NFS in the Pribilofs. Community and cultural impacts are interdependent and thus combined for the purpose of analysis. | |
| NFS as a food resource | Descriptions of NFS consumption and use it community/cultural diets | |
| Traditional activities/foods | Refers to any activities that are part of traditional and customary way of life for Unangax including aspects of traditional foods and diet, subsistence harvests, etc. | |
| Food security | Statements associated with food security as defined by the Aleut Community of St. Paul Island, including the availability of, or lack of available, preferred resources (including NFS) to tribal members on St. Paul/St. George | |
| Impacts of vessels/fishing on NFS | Community impacts of vessel activity | Perceived impacts of vessel presence and/or activity around the Pribilof Islands on the community |
| Vessel impacts on NFS | Perceived impacts of fishing vessel presence and/or activity on NFS (individual or population level) | |
| Overfishing | Perceived impacts of overharvest of targeted or non-target species specifically or overfishing in general | |
| Trawling | Statements specifically citing trawling or dragging fishery operations | |
| Competition for prey | NFS competing with commercial fisheries for access to prey resources | |
| Bycatch | Impacts to NFS associated with non-target species catch in commercial fisheries | |
| NFS ecology | Impacts to mothers or pups, e.g., fecundity, survival | Consideration of mother and/or pup nutrition and impacts |
| Changing NFS foraging areas or distribution of prey | Changes to NFS primary foraging areas due to environmental changes or moving food resources that force NFS to forage in different areas | |
| NFS diet | Perceived diet composition or dietary preferences for NFS | |
| Importance of 0–100 nm | Perceived importance of the 0–100 nm area around the Pribilof Islands. | |
| Essential NFS foraging habitat | Areas identified as key foraging areas important to NFS foraging | |
| Site Fidelity | Consistency in NFS key foraging habitat over time | |
| Deep sea forage | Perceived NFS habitat preference of deep–sea areas | |
| Local fisheries and revenue | Local fisheries | Refers to small scale local halibut fisheries in the Pribilof Islands |
| Local revenue (fishing, tourism, other) | Statements associated with local revenue considerations or opportunities | |
| Research and conservation | Additional research explanation or need | Areas for additional research needed. |
| Need for conservation or protection | Requests to conserve, protect, limit activities in certain zones as an environmental conservation measure | |
| Long–term observations | Long–term observations (decades plus) regarding the ecosystem or NFS | |
| Perceived dietary preferences of NFS | Fish general | Fish generally as a perceived dietary preference of NFS |
| Flatfish | Flatfish as a perceived dietary preference of NFS | |
| Mollusks/cephalopods | Mollusks or cephalopods as perceived dietary preferences of NFS | |
| Pacific cod | Pacific cod as a perceived dietary preference of NFS | |
| Pollock | Pollock as a perceived dietary preference of NFS | |
| Salmon | Salmon as a perceived dietary preference of NFS | |
| Shellfish general | Shellfish as a perceived dietary preference of NFS | |
| Small forage | Small forage general as a perceived dietary preference of NFS | |
| Seabirds | Seabirds | Text referencing seabirds |
Table A3.
Likert questions and response frequency from community surveys.
Table A3.
Likert questions and response frequency from community surveys.
| Question | Likert Category | ||||
|---|---|---|---|---|---|
| 1 | 2 | 3 | 4 | 5 | |
| Please rate on a scale of 1–5, is this area (0–100 nautical miles) important to northern fur seals? [1 = Not Important at all, 2 = Less important than other areas 3 = No different than other areas, 4 = More Important than other areas, 5 = Critically important to fur seals.] | 1 | 0 | 1 | 10 | 26 |
| Please rate on a scale of 1–5 what impact has the decline of northern fur seals had on our community? [1 = Not at all, 2 = Not much, 3 = Neutral, 4 = Somewhat, 5 = Significant/major impact to our community.] | 0 | 3 | 9 | 15 | 11 |
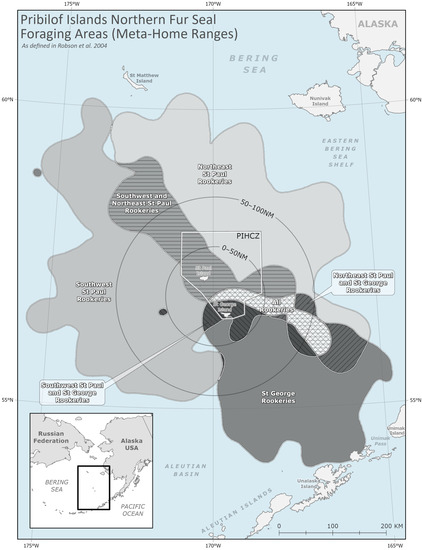
Figure A1.
Meta-home ranges (MHRs) and their overlapping areas as defined by Robson et al. (2004).
Figure A1.
Meta-home ranges (MHRs) and their overlapping areas as defined by Robson et al. (2004).

References
- Kawerak. Our Region—Kawerak. Available online: https://kawerak.org/our-region/ (accessed on 22 January 2022).
- NOAA Arctic Program. Arctic Report Card: Update for 2019. Available online: https://arctic.noaa.gov/Report-Card/Report-Card-2019/ArtMID/7916/ArticleID/850/Voices-from-the-Front-Lines-of-a-Changing-Bering-Sea (accessed on 15 December 2021).
- National Research Council. The Bering Sea Ecosystem; National Academies Press: Washington, DC, USA, 1996. [Google Scholar] [CrossRef]
- Siddon, E.; Zador, S. Ecosystem Considerations 2019 Status of the Eastern Bering Sea Marine Ecosystem; Alaska Fisheries Science Center: Juneau, AK, USA, 2019. [Google Scholar]
- Stabeno, P.J.; Schumacher, J.D.; Ohtani, K. The Physical Oceanography of the Bering Sea; Pacific Marine Environmental Laboratory: Seattle, WA, USA, 1999. [Google Scholar]
- Hunt, G.L.; Stabeno, P.; Walters, G.; Sinclair, E.; Brodeur, R.D.; Napp, J.M.; Bond, N.A. Climate Change and Control of the Southeastern Bering Sea Pelagic Ecosystem. Deep. Res. Part II Top. Stud. Oceanogr. 2002, 49, 5821–5853. [Google Scholar] [CrossRef] [Green Version]
- Hunt, G.L.; Stabeno, P.J.; Strom, S.; Napp, J.M. Patterns of Spatial and Temporal Variation in the Marine Ecosystem of the Southeastern Bering Sea, with Special Reference to the Pribilof Domain. Deep. Res. Part II Top. Stud. Oceanogr. 2008, 55, 1919–1944. [Google Scholar] [CrossRef]
- Sinclair, E.; Loughlin, T.; Percy, W. Prey Selection by Northern Fur Seals Callorhinus ursinus in the Eastern Bering Sea. Fish. Bull. 1994, 92, 144–156. [Google Scholar]
- Brodeur, R.D.; Sugisaki, H.; Hunt, G.L. Increases in Jellyfish Biomass in the Bering Sea: Implications for the Ecosystem. Mar. Ecol. Prog. Ser. 2002, 233, 89–103. [Google Scholar] [CrossRef] [Green Version]
- Swartzman, G.; Winter, A.; Coyle, K.; Brodeur, R.; Buckley, T.; Ciannelli, L.; Hunt, G.; Ianelli, J.; MacKlin, A. Relationship of Age-0 Pollock Abundance and Distribution around the Pribilof Islands, to Other Shelf Regions of the Eastern Bering Sea. Fish. Res. 2005, 74, 273–287. [Google Scholar] [CrossRef]
- Ciannelli, L.; Robson, B.W.; Francis, R.C.; Aydin, K.; Brodeur, R.D. Boundaries of Open Marine Ecosystems: An Application to the Pribilof Archipelago, Southeast Bering Sea. Ecol. Appl. 2004, 14, 942–953. [Google Scholar] [CrossRef]
- Huntington, H.P.; Braem, N.M.; Brown, C.L.; Hunn, E.; Krieg, T.M.; Lestenkof, P.; Noongwook, G.; Sepez, J.; Sigler, M.F.; Wiese, F.K.; et al. Local and Traditional Knowledge Regarding the Bering Sea Ecosystem: Selected Results from Five Indigenous Communities. Deep Sea Res. Part II Top. Stud. Oceanogr. 2013, 94, 323–332. [Google Scholar] [CrossRef]
- Lestenkof, P.; Zacharof, S.M.; Melovidov, E.M. Subsistence Harvest Monitoring Results from 1999 to 2010 and Local and Traditional Knowledge Interview Results for St. Paul Island, Alaska; Aleut Community of St. Paul Island: St. Paul, AK, USA, 2013. [Google Scholar]
- NOAA. Unprecedented 2018 Bering Sea Ice Loss Repeated in 2019. Available online: https://www.noaa.gov/stories/unprecedented-2018-bering-sea-ice-loss-repeated-in-2019#:~:text=During%20winter%202018%20the%20sea,square%20mile%20body%20of%20water (accessed on 15 December 2021).
- Stabeno, P.J.; Bond, N.A.; Salo, S.A. On the Recent Warming of the Southeastern Bering Sea Shelf. Deep Sea Res. Part II Top. Stud. Oceanogr. 2007, 54, 2599–2618. [Google Scholar] [CrossRef]
- Karp, M.A.; Peterson, J.O.; Lynch, P.D.; Griffis, R.B.; Adams, C.F.; Arnold, W.S.; Barnett, L.A.K.; deReynier, Y.; DiCosimo, J.; Fenske, K.H.; et al. Accounting for Shifting Distributions and Changing Productivity in the Development of Scientific Advice for Fishery Management. ICES J. Mar. Sci. 2019, 76, 1305–1315. [Google Scholar] [CrossRef]
- Holsman, K.; Hallowed, A.; Ito, S. Climate Change Impacts, Vulnerabilities and Adaptations: North Pacific and Pacific Arctic Marine Fisheries. In Impacts of Climate Change on Fisheries and Aquaculture. FAO Technical Paper 627; Food and Agricultural Organization: Rome, Italy, 2019. [Google Scholar]
- Barbeaux, S.J.; Holsman, K.; Zador, S. Marine Heatwave Stress Test of Ecosystem-Based Fisheries Management in the Gulf of Alaska Pacific Cod Fishery. Front. Mar. Sci. 2020, 7, 703. [Google Scholar] [CrossRef]
- Arimitsu, M.L.; Piatt, J.F.; Hatch, S.; Suryan, R.M.; Batten, S.; Bishop, M.A.; Campbell, R.W.; Coletti, H.; Cushing, D.; Gorman, K.; et al. Heatwave-induced Synchrony within Forage Fish Portfolio Disrupts Energy Flow to Top Pelagic Predators. Glob. Chang. Biol. 2021, 27, 1859. [Google Scholar] [CrossRef] [PubMed]
- Aars, J. Polar Bear Behavior in Response to Climate Change; Springer: Cham, Switzerland, 2021; pp. 311–323. [Google Scholar] [CrossRef]
- Torrey, B.B.; Krukoff, A. Slaves of the Harvest: The Story of the Pribilof Aleuts; Tanadgusix Corporation: Anchorage, AK, USA, 1978. [Google Scholar]
- Muto, M.; Helker, V.; Delean, B.; Angliss, R.P. Alaska Marine Mammal Stock Assessment Repoorts-Northern Fur Seal: Eastern Pacific Stock Stock Assessement Report; Alaska Fisheries Science Center: Seattle, WA, USA, 2020. [Google Scholar]
- Towell, R.; Ream, R.; Sterling, J.; Bengtson, J.; Williams, M. 2018 Northern Fur Seal Pup Production and Adult Male Counts on the Pribilof Islands, Alaska; Marine Mammal Laboratory: Seattle, WA, USA, 2019. [Google Scholar]
- Ianelli, J.; Fissel, B.; Holsman, K.; Robertis, A. Assessment of the Walleye Pollock Stock in the Eastern Bering Sea; Alaska Fisheries Science Center: Seattle, WA, USA, 2020. [Google Scholar]
- Thill, M.; Philemenof, D.; Wallace, E.; Aleutian Pribilof Islands Assocation. Aleut Evacuation: The Untold War Story; Aleutian/Pribilof Islands Association: Anchorage, AK, USA, 1992. [Google Scholar]
- St. Paul Co-Management Council. Co-Management Plan for Subsistence Use of Marine Mammals on St. Paul Island, Alaska; St. Paul Co-Management Council: St. Paul, AK, USA, 2020. [Google Scholar]
- St. George Tribal Council. Co-management Agreement Between the Aleut Community of St. George Island and the National Marine Fisheries Service|NOAA Fisheries. Available online: https://www.fisheries.noaa.gov/resource/document/co-management-agreement-between-aleut-community-st-george-island-and-national (accessed on 24 January 2022).
- NOAA. Conservation Plan for the Northern Fur Seal; NOAA: Silver Spring, MD, USA, 1993. [Google Scholar]
- NOAA. Conservation Plan for the Eastern Pacific Stock of Northern Fur Seal, Callorhinus ursinus; NOAA: Silver Spring, MD, USA, 2007. [Google Scholar]
- Scheffer, V. Year of the Seal; Charles Scribners Sons: New York, NY, USA, 1970. [Google Scholar]
- York, A.E.; Hartley, J.R. Pup Production Following Harvest of Female Northern Fur Seals. Can. J. Fish. Aquat. Sci. 1981, 38, 84–90. [Google Scholar] [CrossRef]
- Short, J.W.; Geiger, H.J.; Fritz, L.W.; Warrenchuk, J.J. First-Year Survival of Northern Fur Seals (Callorhinus ursinus) Can Be Explained by Pollock (Gadus Chalcogrammus) Catches in the Eastern Bering Sea. J. Mar. Sci. Eng. 2021, 9, 975. [Google Scholar] [CrossRef]
- Towell, R.G.; Ream, R.R.; York, A.E. Decline in northern fur seal pup production in the Pribilof Islands. Mar. Mammal Sci. 2006, 22, 486–491. [Google Scholar] [CrossRef]
- NOAA. 50 CFR Part 675; Federal Register: No. 13; NOAA: Silver Spring, MD, USA, 1995; Volume 60, pp. 4110–4113. [Google Scholar]
- NOAA. Northern Fur Seal. Available online: https://www.fisheries.noaa.gov/species/northern-fur-seal (accessed on 17 February 2022).
- Orians, G.; Pearspon, N. On the Theory of Central Place Foraging. In Analysis of Ecological Systems; Horn, D.J., Mitchell, R.D., Stairs, G.R., Eds.; Ohio University Press: Columbus, OH, USA, 1979; pp. 157–177. [Google Scholar]
- Gentry, R. Behavior and Ecology of the Northern Fur Seal; Princeton University Press: Princeton, NJ, USA, 1998; ISBN 0-691-03345-5. [Google Scholar]
- Robson, B.W.; Goebel, M.E.; Baker, J.D.; Ream, R.R.; Loughlin, T.R.; Francis, R.C.; Antonelis, G.A.; Costa, D.P. Separation of Foraging Habitat among Breeding Sites of a Colonial Marine Predator, the Northern Fur Seal (Callorhinus ursinus). Can. J. Zool. 2004, 82, 20–29. [Google Scholar] [CrossRef]
- Ream, R.R.; Sterling, J.T.; Loughlin, T.R. Oceanographic Features Related to Northern Fur Seal Migratory Movements. Deep Sea Res. Part II Top. Stud. Oceanogr. 2005, 52, 823–843. [Google Scholar] [CrossRef]
- Zeppelin, T.K.; Ream, R.R. Foraging Habitats Based on the Diet of Female Northern Fur Seals (Callorhinus ursinus) on the Pribilof Islands, Alaska. J. Zool. 2006, 270, 565–576. [Google Scholar] [CrossRef]
- Call, K.A.; Ream, R.R.; Johnson, D.; Sterling, J.T.; Towell, R.G. Foraging Route Tactics and Site Fidelity of Adult Female Northern Fur Seal (Callorhinus ursinus) around the Pribilof Islands. Deep Sea Res. Part II Top. Stud. Oceanogr. 2008, 55, 1883–1896. [Google Scholar] [CrossRef]
- Antonelis, G.A.; Sinclair, E.H.; Ream, R.R.; Robson, B.W. Inter-Island Variation in the Diet of Female Northern Fur Seals (Callorhinus ursinus) in the Bering Sea. J. Zool. 2009, 242, 435–451. [Google Scholar] [CrossRef]
- Kuhn, C.E.; Baker, J.D.; Towell, R.G.; Ream, R.R. Evidence of Localized Resource Depletion Following a Natural Colonization Event by a Large Marine Predator. J. Anim. Ecol. 2014, 83, 1169–1177. [Google Scholar] [CrossRef]
- Kuhn, C.E.; Ream, R.R.; Sterling, J.T.; Thomason, J.R.; Towell, R.G. Spatial Segregation and the Influence of Habitat on the Foraging Behavior of Northern Fur Seals (Callorhinus ursinus). Can. J. Zool. 2014, 92, 861–873. [Google Scholar] [CrossRef]
- Zeppelin, T.K.; Johnson, D.S.; Kuhn, C.E.; Iverson, S.J.; Ream, R.R. Stable Isotope Models Predict Foraging Habitat of Northern Fur Seals (Callorhinus ursinus) in Alaska. PLoS ONE 2015, 10, e0127615. [Google Scholar]
- Yua, E.; Raymond-Yakoubian, J.; Daniel, R.; Behe, C. Negeqlikacaarni Kangingnaulriani Ayuqenrilnguut Piyaraitgun Kangingnauryararkat: A Framework for Co-Production of Knowledge in the Context of Arctic Research. Ecol. Soc. 2022, 27, 34. [Google Scholar] [CrossRef]
- Cameron, E.S. Securing Indigenous Politics: A Critique of the Vulnerability and Adaptation Approach to the Human Dimensions of Climate Change in the Canadian Arctic. Glob. Environ. Chang. 2012, 22, 103–114. [Google Scholar] [CrossRef]
- Thornton, T.F.; Scheer, A.M. Collaborative Engagement of Local and Traditional Knowledge and Science in Marine Environments: A Review. Ecol. Soc. 2012, 17, 8. [Google Scholar] [CrossRef]
- Danielsen, F.; Topp-Jørgensen, E.; Levermann, N.; Løvstrøm, P.; Schiøtz, M.; Enghoff, M.; Jakobsen, P. Counting What Counts: Using Local Knowledge to Improve Arctic Resource Management. Polar Geogr. 2014, 37, 69–91. [Google Scholar] [CrossRef]
- Robards, M.D.; Huntington, H.P.; Druckenmiller, M.; Lefevre, J.; Moses, S.K.; Stevenson, Z.; Watson, A.; Williams, M. Understanding and Adapting to Observed Changes in the Alaskan Arctic: Actionable Knowledge Co-Production with Alaska Native Communities. Deep Sea Res. Part II Top. Stud. Oceanogr. 2018, 152, 203–213. [Google Scholar] [CrossRef]
- Kawerak. Co-Production of Knowledge in Research—Valuing Traditional Knowledge. Available online: https://kawerak.org/co-production-of-knowledge-in-research-valuing-traditional-knowledge/ (accessed on 6 January 2021).
- Kawerak. Kawerak Knowledge and Subsistence-Related Terms. Available online: https://kawerak.org/wp-content/uploads/2018/04/Kawerak-Knowledge-and-Subsistence-Related-Terms.pdf (accessed on 22 January 2022).
- Raymond-Yakoubian, J.; Raymond-Yakoubian, B.; Moncrieff, C. The Incorporation of Traditional Knowledge into Alaska Federal Fisheries Management. Mar. Policy 2017, 78, 132–142. [Google Scholar] [CrossRef]
- UNESCO. What Is Local and Indigenous Knowledge|United Nations Educational, Scientific and Cultural Organization. Available online: http://www.unesco.org/new/en/natural-sciences/priority-areas/links/related-information/what-is-local-and-indigenous-knowledge (accessed on 28 September 2021).
- Heeringa, S.G.; West, B.T.; Berglund, P.A. Applied Survey Data Analysis; Chapman and Hall/CRC: New York, NY, USA, 2010. [Google Scholar]
- Clason, D.L.; Dormody, T.J. Analyzing Data Measured by Individual Likert-Type Items. J. Agric. Educ. 1994, 35, 4. [Google Scholar] [CrossRef]
- Bernard, R.H. Research Methods in Anthropology. Qualitative and Quantitative Approaches; AltaMira Press: Lanham, MD, USA, 2006; Volume 4. [Google Scholar]
- Boone, H.N., Jr.; Boone, D.A. Analyzing Likert Data. J. Ext. 2012, 50, 2TOT2. [Google Scholar]
- Strauss, A.; Corbin, J. Grounded Theory Methodology. In Handbook of Qualitative Research; Sage Publications, Inc.: Thousand Oaks, CA, USA, 1994; pp. 273–285. [Google Scholar]
- Charmaz, K. Constructing Grounded Theory; Sage Publications, Inc.: Thousand Oaks, CA, USA, 2014. [Google Scholar]
- Strauss, A.; Corbin, J. Basics of Qualitative Research: Techniques and Procedures for Developing Grounded Theory; Sage Publications, Incorporated: Thousand Oaks, CA, USA, 2007. [Google Scholar]
- Ostertagová, E.; Ostertag, O.; Kováč, J. Methodology and Application of the Kruskal-Wallis Test. Appl. Mech. Mater. 2014, 611, 115–120. [Google Scholar] [CrossRef]
- Mircioiu, C.; Atkinson, J. A Comparison of Parametric and Non-Parametric Methods Applied to a Likert Scale. Pharmacy 2017, 5, 26. [Google Scholar] [CrossRef] [PubMed]
- Robson, B.W. The Relationship between Foraging Areas and Breeding Sites of Lactating Northern Fur Seals, Callorhinus ursinus, in the Eastern Bering Sea; University of Washington: Washington, DC, USA, 2001. [Google Scholar]
- Worton, B.J. Kernel Methods for Estimating the Utilization Distribution in Home-Range Studies. Ecology 1989, 70, 164–168. [Google Scholar] [CrossRef]
- Hardin, J.M.; Hilbe, J.W. Generalized Linear Models and Extensions, 2nd ed.; Stata Press: College Station, TX, USA, 2007. [Google Scholar]
- Everett, B.I.; Fennessy, S.T.; van den Heever, N. Using Hotspot Analysis to Track Changes in the Crustacean Fishery off KwaZulu-Natal, South Africa. Reg. Stud. Mar. Sci. 2021, 41, 101553. [Google Scholar] [CrossRef]
- ESRI. Emerging Hot Spot Analysis (Space Time Pattern Mining)—ArcGIS Pro|Documentation. Available online: https://pro.arcgis.com/en/pro-app/latest/tool-reference/space-time-pattern-mining/emerginghotspots.htm (accessed on 19 October 2021).
- State of Alaska. Alaska Population Overview 2019 Estimates State of Alaska; Alaska Department of Labor and Workforce Development: Juneau, AK, USA, 2020. [Google Scholar]
- Sterling, J.T. Northern Fur Seal Foraging Behaviors, Food Webs, and Interactions with Oceanographic Features in the Eastern Bering Sea. Ph.D. Dissertation, Univesity of Washington, Seattle, WA, USA, 2009. [Google Scholar]
- McHuron, E.A.; Luxa, K.; Pelland, N.A.; Holsman, K.; Ream, R.; Zeppelin, T.; Sterling, J.T. Practical Application of a Bioenergetic Model to Inform Management of a Declining Fur Seal Population and Their Commercially Important Prey. Front. Mar. Sci. 2020, 7, 1027. [Google Scholar] [CrossRef]
- NRC. Decline of the Steller Sea Lion in Alaskan Waters: Untangling Food Webs and Fishing Nets; National Research Council, National Academies Press: Washington, DC, USA, 2003. [Google Scholar] [CrossRef]
- Atkinson, S.; Demaster, D.P.; Calkins, D.G. Anthropogenic Causes of the Western Steller Sea Lion Eumetopias Jubatus Population Decline and Their Threat to Recovery. Mamm. Rev. 2008, 38, 1–18. [Google Scholar] [CrossRef]
- Croll, D.A.; Tershy, B.R. Penguins, Fur Seals, and Fishing: Prey Requirements and Potential Competition in the South Shetland Islands, Antarctica. Pol. Biol. 1998, 19, 365–374. [Google Scholar] [CrossRef]
- Sinclair, E.H.; Vlietstra, L.S.; Johnson, D.S.; Zeppelin, T.K.; Byrd, G.V.; Springer, A.M.; Ream, R.R.; Hunt, G.L. Patterns in Prey Use among Fur Seals and Seabirds in the Pribilof Islands. Deep Sea Res. Part II Top. Stud. Oceanogr. 2008, 55, 1897–1918. [Google Scholar] [CrossRef]
- Stevenson, D.E.; Lauth, R.R. Bottom Trawl Surveys in the Northern Bering Sea Indicate Recent Shifts in the Distribution of Marine Species. Pol. Biol. 2019, 42, 407–421. [Google Scholar] [CrossRef]
- Thorson, J.T.; Fossheim, M.; Mueter, F.J.; Olsen, E.; Lauth, R.R.; Primicerio, R.; Husson, B.; Marsh, J.; Dolgov, A.; Zador, S.G. Comparison of Near-Bottom Fish Densities Show Rapid Community and Population Shifts in Bering and Barents Seas. 2019 Arctic Report Card, NOAA. Available online: https://arctic.noaa.gov/Report-Card/Report-Card-2019/ArtMID/7916/ArticleID/845/Comparison-of-Near-bottom-Fish-Densities-Show-Rapid-Community-and-Population-Shifts-in-Bering-and-Barents-Seas (accessed on 22 January 2022).
- Merrill, G.B.; Testa, J.W.; Burns, J.M. Maternal Foraging Trip Duration as a Population-Level Index of Foraging and Reproductive Success for the Northern Fur Seal. Mar. Ecol. Prog. Ser. 2021, 666, 217–229. [Google Scholar] [CrossRef]
- Spencer, P.D.; Holsman, K.K.; Zador, S.; Bond, N.A.; Mueter, F.J.; Hollowed, A.B.; Ianelli, J.N. Modelling Spatially Dependent Predation Mortality of Eastern Bering Sea Walleye Pollock, and Its Implications for Stock Dynamics under Future Climate Scenarios. ICES J. Mar. Sci. 2016, 73, 1330–1342. [Google Scholar] [CrossRef]
- Hermann, A.J.; Gibson, G.A.; Bond, N.A.; Curchitser, E.N.; Hedstrom, K.; Cheng, W.; Wang, M.; Cokelet, E.D.; Aydin, K. Projected Future Biophysical States of the Bering Sea. Deep Sea Res. Part II Top. Stud. Oceanogr. 2016, 134, 30–47. [Google Scholar] [CrossRef]
- IPCC. IPCC Special Report on the Ocean and Cryosphere in a Changing Climate. Technical Summary; IPCC: Geneva, Switzerland, 2019. [Google Scholar]
- Holsman, K.K.; Haynie, A.C.; Hollowed, A.B.; Reum, J.C.P.; Aydin, K.; Hermann, A.J.; Cheng, W.; Faig, A.; Ianelli, J.N.; Kearney, K.A. Ecosystem-Based Fisheries Management Forestalls Climate-Driven Collapse. Nat. Commun. 2020, 11, 4579. [Google Scholar] [CrossRef] [PubMed]
- Tran, J.; Divine, L.M.; Heffner, L.R. “What Are You Going to Do, Protest the Wind?”: Community Perceptions of Emergent and Worsening Coastal Erosion from the Remote Bering Sea Community of St. Paul, Alaska. Environ. Manag. 2021, 67, 43–66. [Google Scholar] [CrossRef]
- McHuron, E.A.; Sterling, J.T.; Costa, D.P.; Goebel, M.E. Factors Affecting Energy Expenditure in a Declining Fur Seal Population. Conserv. Physiol. 2019, 7, coz103. [Google Scholar] [CrossRef]
- Trites, A.W.; Christensen, V.; Pauly, D. Competition between Fisheries and Marine Mammals for Prey and Primary Production in the Pacific Ocean. J. Northwest Atl. Fish. Sci. 1997, 22, 173–187. [Google Scholar] [CrossRef]
- DeMaster, D.P.; Fowler, C.W.; Perry, S.L.; Richlen, M.F. Predation and Compeition: The Impact of Fisheries on Marine Mammal Populations over the next One Hundred Years. J. Mammal. 2001, 82, 641–651. [Google Scholar] [CrossRef] [Green Version]
- Scott, T.L.; Yano, K.M.; Baker, J.; Rickey, M.H.; Eames, M.; Fowler, C.W.; Scott, T.; Rickey, M. The Northern Fur Seal (Callorhinus ursinus): A Bibliography 1; Marine Mammal Laboratory, Alaska Fisheries Science Center: Seattle, WA, USA, 2006. [Google Scholar]
- Inuit Circumpolar Council. Alaskan Inuit Food Security Conceptual Framework: How to Assess the Arctic from an Inuit Perspective; Inuit Circumpolar Council: Anchorage, AK, USA, 2015. [Google Scholar]
- Baker, J.D.; Fowler, C.W. Pup Weight and Survival of Northern Fur Seals Callorhinus ursinus. J. Zool. 1992, 227, 231–238. [Google Scholar] [CrossRef]
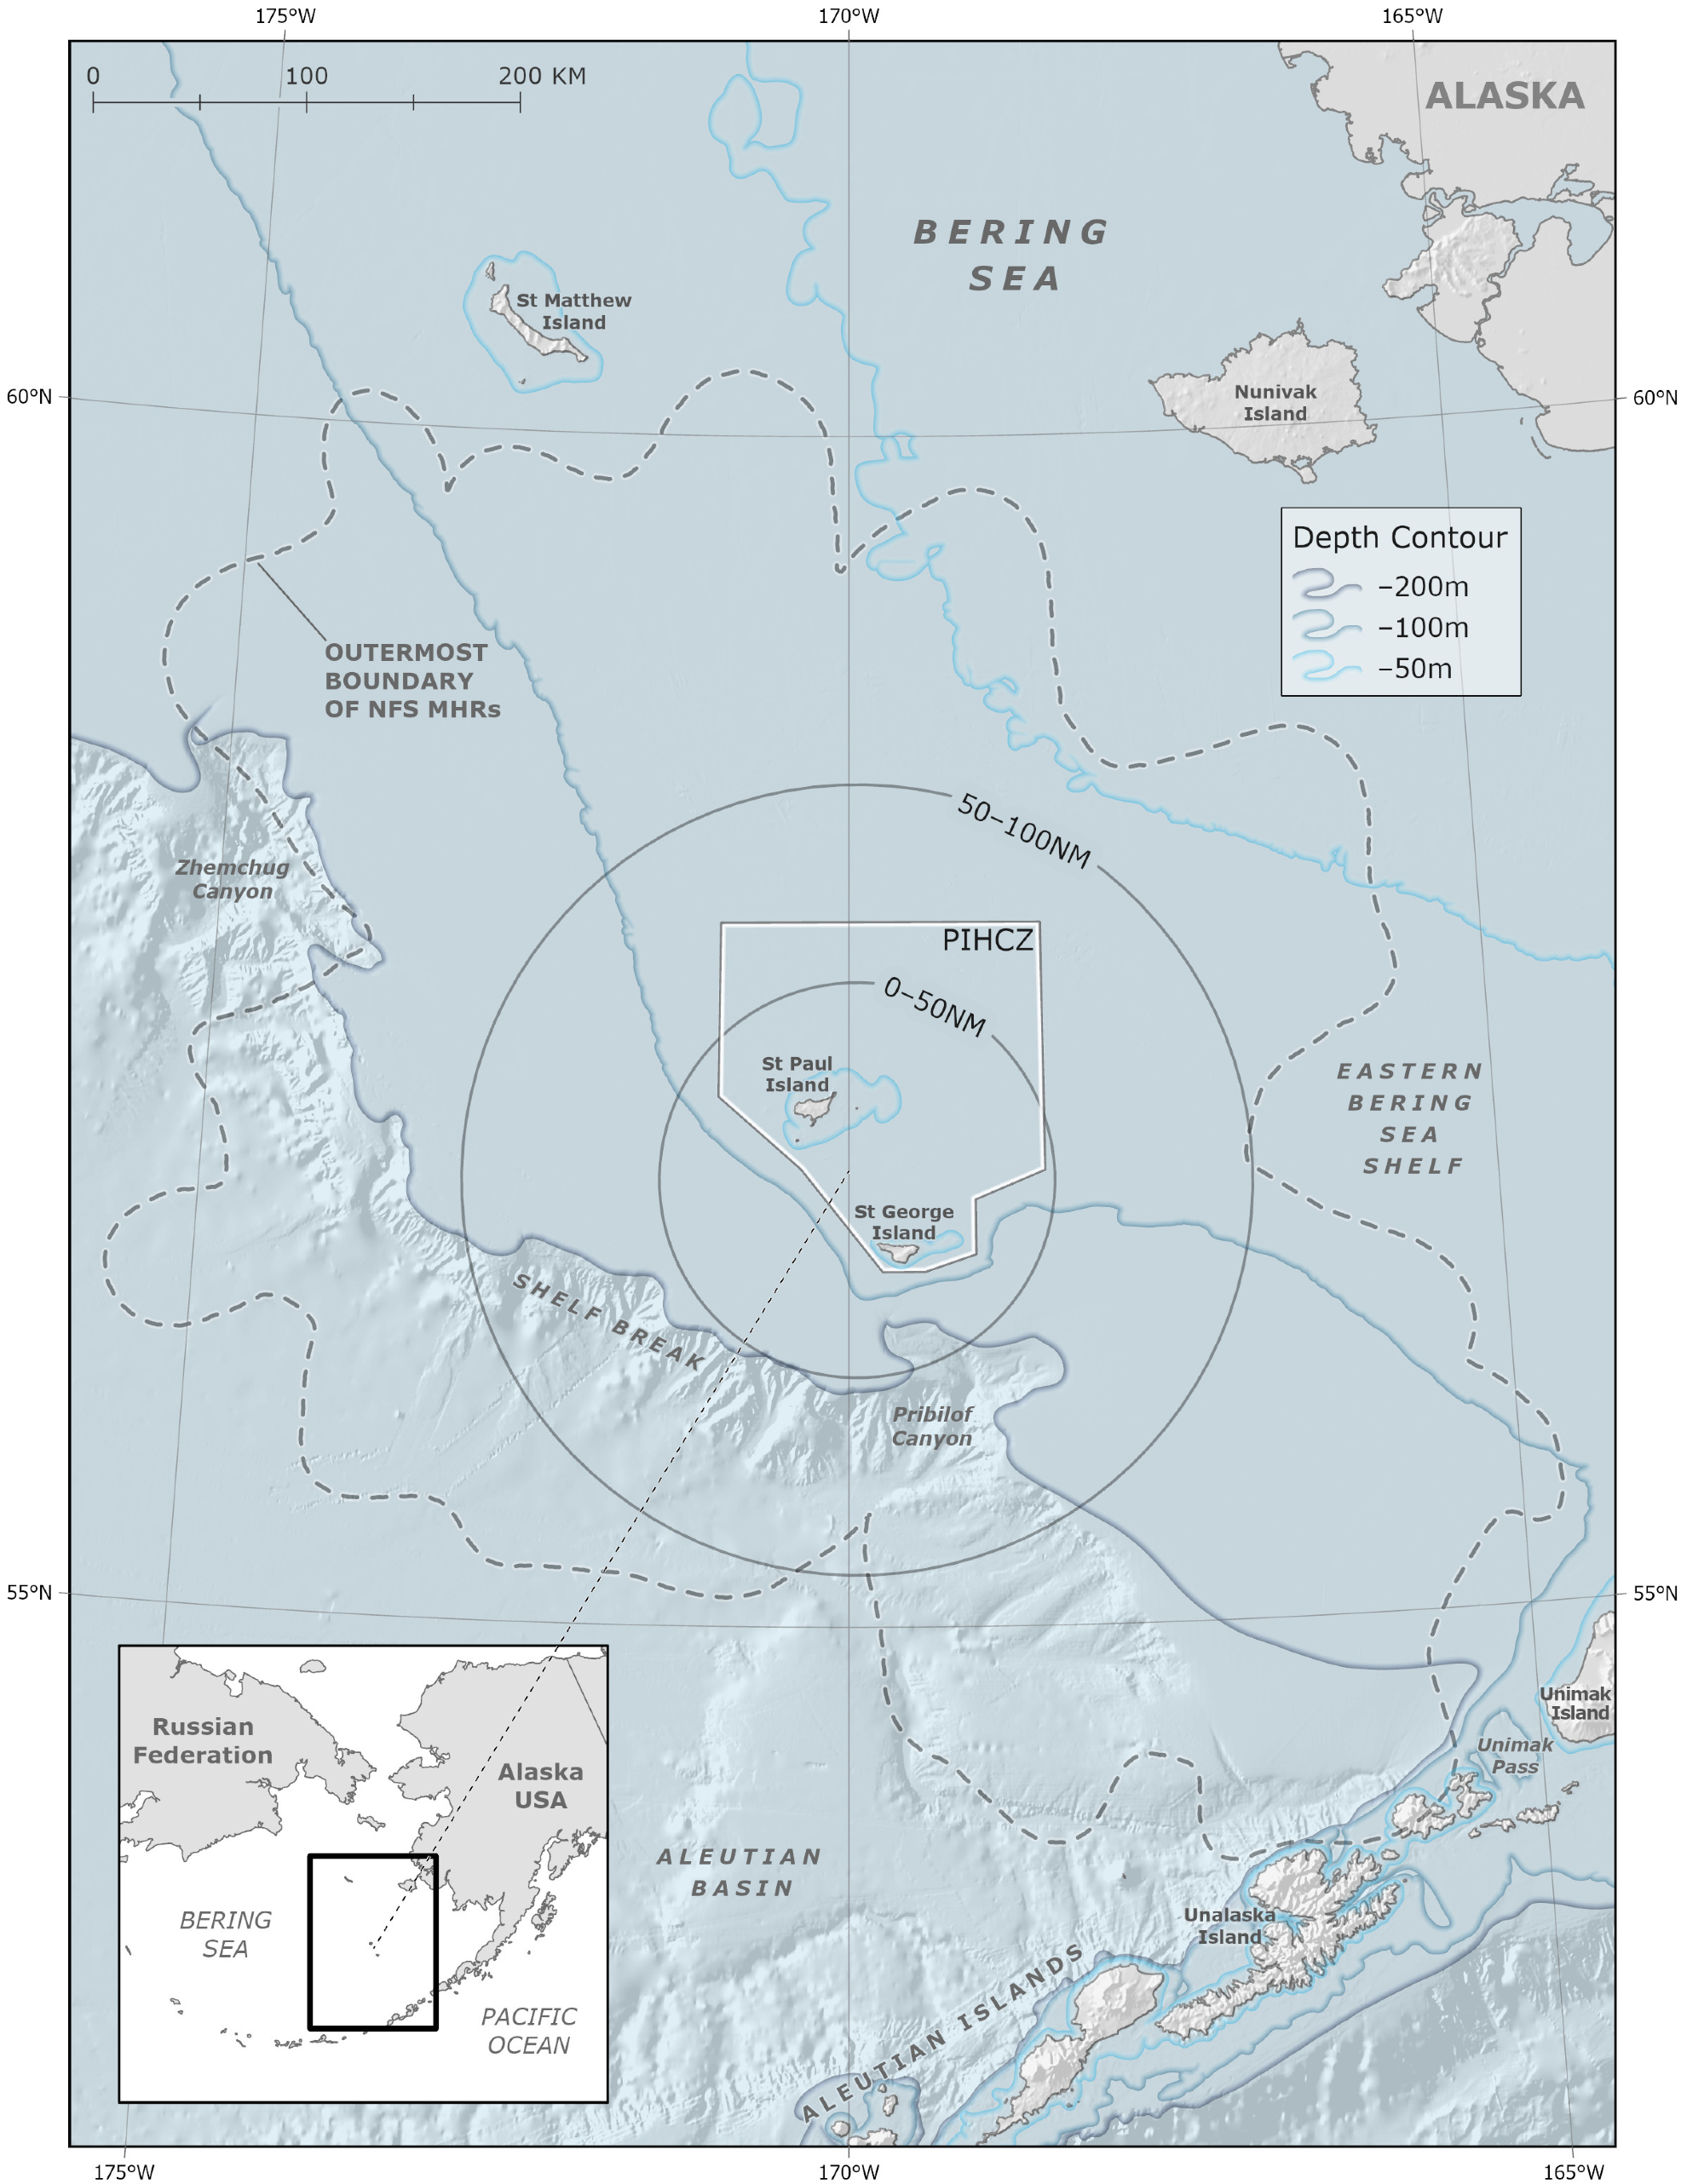

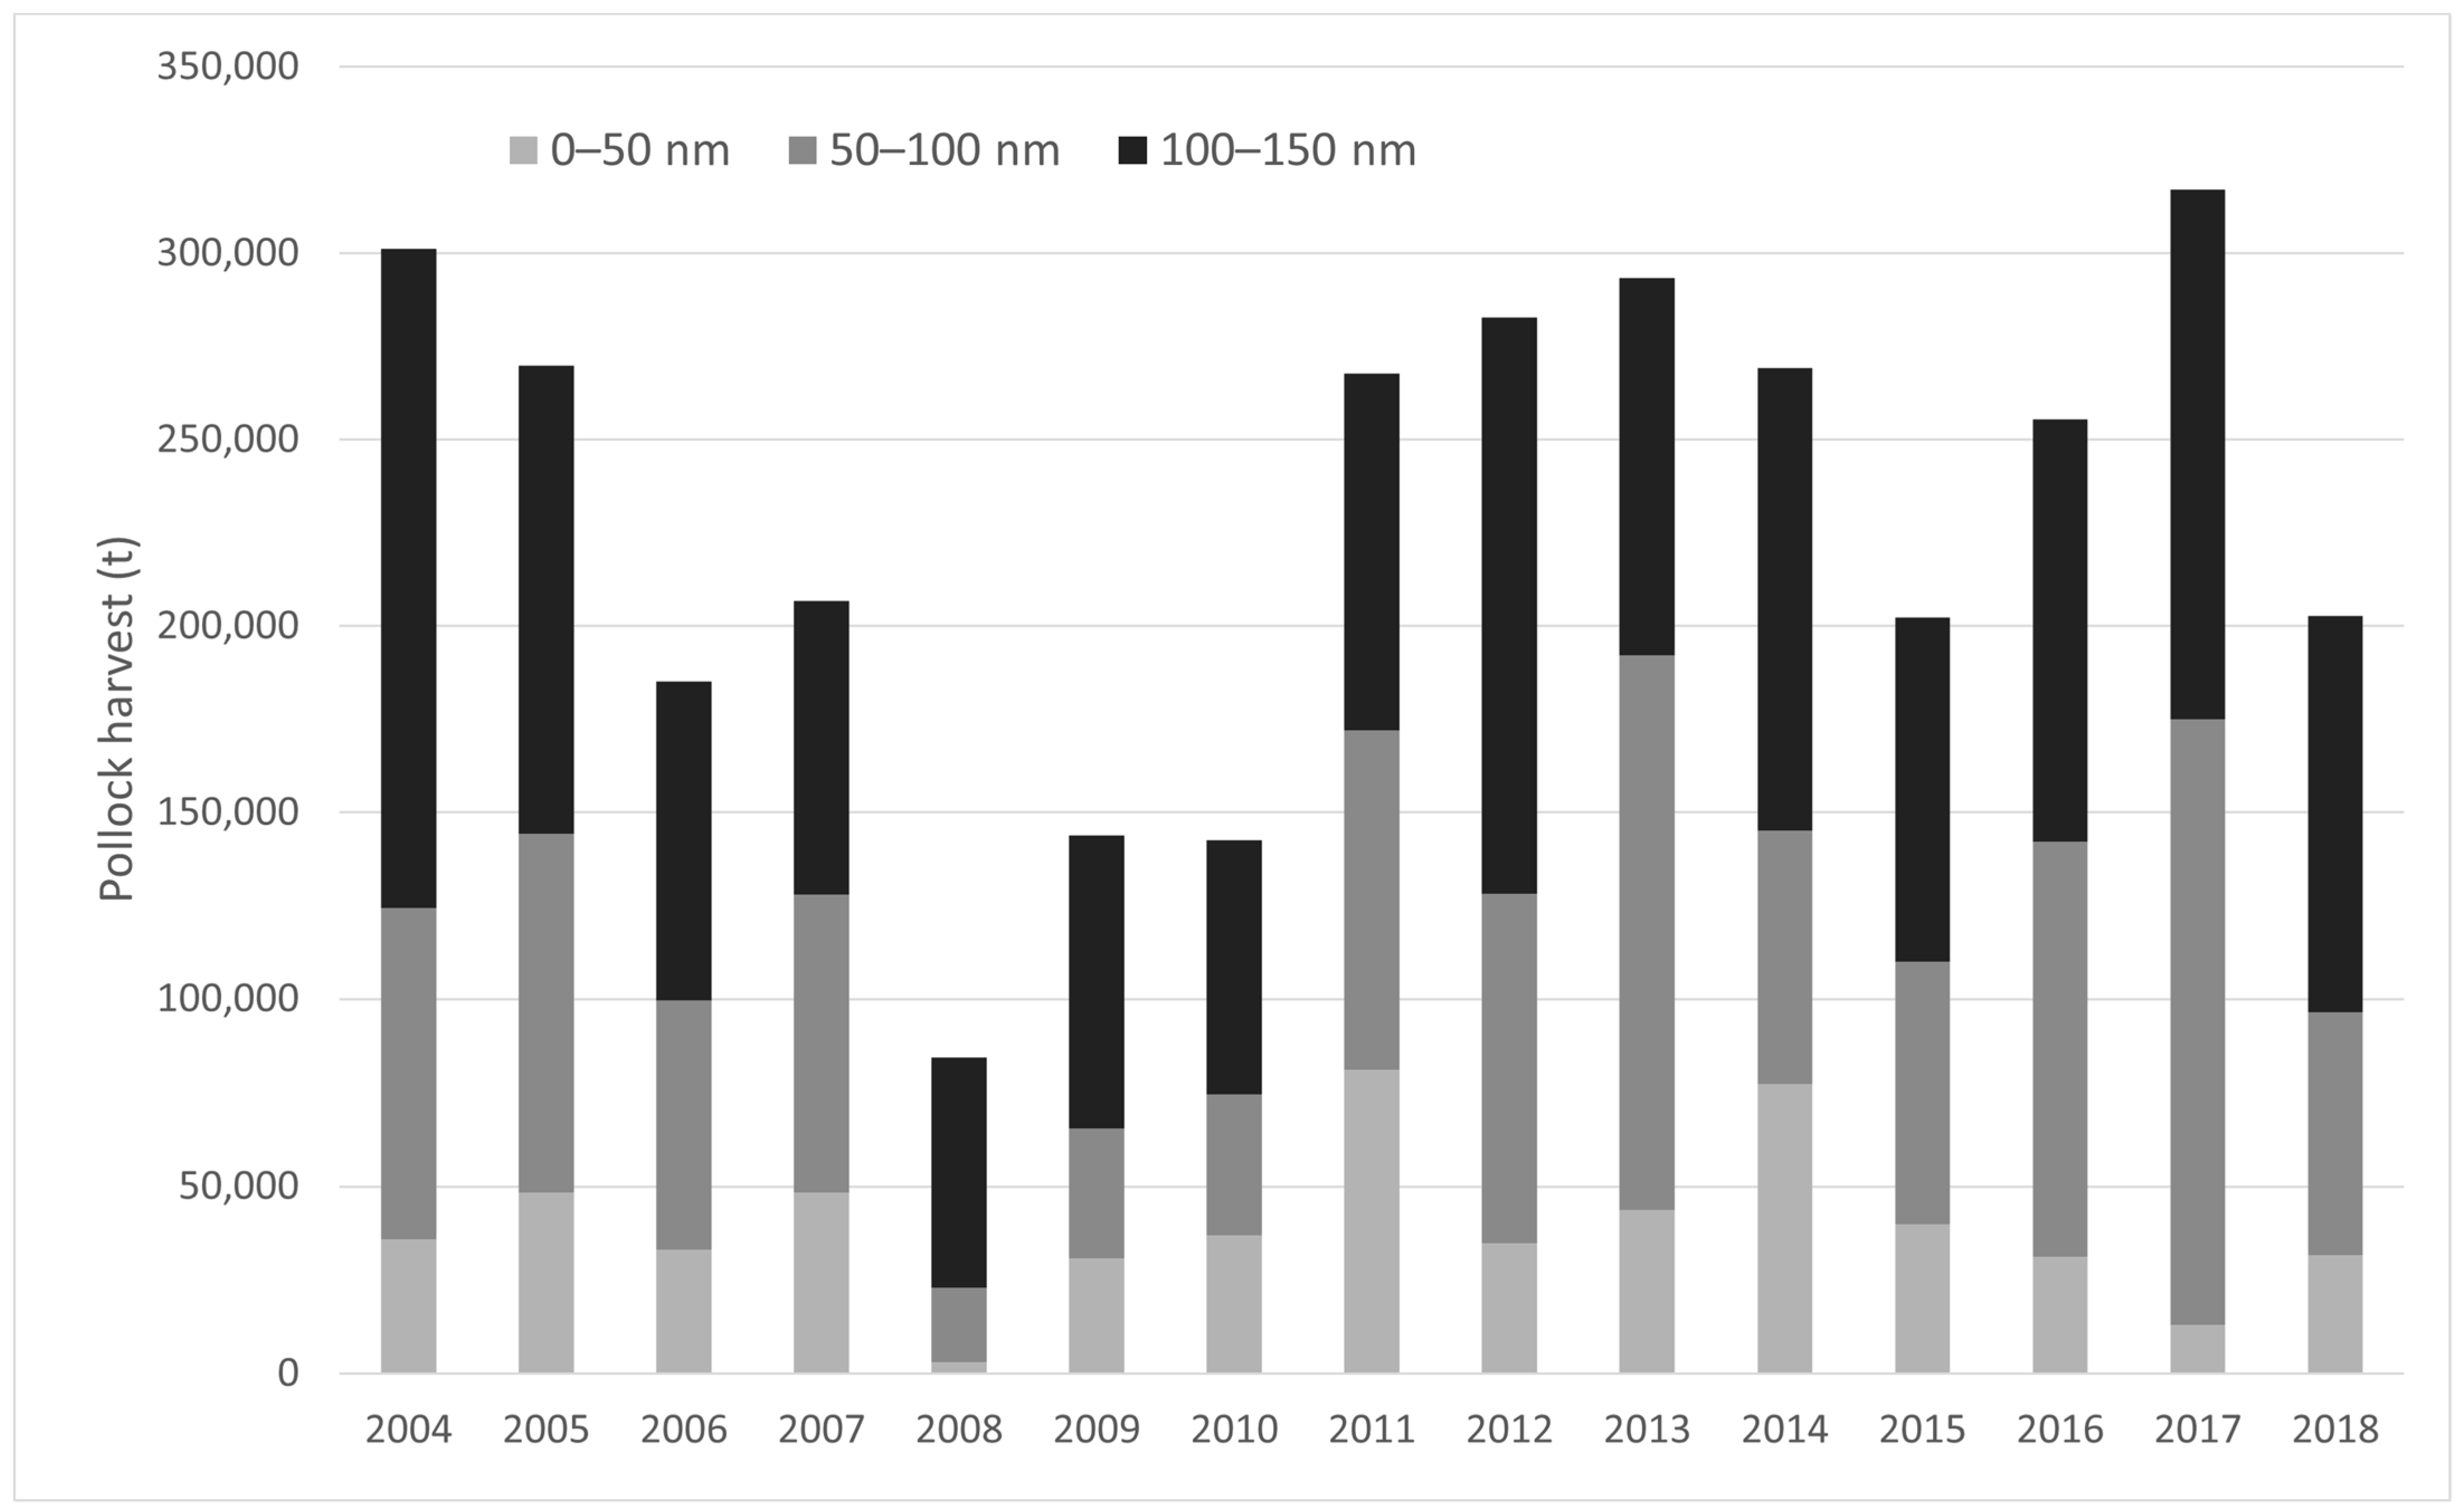
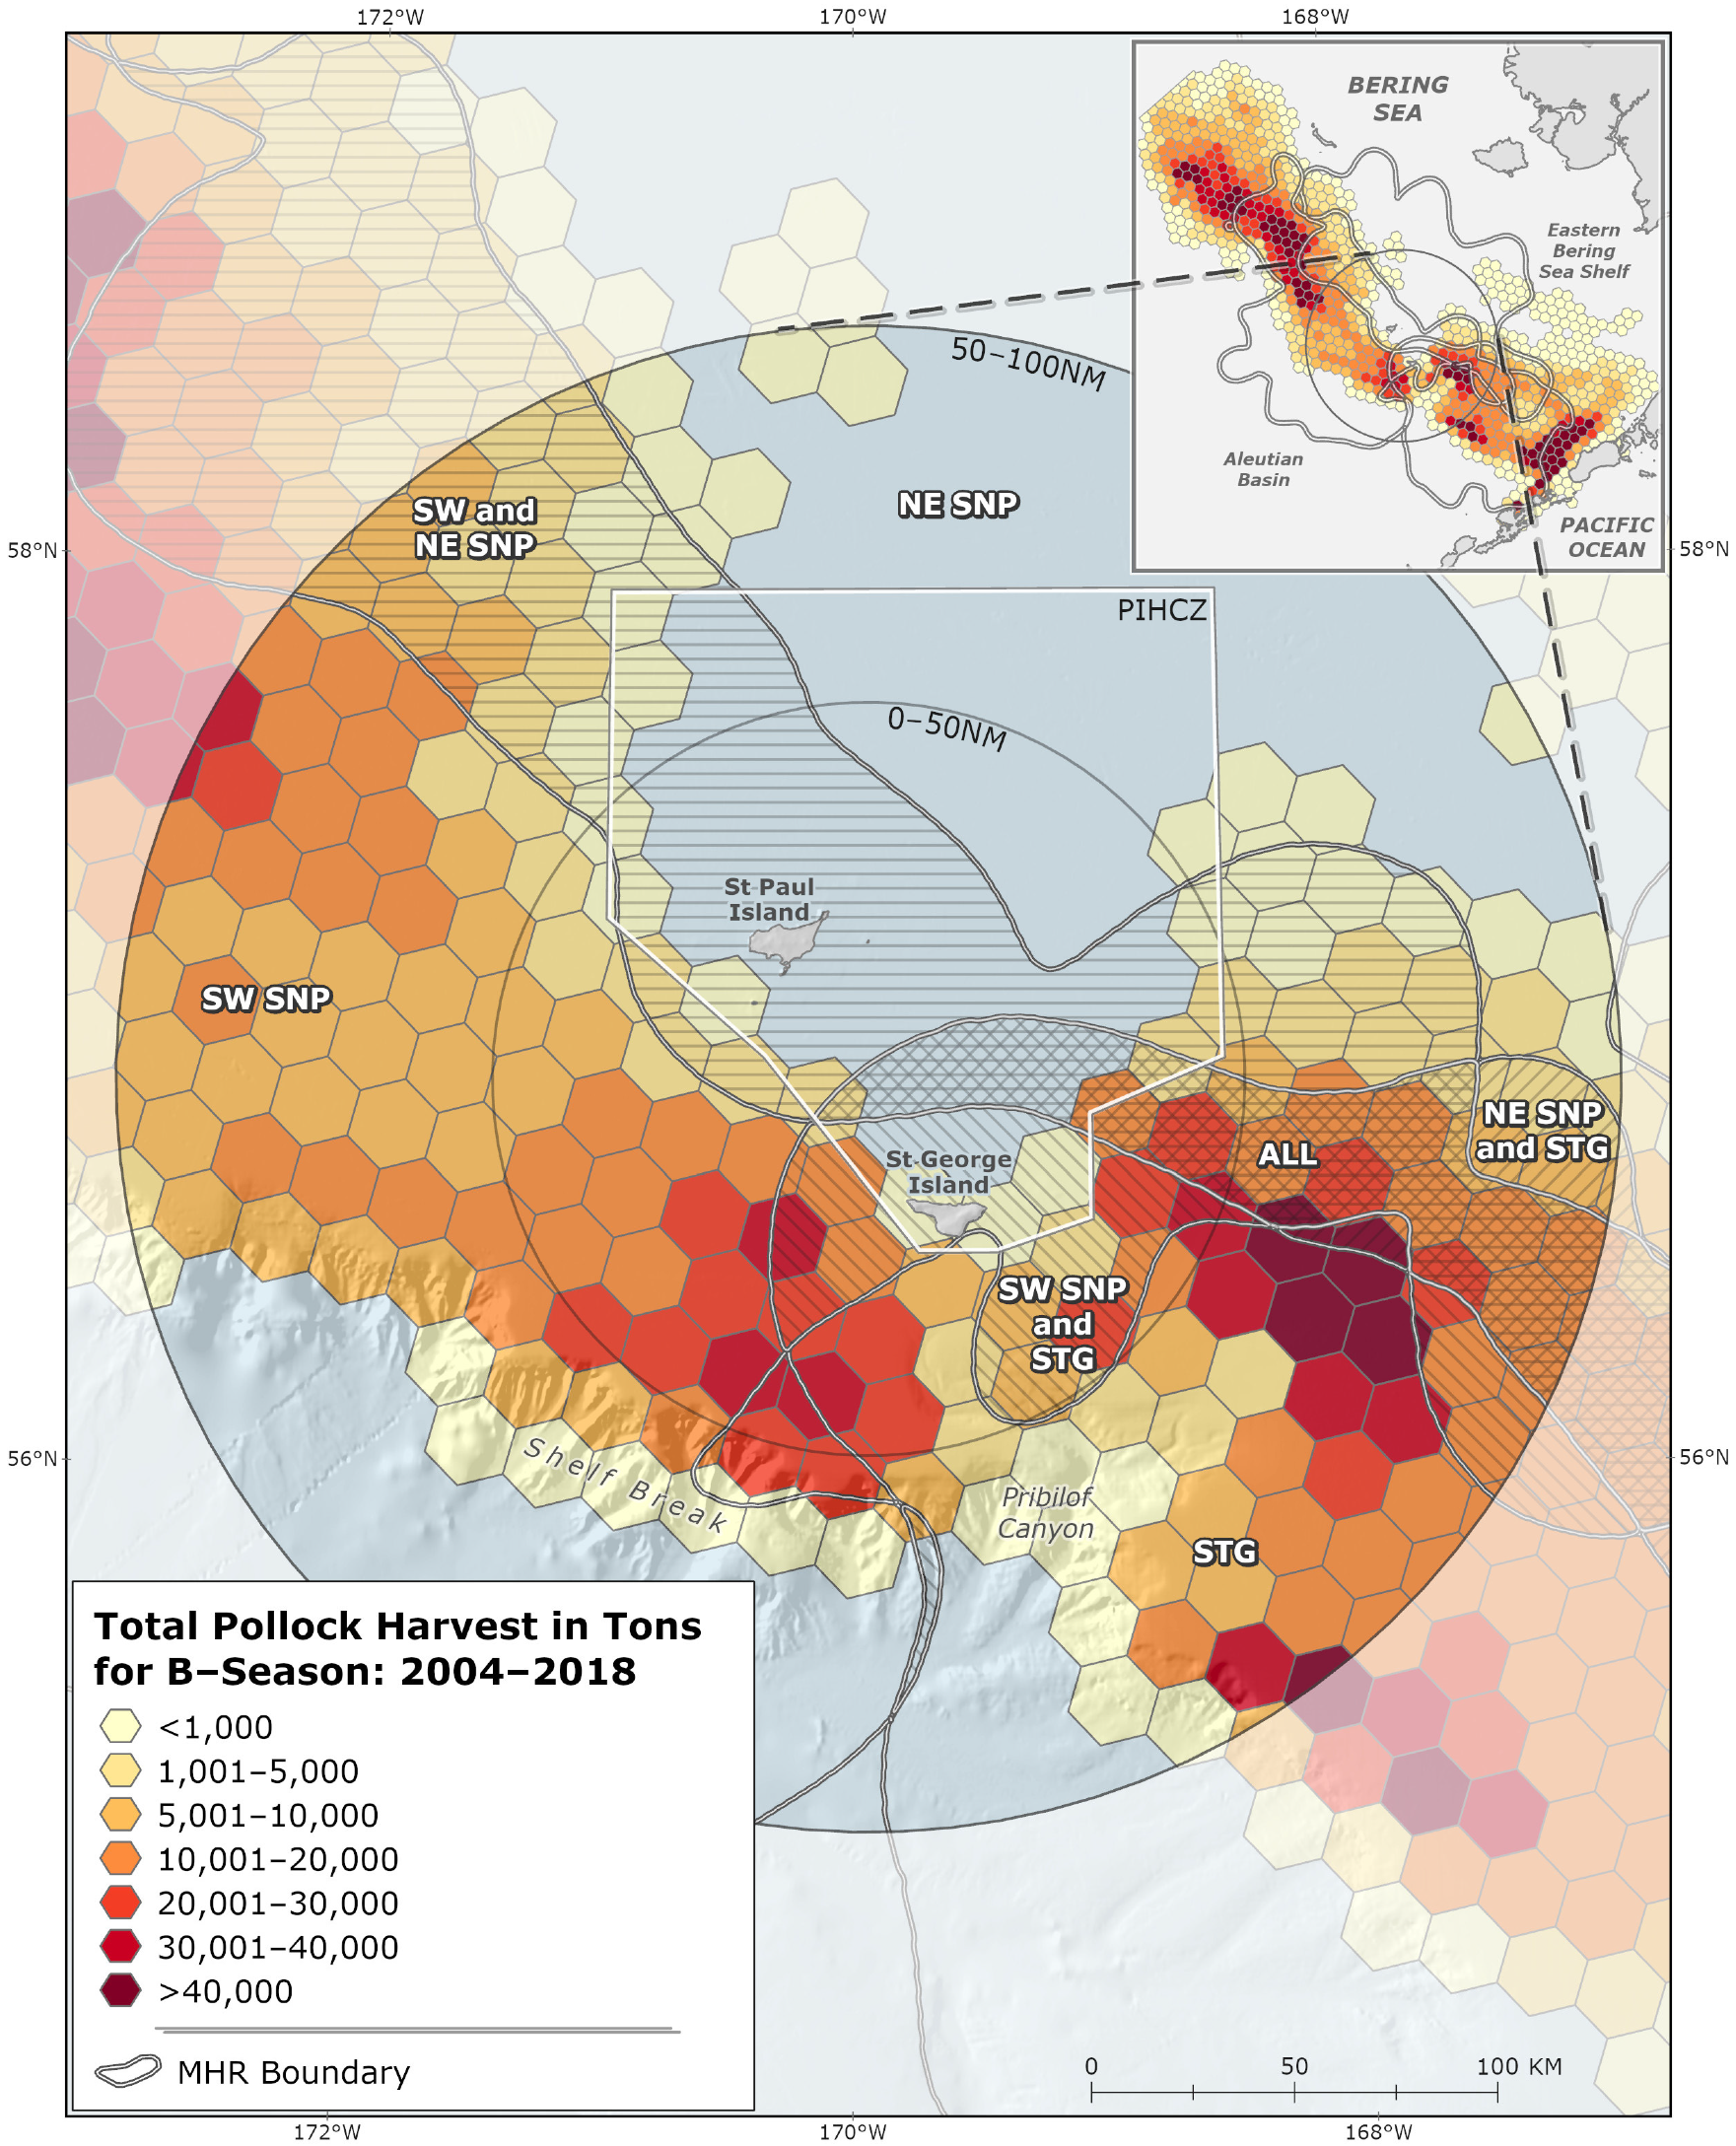
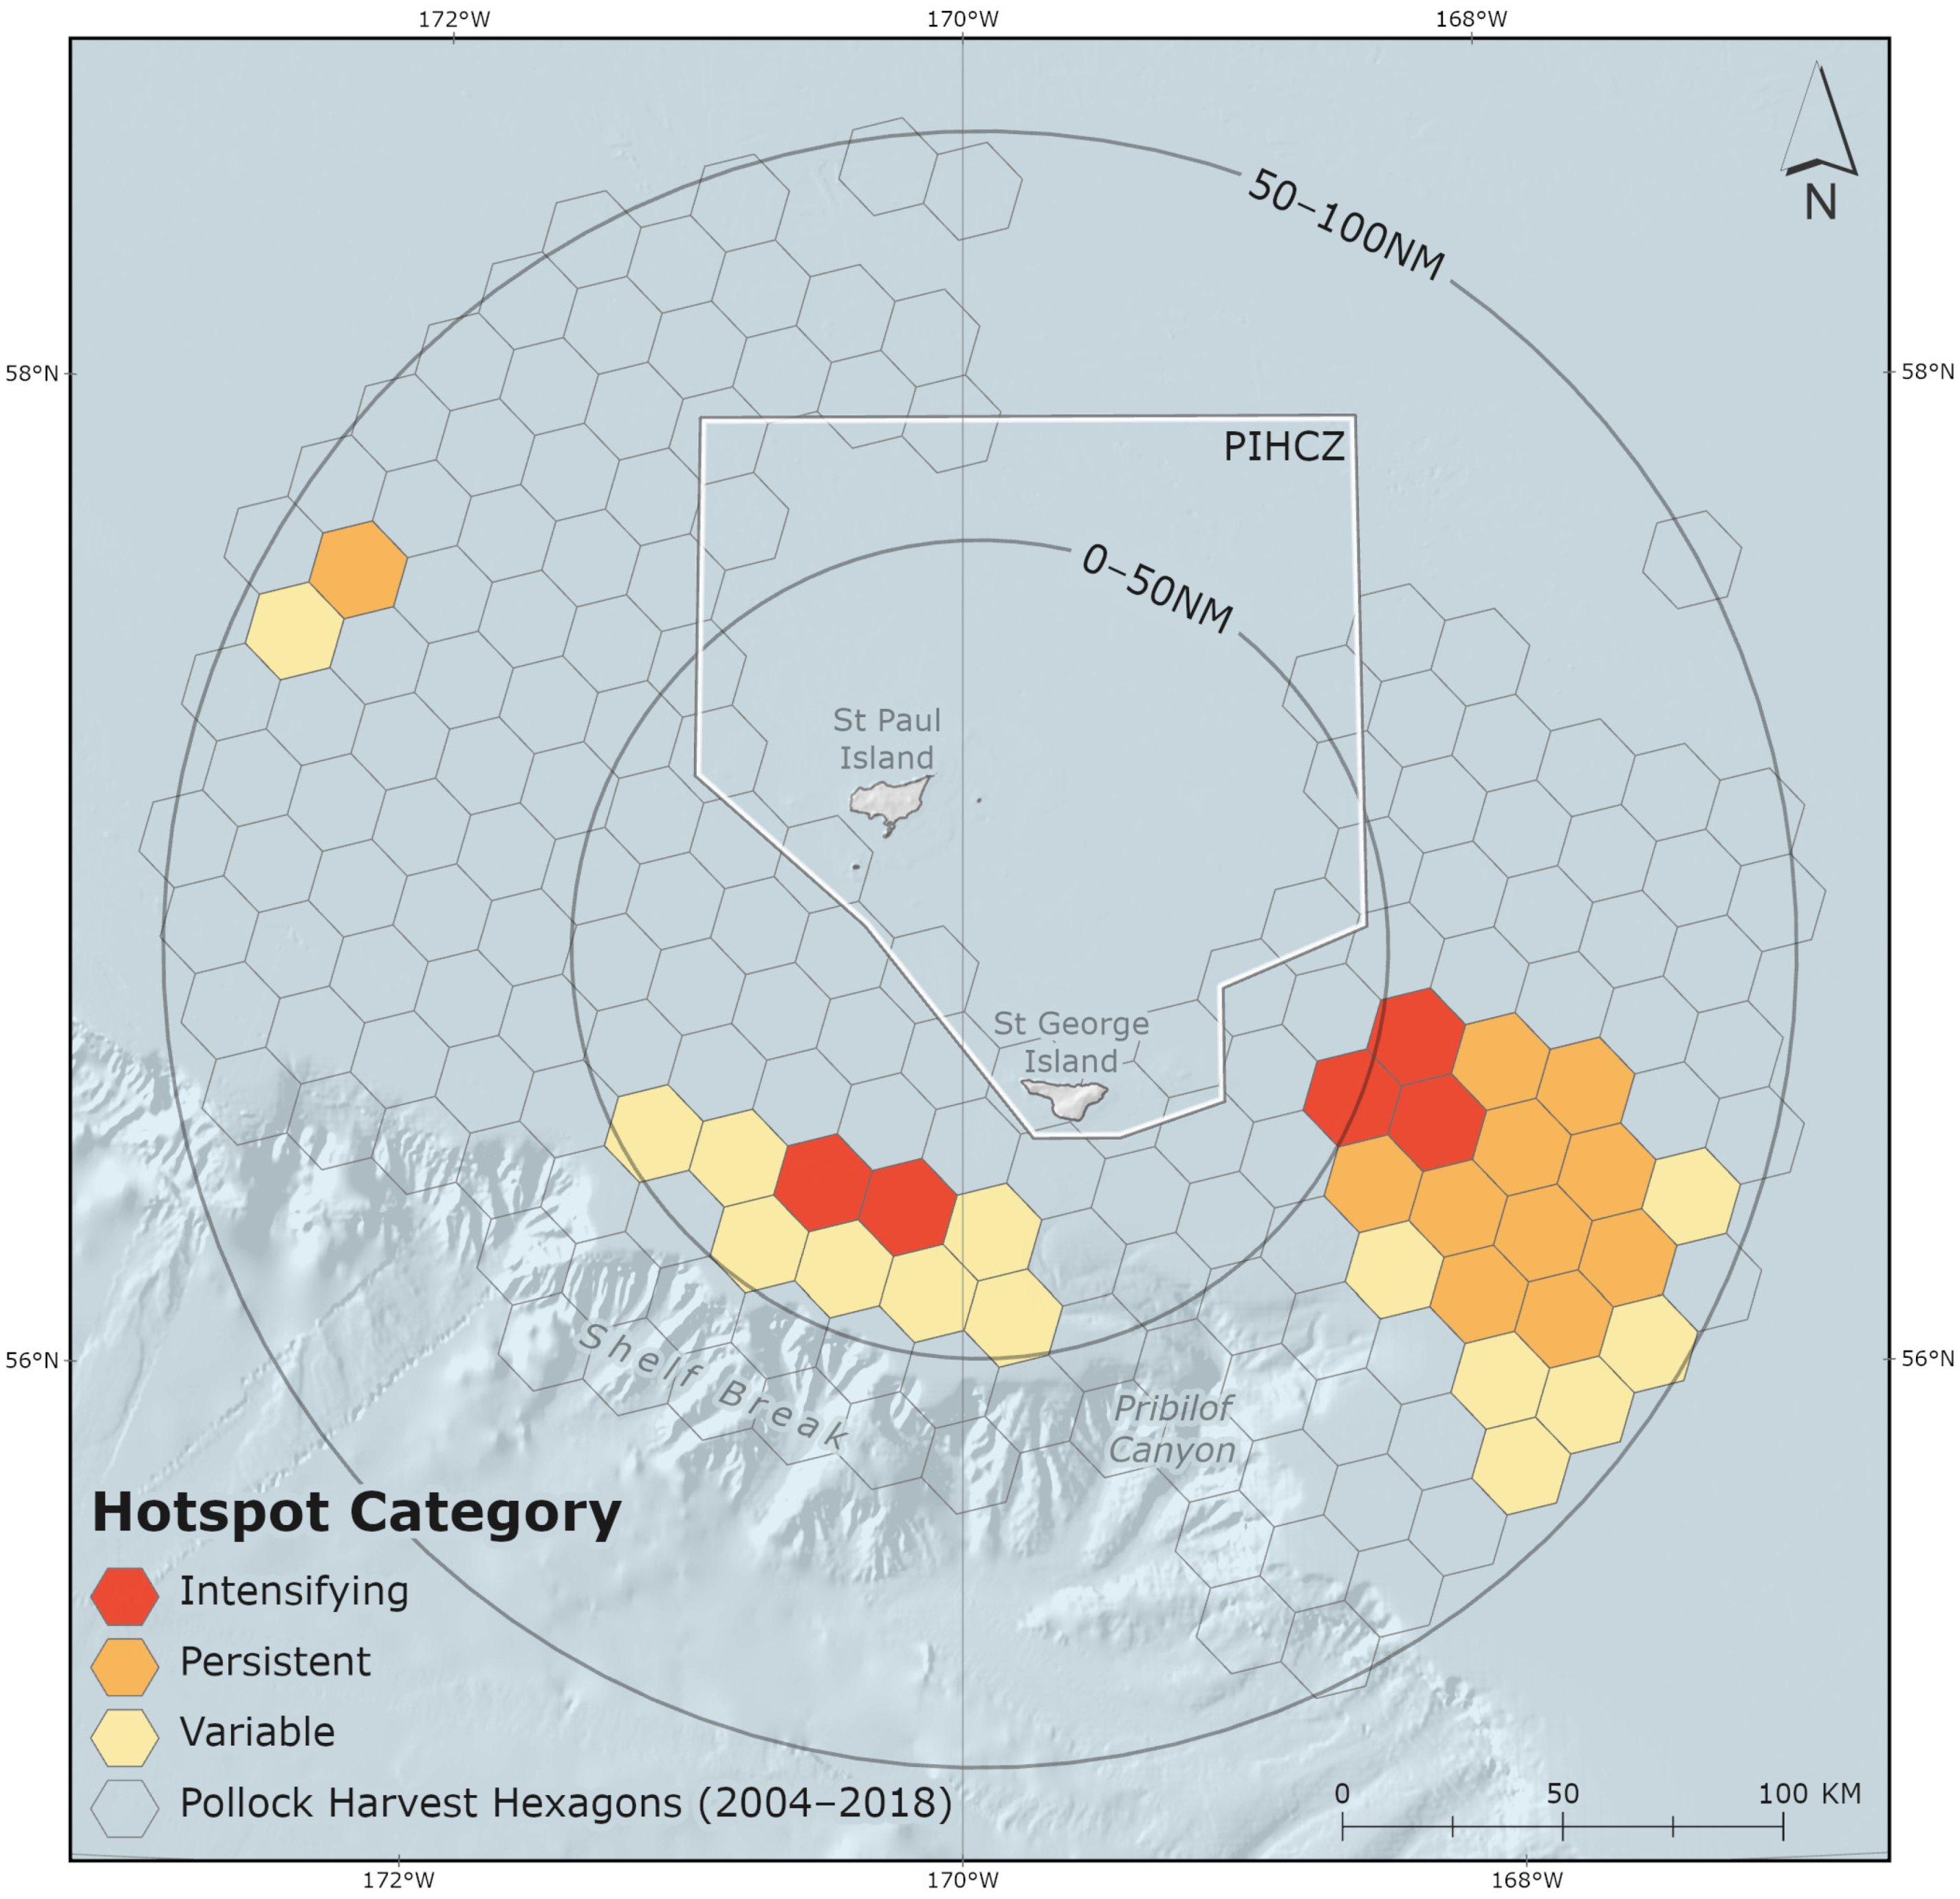
Publisher’s Note: MDPI stays neutral with regard to jurisdictional claims in published maps and institutional affiliations. |
© 2022 by the authors. Licensee MDPI, Basel, Switzerland. This article is an open access article distributed under the terms and conditions of the Creative Commons Attribution (CC BY) license (https://creativecommons.org/licenses/by/4.0/).