Article

Holistic Energy Efficiency and Environmental Friendliness Model for Short-Sea Vessels with Alternative Power Systems Considering Realistic Fuel Pathways and Workloads

1
Faculty of Mechanical Engineering and Naval Architecture, University of Zagreb, Ivana Lučića 5, 10002 Zagreb, Croatia
2
School of Transportation and Logistics Engineering, Wuhan University of Technology, Wuhan 430063, China
*
Author to whom correspondence should be addressed.
J. Mar. Sci. Eng. 2022, 10(5), 613; https://doi.org/10.3390/jmse10050613
Submission received: 2 April 2022 / Revised: 23 April 2022 / Accepted: 27 April 2022 / Published: 30 April 2022
(This article belongs to the Section Ocean Engineering)

Abstract

:
Energy requirements push the shipping industry towards more energy-efficient ships, while environmental regulations influence the development of environmentally friendly ships by replacing fossil fuels with alternatives. Current mathematical models for ship energy efficiency, which set the analysis boundaries at the level of the ship power system, are not able to consider alternative fuels as a powering option. In this paper, the energy efficiency and emissions index are formulated for ships with alternative power systems, considering three different impacts on the environment (global warming, acidification, and eutrophication) and realistic fuel pathways and workloads. Besides diesel, applications of alternative powering options such as electricity, methanol, liquefied natural gas, hydrogen, and ammonia are considered. By extending the analysis boundaries from the ship power system to the complete fuel cycle, it is possible to compare different ships within the considered fleet, or a whole shipping sector, from the viewpoint of energy efficiency and environmental friendliness. The applicability of the model is illustrated on the Croatian ro-ro passenger fleet. A technical measure of implementation of alternative fuels in combination with an operational measure of speed reduction results in an even greater emissions reduction and an increase in energy efficiency. Analysis of the impact of voluntary speed reduction for ships with different power systems resulted in the identification of the optimal combination of alternative fuel and speed reduction by a specific percentage from the ship design speed.

1. Introduction

1.1. Regulatory Framework for Energy Efficiency and the Environmental Footprint in the Shipping Sector

Since the Kyoto Protocol in 1997, Greenhouse Gases (GHGs) have been recognized as gases that negatively affect the Earth’s climate, causing global warming; therefore, their concentration in the atmosphere needs to be reduced [1]. Their main anthropogenic source is fossil fuel combustion, and the major reduction needs to be tackled by the energy and transport sector [2].
In the shipping sector, fossil fuels such as Heavy Fuel Oil (HFO) and Marine Diesel Oil (MDO) are still mainly used for powering the ships. However, they have a high carbon content, and their combustion produces great amounts of carbon dioxide (CO2), which is the main GHG, together with pernicious emissions of nitrogen oxides (NOX) and sulfur oxides (SOX) [3]. In order to deal with the increased emissions due to extensive use of fossil marine fuel, the International Maritime Organization (IMO) set several standards for their control within the International Convention for the Prevention of Pollution from Ships (MARPOL) [4]. By establishing Emission Control Areas (ECAs), IMO established control over SOX and NOX emissions released by ships in specific areas, where emission requirements are relatively strict [5]. SOX is controlled based on the allowed sulfur content in fuel, while the NOX limit depends on the engine’s maximum operating speed. The NOX regulation standards Tier I and Tier II refer to the global area of navigation, while Tier III is specified for the NOX ECAs [6].
One of the most important attempts to reduce CO2 emissions generated by the shipping sector was the introduction of energy efficiency regulation in 2011 by IMO, according to which every ship of GT = 400 and above engaged in international shipping needs to have the International Energy Efficiency (IEE) Certificate. In order to obtain it, the ship must comply with the Energy Efficiency Design Index (EEDI) requirements and have the Ship Energy Efficiency Management Plan (SEEMP). SEEMP is an operational measure for improvement of ship energy efficiency applicable to all ships above GT = 400, while EEDI represents a technical measure of energy efficiency expressed as a ratio of mass flow of CO2 per transport work, which should be calculated for each new ship lower or equal to the required EEDI [7]. EEDI was first shown as a CO2 emissions index, also representing a ratio of CO2 emission and transport work (g CO2/ton mile), but it was calculated in a more simplified manner [8].
In order to expand the energy efficiency requirements on existing ships, in 2021, IMO imposed new regulations including the Energy Efficiency Existing Ship Index (EEXI) and Carbon Intensity Indicator (CII), which will become applicable on 1 January 2023. Such as its predecessor EEDI, EEXI should be applied for all ships above 400 GT falling under MARPOL Annex VI; however, unlike EEDI, EEXI applies to existing ships outside EEDI regulations [9,10]. While EEXI refers to the technical measure of energy efficiency, CII represents the operational measure of energy efficiency and needs to be embedded into SEEMP. CII measures CO2 emissions per transport work, and it applies on ro-ro passenger, cargo, and cruise ships over 5000 GT [11].
A ship’s EEDI is based on sea trials at delivery and adjusted to calm water conditions. However, calm water is an unrealistic state and rarely occurs. Lindstad et al. [12] indicated that without adjusting tests to include realistic conditions (influence of wind and waves), GHG reduction would not be as much as desired. Since shipping results in pernicious emissions that impact the environment through various processes, Ančić et al. [13] introduced the Energy Efficiency and Environmental Eligibility Index (I4E), which combines different environmental impacts of CO2, NOX, and SOX emissions. The authors analyzed the fleet of ro-ro passenger ships; however, they did not consider alternative powering options besides diesel as a marine fuel. Ančić et al. [14] presented a new methodology based on a holistic approach to analyze the energy efficiency of ships with Integrated Power Systems (IPS) based on their technical and hydrodynamic properties. They analyzed the energy efficiency of the ro-ro passenger fleet consisting of 384 ships, out of which 48 had IPS or Hybrid Power Systems (HPS). The results indicated that the ships with HPS and IPS were more energy-efficient than the fleet average. In both studies, the authors attempted to modify current energy efficiency requirements for ro-ro passenger ships, which are predominately powered by diesel engines. The accuracy of EEDI to represent the environmental impact of future ship power systems was investigated in a study by Trivyza et al. [15] using a tanker and cruise ship. They performed a comparison of EEDI and lifetime CO2 emissions for different ship power system solutions with included after-treatment systems (exhaust gas scrubber, selective catalytic reduction system, and carbon capture system) and energy efficiency technologies (waste heat recovery system and shaft generator). The results indicated that EEDI and lifetime CO2 emissions point out different options as optimal, and even for solutions that include greener technologies, EEDI did not manage to describe the real environmental impact of both tanker and cruise ship power systems. However, the study did not investigate any other alternative fuel except natural gas, and the lifetime CO2 refers to the CO2 emissions released from the ship operation during the lifetime exploitation period.
By following the IMO’s decarbonization strategy, which states that ships engaged in international shipping should reduce their annual GHG emissions by 50% by 2050 and decrease their carbon intensity by 40% by 2030 and 70% by 2050 (all compared to 2008 levels [16]), the approach of analyzing the energy efficiency of a ship should be improved with some decarbonization measures. Hüffmeier and Johanson [17] presented state of the art methods for the improvement of ship energy efficiency. They indicated that the way towards greener shipping requires the implementation of technical and operational measures onboard vessels together with policy changes in order to reduce fossil fuel consumption on the entire shipping industry level.

1.2. Environmental Impact Reduction Measures

The required increase in energy efficiency and reduction of the environmental impact of ships can be achieved by the implementation of decarbonization measures. Most of them ultimately lead to the reduction of fossil fuel consumption through the improvement of ship design, reduction of ship resistance, application of energy-efficient power systems, speed reduction, or imposition of a charge for ships that use fossil fuel [18,19].
Technical measures relate to the phase of ship design. Hull design, optimization of propeller/trim/speed, and minimizing losses lead to a reduction of required power, and consequently fossil fuel consumption and emissions. Minimal losses can be achieved either by the improvement of equipment or by rearranging the ship power system in an IPS or HPS [20]. The implementation of Renewable Energy Sources (RESs) onboard ships also leads to the reduction of their environmental footprint. RESs are not used alone; they are usually integrated within HPS [21] or electric ship power systems, such as the implementation of photovoltaic cells in a battery-powered ship [22]. The greatest technical measure for the reduction of the environmental impact of ships is the ultimate replacement of conventional power systems with alternative power by alternative cleaner and greener fuel, preferably with zero carbon content [23]. The advantages and disadvantages of certain marine fuels are summarized in Vladimir et al. [24]. Currently, the most-used alternative marine fuels are fossil Liquefied Natural Gas (LNG) and methanol. These two fuels are fossil fuels with lower carbon content than diesel fuel [25,26]. One of the alternative solutions that offers zero-emission shipping, i.e., ship operation without tailpipe emissions, is full electrification with only energy storage, such as a battery [27]. Shipping can be considered as zero-emission only if the analysis boundary is set at the level of the ship power system or the ship itself, but not to the overall power generation process. In spite of the greatly reduced environmental impact and well-known technology, the battery-powered ship is investigated for the short-sea shipping sector, and not for ocean-going vessels [28]. The main limitations of the battery-powered ship are investment costs and range on which the ship can operate, which depend on battery capacity and its energy density [29]. Along with electricity, hydrogen and ammonia are also considered as zero-carbon fuels applicable for maritime purposes. They cannot be used in the internal combustion engine, but rather in fuel cells, due to their fast kinetics and higher efficiency [30]. Due to the absence of tailpipe emissions, the environmental footprints of such zero-emission solutions are usually investigated with the Life-Cycle Assessment (LCA) [31].
Technical measures refer to the design of the ship, while operational measures tend to reduce emissions during the ship’s operation and do not require great investment costs. Weather routing, voyage optimization, fleet management, optimized maintenance, and slow steaming are some of the operational speeds that are usually used for the reduction of fossil fuel consumption [19]. Slow steaming refers to voluntary speed reduction to speeds significantly below design speed, and it is a great operational measure for emission reduction [32]. Since fuel consumption and main engine power depend on ship speed, with its reduction, fossil fuel consumption is also reduced. When observing total ship power, including the main and the auxiliary engines, greatly reducing the speed increases the amount of required energy, as indicated in a study by Ritari et al. [33].
Each measure contributes to the emission reduction at a certain level, but the combination of technical and operational measures would result in an even greater reduction of GHGs, SOX, and NOX emissions.

1.3. Research Gap and the Aim of the Paper

Conventional power systems remain dominant in the shipping sector. However, stringent environmental regulations and strategies are forcing the shipping sector towards the implementation of energy-efficient and greener solutions. The application of cleaner fuels with lower carbon content than currently used marine fuel has the great potential to achieve emission reductions. This is recognized by shipbuilders and ship-owners; recently, the percentage of ships powered by alternative power systems has significantly increased among new orders (Figure 1) [34]. Therefore, formulation of a relevant index to assess energy efficiency and environmental friendliness of such vessels is ever more important, since this trend can be expected in the future.
In this paper, the formulation of an energy efficiency index applicable for ships with alternative powering options is presented. Besides diesel, which served as a baseline scenario, five alternative fuels were investigated (electricity, methanol, LNG, hydrogen, and ammonia). The analysis of the emissions released by different power systems was done by the LCA, considering three impact categories, namely global warming, acidification, and eutrophication. Additionally, an economic analysis including revenues and expenditures related to ship operation was performed. The applicability of the model was illustrated on the Croatian ro-ro passenger fleet.
This paper proposes a mathematical model for the simultaneous assessment of ship energy efficiency and environmental friendliness, which can be applied not only to diesel-engine-powered ships, but to a range of alternative powering options. It is evident that at the level of the ship power system, some vessels, e.g., an electric ship, can be neutral in terms of the environment, but only a complete energy production pathway can offer an insight into their exact environmental impact. For this purpose, calculation of the I4E index presented by Ančić et al. [13] is extended to the complete fuel pathway in the LCA environment. Energy efficiency and environmental friendliness levels determined in this way do not represent the feature of the ship itself, but clearly indicate whether some technical solutions and the way the ship power system is exploited are beneficial for the environment or not. It should be noted that the presented model which simultaneously considers ship energy efficiency and environmental friendliness should not be applied to compare ships from different shipping sectors (even if they are within the same type). This formulation considers fuel pathways and energy mix, which are specific to a certain location.
The analysis of speed reduction on calculated emissions and economic profit related to certain ships will produce the optimal solution that combines technical (alternative fuel) and operational (speed reduction) measures to greatly reduce the environmental footprint and increase the profit.
The main contributions of this paper can be summarized as follows:
  • Development of the energy efficiency index applicable for ships with alternative power systems, which considers different impact categories of ships’ environmental footprint and life-cycle emissions.
  • Identification of a combination of optimal technical and operational measures that results in lower costs, emissions, and ultimately a lower energy efficiency index compared to currently used diesel power system configurations.
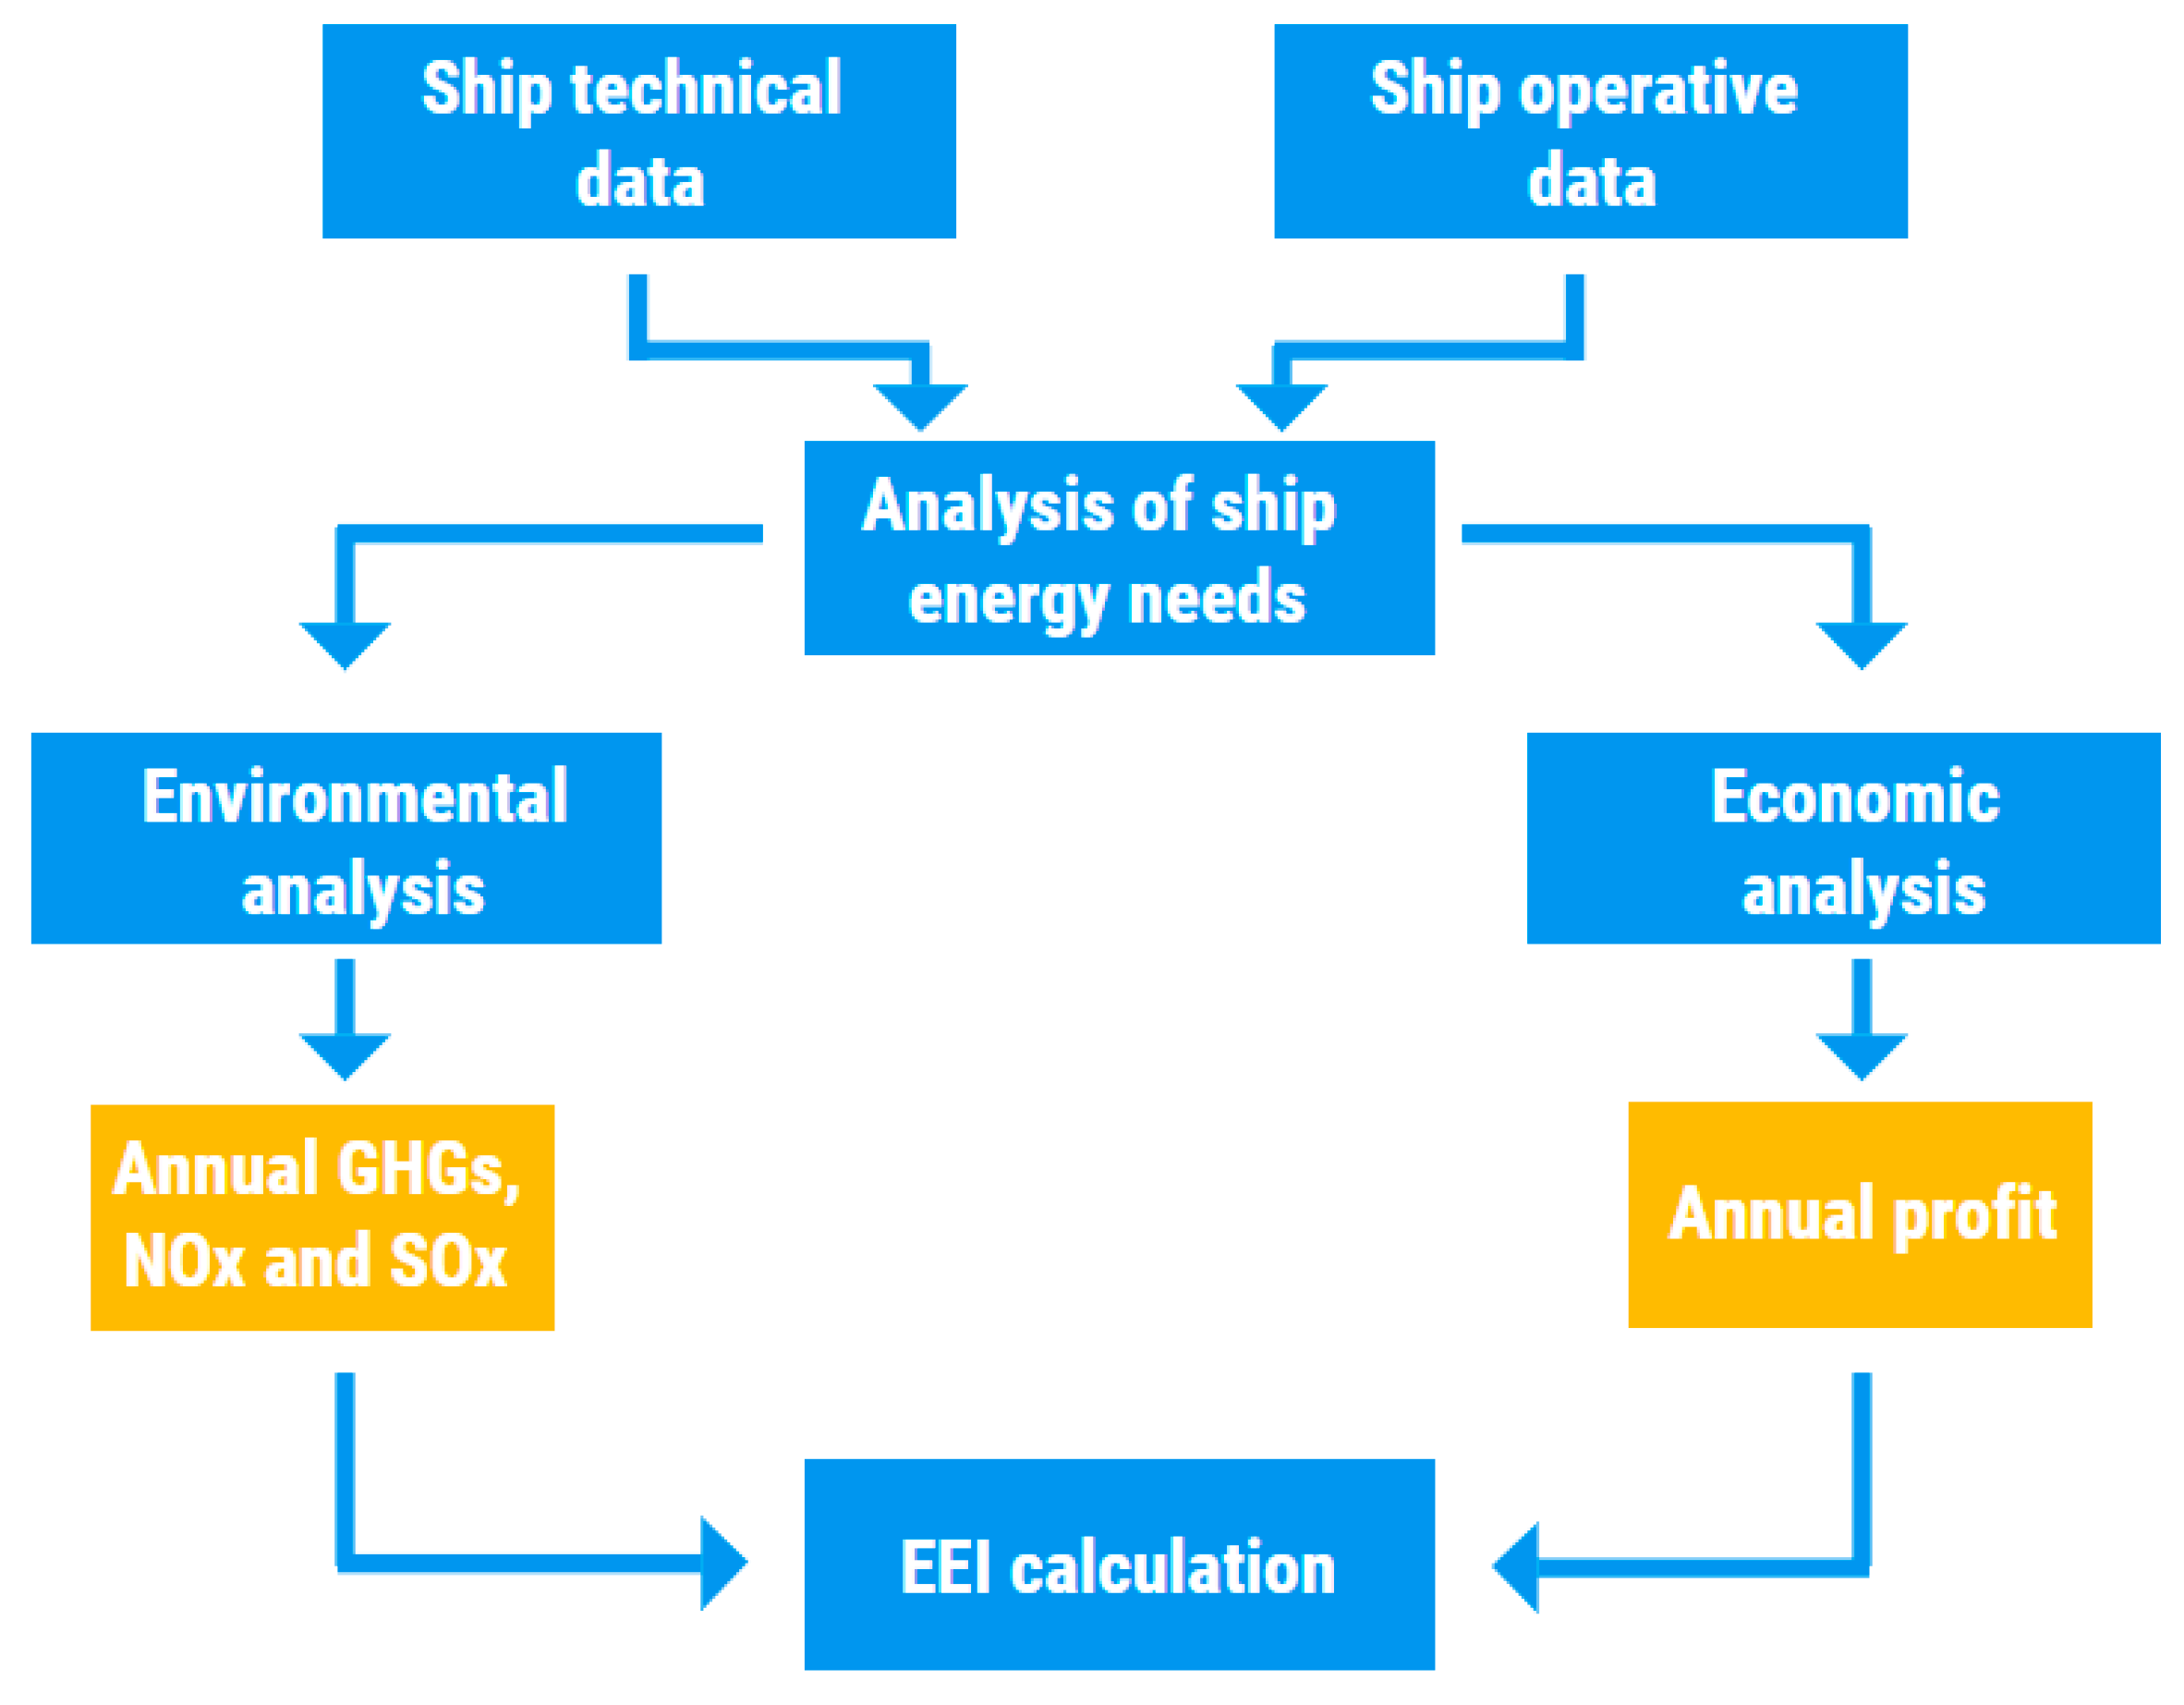
2. Methodology

2.1. Formulation of Energy Efficiency Index for Ships with Alternative Powering Options

The purpose of energy efficiency indexes is to provide a fair comparison of ships, stimulate their development toward implementation of greener and energy-efficient technologies, and establish minimum energy efficiency for ships that undergo specific energy efficiency index requirements [14]. According to EEDI and EEXI, the energy efficiency of a ship is expressed as a ratio between the CO2 mass flow produced by the ship power system, i.e., CO2 tailpipe emissions (numerator), and the transport work, i.e., benefit for the society (denominator) [9]. For ships with alternative power systems, these indexes are not applicable, especially since some alternative fuels, such as hydrogen, electricity, ammonia, etc., result in the absence of tailpipe emissions, creating a value of zero.
Besides GHGs, which refer to emissions of CO2, methane (CH4), and nitrous oxide (N2O), the combustion of marine fossil fuel also results in the release of pernicious emissions such as NOX and SOX. GHGs contribute to global warming, while SOX and NOX emissions negatively affect human health and terrestrial and aquatic ecosystems through the processes of acidification and eutrophication [35]. In order to investigate a ship’s impact on the environment through different impact categories and to evaluate its energy efficiency, the I4E index presented in [13] is modified into energy efficiency and emission index (EEI), which is applicable for ships powered by alternative power systems:
E E I = α   ·   G W P + β   ·   A P + γ   ·   E P B S ,
where an evaluation of different emission contributions is performed by involving the Global Warming Potential (GWP), Acidification Potential (AP), and Eutrophication Potential (EP), while BS refers to the benefit for the society. The determination of the weighting factors (α, β, and γ) is complicated, and it depends on the area of application. In this paper, the weighting factors (α = 0.095; β = 18.3; γ = 21.1) are obtained from the study by Ančić et al. [13], which also considers the ro-ro passenger ships that spend much more time in ports and near populated areas than other ships. Because of this, the NOX and SOX directly impair the air quality for the local population, while the GHGs, in this case, are not so pernicious. They contribute to air pollution on a global scale, while NOX and SOX are primarily local pollutants. As can be seen from several references, normalization of emissions and selection of weighting factors can be done in different ways depending on the assumed impact of the considered item. Therefore, a sensitivity study of the weighting factors used is included in the discussion.
GWP represents a measure of how much energy the emission of one ton of a gas will absorb over a given period relative to the emission of 1 ton of CO2. It is calculated by multiplying CO2-equivalent (CO2-eq) factors over 100 years (CO2: 1; CH4: 36; N2O: 298) [36]:
G W P = ( 1   ·   E C O 2 + 36   ·   E C H 4 + 298   ·   E N 2 O ) .
AP is calculated by multiplying the emissions of a particular acidifying gas by the SO2-equivalence factors (SO2-eq) (SOX: 1; NOX: 0.7), as in the following equation [37]:
A P = 1   ·   E S O x + 0.7   ·   E N O x
EP is calculated by multiplying the NOX emission with PO4-equivalence factor (PO4-eq) (NOX: 0.13) according to the following equation [37]:
E P = 0.13   ·   E N O x
In order to compare different power systems, whether they result in tailpipe emissions or not, the annual life-cycle emissions are considered, while the BS refers to the annual profit of a particular ship. The calculations of EEI for different power systems are performed according to the procedure presented in Figure 2.
In the first step of the methodology, certain ship data regarding ship design and operation are required to assess the ship energy needs. The obtained results represent inputs for environmental and economic analyses. Those results are annual emissions and annual profit, which are used to calculate different environmental impact potentials (GWP, AP, and EP), and finally lead to the calculation of EEI.

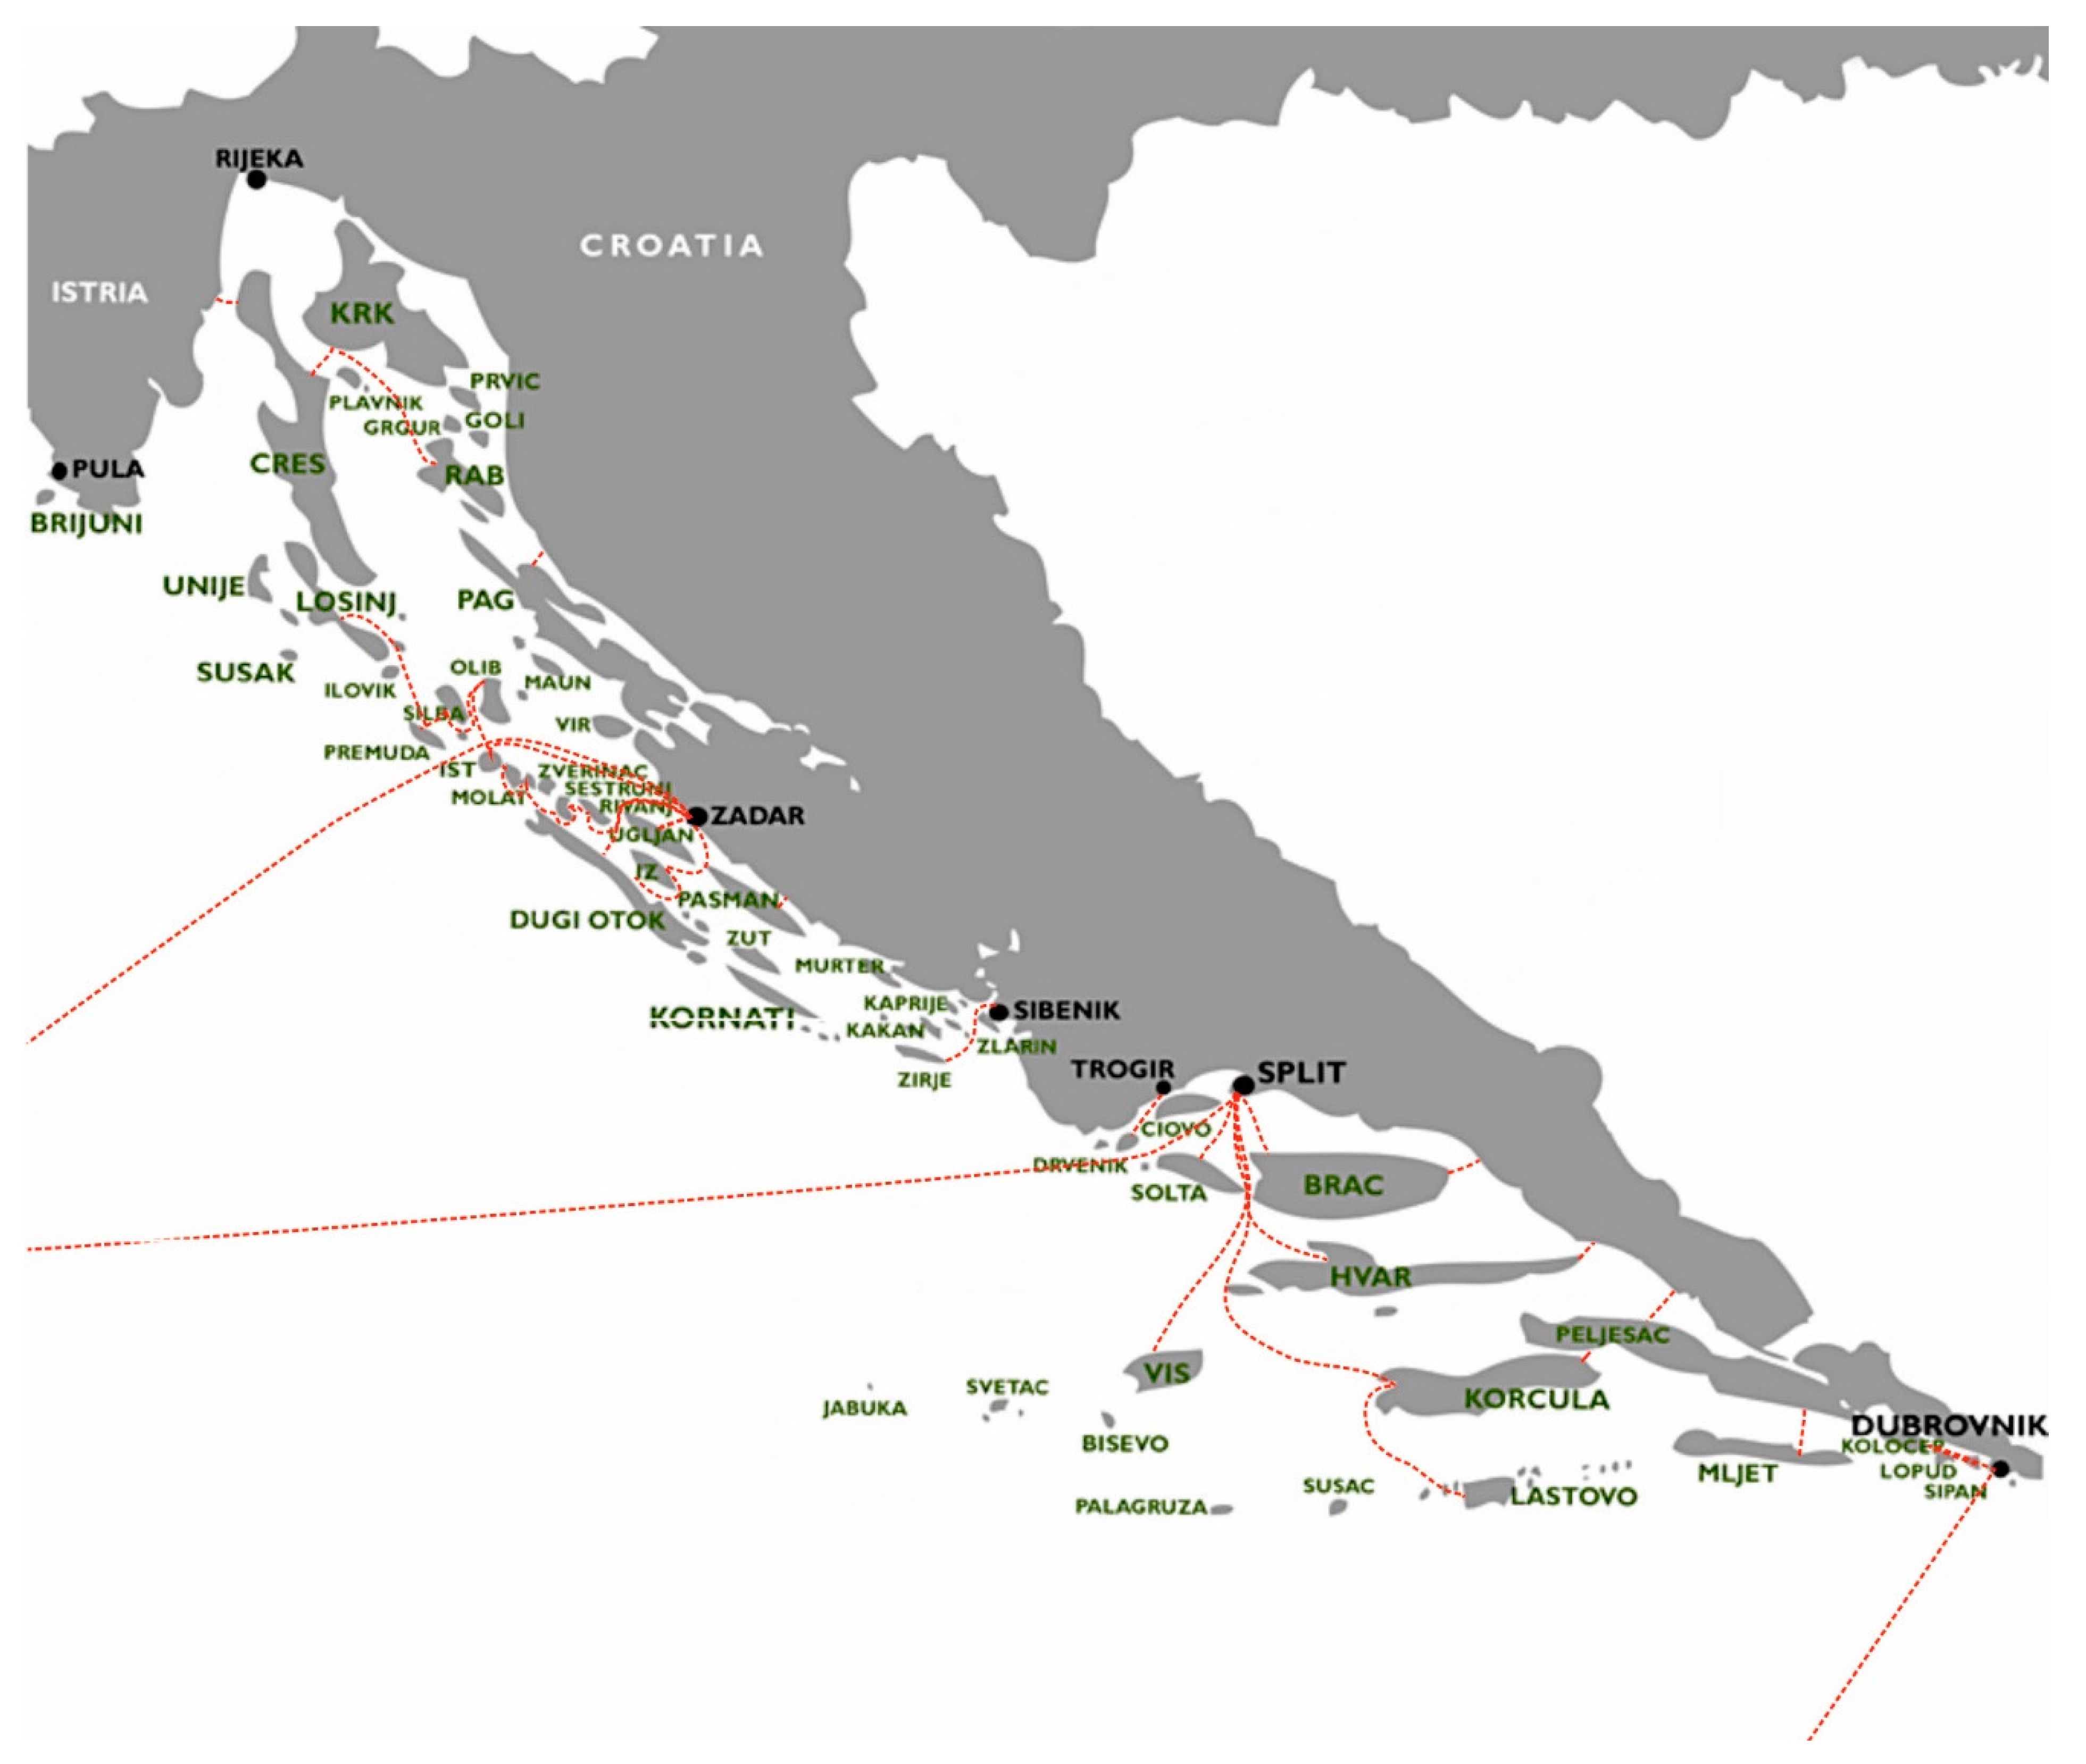
2.2. The Croatian Ro-Ro Passenger Fleet

The ro-ro passenger ships, i.e., ferries, are ships that transport passengers and vehicles short distances. The considered Croatian ro-ro passenger fleet consists of diesel-powered ships that operate in the Adriatic Sea on 23 domestic lines and 3 international lines connecting Croatia and Italy [20] (Figure 3). In this paper, only domestic ferry lines are considered.
These ships connect Croatian islands and the mainland, thus spending a considerable amount of time near populated areas and directly impairing the air quality of the surrounding area. Therefore, the emission reduction of such ships is very important [38,39].
The particulars of ships that operate on 22 ferry lines are presented in Table 1. One ferry line is omitted from the analysis since, during the two-stop route, the ship is altered with another ship. The data on design speed, vd (kn), main engine power, PME (kW), and auxiliary engine power, PAE (kW), required for average speed and energy needs calculation, were obtained from the Croatian Register of Shipping [40]. Duration of a trip, t (h) and its length, l (nm), annual number of round trips (NRT) for each ship together with average prices of a ticket for a vehicle, PRV (€), and a passenger, PRP (€), were taken from [41], while the data of the annual number of transported passengers, NP, and vehicles, NV, on particular lines were obtained from [42].
In order to calculate the fleet’s energy needs by following the cubic relation between ship power and its speed [43], the average operating speed, vave (kn), needs to be obtained, since it usually differs from the ship design speed due to voluntary speed reduction (slow steaming), maintaining the shipping schedule, etc. Therefore, by dividing the route length with its duration, vave is calculated. The average main engine power, PME,ave (kW) is then calculated with the following equation:
P M E , a v e = ( P M E · 0.8 ) · ( v a v e v d ) 3
The average load of the auxiliary engine(s) is estimated to be 50%. By summing PME,ave and PAE,ave, the total average ship power is calculated. The energy consumption per distance, EC (kWh/nm), can be calculated as follows:
E C = P a v e v a v e   ,
while the annual energy consumption, ECAn (kWh) is calculated according to:
E C A n = N R T   ·   2   ·   l   ·   E C
The general expression for the calculation of fuel consumption per distance, FC (kg/nm) is:
F C = E C   ·   S F C   ,
where SFC (kg/kWh) refers to the specific fuel consumption. The annual fuel consumption is calculated in the same way as ECAn with Equation (8).
Data on energy consumption are required for the environmental assessment as an input for the LCA, while the data on both fuel consumption and energy consumption are necessary for cost analysis.

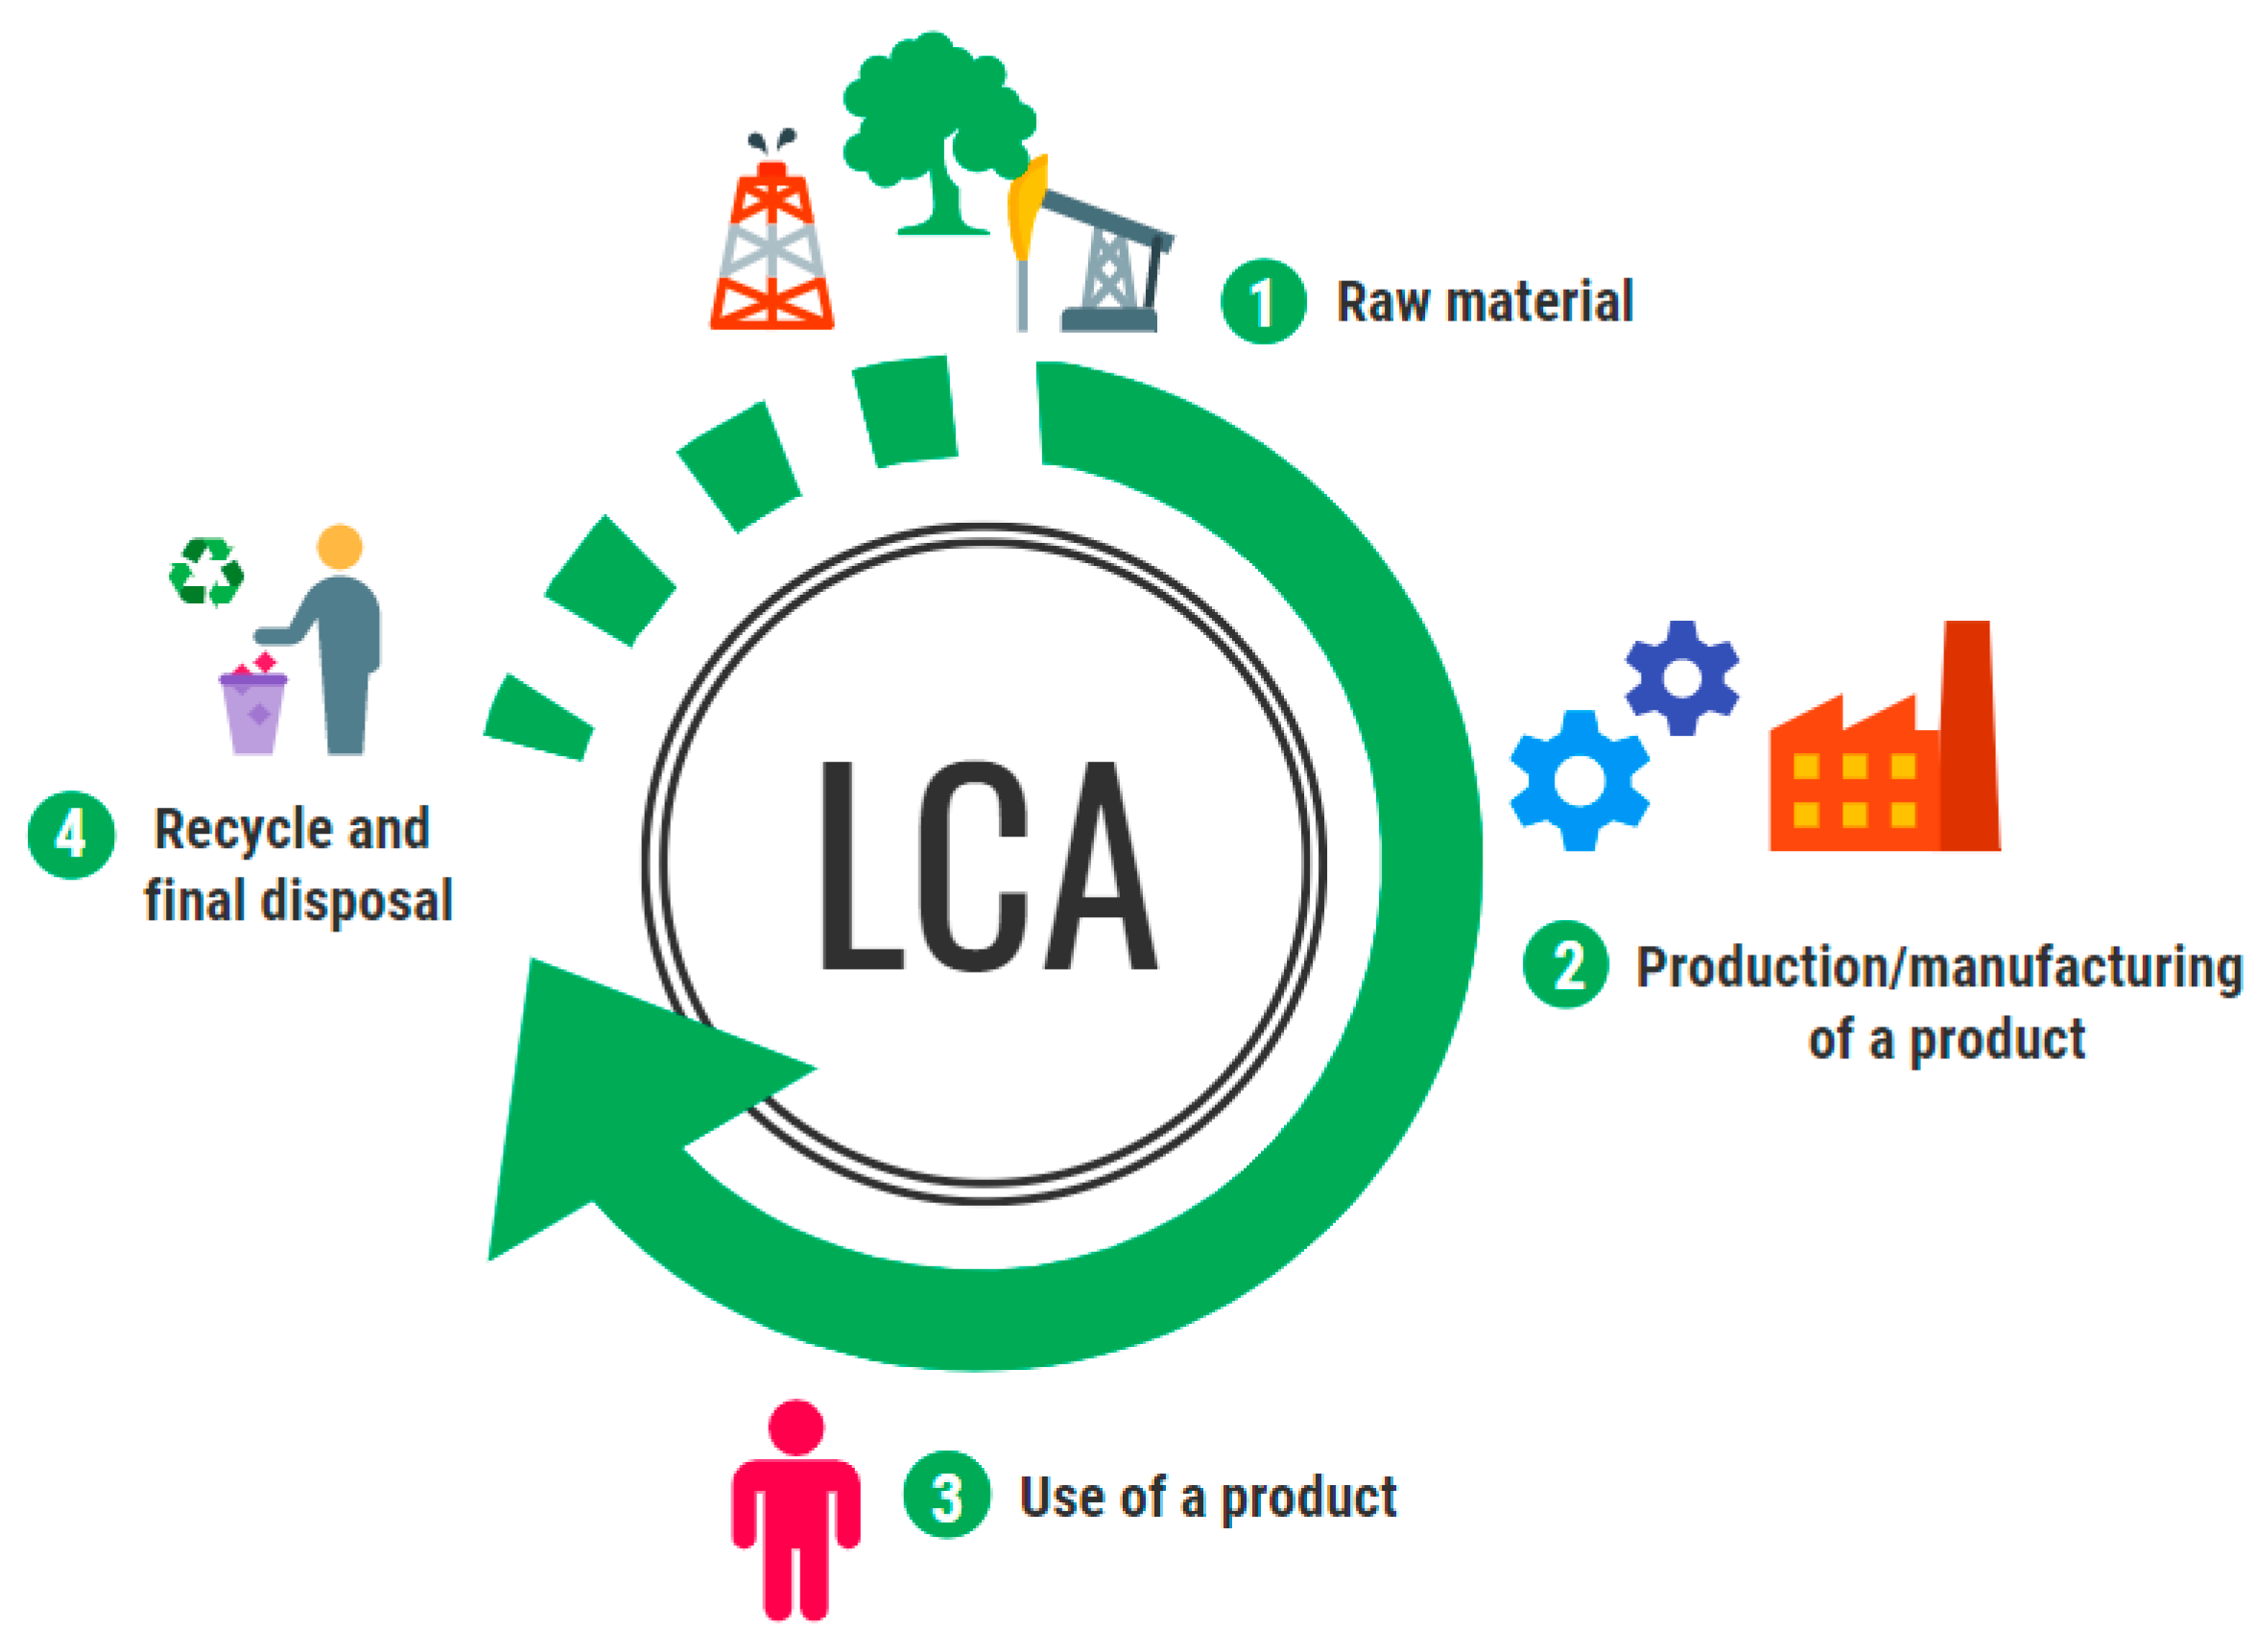
2.3. Environmental Analysis

The LCA represents a method for assessing the environmental impact of a product, process, or system by considering emissions released through their stages of a life cycle [44] (Figure 4).
In this study, the life-cycle emissions of different power systems were obtained by performing LCA by means of GREET 2020 software [45]. The annual GHG, SOX, and NOX emissions are related to a fuel cycle, which includes processes from raw material extraction and its transportation to the production facility, production of fuel and its distribution to the refueling station, and use of the fuel in a ship power system that results in tailpipe emissions. The specific processes included in the LCAs and the mathematical models of implementation of alternative fuels in ship power systems were obtained from [46,47].

2.4. Economic Analysis

The performed economic analysis investigated lifetime revenues and expenditure related to ship operation in order to calculate the benefit for the society, BS (€), of the observed ro-ro passenger fleet. BS represents the economic profit of a particular line, calculated with the following equation:
B S = R e v e n u e E x p e n d i t u r e ,
where the revenue and expenditure are calculated on an annual basis. Revenue refers to the income of the sold tickets, and it is calculated by multiplying the average prices of tickets and the annual transported passengers and vehicles from Table 1:
R e v e n u e =   N P   ·   P R P + N V   ·   P R V   .
Expenditure refers to the sum of investment, maintenance, equipment replacement, and fuel costs. The costs related to the ship power system fueled with hydrogen and ammonia are gathered from a study by Perčić et al. [30], while costs related to the ship power system fueled with other considered fuels are obtained from [46].

3. Results and Discussion

The environmental and economic analyses of the Croatian ro-ro passenger fleet were performed in order to calculate the EEI that is applicable to ships with alternative fuels and their different impacts on the environment. In the following results, D denotes diesel, E is electricity, M stands for methanol, H refers to hydrogen, and A denotes ammonia.
Firstly, the environmental analysis was performed in which annual GHGs, NOX, and SOX emissions were calculated. The fuels with the highest amount of GHG emissions expressed were ammonia and hydrogen. Although they are zero-carbon fuels, it was considered that they are produced from natural gas, i.e., fossil fuel, and their production processes lead to great atmosphere pollution via GHG emissions. The alternative solution that provides the lowest contribution to global warming is the full electrification with Lithium-ion (Li-ion) battery, with around 50% less GHGs than the diesel-powered ship, followed by methanol and LNG used in dual-fuel engines. Regarding NOX emissions, the diesel-powered ship has the highest amount due to its tailpipe emissions, with 98% higher emissions than the battery-powered ship, which has the lowest life-cycle NOX emissions among considered fuels. However, when observing life-cycle SOX emissions, electrification does not represent a great alternative option, since electricity generation resulted in a great amount of SOX emissions. Electrification produced only slightly less emissions than the diesel power system configuration, which is mainly due to the electricity mix used for its production.
The results of the economic analysis highlighted electrification as the most cost-effective option among those considered. However, the analysis also revealed that two ships operating on ferry lines (Zadar—M. Lošinj and Suđurađ—Dubrovnik) are not profitable, even when they are powered by diesel fuel. Therefore, those two ships were omitted from further analysis and calculation of EEI.
Economic analysis indicated that the LNG power system configuration onboard ships with small annual mileage results in the highest costs, mainly due to the high investment and fuel cost. However, although hydrogen price is high (3.3 €/kg), its use in a fuel cell onboard ships with lower annual mileage resulted in lower overall costs than LNG, mainly due to the lower investment costs of low-temperature Proton Exchange Membrane Fuel Cells, which are the cheapest available fuel cells. Moreover, short route length and a moderate number of round trips per year result in absence of equipment replacement costs during the ships’ exploitation period, since the lifetime of the main equipment of that power system depends on the ship’s operating hours. However, the hydrogen power system configuration implemented on ships with moderate or high annual mileage represents the powering options with the highest costs due to the long routes and long operating hours during the ship’s lifetime.
Based on the data from environmental and economic analyses, EEIs, expressed in kg emission-eq per €, were calculated for the 20 ro-ro passenger ships powered by different power systems (Figure 5). The ships are lined up from the shortest to the longest route.
A ship with an alternative power system is considered energy efficient and environmentally friendly if its EEI is lower than the EEI of a diesel-powered ship. Diesel power is currently used in selected ships, and it is the most represented power system in the shipping sector. According to the results presented in Figure 5, each considered alternative powering option is a better power solution than the diesel-powered ship, while the full electrification with only a battery represents the most energy-efficient and environmentally friendly option among those considered.
The results presented in Figure 5 also highlighted two ships that operate on ferry lines Valbiska-Lopar and Zadar-Ist which result in very high EEIs compared to the rest of the considered fleet. Those two hydrogen-powered ships have a greater EEI than the ammonia-powered ship, which is not the case for the rest of the fleet. The main contributors to their high EEIs are high emissions and very low profits. With the low revenue, the difference between the cost of ammonia and hydrogen comes to light. Hence, the hydrogen results in higher costs and its use greatly affects the profit on this line, while the use of ammonia results in a higher profit of 43% compared to the profit of the hydrogen-powered ship.
In this paper, the EEIs are calculated for existing ships that navigate at the average operative speed, which is more appropriate than the calculation of EEIs using a design speed, since most of the ships operate in different regimes. Operative ship speed is often voluntarily reduced far below its design speed (slow steaming) to achieve fuel savings, which leads to emission reduction. An analysis of the impact of speed reduction on annual CO2-eq emissions and BS was performed, and the results are illustrated on the three selected ro-ro passenger ships. These ships are of different sizes, and they operate on different routes. Ship 1 operates on one of the shortest Croatian ferry lines, Ship 2 transports passengers and vehicles on a medium-range route, and Ship 3 operates on one of longest ferry lines in Croatia. More details on these ships can be found in previous works of the authors [30,46].
Firstly, the annual CO2-eq emissions and annual profit were calculated for an operating speed that is equal to the design speed (vd). Secondly, the operating speed was reduced by a step of 20% concerning the vd, and the corresponding emissions and profits were calculated for each speed. In the following results, 0.8vd denotes a reduction of 20%, 0.6vd refers to the reduction of 40%, 0.4vd represents the speed reduction of 60%, and ultimately 0.2vd denotes a reduction of 80% from the initial design speed. The results are presented in Figure 6 and Figure 7.
According to the results presented in Figure 6 and Figure 7, it can be concluded that with the speed reduction of 60% for Ship 1, and speed reduction of 40% for Ship 2 and Ship 3, the emissions and costs reach their minimum. With the further reduction of speed, their values increase. This is due to the consideration of the total power of the ship, i.e., main engine power and auxiliary engine power. If we only considered main engine power with the speed reduction, the emission and costs would be reduced, and the power–speed function would not have its minimum.
Speed reduction greatly affects the economic profit of fully electric ships due to its impact on each considered cost, while for ships powered by ammonia and hydrogen, the speed reduction only influences fuel costs. This is because other costs are related to the installed fuel cell power, and they are not dependent on operative features of the ship. Since the installed auxiliary engine power for both Ship 2 and Ship 3 is greater than for Ship 1, by lowering the speed to 80% of design speed, emissions and costs related to Ship 2 and Ship 3 increase much higher than the levels when the ship is operating at design speed. Optimal operational measure for Ship 1 is a speed reduction of 60%, while the results presented in Figure 6 and Figure 7 indicate that the optimal emission reduction combination of measures for Ship 2 and Ship 3 is full electrification with a speed reduction of 40%.
After identifying the optimal combination for the selected ships, their EEIs were calculated and presented in Figure 8 together with the EEIs for diesel and electricity when they operate at average speed and design speed.
The results of the EEI comparison in Figure 8 indicate a greater reduction of EEI for electric Ship 1 than for electric Ship 2 and electric Ship 3, compared to their diesel power system configuration. Since the existing diesel-powered Ship 2 is already operating at a lower speed than its design speed, a speed reduction of 40% from the design speed would result in prolongation of the duration of the trip by 6 minutes, while reducing GHGs and costs by 50% and 48%, respectively. Total EEI reduction, in that case, is 84%. However, when the combination of electrification and speed reduction of 40% is applied on Ship 3, EEI is reduced by 88% compared to the diesel-powered ship operating at average speed. Although it results in a GHG and cost reduction of 58% and 54%, respectively, the duration of the already very long ferry route is prolonged for 52 minutes. The full electrification and reduction of speed by 60% (0.4vd) from design speed represent the optimal combination of measures for Ship 1. The duration of the route would be prolonged for 15 minutes, and the total trip would last for 30 minutes, which seems to be acceptable, bearing in mind that this combination would lead to a 55% reduction of CO2-eq emissions, a 77% reduction of total costs, and a 92% reduction of EEI, compared to the ship’s emissions and profits when it is operating at average speed and powered by diesel engines.
The use of alternative fuels is location-specific, i.e., it depends on the energy mix used for fuel production, and on specific pathways and distribution chains of fuels. The sensitivity of EEI with respect to energy mix modifications is illustrated on Ship 2.
Based on previous results that indicate that electricity-powered ships are the most energy-efficient and environmentally friendly option among those considered, five different electricity mixes from different countries (Croatia, China, United States of America (USA), European Union (EU), and Norway), were observed to investigate the effect of electricity mix used on calculated EEI (Figure 9).
According to the results presented in Figure 9, it can be concluded that even though the fully electric ship offers zero-emission shipping and results in the lowest EEI among considered alternative solutions, the energy sources used for the electricity generation greatly affect the EEI. If the electrified Ship 2 is powered by a Chinese electricity mix, where electricity is generated mostly from coal (around 70%), the EEI compared to a diesel-powered ship would be 65% lower; with Croatian mix, the EEI is 84% lower. Moreover, by using the Norwegian electricity mix, where around 98% of electricity is obtained from hydropower, the reduction of EEI would be 99.5%, compared to a diesel-powered ship.
Most alternative fuels that are investigated for maritime purposes still have fossil origin, and their combustion and production result in high emissions. The emphasis needs to be put on the production of alternative fuels in a different and more environmentally friendly way. In order to investigate the impact of different fuel pathway production on EEI, the energy efficiency and environmental friendliness of Ship 2, powered by grey (Gy-H) and green hydrogen (Gn-H), are compared in Figure 10.
The comparison in Figure 10 shows that green hydrogen has 80% lower EEI than grey hydrogen, and even lower EEI than full electrification of a ship. The grey and green hydrogen have the same properties; their main difference is the way fuel is produced. Grey hydrogen, i.e., fossil hydrogen, is produced from natural gas, while green hydrogen is produced from electricity generated by RESs. The use of green hydrogen instead of grey hydrogen results in 84% lower CO2-eq emissions, 53% lower NOX emissions, and 95% lower SOX emissions. Although it is a very environmentally friendly fuel, the total costs for a ship power system fueled with green hydrogen are around 60% higher than for grey hydrogen, due to the higher price of green hydrogen (5.8 €/kg) in comparison to the price of grey hydrogen (3.3 €/kg).
Fuels considered in this paper can be supplied to Croatia from various distribution chains. In order to investigate the impact of different fuel supplies on EEI, a comparison of LNG supplied from the United Arab Emirates (UAE) and the USA was performed (Figure 11).
The stationary processes of the fuel cycle remain the same, while transportation processes within LCA are modified with different distances travelled by LNG carriers, i.e., around 6400 nm and around 4200 nm for LNG supply from the USA and UAE, respectively, to the Croatian LNG terminal. The use of LNG in a ship power system contributes the most to the atmosphere pollution, while the emissions related to the process of distributing the fuel to the refueling stations are minor considering total emissions. It is evident that although distribution chains affect the EEI, their impact is negligible. In the formulation of the EEI, the weighting factors are used. As elaborated above, the literature offers different values of such factors, and their selection is specific to the area of application. The sensitivity analysis of the weighting factors on EEI of Ship 2 is performed, where the considered weighting factors are varied by ±50%, with a step increment of 10% (Figure 12).
Along with the weighting factors, emissions and BS highly impact the EEI. The great difference between compared power system configurations can be seen by changing factor β, since the diesel-powered ship results in much greater NOX and SOX emissions than other configurations.
The formulations of GWP, AP, and EP also have an impact on the EEI. In the literature, there are different ways of formulating these potentials, especially when different equivalence factors are used. No matter the method of their formulation, the EEI still represents the ratio of environmental impact and BS, and it is a valid formulation for the evaluation of the energy efficiency and environmental friendliness of different ship power systems. General formulation presented in this work allows further adaptations for specific application cases.

4. Conclusions

The energy efficiency regulation in the maritime sector aims to increase the energy efficiency of ships and reduce fossil fuel consumption and emissions. Implementation of EEXI as an energy efficiency index for existing ships is expected by 2023, while EEDI applies to only newly built ships. However, currently used mathematical models for ship energy efficiency, which set the analysis boundaries at the level of ship power system, do not include alternative fuels as a powering option. Technical measure of energy efficiency needs to be adjusted for ships powered by alternative fuels, since the IMO’s decarbonization strategy advocates the application of alternative ship power, which would lead to an increase in energy efficiency and the reduction of shipping emissions. Based on this, the necessity for mathematical models to evaluate energy efficiency of future ships powered by alternative energy sources is evident.
In this paper, the energy efficiency and emission index applicable for ships with alternative powering options (EEI) is formulated, considering different environmental impact categories, i.e., global warming, acidification, and eutrophication. The results are illustrated on the Croatian ro-ro passenger fleet. Besides diesel, which serves as a baseline scenario, applications of alternative powering options such as electricity, methanol, liquefied natural gas, hydrogen, and ammonia are considered. By extending the analysis boundaries from ship power system to the complete fuel cycle, it is possible to compare different ships within the considered fleet or a whole shipping sector from a viewpoint of energy efficiency and environmental friendliness. By performing the LCA of different fuels, the annual life-cycle emissions of GHG, NOX, and SOX are obtained, while the economic analysis results in the annual economic profit for a particular ship. The EEI comparison of ships with different power systems indicated that electrification represents the best energy-efficient and environmentally friendly alternative solution among those considered.
However, bearing in mind that ro-ro passenger ships operate in different regimes with ship-owners that utilize slow steaming, the analysis of speed reduction for ships with different power systems was performed. The impact of slow steaming was evaluated on ships that operate on the short (Ship 1), medium-range (Ship 2), and long routes (Ship 3). The analysis indicated that speed reduction and full electrification represent an optimal combination of technical and operational measures that results in lower costs, emissions, and EEIs for each of considered ships. Ship 1 achieves the greatest reduction at a speed reduction of 60% of design speed, while for Ship 2 and Ship 3, that reduction is 40% of design speed.
With the implementation of the identified optimal combination of measures, the duration of Ship 1’s route would be extended by 15 minutes, while the GHG emissions, costs, and EEIs compared to the diesel-powered ship operating at average speed are reduced by 55%, 77%, and 92%, respectively. Since the average speed of Ship 2 is close to the speed of 40% of design speed, the optimal combination would result in a prolonged trip by only 6 minutes, while the GHG emissions, costs, and EEIs compared to the existing ships are reduced by 50%, 48%, and 84%, respectively. The optimal identified combination of measures for Ship 3 results in lower GHGs, costs, and EEI by 58%, 54% and 88%, respectively, but also results in the prolongation of the trip by 52 minutes.
The formulated EEI combines both technical and operative characteristics of a ship, as well as characteristics of navigation area, since the specific production of some fuel, fuel distribution chains, electricity mix, and other characteristics that are location-specific have an impact on the environmental friendliness of a ship. With the presented cost assessment scheme, the model can be used not only for the design of future ship power systems but also for long-term planning of energy-efficient and environmentally friendly fleets or local planning of the low-emission shipping sector.

Author Contributions

Conceptualization, M.P. and N.V.; methodology, M.P. and N.V.; software, M.P.; validation, N.V. and A.F.; formal analysis, M.P.; investigation, M.P. and N.V.; resources, M.P.; data curation, M.P.; writing—original draft preparation, M.P. and I.J.; writing—review and editing, N.V. and A.F.; visualization, M.P., A.F., and I.J; supervision, N.V.; project administration, N.V.; funding acquisition, N.V. All authors have read and agreed to the published version of the manuscript.

Funding

This research was funded by the Croatian Science Foundation under the project Green Modular Passenger Vessel for Medi-terranean (GRiMM), (Project No. UIP-2017-05-1253) as well as within the Croatian–Chinese bilateral project “Energy Efficient and Environmentally Friendly Power System Options for Inland Green Ships” between the University of Zagreb, Faculty of Mechanical Engineering and Naval Architecture (Croatia) and Wuhan University of Technology (China). Maja Perčić is supported through the “Young re-searchers’ career development project—training of doctoral students” of the Croatian Science Foundation, funded by the European Union from the European Social Fund (ESF). Ivana Jovanović is supported through the “Young re-searchers’ career development project—training of doctoral students” of the Croatian Science Foundation.

Institutional Review Board Statement

Not applicable.

Informed Consent Statement

Not applicable.

Conflicts of Interest

The authors declare no conflict of interest.

Nomenclature

VariablesAbbreviations
APacidification potential (kg SO2-eq)AAmmonia
BSbenefit for the society (mil. €)CIICarbon Intensity Indicator
Eemission (kg)DDiesel
ECenergy consumption (kWh/nm)EElectricity
EEIenergy efficiency and emission index (kg emission-eq/€)ECAEmission Control Area
EPeutrophication potential (kg PO4-eq)EEDIEnergy Efficiency Design Index
FCfuel consumption (kg/nm)EEXIEnergy Efficiency Existing Ship Index
GWPglobal warming potential (kg CO2-eq)EUEuropean Union
ltrip length (nm)GHGGreenhouse Gas
NPannual number of passengers (-)Gn-HGreen hydrogen
NRTannual number of round trips (-)Gy-HGrey hydrogen
NVannual number of vehicles (-)HHydrogen
Ppower (kW)HFOHeavy Fuel Oil
PRprice (€)HPSHybrid Power System
SFCspecific fuel consumption (kg/kWh) I4EEnergy Efficiency and Environmental Eligibility Index
ttrip duration (h)IMOInternational Maritime Organization
vspeed (kn) IPSIntegrated Power System
LCALife-Cycle Assessment
SubscriptsLNGLiquefied Natural Gas
AEauxiliary engineMMethanol
AnannualMARPOLInternational Convention for the prevention of Pollution from Ships
aveaverageMDOMarine Diesel Oil
ddesignRESRenewable Energy Source
MEmain engineSEEMPShip Energy Efficiency Management Plan
PpassengerUAEUnited Arab Emirates
VvehiclesUSAUnited States of America
UnitsGreek letters
knknot (nm/h)αweighting factor for GWP
nmnautical mile (1 nm = 1.852 km)βweighting factor for AP
γweighting factor for EP

References

  1. United Nations Framework Convention Climate Change (UNFCCC). Climate Change Information Kit. Available online: https://unfccc.int/resource/iuckit/cckit2001en.pdf (accessed on 5 March 2021).
  2. Odeh, N.A.; Cockerill, T.T. Life cycle GHG assessment of fossil fuel power plants with carbon capture and storage. Energy Policy 2008, 36, 367–380. [Google Scholar] [CrossRef]
  3. Ait Allal, A.; Mansouri, K.; Youssfi, M.; Qbadou, M. Toward an evaluation of marine fuels for a clean and efficient autonomous ship propulsion energy. Mater. Today Proc. 2019, 13, 486–495. [Google Scholar] [CrossRef]
  4. International Maritime Organization. Resolution MEPC.176(58); International Maritime Organization: London, UK, 2008. [Google Scholar]
  5. Chen, L.; Yip, T.L.; Mou, J. Provision of Emission Control Area and the impact on shipping route choice and ship emissions. Transp. Res. Part D Transp. Environ. 2018, 58, 280–291. [Google Scholar] [CrossRef]
  6. Emission Standards: IMO Marine Engine Regulations. Available online: https://dieselnet.com/standards/inter/imo.php#s (accessed on 5 October 2021).
  7. International Maritime Organization. Resolution MEPC. 203(62); International Maritime Organization: London, UK, 2011. [Google Scholar]
  8. Ozaki, Y.; Larkin, J.; Tikka, K.; Michel, K. An Evaluation of the Energy Efficiency Design Index (EEDI) Baseline for Tankers, Containerships, and LNG Carriers. In Proceedings of the SNAME & Marine Board Symposium 2010—Climate Change and Ships: Increasing Energy Efficiency, Linthicum Heights, MD, USA, 16–17 February 2010. [Google Scholar]
  9. DNV. Energy Efficiency Existing Ship Index (EEXI). Available online: https://www.dnv.com/maritime/insights/topics/eexi/index.html (accessed on 1 March 2022).
  10. Marine Environment Protection Committee. Resolution MEPC.334(76)—Annex 8—Guidelines on Survey and Certification of the Attained Energy Efficiency Existing Ship Index (EEXI); Marine Environment Protection Committee: London, UK, 2021. [Google Scholar]
  11. DNV. Carbon Intensity Indicator. Available online: https://www.dnv.com/maritime/insights/topics/CII-carbon-intensity-indicator/index.html (accessed on 18 March 2022).
  12. Lindstad, E.; Borgen, H.; Eskeland, G.S.; Paalson, C.; Psaraftis, H.; Turan, O. The Need to Amend IMO’s EEDI to Include a Threshold for Performance in Waves (Realistic Sea Conditions) to Achieve the Desired GHG Reductions. Sustainability 2019, 11, 3668. [Google Scholar] [CrossRef] [Green Version]
  13. Ančić, I.; Vladimir, N.; Cho, D.S. Determining environmental pollution from ships using Index of Energy Efficiency and Environmental Eligibility (I4E). Mar. Policy 2018, 95, 1–7. [Google Scholar] [CrossRef]
  14. Ančić, I.; Vladimir, N.; Runko Luttenberger, L. Energy efficiency of ro-ro passenger ships with integrated power system. Ocean Eng. 2018, 16, 350–357. [Google Scholar] [CrossRef]
  15. Trivyza, N.L.; Rentizelas, A.; Theotokatos, G. A Comparative Analysis of EEDI Versus Lifetime CO2 Emissions. J. Mar. Sci. Eng. 2020, 8, 61. [Google Scholar] [CrossRef] [Green Version]
  16. International Maritime Organization. Fourth IMO GHG Study-Final Report 2020. Available online: https://safety4sea.com/wp-content/uploads/2020/08/MEPC-75-7-15-Fourth-IMO-GHG-Study-2020-Final-report-Secretariat.pdf (accessed on 14 January 2022).
  17. Hüffmeier, J.; Johanson, M. State-of-the-Art Methods to Improve Energy Efficiency of Ships. J. Mar. Sci. Eng. 2021, 9, 447. [Google Scholar] [CrossRef]
  18. Xing, H.; Spence, S.; Chen, H. A comprehensive review on countermeasures for CO2 emissions from ships. Renew. Sustain. Energy Rev. 2020, 134, 110222. [Google Scholar] [CrossRef]
  19. Bouman, E.A.; Lindstad, E.; Rialland, A.I.; Strømman, A.H. State-of-the-art technologies, measures, and potential for reducing GHG emissions from shipping—A review. Transp. Res. Part D Transp. Environ. 2017, 52, 408–421. [Google Scholar] [CrossRef]
  20. Ančić, I.; Perčić, M.; Vladimir, N. Alternative power options to reduce carbon footprint of ro-ro passenger fleet: A case study of Croatia. J. Clean. Prod. 2020, 271, 122638. [Google Scholar] [CrossRef]
  21. Liu, H.; Zhang, Q.; Qi, X.; Han, Y.; Lu, F. Estimation of PV output power in moving and rocking hybrid energy marine ships. Appl. Energy 2017, 204, 362–372. [Google Scholar] [CrossRef]
  22. Perčić, M.; Vladimir, N.; Koričan, M. Electrification of inland waterway ships considering power system lifetime emissions and costs. Energies 2021, 14, 7046. [Google Scholar] [CrossRef]
  23. Hansson, J.; Månsson, S.; Brynolf, S.; Grahn, M. Alternative marine fuels: Prospects based on multi-criteria decision analysis involving Swedish stakeholders. Biomass Bioenergy 2019, 126, 159–173. [Google Scholar] [CrossRef]
  24. Vladimir, N.; Bakica, A.; Perčić, M.; Jovanović, I. Modular approach in the design of small passenger vessels for Mediterranean. J. Mar. Sci. Eng. 2022, 10, 117. [Google Scholar] [CrossRef]
  25. Wan, C.; Yan, X.; Zhang, D.; Yang, Z. A novel policy making aid model for the development of LNG fuelled ships. Transp. Res. Part A Policy Pract. 2019, 119, 29–44. [Google Scholar] [CrossRef]
  26. Ammar, N.R. An environmental and economic analysis of methanol fuel for a cellular container ship. Transp. Res. Part D 2019, 69, 66–76. [Google Scholar] [CrossRef]
  27. Jovanović, I.; Vladimir, N.; Perčić, M.; Koričan, M. The feasibility of autonomous low-emission ro-ro passenger shipping in the Adriatic Sea. Ocean Eng. 2022, 247, 110712. [Google Scholar] [CrossRef]
  28. Wang, H.; Boulougouris, E.; Theotokatos, G.; Zhou, P.; Priftis, A.; Shi, G. Life cycle analysis and cost assessment of a battery powered ferry. Ocean Eng. 2021, 241, 110029. [Google Scholar] [CrossRef]
  29. Gagatsi, E.; Estrup, T.; Halatsis, A. Exploring the potentials of electrical waterborne transport in Europe: The E-ferry concept. Transp. Res. Procedia 2016, 14, 1571–1580. [Google Scholar] [CrossRef] [Green Version]
  30. Perčić, M.; Vladimir, N.; Jovanović, I.; Koričan, M. Application of fuel cells with zero-carbon fuels in short-sea shipping. Appl. Energy 2022, 309, 118463. [Google Scholar] [CrossRef]
  31. Perčić, M.; Ančić, I.; Vladimir, N. Life-cycle cost assessments of different power system configurations to reduce the carbon footprint in the Croatian short-sea shipping sector. Renew. Sustain. Energy Rev. 2020, 131, 110028. [Google Scholar] [CrossRef]
  32. Degiuli, N.; Martić, I.; Farkas, A.; Gospić, I. The impact of slow steaming on reducing CO2 emissions in the Mediterranean Sea. Energy Rep. 2021, 7, 8131–8141. [Google Scholar] [CrossRef]
  33. Ritari, A.; Spoof-Tuomi, K.; Huotari, J.; Niemi, S.; Tammi, K. Emission Abatement Technology Selection, Routing and Speed Optimization of Hybrid Ships. J. Mar. Sci. Eng. 2021, 9, 944. [Google Scholar] [CrossRef]
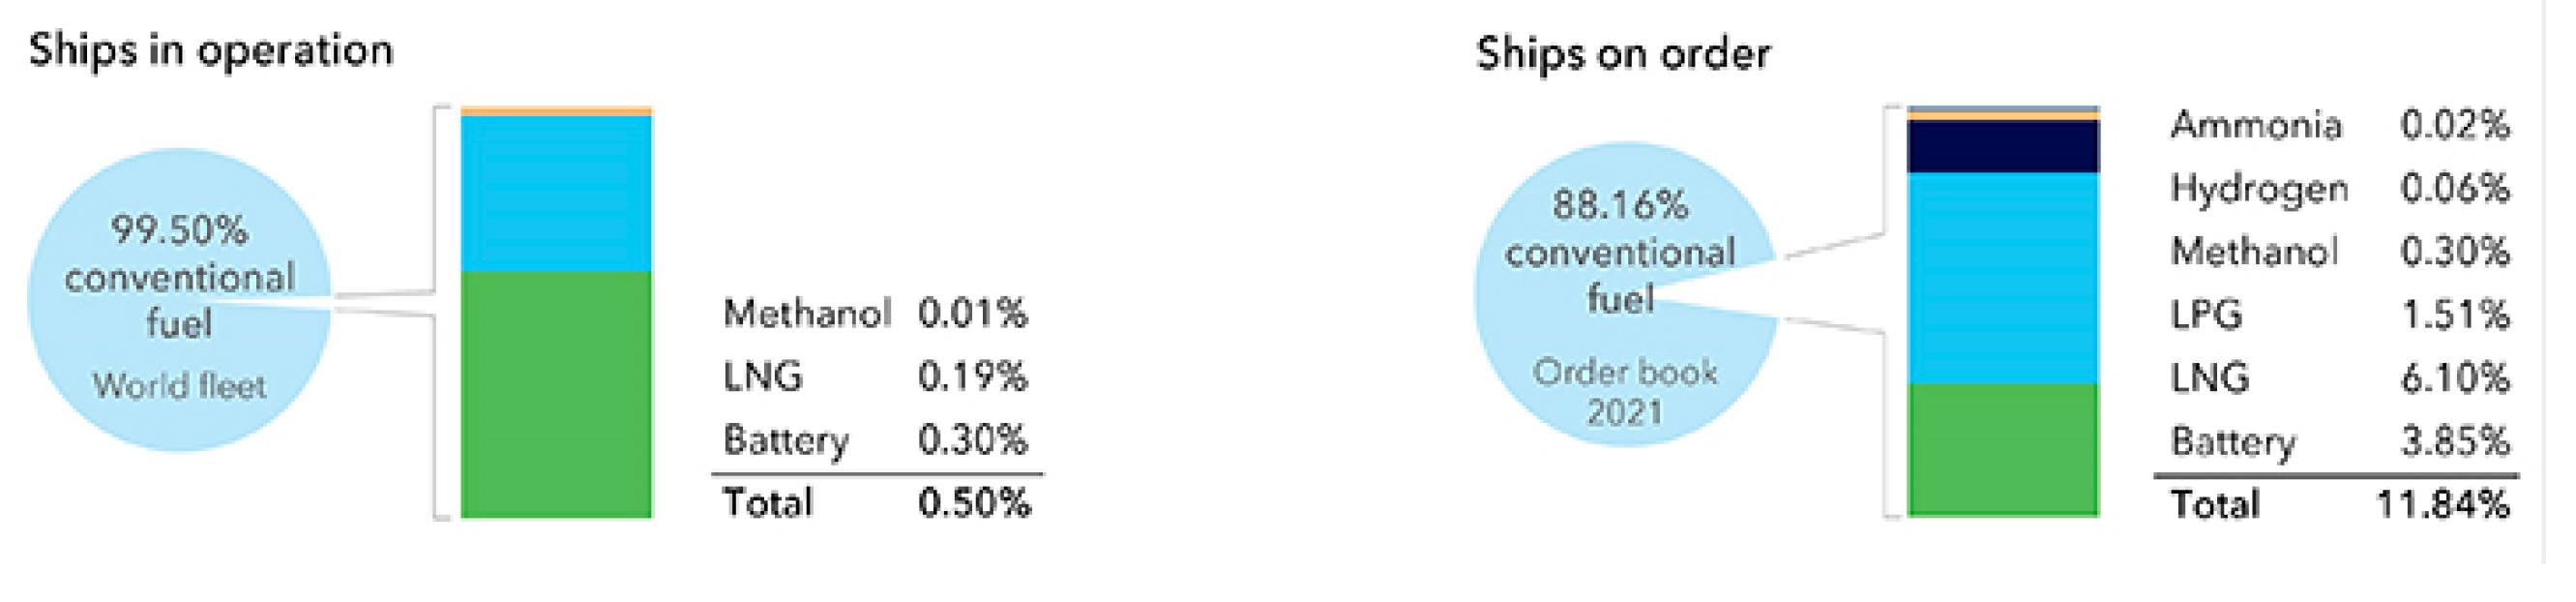
  34. DNV. Uptake of Alternative Fuels for the World Fleet as of June 2021 including Ships in Operation and on Order. Available online: https://www.dnv.com/maritime/hub/decarbonize-shipping/fuels/bridging-fuels.html (accessed on 10 April 2022).
  35. Kim, T.; Chae, C. Environmental Impact Analysis of Acidification and Eutrophication Due to Emissions from the Production of Concrete. Sustainability 2016, 8, 578. [Google Scholar] [CrossRef] [Green Version]
  36. Environmental Protection Agency. Understanding Global Warming Potentials. Available online: https://www.epa.gov/ghgemissions/understanding-global-warming-potentials (accessed on 20 December 2021).
  37. Gonçalves Castro, M.; Mestemaker, B.; Van Den Heuvel, H. Towards zero emission work vessels: The case of a dredging vessel. Proceedings of 2nd International Conference on Modelling and Optimisation of Ship Energy Systems (MOSES2019), Glasgow, Scotland, UK, 8–10 May 2019. [Google Scholar]
  38. Monteiro, A.; Russo, M.; Gama, C.; Borrego, C. How important are maritime emissions for the air quality: At European and national scale. Environ. Pollut. 2018, 242, 565–575. [Google Scholar] [CrossRef]
  39. Sofiev, M.; Winebrake, J.J.; Johansson, L.; Carr, E.W.; Prank, M.; Soares, J.; Vira, J.; Kouznetsov, R.; Jalkanen, J.-P.; Corbett, J.J. Cleaner fuels for ships provide public health benefits with climate tradeoffs. Nat. Commun. 2018, 9, 406. [Google Scholar] [CrossRef] [Green Version]
  40. Croatian Register of Shipping. Web Report of a Ship. Available online: http://report.crs.hr/hrbwebreports/Default.aspx (accessed on 10 December 2021).
  41. Jadrolinija. Ferry Lines Schedule. Available online: https://www.jadrolinija.hr/redovi-plovidbe-i-cijene/lokalne-linije-2022 (accessed on 15 December 2021).
  42. Coastal Liner Services Agency. Traffic of Passengers and Vehicles on Ferry Lines. Available online: http://agencija-zolpp.hr/wp.content/uploads/2022/02/PROMET_PUTNIKA_I_VOZILA_2020-2021.pdf (accessed on 17 February 2022).
  43. Adland, R.; Cariou, P.; Wolff, F.C. Optimal ship speed and the cubic law revisited: Empirical evidence from an oil tanker fleet. Transp. Res. Part E Logist. Transp. Rev. 2020, 140, 101972. [Google Scholar] [CrossRef]
  44. ISO 14040. Available online: https://www.iso.org/standard/37456.html (accessed on 21 April 2021).
  45. GREET 2020. Available online: https://greet.es.anl.gov/ (accessed on 30 June 2021).
  46. Perčić, M.; Vladimir, N.; Fan, A. Life-cycle cost assessment of alternative marine fuels to reduce the carbon footprint in short-sea shipping: A case study of Croatia. Appl. Energy 2020, 279, 115848. [Google Scholar] [CrossRef]
  47. Perčić, M.; Vladimir, N.; Fan, A. Techno-economic assessment of alternative marine fuels for inland shipping in Croatia. Renew. Sustain. Energy Rev. 2021, 148, 111363. [Google Scholar] [CrossRef]
Figure 1. Alternative fuels uptake in 2021 (reproduced from [34] with permission of DNV, 2022).
Jmse 10 00613 g001
Figure 2. The methodology flowchart.
Jmse 10 00613 g002
Figure 3. Croatian ferry lines.
Jmse 10 00613 g003
Figure 4. Life-cycle stages of a product.
Jmse 10 00613 g004
Figure 5. Calculated EEI for ships with different power systems.
Jmse 10 00613 g005
Figure 6. Impact of speed reduction on annualCO2-eq emissions of ships with different power systems.
Jmse 10 00613 g006
Figure 7. Impact of speed reduction on annual economic profit of ships with different power systems.
Jmse 10 00613 g007
Figure 8. EEIs comparison of diesel-powered ships and electricity-powered ships operating at different speeds.
Jmse 10 00613 g008
Figure 9. Impact of different electricity mixes on EEI.
Jmse 10 00613 g009
Figure 10. Impact of different hydrogen production processes on EEI.
Jmse 10 00613 g010
Figure 11. Impact of LNG distribution chains on EEI.
Jmse 10 00613 g011
Figure 12. Impact of weighting factors on EEI.
Jmse 10 00613 g012
Table 1. T Particulars of selected ships [40,41,42].
Ship RoutePME (kW)PAE (kW)vd
(kn)
t (h)l
(nm)
NRTNPNVPRP (€)PRV (€)
Biograd-Tkon8068247.50.331.353,900417,713123,1041.613.33
Prizna-Žigljen7928480.251.611,590777,360320,4091.8717.87
Orebić-Dominče1790444120.331.835,520602,838253,1841.7313.87
Brestova-Porozina1616444110.332.813,540467,932198,565223.73
Sućuraj-Drvenik8068247.50.583.402760337,608126,8881.7320.67
Zadar-Preko1968532130.423.4557001,159,218417,384217.73
Valbiska-Merag1968272120.423.623960974,081431,391223.73
Sobra-Prapratno2352480120.335.721560137,49955,1893.0729.73
Sumartin-Makarska882102100.836.961260118,58932,1183.230.67
Suđurađ-Dubrovnik1986192112.50.428.1048017,7444.6362.5330.67
Ploče-Trpanj176484012.318.141740390,170164.0223.625.07
Split-Supetar1968630130.838.8537201,667,571423.2323.7330.67
Split-Rogač17886451218.901620347,53693.1223.7330.67
Drvenik Veli- Trogir79410211.51.179.66600109,16156741.7330.67
Šibenik-Žirje88272111.3311.6054043,09072702.5335.33
Valbiska-Lopar1764108012.31.3315.29960125,71547,2214.1324
Zadar-Brbinj176484012.31.6715.76870189,90578,2053.3335.33
Zadar- M. Rava164827014219.1615239,06114,5323.0717.73
Split-Stari Grad196863013.2222.881740612,601180,6215.261.33
Zadar-Ist1140200112.6727.4224019,66775662.6735.33
Split-Vis3600194415.752.3330.18800244,58964,879662.67
Zadar-M.Lošinj2646348165.2563.6824028,82893733.4730.67
Publisher’s Note: MDPI stays neutral with regard to jurisdictional claims in published maps and institutional affiliations.

