Abstract
The electro-osmosis-combined-preloading method is considered very promising in soft soil improvement, while the uncertainty in the function mechanism has hindered its practical application. To explore the mechanism of the combined method, experiments concerning the single electro-osmosis method and the combined method were carried out using reclaimed sludge. Macroscopic and microscopic properties of the soil were explored and compared. Drainage, soil settlement, soil water content and soil pore structure were detected during the experiments. The total drainage and average settlement of the combined method were, respectively, 20.8% and 34.5% greater than that of the single electro-osmosis method. The average void ratio of soils treated by the combined method was 13.8% lower than that by the electro-osmosis method. Moreover, reduction rates of the soil water content are found higher than that of the apparent void ratio for each method. It can be concluded that the combined method had better performances, both from the macroscopic and microscopic views. Furthermore, a theoretical analysis demonstrated that soil was desaturated and the soil shrinkage volume was lower than the drained water volume during electro-osmosis. This is derived from the essence of electro-osmosis, which determines that considerable pores formerly occupied by drained water cannot be effectively compressed. The combined method can fully use the advantages of the single methods by active drainage through electro-osmosis and further compression of the soil skeleton through preloading. Therefore, the electro-osmosis-combined-preloading method was strongly recommended for reclaimed sludge strengthening.
1. Introduction
The electro-osmosis phenomenon was first discovered by Reuss in 1807. It is characterized as the water flow from the anode to the cathode when a direct current is applied to the soil, while the fundamental cause comes from the negatively charged surfaces of the clay particles [1,2]. The most significant advantage of the electro-osmosis technique is claimed to be the independence of the strengthening effect on the soil particle size. Besides, the soil strength increase induced by electro-osmosis has also been proven to be permanent [3,4,5]. Therefore, the electro-osmosis technique has received widespread attention and was believed to be especially applicable for strengthening marine reclaimed sludge [6,7,8]. Meanwhile, the rapid development of reclaiming engineering has produced large volumes of reclaimed sludge needing suitable treatment. Therefore, it is of great significance to study the strengthening effect of the electro-osmosis technique on reclaimed sludge.
However, due to the effects of electrode reaction and corrosion during electro-osmosis, constant electro-osmotic treatment of soil will lead to dewatering efficiency decrease [9,10,11], which derive from many effects as soil water content reduction, departure of the electrodes and the soil and ion imbalance distribution [12], etc. The most effective way to maintain the dewatering efficiency is incorporating electro-osmosis with other existing methods such as vacuum preloading or surcharge loading [13,14,15,16,17]. Particularly, the electro-osmosis-combined-preloading technique is reported to be rather effective in strengthening clay [14,18]. However, fundamental mechanisms responsible for the combined effects, especially the micro pore characteristics of the soil, are still unclear and need further investigation. Studies in this respect are essential to promote the application of the combined method.
The soil microscopic property was studied mainly by the scanning electron microscope (SEM) in the preceding literature [19,20,21,22]. Pore structure can be observed through SEM technology and thus the link between the pore structure and the macroscopic property can be analyzed. However, most of the preceding literature focused on common soils, such as certain specific soil [19,20] or soils strengthened by a curing agent [21,22,23]. Limited documents were reported about the microscopic pore structure properties for soils treated by electro-osmosis. The microfabric of the sodium bentonite was found to change from flocculated fabric to aggregated fabric after electro-osmotic stabilization [24]. A structure less-ordered than that of a honeycomb was obtained during the electrophoresis separation process [13]. The microscopic characters of soft soil by vacuum preloading and an electro-kinetics experiment were also investigated [25]. Nevertheless, uncertainties still exist as to the correlation of the soil microscopic property changes and the macroscopic properties for soils treated by the electro- osmosis-combined-preloading method.
It can be seen that the correlation mechanism of macroscopic and microscopic properties of the soil treated by the electro-osmosis-combined-preloading method (hereinafter referred to the combined method) still requires clarification. Therefore, two series of tests, respectively, using the single electro-osmosis method and the combined method, were performed. The macroscopic properties, including drainage, deformation and soil water content, and the microscopic properties, mainly average pore area and apparent void ratio, were monitored. The soil’s macroscopic and microscopic property changes were thoroughly compared. Correlation mechanism of the soil macroscopic deformation and the microscopic pore structure development was analyzed. Reasonable explanations for compared results of the concerned methods were also presented. The results in this study can provide deep insight into the fundamental mechanism of the electro-osmosis-combined-preloading method.
2. Materials and Methods
2.1. Materials
The original soil was obtained from a foundation pit in Xihu District, Hangzhou city, China. The basic geotechnical properties of the soil are presented in Table 1. The original soil can be termed as soft plastic clay as a result of the plasticity index of 29.9 and liquidity index of 0.89. To simulate the reclaimed sludge, the original soil was mixed with water to achieve remolded samples of a certain water content, which was set to approximately 70% in this study on the basis of existing data [2,9].

Table 1.
Physical parameters of the original soil.
The schematic diagrams of the self-made model box are shown in Figure 1a. The model box is made of Plexiglas plates with a thickness of 10 mm. The box has inner dimensions of 500 mm length, 500 mm width and 300 mm height, and mainly serves as a container for the soil samples. Three holes are reserved on the bottom of the model box with a diameter of 20 mm. These holes are used to fix the cathodic electrodes. During the test, the water assembled in the cathodic areas flows through the cathodic electrodes and is collected in the container underneath the reserved holes of the model box.
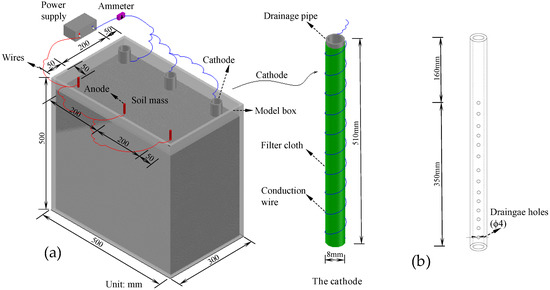
Figure 1.
Schematic diagram of the device: (a) The model box and cathode; (b) The drainage pipe.
To minimize corrosion and increase efficiency, steel rods of diameter 8 mm were used as anode electrodes. The cathodic electrodes consist of the drainage pipes (Figure 1b), filter cloths and conduction wires. The design graph of the drainage pipes is shown in Figure 1. Three hollow Plexiglas round pipes were used with an outer diameter of 20 mm and an inner diameter of 16 mm. Several drainage holes, 4 mm in diameter, were pouched on the pipes. The pipes can be screwed onto the holes in the bottom of the model box. The filter cloth was wrapped around the Plexiglas pipes to filter the drainage. The conduction wires were winded around the filter cloth to conduct electricity.
2.2. Methods
To clearly present the research methodology, a flowchart is shown in Figure 2. To be specific, two main tests, denoted by T1 and T2, were performed in this study to investigate the combined effect of preloading and electro-osmosis. T1 was conducted with a single electro-osmosis method and T2 using the combined method. Additionally, two control tests, numbered by C1 and C2, were also conducted. The initial soil water content of T1, T2, C1 and C2 were, respectively, 70.1%, 70.3%, 69.6% and 70.5%. A spd-3606 DC power supply was used to rectify alternating current to the direct current. An ammeter was connected in a series to monitor the total current. During the experiment, a total voltage of 25 V was used for both T1 and T2, which made a voltage gradient of 1.25 V/cm referencing voltage gradients of 0.32~2 V/cm in previous studies [12,16,26]. Moreover, a layer of fine sand with 100 mm in thickness was used and served as a surcharge load of 1.76 kPa referencing Hu et al. [26], which used similar devices and soils in the experiments.
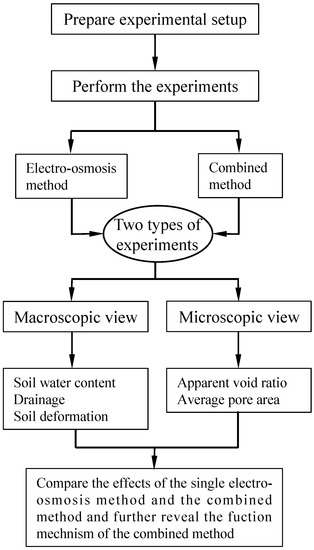
Figure 2.
Flowchart of the research methodology.
The tests were performed with the following steps (Tests T1, T2, C1 and C2 corresponded to steps 1–6 and 9–10, steps 1–10, steps 1–6 and steps 1–8, respectively): (1) Make the remolded soils by mixing the original soils with water thoroughly using a mixer and leaving the mixed soil sample static for 24 h; (2) Test the water content of the initial soil samples; (3) Spread a layer of Vaseline on the inner sides of the model box to lessen the friction of the soil and the model box; (4) Install three anodes and three cathodes to the corresponding positions as shown in Figure 1; (5) Fill the soil samples into the model box by layers, with each layer less than 10 mm to eliminate bubbles; (6) Put containers underneath the cathodes to collect the discharged water and measure the volumes; (7) Gently put a layer of geotextile on the surface of the soil sample to eliminate soil cracks; (8) Place a layer of fine sand with 100 mm in thickness on the geotextile; (9) Connect the circuit with conduction wires as shown in Figure 1 and switch on the power supply; (10) Power on for 72 h and then switch off the power supply.
During tests T1, T2, C1 and C2, the drainage was measured every 4 h. Soil settlement, water content and microscopic structure were measured after the main tests T1 and T2. Figure 3 shows the sectional view and the plan view of layout of the measuring points. Since the model box is symmetrical, the measuring points for each factor are set in half of the box and distributed in three longitudinal sections, respectively, 50 mm, 150 mm and 250 mm distanced from the longitudinal side of the box. Given that the monitored results of the measuring points on each cross section have a difference rate within 10%, the average data of measuring points were adopted for each cross section to quantitatively investigate the distribution of each factor (soil settlement, soil water content and soil pore structure) after the test.
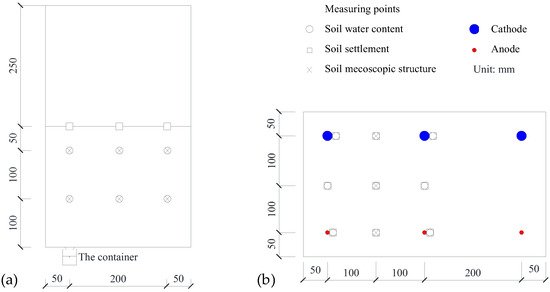
Figure 3.
Layout of the measuring points for soil water content, settlement and mesoscopic structure: (a) The sectional view; (b) The plan view.
Soil water content was monitored according to the standard for geotechnical testing methods [27]. Soil settlement was obtained by comparing the reading changes of the ruler put on the soil. To monitor soil microscopic structure, soil samples taken from the measuring points in Figure 3 were sent to a Soil Testing Centre to be scanned. Detailed SEM measurement methodology can be presented as: (1) Soil sampling. Soil samples were carefully cut with ultra-thin blade, and the soil samples were gradually cut to make the samples of 5 mm × 5 mm × 10 mm (height × width × length); (2) Soil freezing. The soil samples were put into an aluminum box and frozen at −190 °C with liquid nitrogen; (3) Soil drying. Before the volatilization of liquid nitrogen, the soil sample was moved into the vacuum dryer, and vacuum drying was carried out at −44 °C for 24 h to directly sublimate the non-crystalline ice in the soil; (4) Sample cutting. After freeze-drying, carefully break the soil sample, try to keep the cross section smooth to make an electron microscope scanning observation surface; (5) Sample coating. The sample observation surface was sprayed with gold coating to enhance its conductivity and facilitate scanning; (6) Soil scanning. The coated sample was placed on the SEM observation platform, and an appropriate area was selected under a low magnification of 500. Then, the magnification was increased to 2000 and representative SEM images were taken for pore structure analysis.
3. Results
3.1. The Macroscopic Aspect
3.1.1. The Drainage
The cumulative discharge for T1, T2, C1 and C2 were shown in Figure 4. It can be seen from Figure 4 that the drainage volumes increase with the conduction time and T1 displays significantly higher discharges at each time node than the control test C1, as is the situation with T2. Specifically, the two lines for T1 and T2 are close for the first 0–8 h. After eight hours, the difference between the two lines increases and finally the total drainage volume of T2 is 20.8% higher than that of T1. This demonstrates the better dewatering effects of the combined method over the single electro-osmosis method. To further compare the dewatering effect of each method, drainage rates of each time node are calculated by dividing the drainage difference of the prior and next time node with duration. Figure 5 shows that the drainage rates of both T1 and T2 decreases with time and is much higher than that of C1 and C2. Moreover, the drainage rate of T2 is higher than that of T1 during 0–40 h, and after 40 h, the drainage rate of T1 and T2 are very close. The decrease in the drainage rate derives from multiple factors, which include the changes of the soil properties, and the loss of the potential on the interface of the electrodes and soil, the development of soil cracks, etc. The higher drainage rate of T2 demonstrates a better dewatering efficiency of the combined method over the single electro-osmotic technique. However, it is interesting that final drainage rates of T1 and T2 are quite close, with the difference being within 5%, despite the hugely varied soil states. Solid studies are needed to clarify the primary causes.
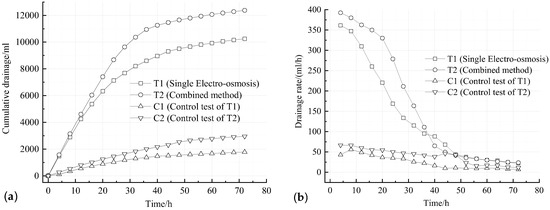
Figure 4.
The development of the drainage with time: (a) The cumulative discharge; (b) The drainage rates.
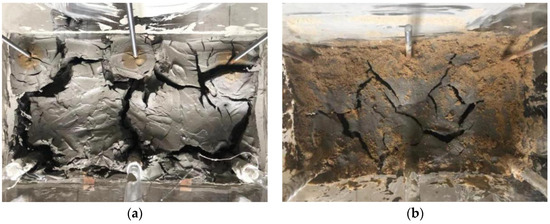
Figure 5.
Soil cracks that developed during the tests: (a) The soil state after T1 test; (b) The soil state after T2 test.
3.1.2. The Soil Deformations
The soil deformation came from two aspects, transverse cracking and vertical settlement. Figure 5 displays the soil photos taken after test T1 and T2. It can be seen from Figure 5 that obvious soil cracks were developed during T1 and T2 and the soil cracks of T1 were much more than that of T2. Specifically for the T1 test, penetrating cracks between the anodes and cathodes were observed and several tiny cracks were distributed around the anodes. For the T2 test, the soil cracks were distributed irregularly between the anodes and cathodes. Similar results of soil cracks were also obtained by Li et al. [28].
After the tests, the soil settlements were measured using rulers and the soil settlement distributions of T1 and T2 are shown in Figure 6. Figure 6 demonstrates significant in-homogeneity of the soil settlements for both T1 and T2. The final soil settlements increased from the cathodes towards the anodes. The settlements of T2 are higher than that of T1 for each section. Specifically, the average settlement of T2 is 34.5% higher than that of T1. Therefore, the combined method induced higher soil settlement than the single electro-osmosis technique.
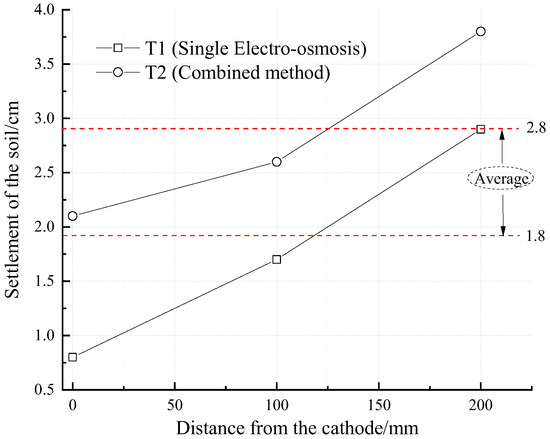
Figure 6.
Final soil settlements of T1 and T2.
Normally, better drainage effect corresponds to more water being drained out of the soil, which will induce more soil shrinkage and soil cracking. The above results show that the T2 test caused better dewatering effects and higher soil settlements than the T1 test. Nevertheless, adverse results were obtained regarding the transverse cracking. This can be reasonably interpreted by the fact that the surcharge loading can effectively confine the lateral soil cracking and induce more soil settlement [12].
3.1.3. The Soil Water Content
For each cross section of the soil, the average soil water content of the measuring points is used for analysis. Distributions of the soil water content of T1 and T2 are shown in Figure 7. It can be seen from Figure 7 that the soil water content decreased from the cathode to the anode and the water content of T2 is lower than that of T1 at each section. To be specific, the average water content of T2 is 15.6% lower than that of T1. Figure 7 also shows that the first data of T1 is higher than the initial soil water content of 70%. This can be caused when the water accumulated in the cathodic area was not drained out in a timely manner.
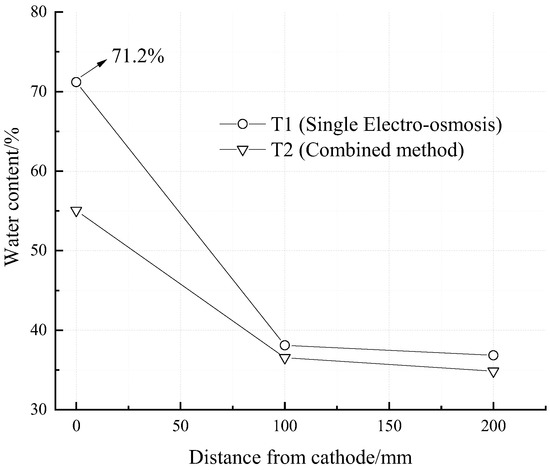
Figure 7.
Soil water content distributions of T1 and T2.
3.2. The Microscopic Aspect
SEM pictures were obtained by the SEM measurements methodology and typical images of the remolded soil and anodic soils of T1 and T2 are shown in Figure 8. A pore structure analysis software, PCAS, was used to analyze the SEM pictures. This software, PCAS, has been thoroughly introduced and verified in preceding literature [29,30,31] and will not be further commented on in this study. Quantitative results as the apparent void ratio and average pore area of the soils were obtained and presented as follows.
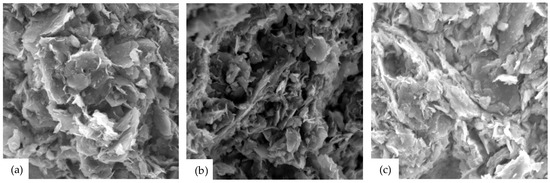
Figure 8.
Typical SEM images: (a) Remolded soil; (b) Anodic soil of T1; (c) Anodic soil of T2.
3.2.1. The Average Pore Area
The average pore area can be used to analyze soil homogeneity. Figure 9 shows the soil average pore area distributions for T1 and T2. It can be observed from Figure 9 that the average pore areas of the treated soil are smaller than that of the remolded soil. Additionally, the average pore area of T2 is smaller than that of T1 at each section. This proves that the combined method resulted in a smaller average pore area compared with the single electro-osmosis method. In other words, the combined method or the surcharge can further compress the soil pores.
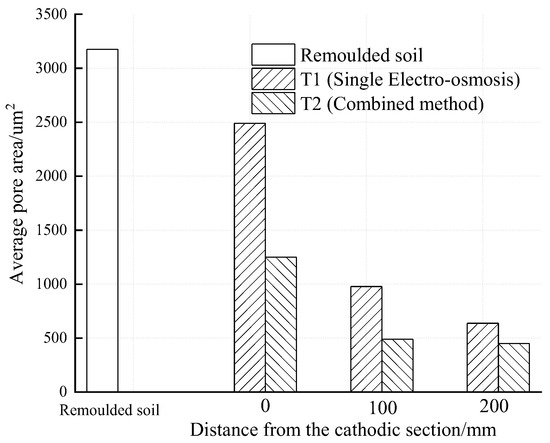
Figure 9.
The soil average pore area of T1 and T2.
3.2.2. The Apparent Void Ratio
The apparent void ratio is normally used to quantitatively explore the soil pore structure characteristics. Apparent void ratios of the treated soils in T1 and T2 as well as the remolded soil samples are shown in Figure 10. It can be seen from Figure 10 that the apparent void ratio decreases from the cathode to the anode for each test. This is in accordance with the reduction in soil water content shown in Figure 7. Moreover, apparent void ratios of treated soil of T2 are smaller than that of T1, which is also smaller than that of the remolded soil. To be specific, the average soil void ratio of T2 is 13.8% lower than that of T1. Further analysis of the apparent void ratio is given in the discussion section that follows.
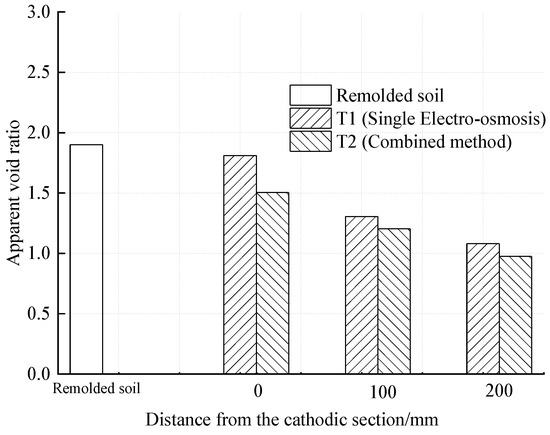
Figure 10.
The soil’s apparent void ratio of T1 and T2.
4. Discussion
To compare the macroscopic and microscopic results, change rates of the test parameters (drainage, soil water content and apparent void ratio) are computed and discussed herein. From the above analysis, total drainage of T2 is 20.8% higher than that of T1, while the soil settlement of T2 is 34.5% higher than that of T1. Moreover, the reduction rates in soil water content and apparent void ratio are, respectively, displayed in Figure 11. Comparing T1 and T2, the reduction rates in soil water content or apparent void ratio for T1 are lower than that of T2, which demonstrates better strengthening effects of the combined method over the single electro-osmosis method. For each test as T1 or T2, reduction rates in soil water content are higher than that of the apparent void ratio.
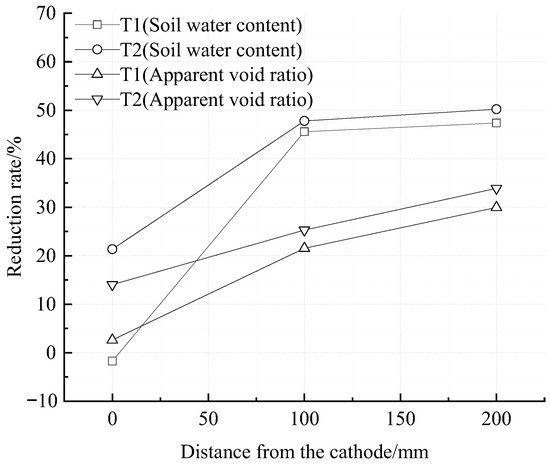
Figure 11.
Reduction rates in soil water content and the apparent void ratio.
To summarize, each method induced higher reduction rates in soil water content than that of the apparent void ratio. To provide a theoretical analysis, the relationship between soil water content and void ratio can be given as
where is void ratio, is soil water content, is soil saturation, is soil particle specific gravity. For a certain type of soil, is steady and the remolded soil is normally saturated, namely the initial saturation equals one. It can be deduced from Equation (1) that higher change rates of the water content over the void ratio means that the time-dependent changes. In other words, soil is desaturated during the test. Similar results were also reported by Bergado et al. [32]. They monitored soil settlement, water content and found that the soil void ratio calculated by water content was smaller than that calculated by settlement. From the macroscopic perspective, soil water content reduction derives from drainage and the decrease in soil void ratio corresponds to soil shrinkage. Further analysis shows that soil shrinkage volume is smaller than drainage volume during electro-osmosis. From the microscopic perspective, it can be obtained that only parts of the free pores formerly occupied by the outflow drainage are effectively compressed during electro-osmosis.
The above obtained smaller soil shrinkage volume and partly compressed pores of the soil are closely related with the mechanism of electro-osmosis, which is widely accepted as the migration of water dragged by ions. Figure 12 presents the effects of single electro-osmosis or preloading on the pore structure under ideal conditions, which ignores the interactions of electro-osmosis and gravity. For preloading, the drainage is driven by excess pore water pressure. The soil skeleton will be compressed when the excess pore water pressure dissipates and the effective stress increases (Figure 12). For electro-osmosis under ideal conditions, drainage is solely driven by ionic hydration. If the effect of soil particle gravity is ignored, the excess pore water pressure will not be generated (Figure 12). The soil skeleton will not be compressed and no deformation of the soil will be generated. However, in the real situation, the effect of gravity on soil particles cannot be ignored. The soil particle gravity will induce pore compression, but is not large enough to compress all the pores formerly occupied by the outflow water. In this case, the soil skeleton is partly compressed and the soil becomes unsaturated. Therefore, soil deformation volume is smaller than drainage amount and soil pores freed by the outflow drainage is partly compressed during electro-osmosis.
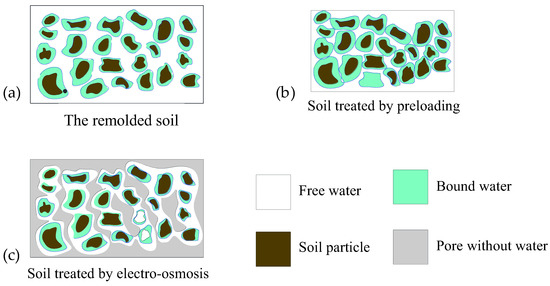
Figure 12.
Effects of single electro-osmosis and preloading on the soil pore structure under ideal conditions: (a) The remolded soil; (b) Soil treated by preloading; (c) Soil treated by electro-osmosis.
As mentioned in “The soil deformations” section, surcharge loading can effectively confine the soil cracking and induce more soil settlement. From the microscopic perspective, the pores freed by the water drained through electro-osmosis will be further compressed by preloading. In this respect, electro-osmosis induces active drainage and preloading provides enhancement of the pore compression for the combined method. Therefore, the combined actions of electro-osmosis and preloading can make the best use of the advantages of the individual methods and further improves the strengthening effect. Therefore, electro-osmosis is usually recommended to be combined with preloading in real practice. However, the physio-chemical properties of soil treated by the combined method are still unclear and corresponding optimum design approaches are absent. Solid investigation is still needed on the combined method to promote its application.
5. Conclusions
Laboratory experiments were performed on reclaimed sludge to investigate the function mechanism of the electro-osmosis-combined-preloading method. The combined method and the single electro-osmosis method were compared from a macroscopic and microscopic perspective. From the macroscopic perspective, cumulative discharge, drainage rate, deformation and water content were detected. It is detained that the combined method resulted in better strengthening effects compared to the single electro-osmosis method. Total drainage and average settlement of the combined method is, respectively, 20.8% and 34.5% greater than that of the single electro-osmosis method. From the microscopic perspective, apparent void ratio and average pore area were measured. Higher micro-structural changes of the soil treated by the combined method were obtained. To be specific, average soil void ratio of the combined method is 13.8% lower than that of the single electro-osmosis method. Therefore, the combined method is claimed to be more efficient and effective for reclaimed sludge improvement.
To interpret the better performance of the combined method, change rates of involved parameters were analyzed. Increase rate of total drainage from the single method to the combined method is 20.8%, while the corresponding rate of settlement is 34.5%. Meanwhile, the reduction rate in soil water content is found higher than that of the apparent void ratio for each method. Further analysis showed that soil desaturated and soil shrinkage volume is smaller than drainage volume during electro-osmosis. This is essentially due to the fact that electro-osmosis originates from the migration of water molecules pulled by moving ions under an electric field. Only parts of the pores freed by outflow water are effectively compressed during electro-osmosis. Therefore, electro-osmosis alone can hardly directly cause the compression of the soil skeleton. However, soil compression is the ultimate objective of soil improvement. For the combined method, electro-osmosis provides active drainage of water and preloading enhances further compression of the soil skeleton. The combined method can make the best use of the advantages of individual methods. Therefore, electro-osmosis is highly recommended to be combined with preloading in real practice. Further research needs to be conducted regarding the optimum design of the electro-osmosis-combined-preloading method considering the physio-chemical properties of soil.
Author Contributions
Data curation, validation, Writing-original draft, Conceptualization, Revising, Y.T.; supervision, J.Z. (Jianfeng Zhu); project administration, J.Z. (Jian Zhou); methodology, Z.Y.; resources, J.L. All authors have read and agreed to the published version of the manuscript.
Funding
This research was funded by the National Natural Science Foundation of China, grant numbers 51879133 and 52078455, and the Commonweal Project of Zhejiang Province, grant number LGG22E090002.
Institutional Review Board Statement
Not applicable.
Informed Consent Statement
Not applicable.
Data Availability Statement
Not applicable.
Conflicts of Interest
The authors declare no conflict of interest.
References
- Bjerrum, L.; Moum, J.; Eide, O. Application of electro-osmosis to a foundation problem in a Norwegian Quick Clay. Geotechnique 1967, 17, 214–235. [Google Scholar] [CrossRef]
- Micic, S.; Shang, J.; Lo, K.; Lee, Y.; Lee, S. Electrokinetic strengthening of a marine sediment using intermittent current. Can. Geotech. J. 2001, 38, 287–302. [Google Scholar] [CrossRef]
- Thomas, T.J.; Lentz, R.W. Changes in Soil Plasticity and Swell Caused by Electro-Osmosis. In Symposium on Physico-Chemical Aspects on Soil, Rock, and Related Materials; ASTM: West Conshohocken, PA, USA, 1990; Volume 1, pp. 108–117. [Google Scholar]
- Milligan, V. First Application of Electro-Osmosis to Improve Friction Pile Capacity-Three Decades Later. Proc. Int. Conf. Soil Mech. Found. Eng. 1995, 113, 112–116. [Google Scholar]
- Holtz, R.D.; Shang, J.Q.; Bergado, D. Soil Improvement; Springer: New York, NY, USA, 2001; pp. 429–462. [Google Scholar]
- Cassagrande, L. Electro-Osmosis in Soils. Geotechnique 1949, 1, 159–177. [Google Scholar] [CrossRef]
- Casagrande, L. Stabilization of soils by means of electro-osmosis-state of the art. J. Boston Soc. Civ. Eng. 1983, 69, 255–302. [Google Scholar]
- Lo, K.Y.; Ho, K.S. The effects of electroosmotic field treatment on the soil properties of a soft sensitive clay. Can. Geotech. J. 1991, 28, 763–770. [Google Scholar] [CrossRef]
- Glendinning, S.; Lamont-Black, J.; Jones, C. Treatment of sewage sludge using electrokinetic geosynthetics. J. Hazard. Mater. 2007, 139, 491–499. [Google Scholar] [CrossRef]
- Starov, V.M. Nanoscience: Colloidal and Interfacial Aspects; CRC Press: Boca Raton, FL, USA, 2010; Volume 147, pp. 146–148. [Google Scholar]
- Tao, Y.L.; Zhou, J.; Luo, Z.Y.; Manda, T.J.; Gong, X.; Zou, B. Experimental study on the electro-dewatering transport of Hangzhou sludge. Dry. Technol. 2022, 40, 864–872. [Google Scholar] [CrossRef]
- Zhou, J.; Tao, Y.L.; Xu, C.J.; Gong, X.N.; Hu, P.C. Electro-Osmotic Strengthening of Silts Based on Selected Electrode Materials. Soils Found. 2015, 55, 1171–1181. [Google Scholar] [CrossRef] [Green Version]
- Peng, C.; Lai, H.; Orazem, M.E.; Moghaddam, S. Microstructure of clay fabric in electrokinetic dewatering of phosphatic clay dispersions. Appl. Clay Sci. 2018, 158, 94–101. [Google Scholar] [CrossRef]
- Fan, X.Y.; Wang, W.Y. Laboratory study on sludge treatment by electroosmosis Combined with Pile-Loading. Mod. Civ. Struct. Eng. 2018, 2, 18–24. [Google Scholar] [CrossRef]
- Yu, Z.W.; Zhang, Y.J.; Zhou, B.Q.; Guo, L.; Li, Z.; Li, X. Laboratory investigation of electro-osmosis effects in saturated dredger fill—A comparison with the stack preloading. Dry. Technol. 2016, 35, 736–746. [Google Scholar] [CrossRef]
- Sun, Z.H.; Gao, M.; Yu, X.J. Dewatering effect of vacuum preloading incorporated with Electro-osmosis in different ways. Dry. Technol. 2017, 35, 38–45. [Google Scholar] [CrossRef]
- Wang, J.; Ma, J.; Liu, F.; Mi, W.; Cai, Y.; Fu, H.; Wang, P. Experimental study on the improvement of marine clay slurry by electroosmosis-vacuum preloading. Geotext. Geomembr. 2016, 44, 615–622. [Google Scholar] [CrossRef]
- Tajudin, S.; Nordin, N.S.; Marto, A. The monitoring and cementation behavior of electrokinetic stabilisation technique on batu pahat marine clay. Int. J. Geomate 2016, 11, 2581–2588. [Google Scholar]
- Delage, P.A. Microstructure approach to the sensitivity and compressibility of some Eastern Canada sensitive clays. Géotechnique 2010, 60, 353–368. [Google Scholar] [CrossRef]
- Chai, J.; Jia, R.; Nie, J.X.; Aiga, K.; Negami, T.; Hino, T. 1D defomation induced permeability and microstructural anisotropy of Ariake clays. Geomech. Eng. 2015, 8, 81–95. [Google Scholar] [CrossRef]
- Lee, J.K.; Shang, J.Q. Evolution of thermal and mechanical properties of mine tailings and fly ash mixtures during curing period. Can. Geotech. J. 2014, 51, 570–582. [Google Scholar] [CrossRef]
- Zhu, J.F.; Xu, R.Q.; Zhao, H.Y.; Luo, Z.Y.; Pan, B.J.; Rao, C.Y. Fundamental mechanical behavior of CMMOSC-S-C composite stabilized marine soft clay. Appl. Clay Sci. 2020, 192, 105635. [Google Scholar] [CrossRef]
- Wu, H.; Hu, L. Microfabric change of electro-osmotic stabilized bentonite. Appl. Clay Sci. 2014, 101, 503–509. [Google Scholar] [CrossRef] [Green Version]
- Zhu, J.F.; Xu, R.Q.; Luo, Z.Y.; Pan, B.J.; Rao, C.Y. A nonlinear constitutive model for soft clay stabilized by magnesia cement considering the effect of solidified agent content. Rock Soil Mech. 2020, 41, 2224–2232. [Google Scholar]
- Zhang, B.L.; Li, H.Y.; Zhagn, C.B. Study on microscopic characters of soft soil in the pearl river delta vacuum preloading and electro-kinetics experiment. Geotech. Eng. Tech. 2015, 29, 90–94. [Google Scholar]
- Hu, P.C.; Zhou, J.; Wen, X.G.; CHEN, Y.X.; LI, Y.W. Laboratory model experiment of electro-osmosis combined with loading and pneumatic fracturing. J. Zhejiang Univ. (Eng. Sci.) 2015, 49, 1434–1440. [Google Scholar]
- GB/T 50123-2019; Standard for Geotechnical Testing Method. China Planning Press: Beijing, China, 2019.
- Li, Y.W.; Zhou, J.; Gong, X.N.; Chen, Z.; Tao, Y.L. Experimental research on influence of electrode array on electroosmotic effect. Rock Soil Mech. 2013, 34, 1972–1978. [Google Scholar]
- Liu, C.; Shi, B.; Zhou, J. Quantification and characterization of microporosity by image processing, geometric measurement and statistical methods: Application on SEM images of clay materials. Appl. Clay Sci. 2011, 54, 97–106. [Google Scholar] [CrossRef]
- Wang, Z.J.; Liu, S.H.; Wang, Y.S. Analysis on microstructure of granular materials under different stress paths. J. Hydraul. Eng. 2013, 44, 771–778. [Google Scholar]
- Cao, Y.; Zhou, J.; Yan, J.J. Study of microstructures of soft clay under dynamic loading considering effect of cyclic stress ratio and frequency. Rock Soil Mech. 2014, 35, 735–743. [Google Scholar]
- Bergado, D.T.; Sasanakul, I.; Horpibulsuk, S. Electroosmotic consolidation of soft bangkok clay using copper and carbon electrodes with PVD. ASTM Geotech. Test. J. 2003, 26, 277–288. [Google Scholar]
Publisher’s Note: MDPI stays neutral with regard to jurisdictional claims in published maps and institutional affiliations. |
© 2022 by the authors. Licensee MDPI, Basel, Switzerland. This article is an open access article distributed under the terms and conditions of the Creative Commons Attribution (CC BY) license (https://creativecommons.org/licenses/by/4.0/).