Abstract
The structural safety and serviceability during extreme weather, such as floods and storms, is critical. Due to global warming in the last decades, the increase in the intensity of natural disasters, i.e., flood loading and the durability of the road structures and infrastructures, is becoming critical. Bridges and structures lose their capacity because of ageing over time. On the other hand, the load intensity is another reason for the structural damage. Debris loading due to the flooding on bridges is one of the reasons for the increase in flood loading and eventually structural damage. Measuring the level of structural damage under extreme events is vital in determining the vulnerability and resilience of structures during a disaster. A damage index (DI) can be defined as a measurement tool for the levels of structural damage. Oftentimes, damage indices are developed to measure the deterioration of the system under earthquake loading. Little work has been published on damage indices (DIs) under flood loading, where a uniform pressure is applied to a structure. This paper presents a comprehensive review of DIs published in the literature and compares two approaches to assess the system’s damage utilising finite element methodologies. The structure model developed in the ABAQUS software package is used to predict the failure of a concrete component under applied lateral loading. The model is validated using published experimental work. The model is verified, and then it is used to compute the damage indicators using two primary techniques, including a deflection-based method and an energy loss-based approach. Using the two offered DIs, the change in damage levels is displayed underwater flow uniform loading. A comparison of the two methods is conducted. In this paper, differences between the two concepts are analysed and presented.
1. Introduction
Evidence has shown that most concrete structure failures occur during construction or natural disasters [1]. With recent reports that natural disasters have increased in frequency, understanding the vulnerability of structures during environmental disasters is of utmost importance [2]. Currently, most design procedures do not adequately address structural resilience due to disasters. Historical data showed that two types of natural disasters cost Australia the most money: severe storm floods and riverine flooding. Approximately $399 million per annum of damage loss is estimated due to flooding in Victoria, Australia [3]. On the other hand, the U.S. Department of Transportation survey showed that 28% of structures are deficient [4].
A bridge’s ability to resist flooding and withstand the debris load is one of the essential parameters in its design. Researchers have revised bridge design codes due to the increase in flood intensity during the past decades due to global warming. A comprehensive survey of fluid flow behaviour around piers uses a computational fluid dynamics (CFD) method to understand the water flow distribution [5]. Based on this study, the pressure distribution is adopted to be the uniform load along with the pier height.
An assessment of structural damage has two primary goals: to ensure structural integrity and serviceability while minimising the maintenance expense. Generally, damage assessment assesses how well a structure can withstand particular loads and to what extent its capacity has been lost. A large variety of assessment techniques exist with varying degrees of complexity, and the choice of the best procedure depends heavily on the assessment requirements.
There are numerous methods of structural health assessment. Visual inspection, magnetic particle, and ultrasonic are examples of field assessments that are not efficient because of their applicability and accessibility. It is not always feasible to access all structural components to test and inspect [6]. Numerical structure assessment is an economical approach to assessing structural health and safety. Researchers have also developed concrete damage indicators and crack propagation models [7,8,9]. Various methods for numerical modelling of concrete failure have been developed in recent years, including fracture energy models, smeared crack models, plasticity models, and non-local damage models. According to the literature study, researchers use various damage detection methods to model concrete cracking and crushing numerically, and advanced commercial finite element programs such as ABAQUS provide these phenomena as damage mechanisms [10].
Proper damage indices (DIs) can quantify the local or global damage. DIs are the indicator to represent how the deterioration is progressing. In the literature, damage indexes (DIs) describe the level of damage a structure undergoes under various loading conditions. DI is usually defined as the ratio between the current damage level and the damage that corresponds to failure. In the event of a disaster, the levels of damage can be used to determine the extent of recovery efforts required for structural repair. DI can range from zero to one. A zero value indicates no structural deficiencies, while one indicates the system’s complete failure.
This paper focuses on measuring bridge piers’ damage levels (DLs) under flood loading, which induces a uniform water flow pressure. If the flood momentum increases, so does the force, and consequently, the damage is increased. A comprehensive review of damage indices distributed in the literature is performed to realise the best measure of the failure level. An energy loss-based approach is proposed to estimate the damage and is compared with the deflection-based methods’ most common approach. The proposed energy loss-based method is an applicable method that can be easily modified using the amount produced from a FEM software pack to estimate the DI under various damage levels.
2. Concrete Damage Modelling
Since the mechanical properties of the constituent are complex, which is weak in tension and strong in compression, different approaches are used to model the concrete behaviour. Typically, a concrete structural component behaves elastically with increased loading when not cracked. Crack initiation will lead to a non-linear response followed by crack propagation, plastic response, plastic-hinge formation, and complete failure. In this study, a methodology for modelling is reviewed and validated. Advanced computational techniques have addressed these complexities in the past three decades, and reliable concrete modelling methods are now available.
There are different approaches to modelling concrete damage in the literature; for instance, a 3D discrete crack modelling in a meshfree particle approach is formulated to calculate the reinforced concrete damage and the crack pattern [11,12]. Research has shown that the non-linearity of the concrete is related to the compression and tensile behaviour of the constituent material; however, concrete is fragile in the tensile situation. Various approaches to concrete damage simulation are introduced for applying the plasticity theory to model concrete behaviour, for example, linear elastic fracture mechanics [13], smeared crack modelling [14,15], and the fictitious crack model [16], in which it was assumed the crack was within an element [17]. The smeared crack model has to be distinguished if a single or several cracks should be modelled within a single-finite element [18]. This study uses the Concrete Damage Plasticity (CDP) approach, the most common and widely accepted primary modelling method.
2.1. Concrete Damage Plasticity Modelling
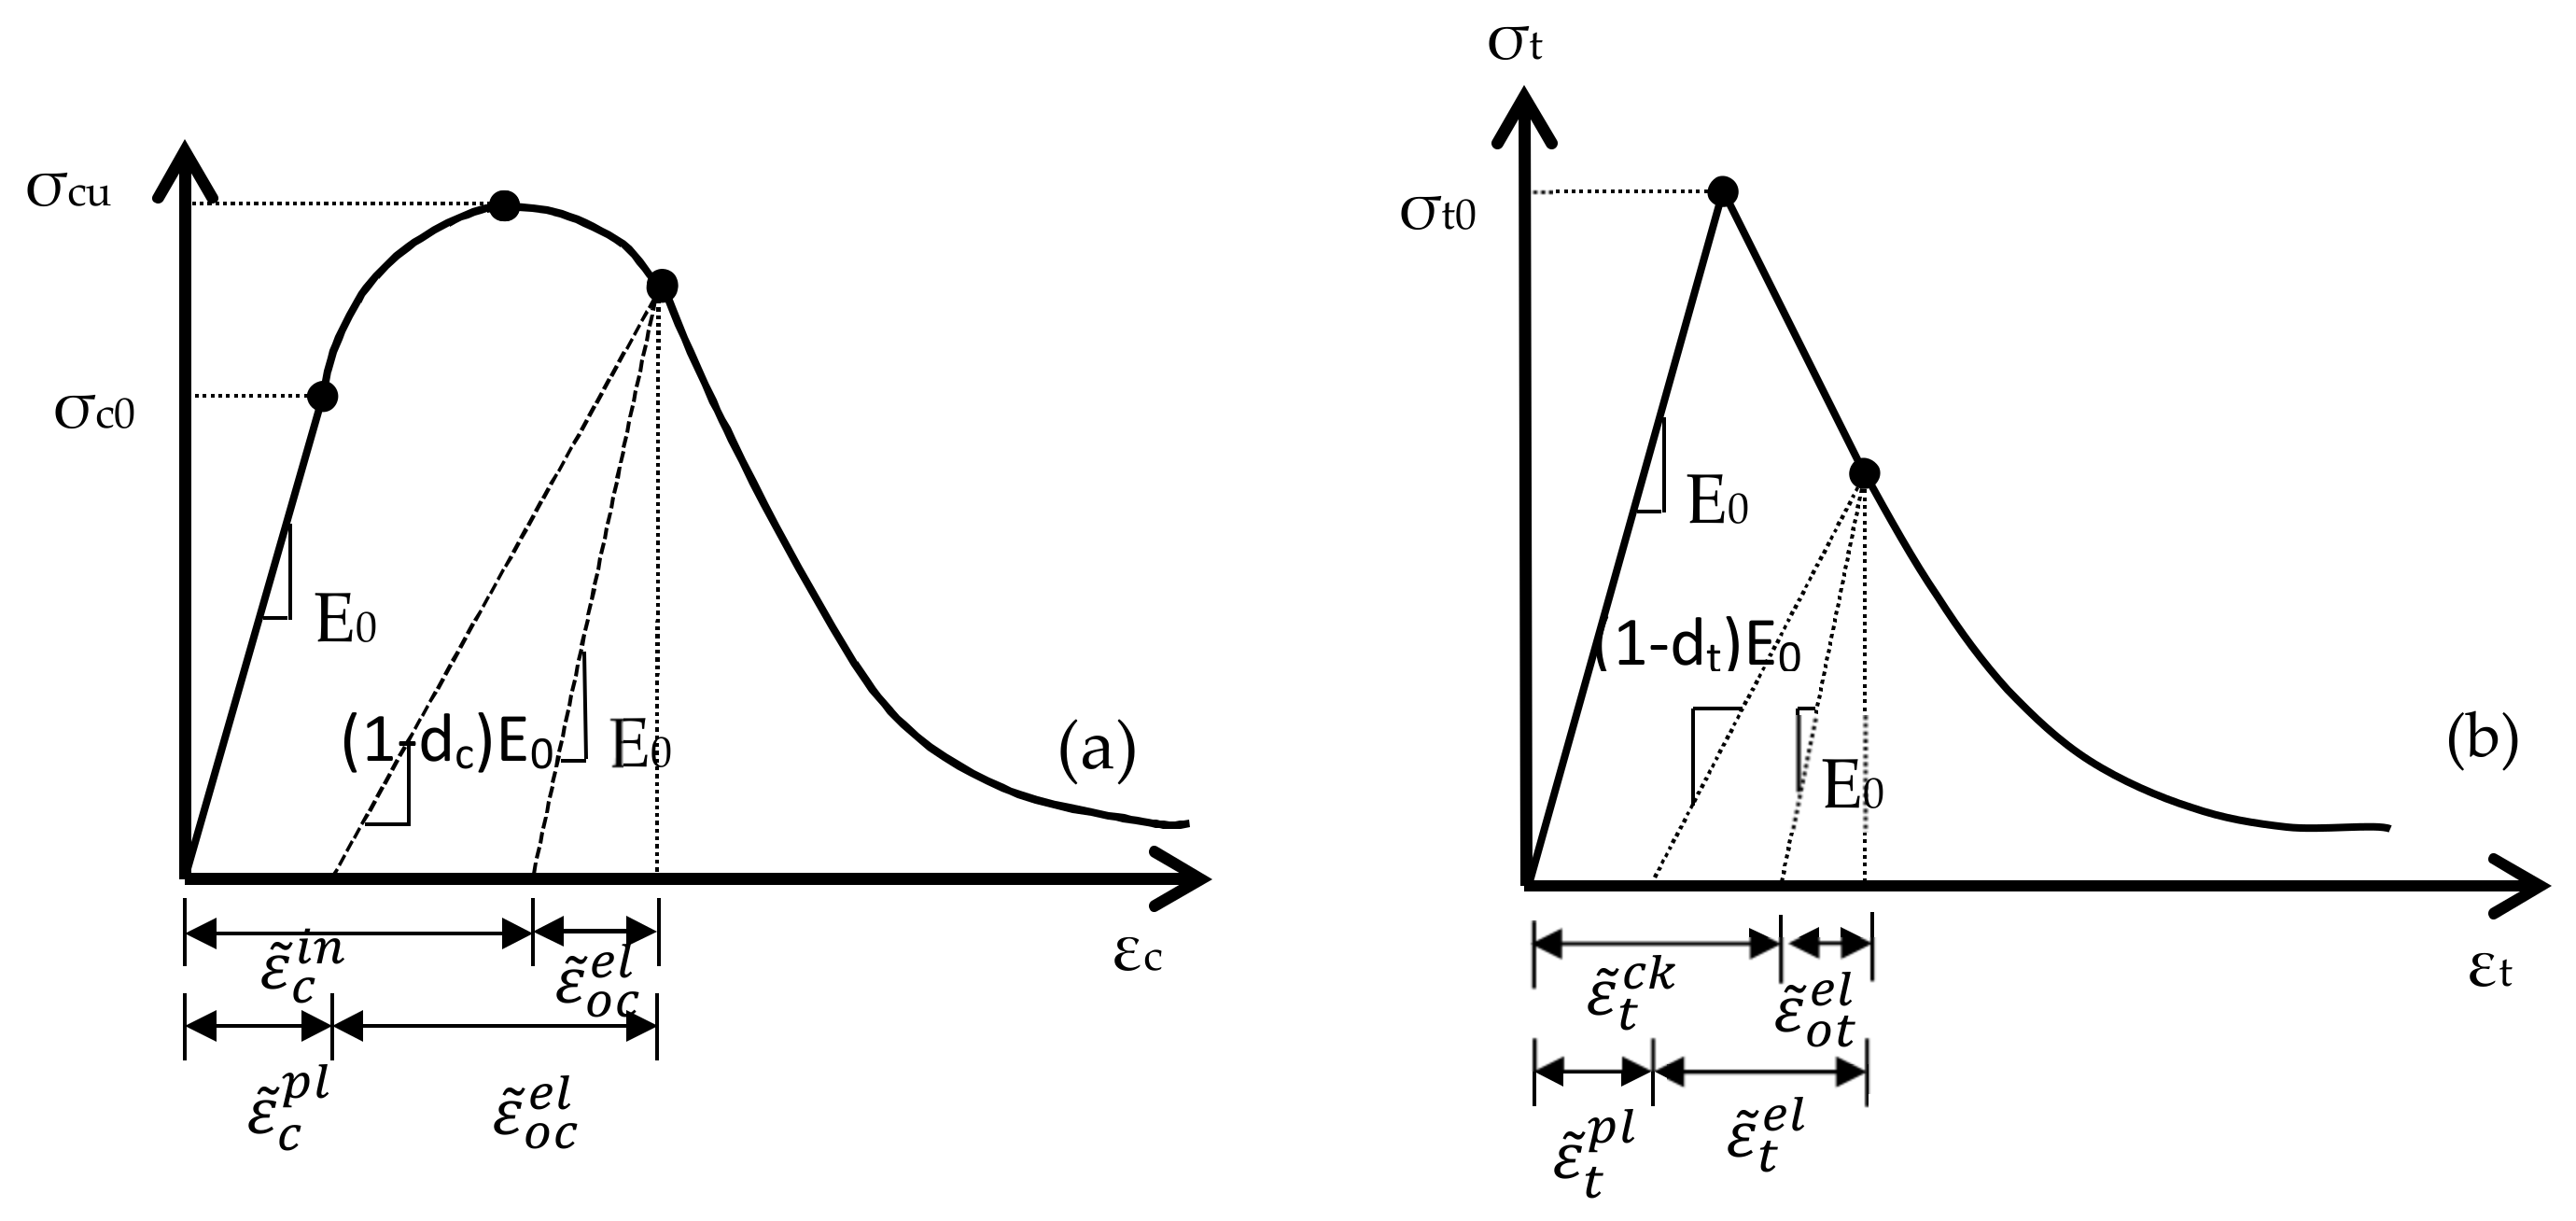
The Concrete Damage Plasticity (CDP) model is one of the most popular constitutive models that can predict concrete’s mechanical behaviour under various loading conditions, including compression and tension, uniaxial, biaxial, and triaxial loading. It describes the mechanical characteristics of concrete by identifying scalar damage variables. The non-linearity of the concrete is attributed to two distinct degradation phenomena; damage and plasticity, which can be described by the theories of continuum damage mechanics and plasticity. Therefore, a model that considers both plasticity and damage is necessary. The tensile and compressive responses of concrete can be characterised, as shown in Figure 1 schematically.
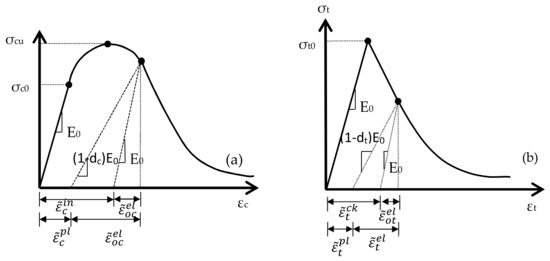
Figure 1.
Concrete behaviour in axial compression (a) and tension (b) strength [15].
ABAQUS software offers the CDP approach, where dt and dc are damage variables ranging from 0 (no damage) to 1 (fully damaged). E0 is the initial elastic module and , , , and represent the compressive plastic strain, tensile plastic strain, compressive inelastic strain, and inelastic tensile strain, respectively. The stress–strain relationships are described in Equations (1) and (2):
The damage with introduced plasticity yield criteria and damage criteria (dt & dc) adequately describe the plastic response of the concrete. Subscript “c” represents the term in the compressive stress, and alternatively, “t” refers to the tensile stress. The constitutive relationships in the CDP model comply with thermodynamics laws [17] and is a viable model available in the ABAQUS package.
2.2. Damage Indicators: An Analysis
Damage Indices (DI) are applied to measure numerically various damage levels (DLs) of the structure, and they perform a substantial role in decision making on structural resilience during catastrophes. Using the Damage Indices, local and global damage to a structure can be quantified. In general, structural damage to concrete structures can be referred to as failure of the components of the structures. The malfunction in reinforced concrete is defined as the occasion relating to concrete cracking or crushing.
There are two types of DIs available—cumulative and non-cumulative indices. The cumulative damage theory presumes that a stress cycle with alternating stress beyond the durability threshold applies quantifiable, lasting damage [19]. It also states that the overall damage triggered by some stress cycles equals accumulative damages produced by the single stress cycles [20]. In monotonic loadings, the non-cumulative damage models are more suitable. One of the most straightforward methods of expressing the ductility percentage is to represent it as the deformation rate in the load time-history to the ultimate deformation of the structure. It is possible to determine the local damage using the non-cumulative DIs that can be used under monotonously increasing load, but this may not provide a comprehensive picture of the system’s general damage. Table 1 presents a summary of the existing DIs defined by different researchers.

Table 1.
Summary of the Damage Indices and the concepts.
Structure damage can be explored using different concepts. Any significant changes in the typical structural characteristics can be evaluated by DIs and will be a representation of structural damage. For example, displacement [21], stiffness [22], the natural period of the structure [23], fatigue [24], and energy dissipation [25] concepts are the most common methods of damage evaluation [26]. Changes in the structural stiffness matrix or natural period of the structure can be characterised as damage.
The review of the DIs presented above has shown that most of the publications are developed for cyclic loading, where loading cycles would influence the failure or damage mechanism. The applicability of the energy loss-based approaches is investigated in the current study to assess the damage to bridge piers under flood loading. This paper compares the proposed energy loss-based DI and the displacement-based method as the most popular and most convenient existing damage indicators. In order to model and assess the damage to the pier of a U-slab bridge, a simple concrete component is modelled to explain the concept of damage estimation under two types of methodologies.
3. Modelling and Analysis
3.1. Methodology and Modelling Validation
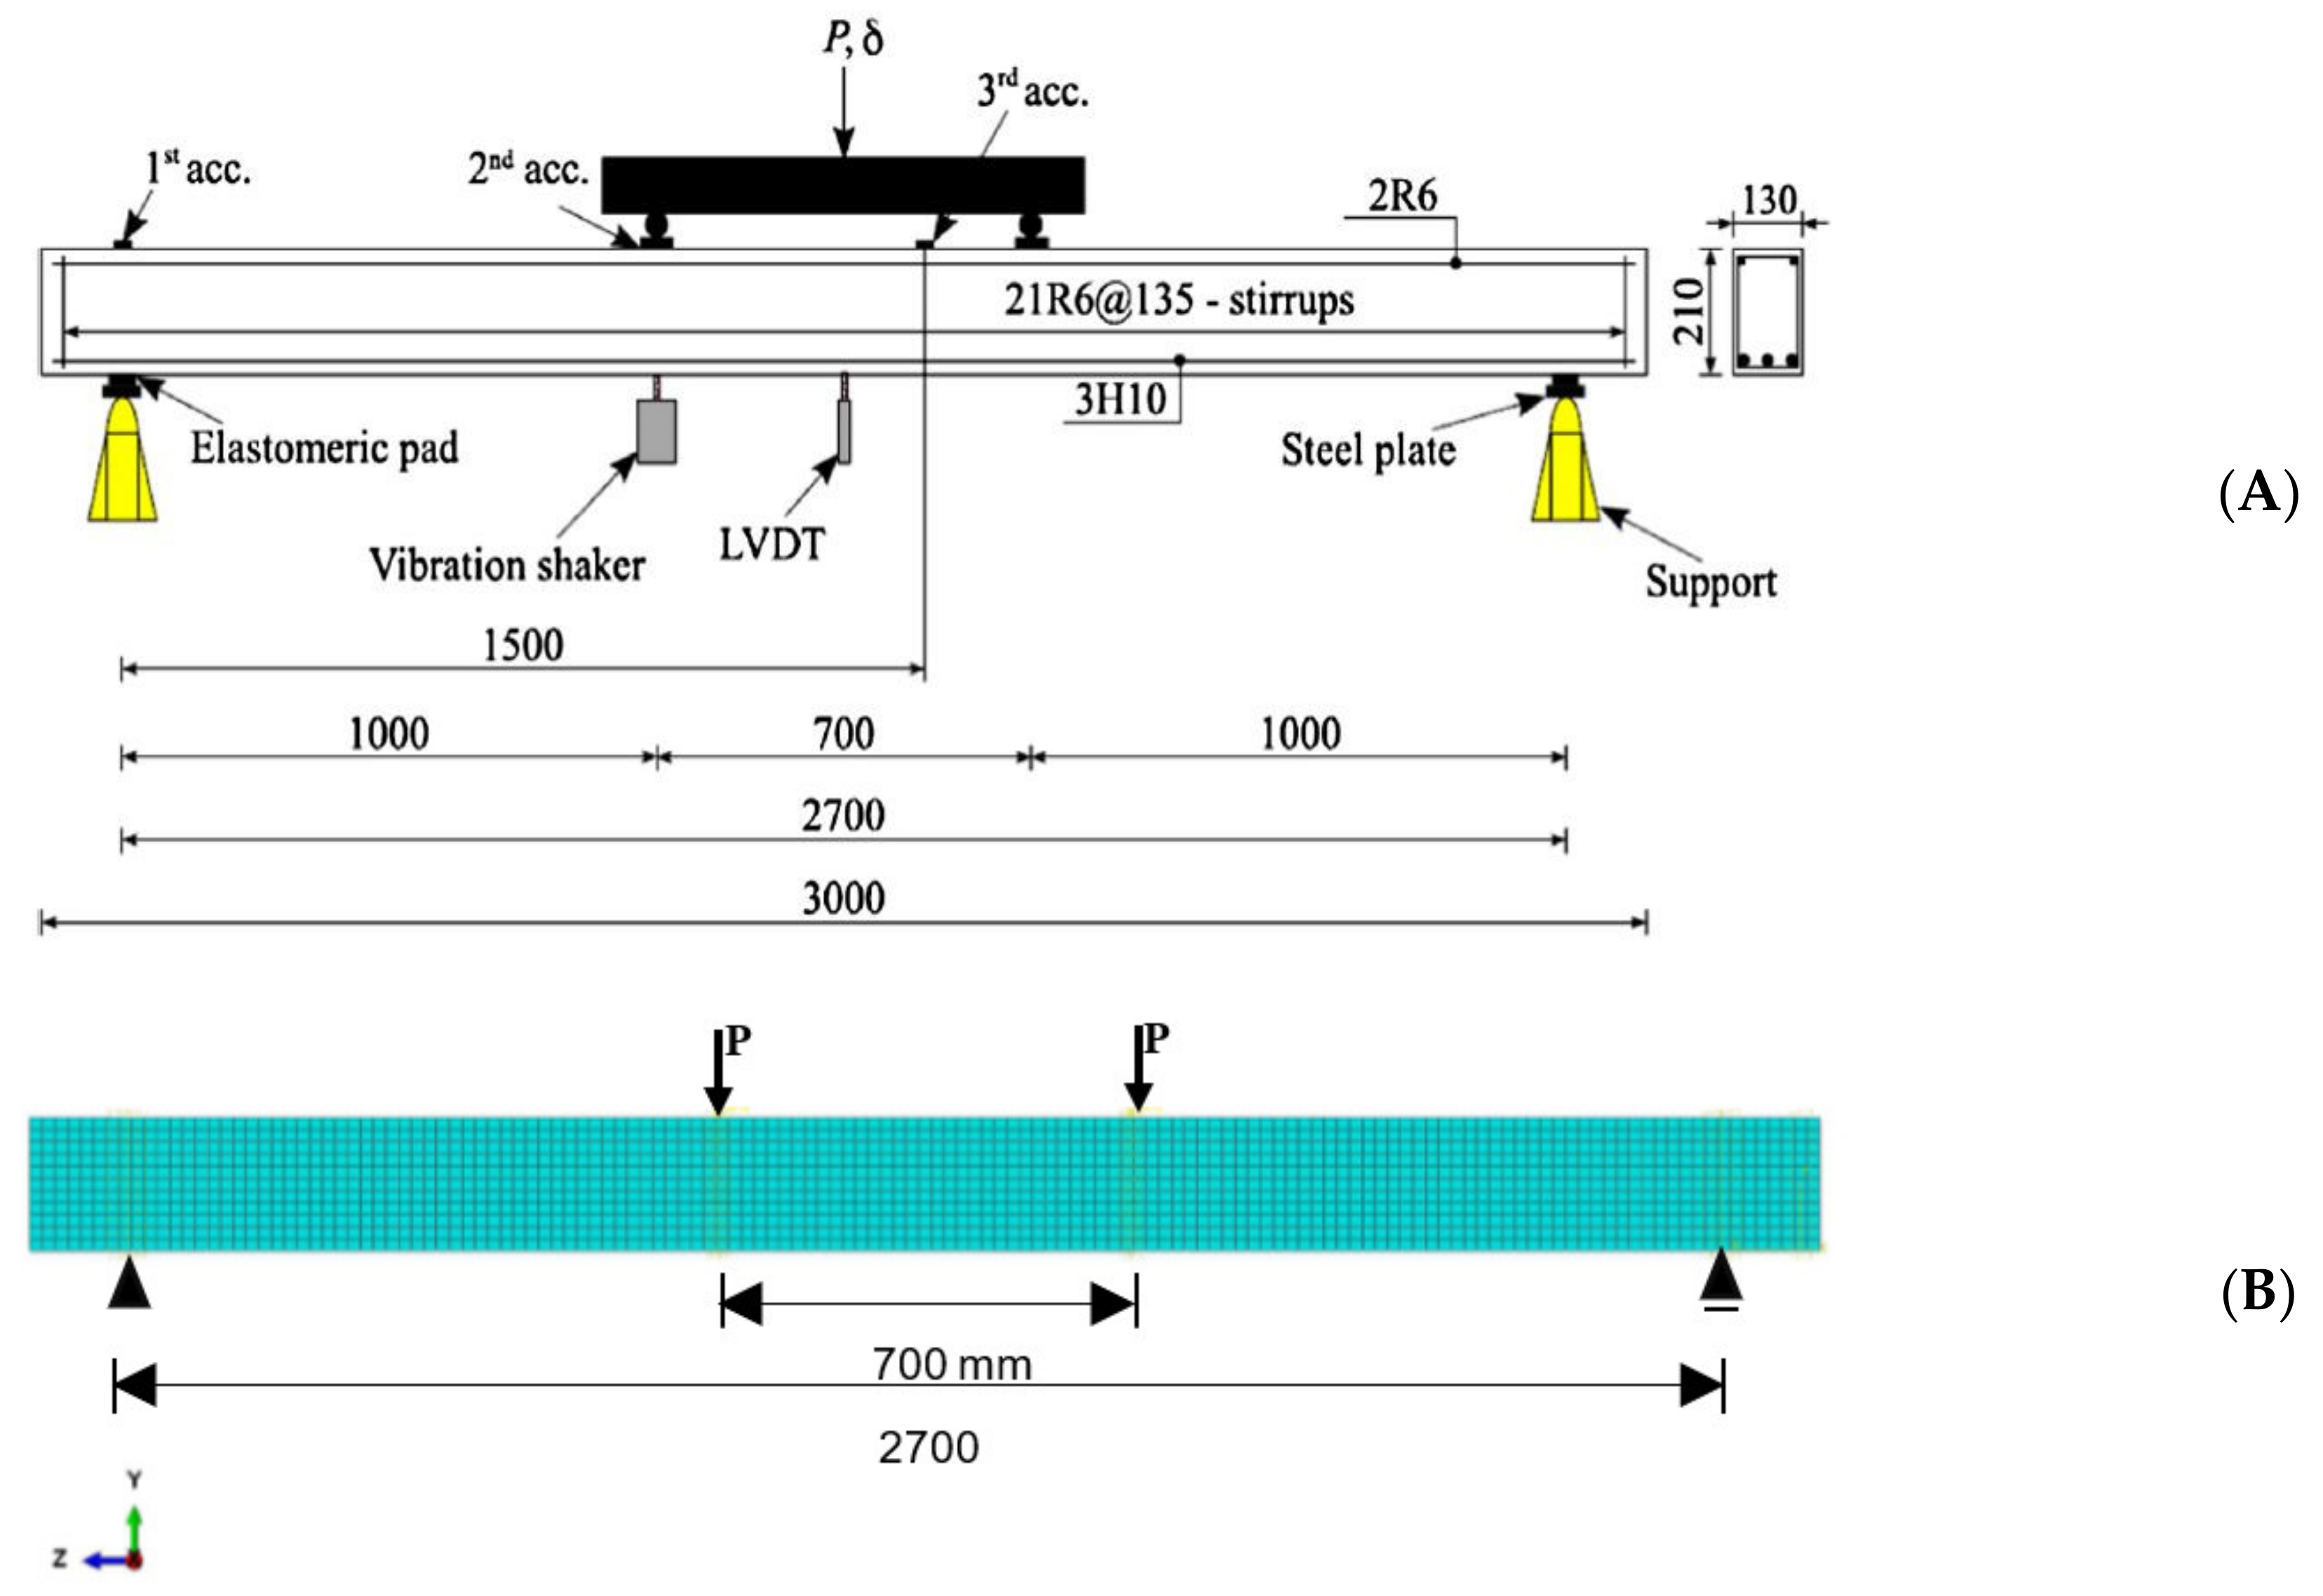
In order to verify the current study approaches, an experimental test model [27] is modelled numerically using the F.E. method and analysed. A non-linear FEM analysis of a simply supported reinforced concrete beam is carried out to determine if it is suitable for damage detection utilising the commercial software ABAQUS 6.14. Damage parameters using the CPD method were consistent with the most common concrete models, i.e., the modulus of elasticity and the stress–strain relation [28]. To ensure mesh efficiency, the sensitivity of the mesh is also evaluated for the FE model. The model is a rectangular beam with a cross-section of 130 × 210 mm and a span of 2700 mm. Figure 2 illustrates the model setup [28] and FEM reproduction in ABAQUS in this study. The analysis results are monitored to validate the structure’s response under a monotonic static loading. The structural responses are assessed under a 20 kN point load incrementally applied to achieve the yield capacity of the system [26].

Figure 2.
(A) Beam setup [28] reproduced with permission from Hanif M. U. (B) Current Studies Beam FEM simulation in ABAQUS and its cross-section.
A comparison of the force–displacement relationship of the numerical model with experimental results has been conducted under static loads, as summarised in Figure 3. In the graph, the current study results and the empirical model are closely correlated [26].
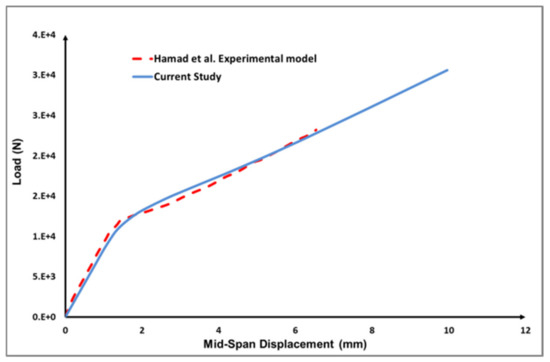
Figure 3.
Static response in ABAQUS correlation with the empirical results [26].
3.2. A Four-Point Model Analysis
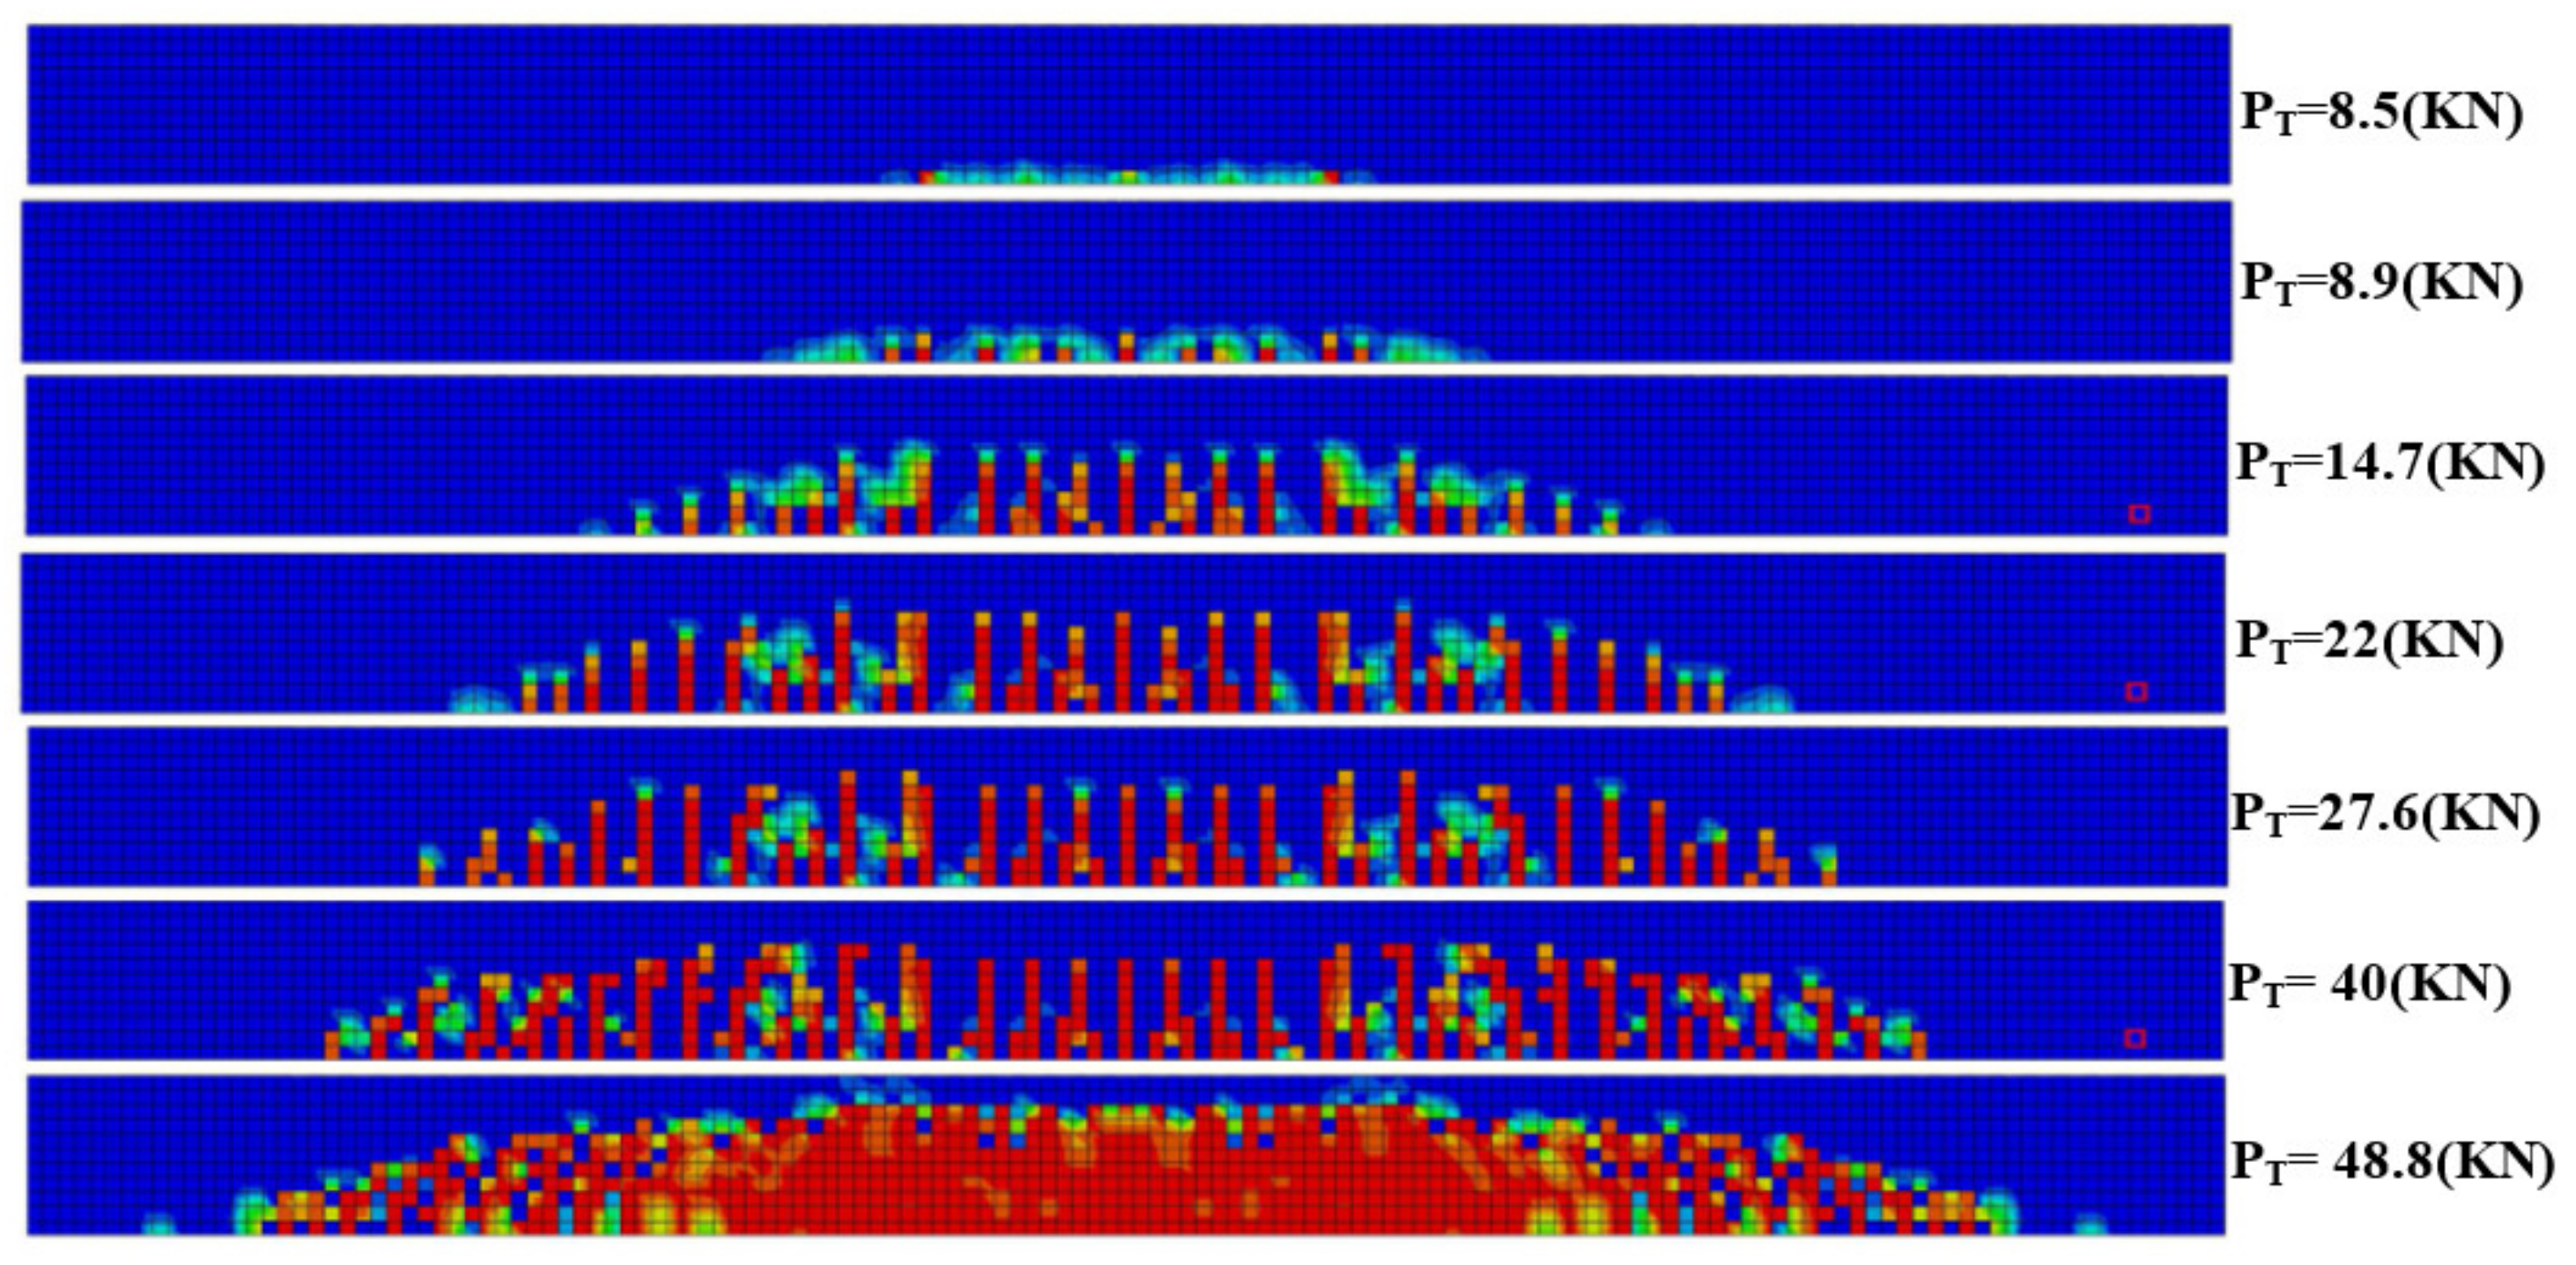
Under incremental static analysis in ABAQUS, Section 3.1 assesses the behaviour of the verified four-point load model, including the ultimate damage capacity. Inverse loading is continued until the system fails entirely. Provided that the system’s capacity is about 45 kN from the previous modelling, 80 kN is applied to observe the fully plastic response in the current study. Figure 4 illustrates crack formation scenarios under different loading levels in which the load is incrementally increased.
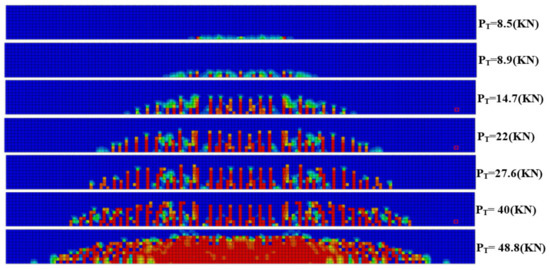
Figure 4.
Crack formation at various load levels in ABAQUS (PT = 2 P).
Figure 5 shows the load-deflection performance of the beam at the midspan. An 80-kN concentrated load is applied to the beam. The response of the pier is presented in three different phases. A quantitative analysis of data is conducted to address the changes in trends of each phase, and the respected data for flexural stiffness and loads are calculated. The parameter “K” is the flexural stiffness and the curve’s slope. The first phase of the graph (blue phase) is when the model is undamaged and the structural response is entirely elastic and safe. As the stiffness of the structure decreases, cracks may start in critical areas. In this model, the critical zone is the mid-span of the beam as the flexural moment is maximum in this area.
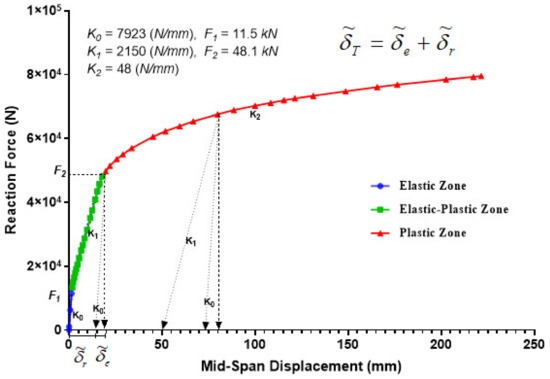
Figure 5.
Curve of static load-displacement for a concentrated four-point model.
Then, in the second phase, concerning the increase in load, cracks are generated, formed, and distributed. However, the formation’s behaviour is elastic with a slight residual deformation (the green phase in Figure 5). When the structure’s stiffness is degrading due to load increase, the first bifurcation on the envelope curve is the critical crack initiation load of the structure, F1. The concrete beam begins to crack by increasing the load, and thus, the tensile stresses transfer to the reinforcement. The second degradation of the curve slope occurs after the second bifurcation point, F2 (critical load of failure), when the cracks start to open, and non-linear behaviour is reached due to the yielding of the tensile reinforcements.
When the third phase of damage starts, the reinforcement begins to yield, and due to the non-linearity, large deformations are expected. From this level of damage, the plastic hinges appeared, and due to that phenomenon, the structure’s stiffness decreased dramatically. Despite the presence of plastic hinges not indicating the structure’s overall instability (failure) (since it can withstand more lateral loads), the plastic hinge appearance can cause non-recoverable damage in the structural system.
The structural responses of the four-point model are validated with the load-deflection curve, when it is under damage analysis using CDP, to estimate the fracture and crack propagation. Figure 5 has the same trend, which can be observed in the fracture mechanics approach to calculate the concrete structural damage [29,30]. This structure’s damage is determined by its mid-span deflection response, and the changes in structural stiffness define its different damage levels.
3.3. Pier Model under Water Flow Pressure Analysis
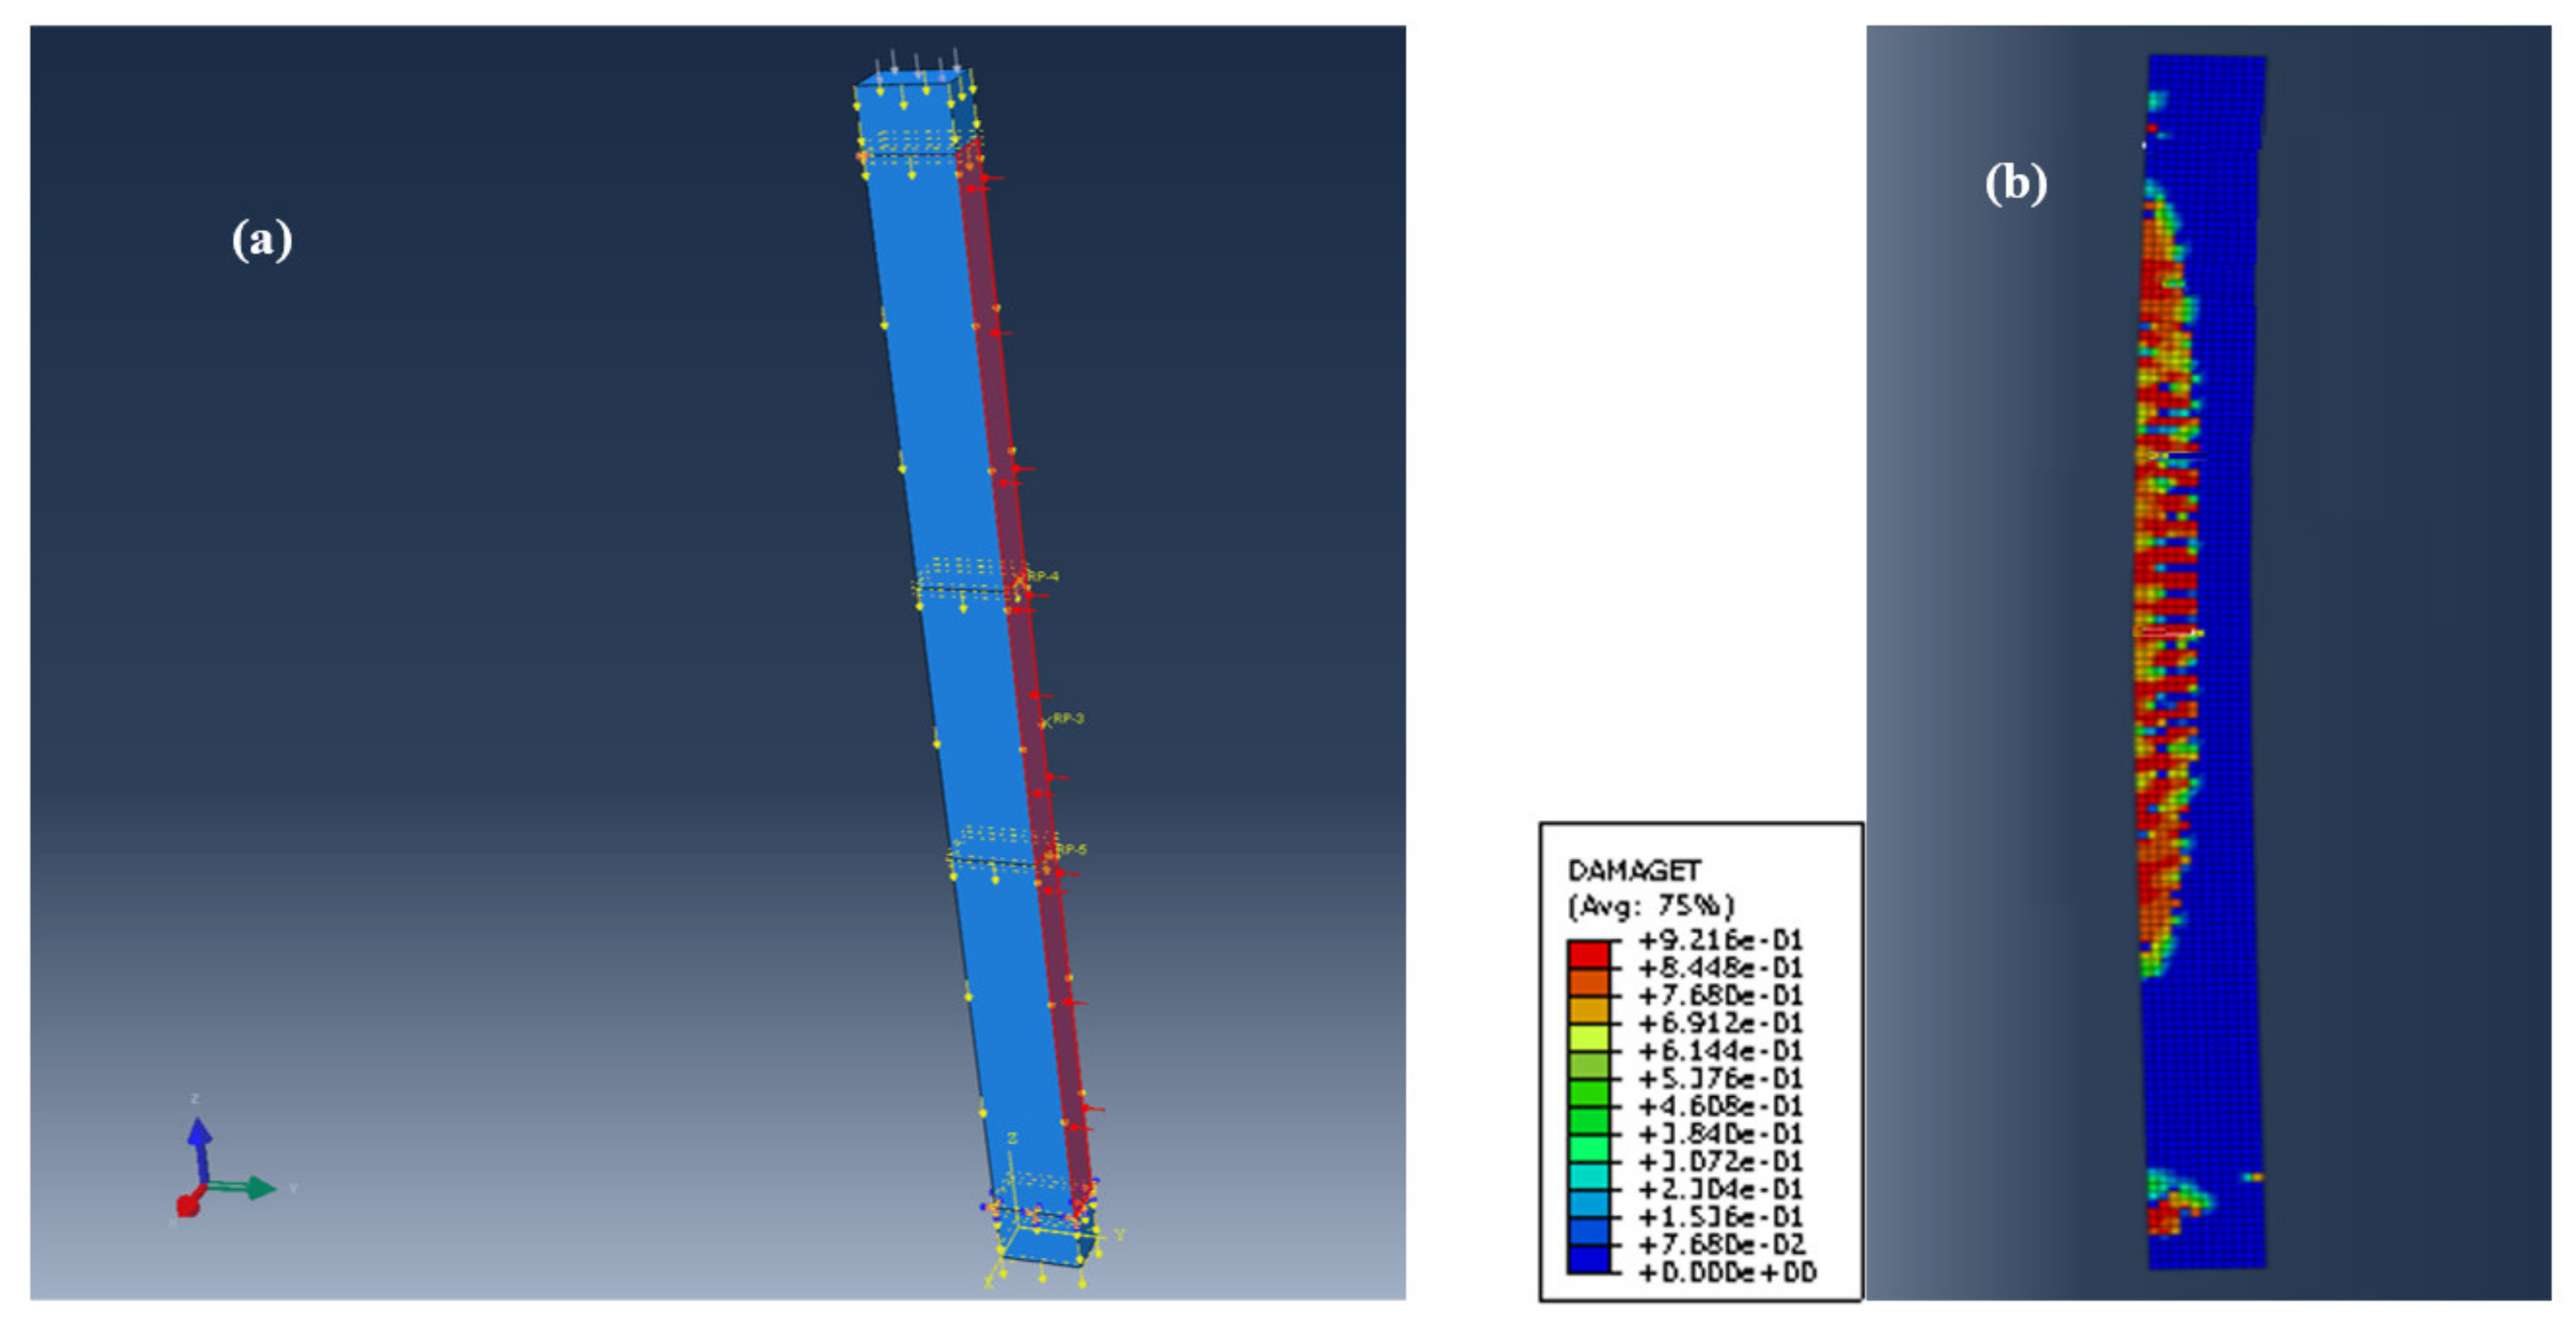
The bridge pier is modelled under uniform pressure by adopting the validated approach to model the concrete. Based on a previous study [5] on the pressure behaviour of the water flow pattern along with the pier height, uniform loading is considered an appropriate metric to represent water flow pressure applied to the pier. Uniform pressure distribution is assumed per the pier model [5]. Here, 1 (MPa) static pressure load is applied on the pier incrementally. The pier is 355 × 355 m in cross-section and 3 m in height; the details of the model are presented in [5,26]. The pier weight and the dead load axial load transferred from the superstructure were considered in modelling and analysis (see Figure 6). The damage parameter (dt) and the contours in Figure 6b are presented to show how the most critical tensile cracks are propagated along with the height of the pier under water-flow pressure. As can be seen, apart from the mid-height of the pier, the fixed support is a high-risk area.
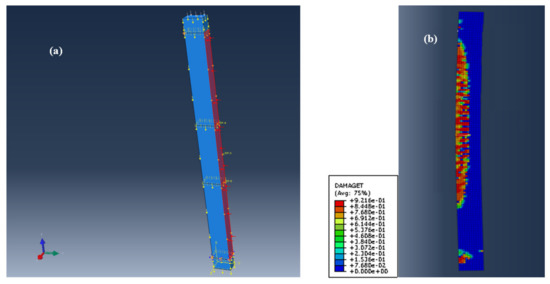
Figure 6.
(a) Simulation of the pier and the water flow load applied on one face in ABAQUS and (b) damage parameter contours and the legends (red shows that the tensile damage parameter is more than one and the blue is zero).
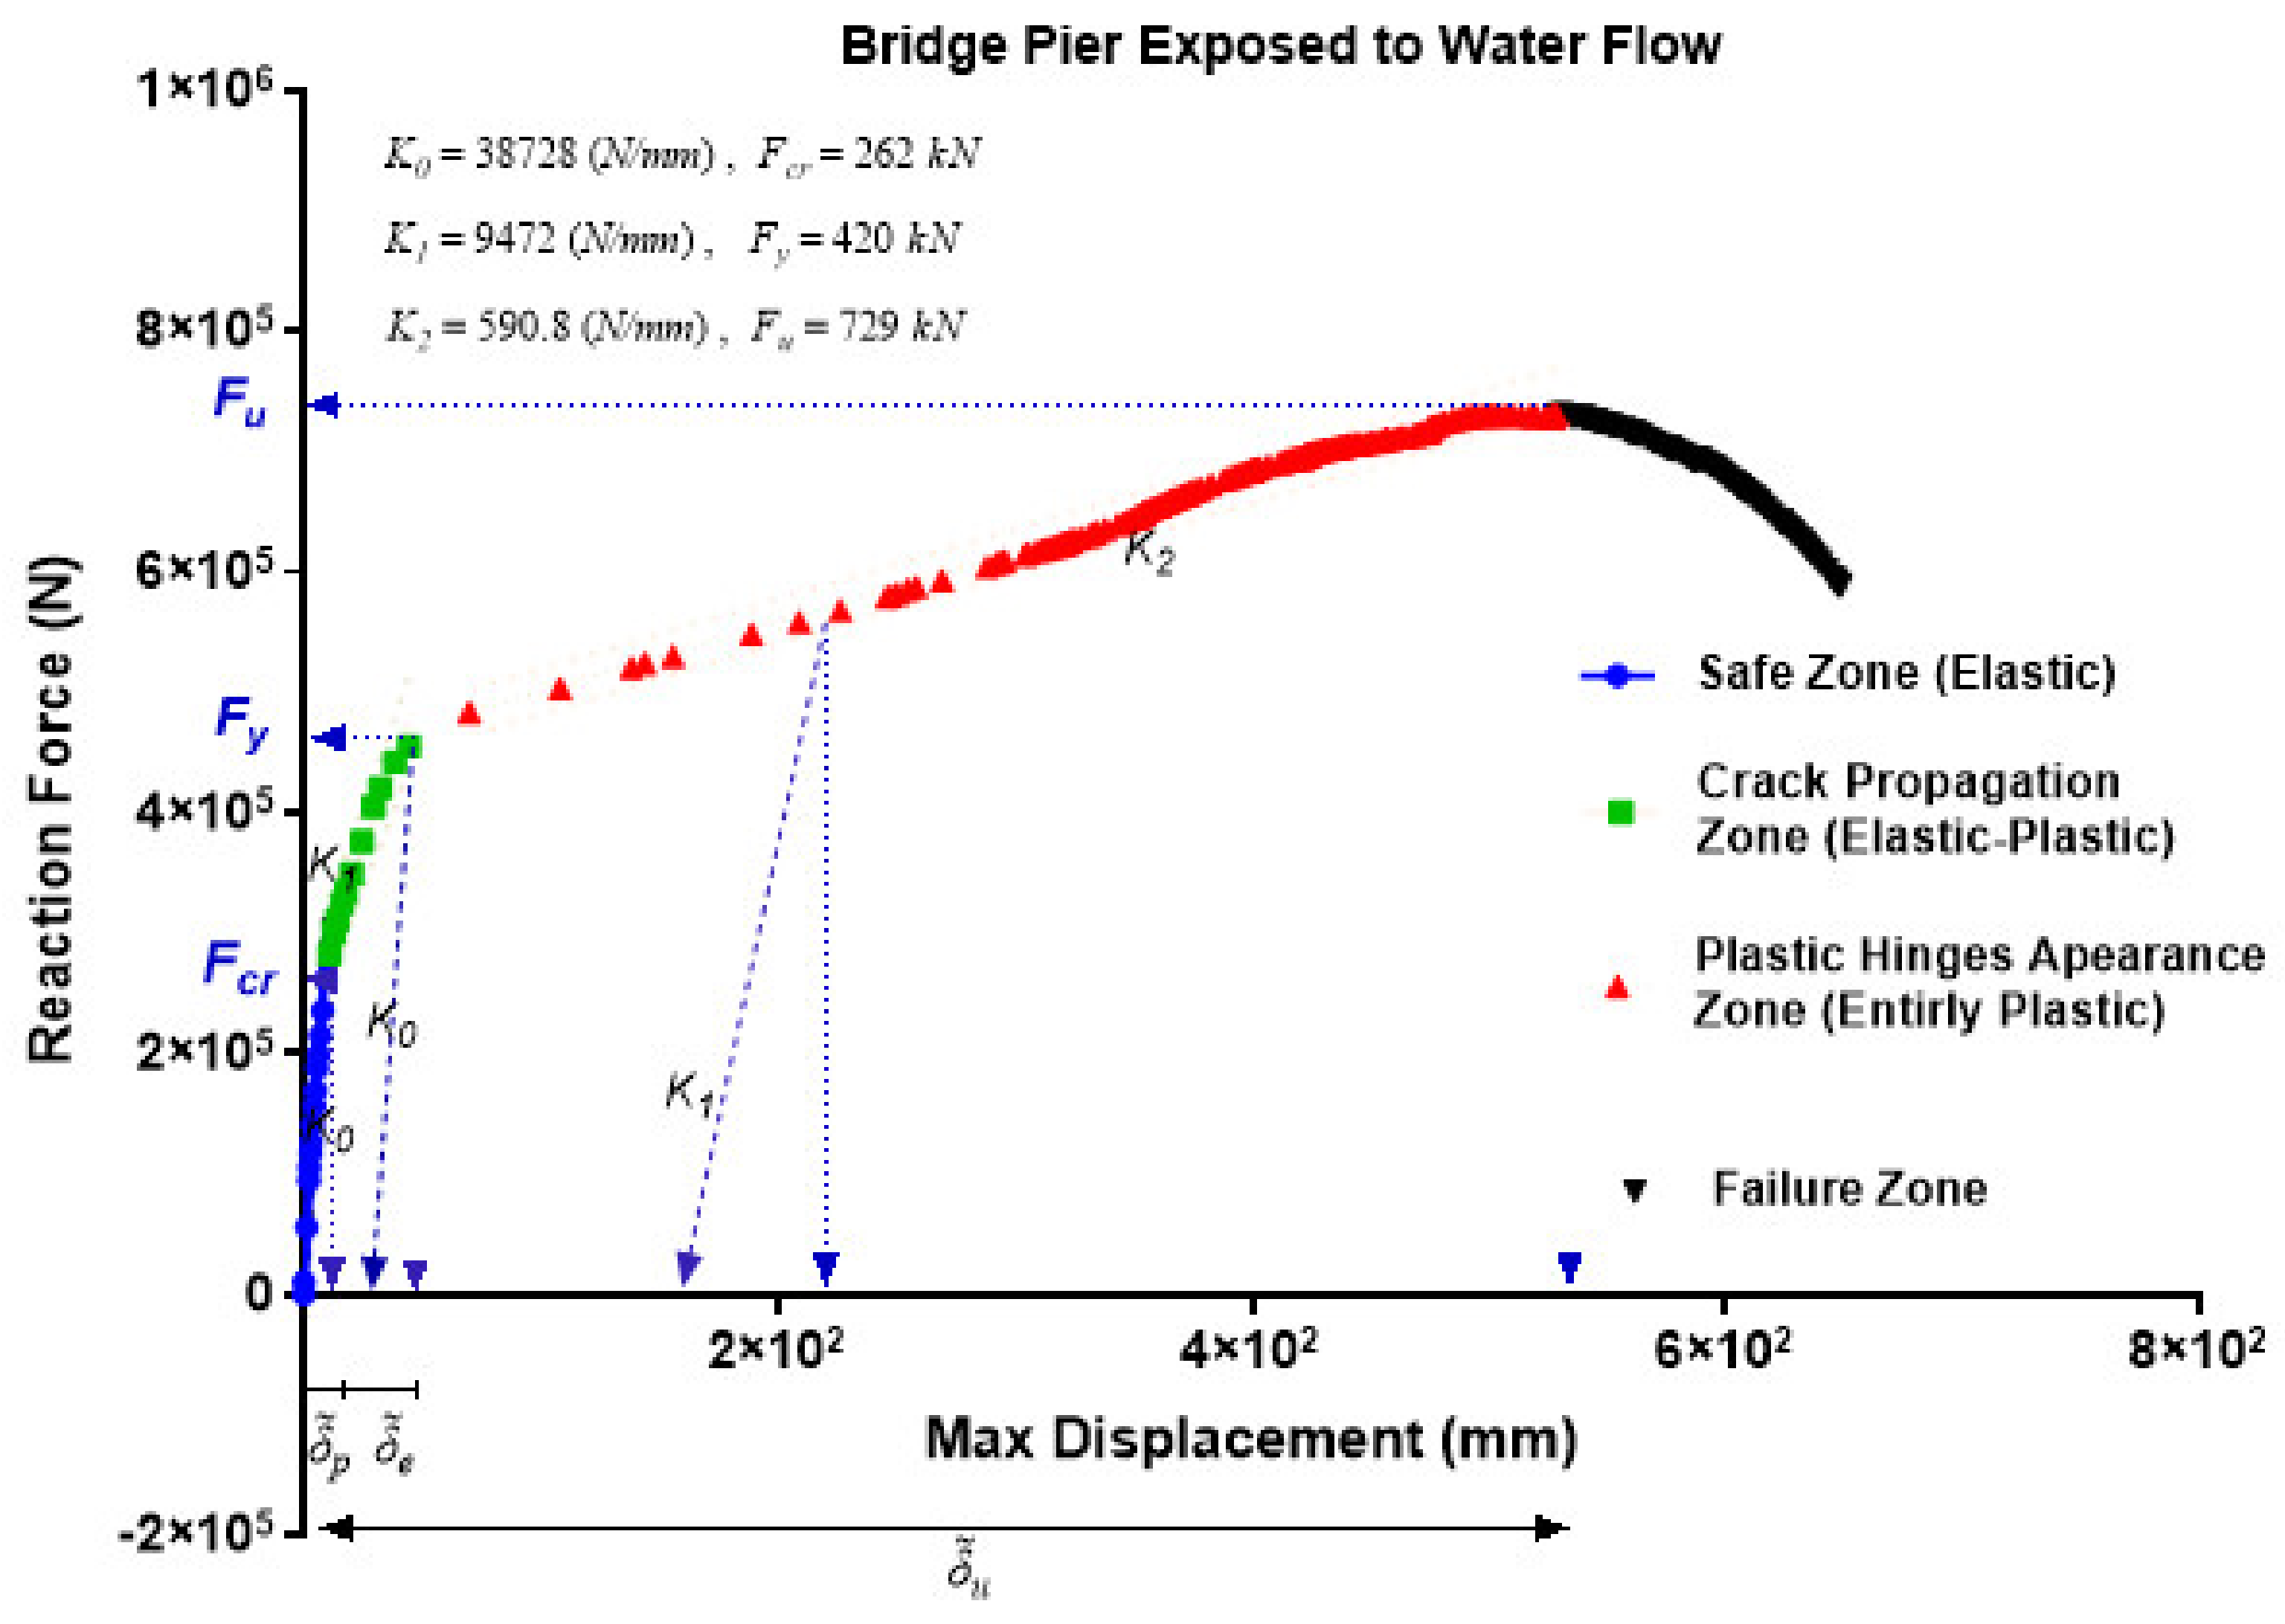
The modelling and analysis approach mentioned in Section 3 is applied to the bridge pier model in this simulation. In this model, the bed condition is assumed fixed. It is expected that the pier shows higher flexural stiffness behaviour. Figure 7 provides the load-deflection response for different damage levels. The appearance of the plastic hinge dramatically reduced the structural capacity. Therefore, it can be concluded that the failure of the structure synchronised with the appearance of plastic hinges. In the present static non-linear simulation, the output from the ABAQUS package is utilised for damage assessment. The quantitative data can be estimated using the characteristic parameters of the structure (K1–K2, F1–F3) using Figure 7.
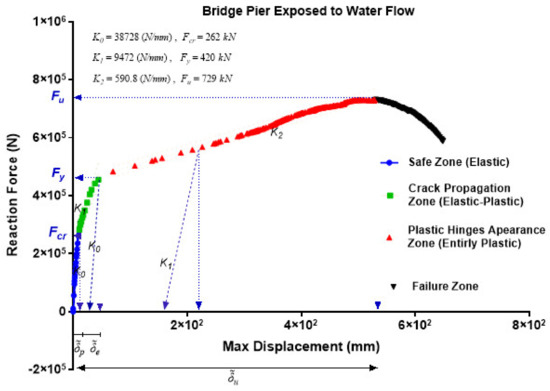
Figure 7.
Load-deformation performance for a bridge pier under water-flow loading.
3.4. Comparison between the Fixed-End and Pined-End Model Response and Their Performances
The incremental FEM analysis using ABAQUS is used to calculate the damage to the structure. The ductility factor is higher for the pin-pin supports model, while stiffness is lower. The negative eigenvalue of the stiffness matrix appears when the structure is unstable. In this model, 80 kN is not enough for this pin-pin model phenomenon. Both models are analysed to show the procedure of analysis. A comparison of the two different methods for both models is conducted to understand the best approach for assessing the structural damage.
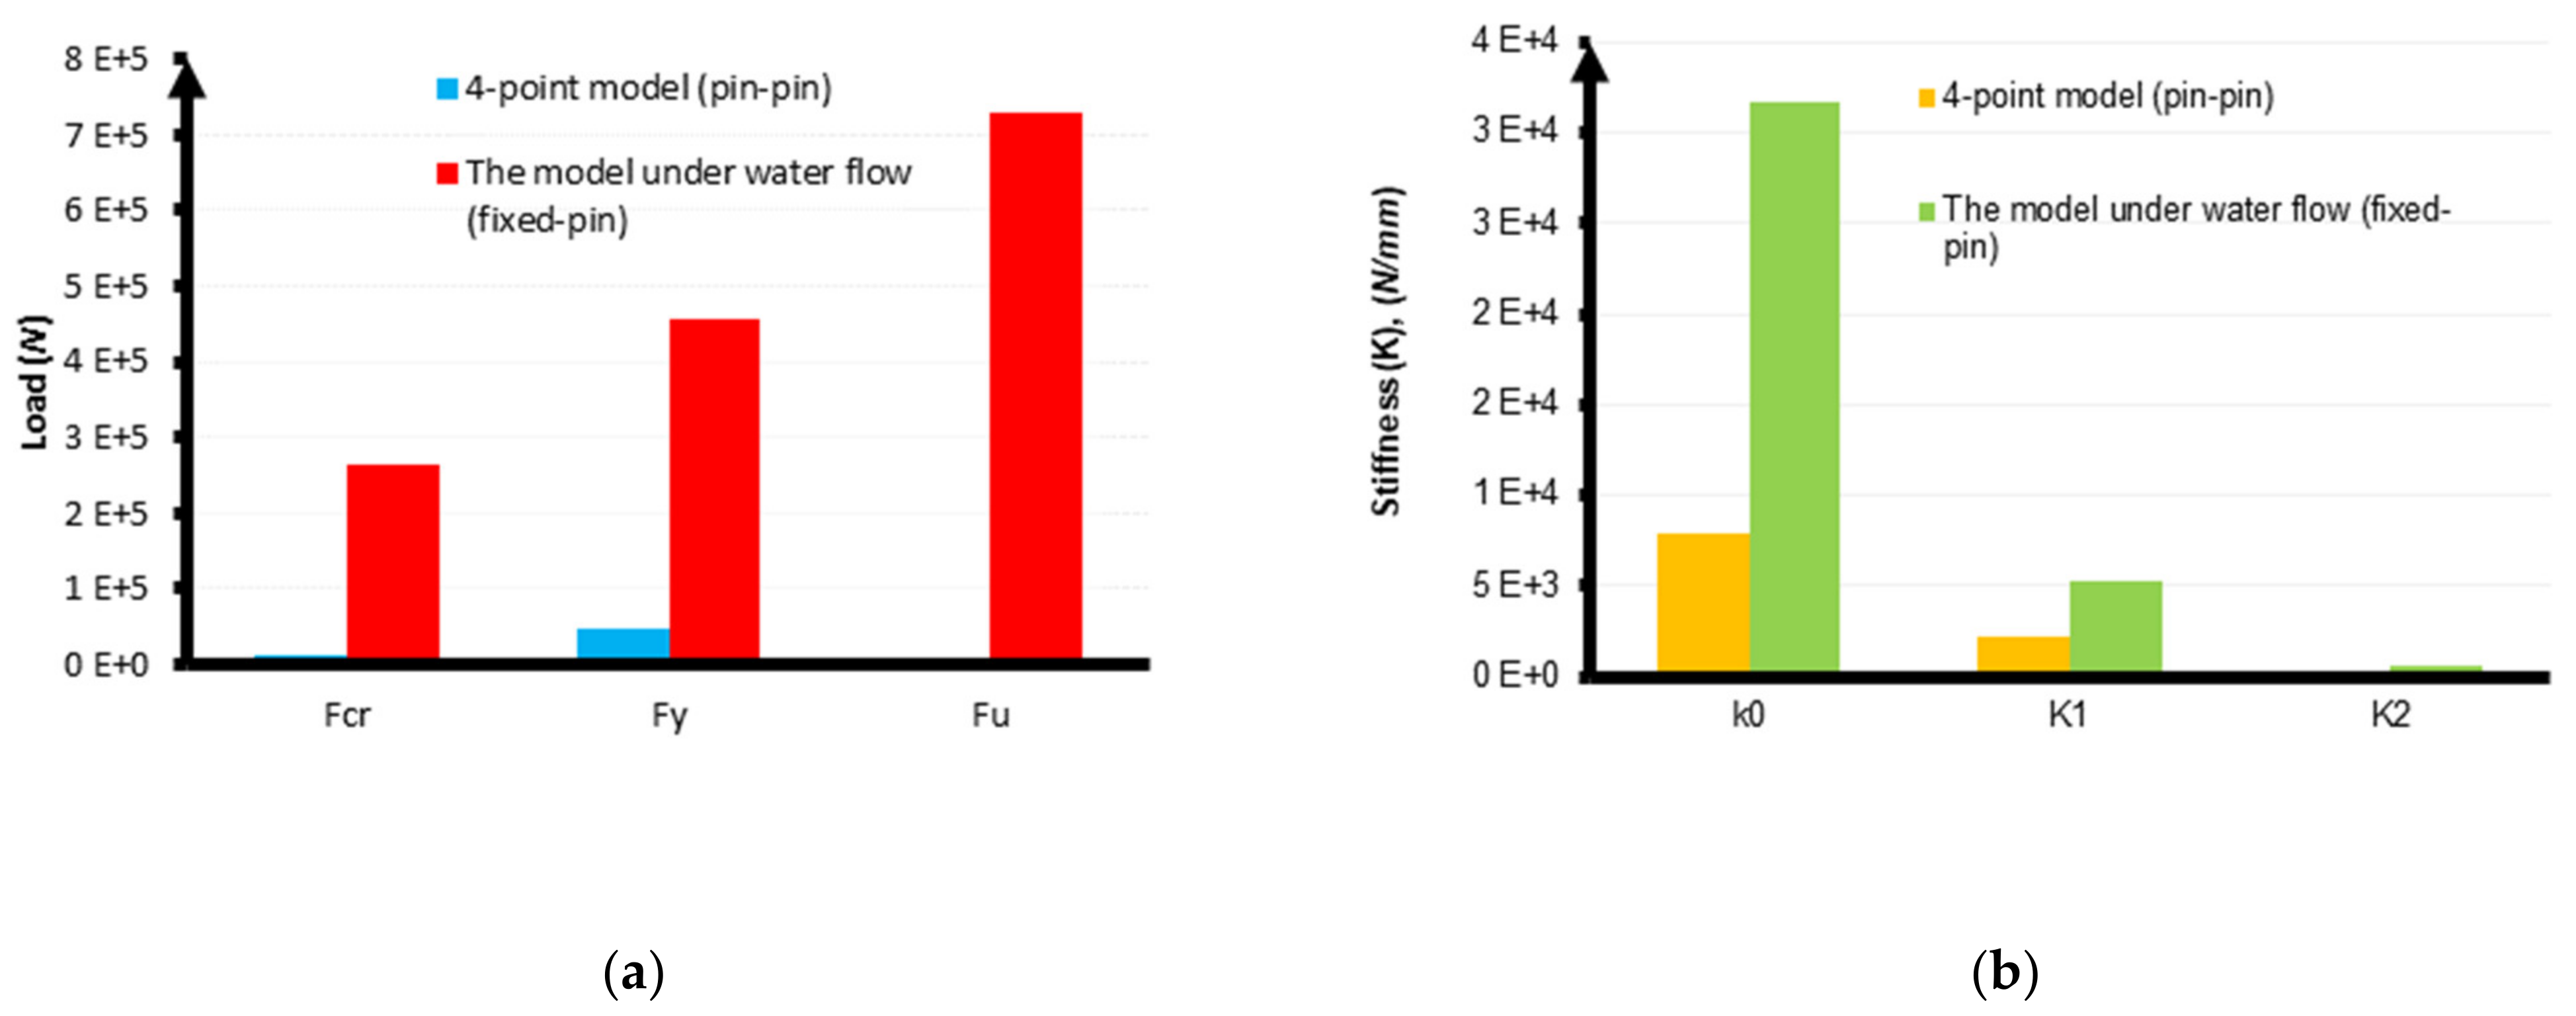
The numerical outcomes derived from the two models with the same cross-section and lengths are described in Table 2. A comparison of the threshold loads and the stiffness values for both models in each level is presented. The analysis considered comparing these two models and a study on the fixity effect on the damage levels of the component. F1 is the load that causes the first crack initiation in the structure (Fcr), resulting in the first stiffness reduction. Since the four-point model is simply supported, the structural crack initiation threshold load is just 4% of the fix supported model. The initial slope of the load-displacement curve is within the elastic range, K0, and the initial flexural stiffness of the structure, for the simply supported models, is 25% of the fix-pin model’s initial stiffness under uniform pressure. F2 is the lateral load that causes the yielding of the reinforcement. In this DL, elastic range, K1, the structural stiffness when cracks are initiated, has a 73% reduction in the pin-pin model, while 83.2% of the structural stiffness is reduced for the fixed-pin model. This level is the elastic-plastic phase, and plastic hinges’ initiations appear in this phase. Since the model under the uniform pressure is loaded until the system’s failure, the structural stiffness has reduced up to 11% of the structural elastic-plastic stiffness. In this mode, the structure behaved plastically, and notable deformation occurred. At this stage, the fixed-pin model responded and behaved similarly to a pin-pin model structurally.
Table 2.
The models’ threshold and approximate stiffness in each damage level.
Figure 8 compares the growth in the ultimate loads and a reduction in the structural stiffness for different DLs for both models, observed from the models’ load-deflection response study. This study demonstrated the impact of fixity on bridge piers’ structural response under flood loading. The fixed-end model shows that energy is dissipated in the fixed-end zone of the system due to the flexural damage, and the significant reduction in the stiffness in the model can show the dissipation of energy. In contrast, considerable deflection in the pin-end model happens in the mid-span, which causes significant damage. This comparison can provide an initial insight into the behaviour of a bridge pier with a fixed end zone exposed to flood loading in the following parts of the study.

Figure 8.
Comparison of (a) the growth in the threshold loads and (b) the reduction in the structural stiffness for different damage levels for both models.
3.5. Damage Evaluation of Pier Based on Deflection Concepts
The DI for each DL is developed based on the structural displacement considering the definition of damage indices using Equation (3) [31]:
where is the deflection of the mid-span in the load step i and is the ultimate displacement for each DL, j (j = 1, 2, 3). To gain a better understanding of the calculation procedure, from the load-deflection curve of the midspan, shown in Figure 7, the corresponding capacity and associated deflections, , are estimated for all of the three DLs by analysing the data trends. Then, the percentage of damage quantity values for different DLs are evaluated [17]. DI variation in relation to water flow loading for various DLs is illustrated in Figure 9. The diagonal dashed line in Figure 9 indicates a similar trend in the three different DLs. Within the phase 1 level, the coating concrete and the concrete in the tensile zone tolerate the tensile stresses. Although the values of DI change from zero to one in the first level of damage, no damage is expected. The DI value in level 1 shows vulnerability and how the structure is close to crack formation. Since the initial crack forms, the structure starts to deteriorate by losing stiffness, and, in other words, a non-linear response starts. Level 2 damage is formed when cracks appear in the concrete and the tensile load transfers to the reinforcement. Within Level 2, the damage rate represents moderate damage to the structure, in which minor cracks are formed, and the reinforcement is not yielded. Analysing the output and DI values indicates that the damage for the second DL is less than 20%.
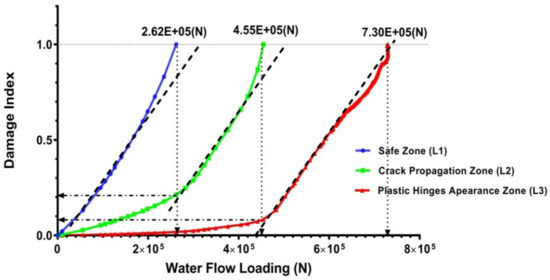
Figure 9.
Damage Index (DI) variation for the first, second, and third DLs when water flow increases incrementally.
The equivalent equations are calculated based on a regression analysis to determine how the deformation index affects the damage behaviour of the system. Upon exposure to water flow loading, structural safety can be explained by the equations presented in Table 3, where F indicates water flow loading. The correlation coefficient, R2, also represents the accuracy of the formula. However, for further study, it is recommended to generalise this approach to different structures with distinct characteristics.
Table 3.
Safety equations, based on deformation concepts, for various levels of damage.
Comparing the three levels of damage based on the deformation concept indicates that the loads required for increasing the damage from the first level, no damage, to the second level, moderate damage, are approximately similar to damage the model from the second to the third DL. For example, the ratio between the second DL load and the first DL is about 1.7 (), and the ratio between the third DL and second DL is about 1.6 (). This means that the changes in the structural stiffness are relatively close.
Figure 9 and Table 3 explain the results based on the values of all DLs. Notably, there are extraordinarily similar patterns of damage level changes with the load changes. The slopes of all graphs are remarkably close (see Figure 9, where a relatively equal slope of dashed lines indicates this phenomenon).
4. Damage Calculation Based on Dissipated Damage Energy
Apart from the deflection-based DI, the dissipated energy loss is analysed on the entire system to measure the damage in this paper. We compare the results with the prediction in the prior section based on the maximum deformation of the structure in the middle.
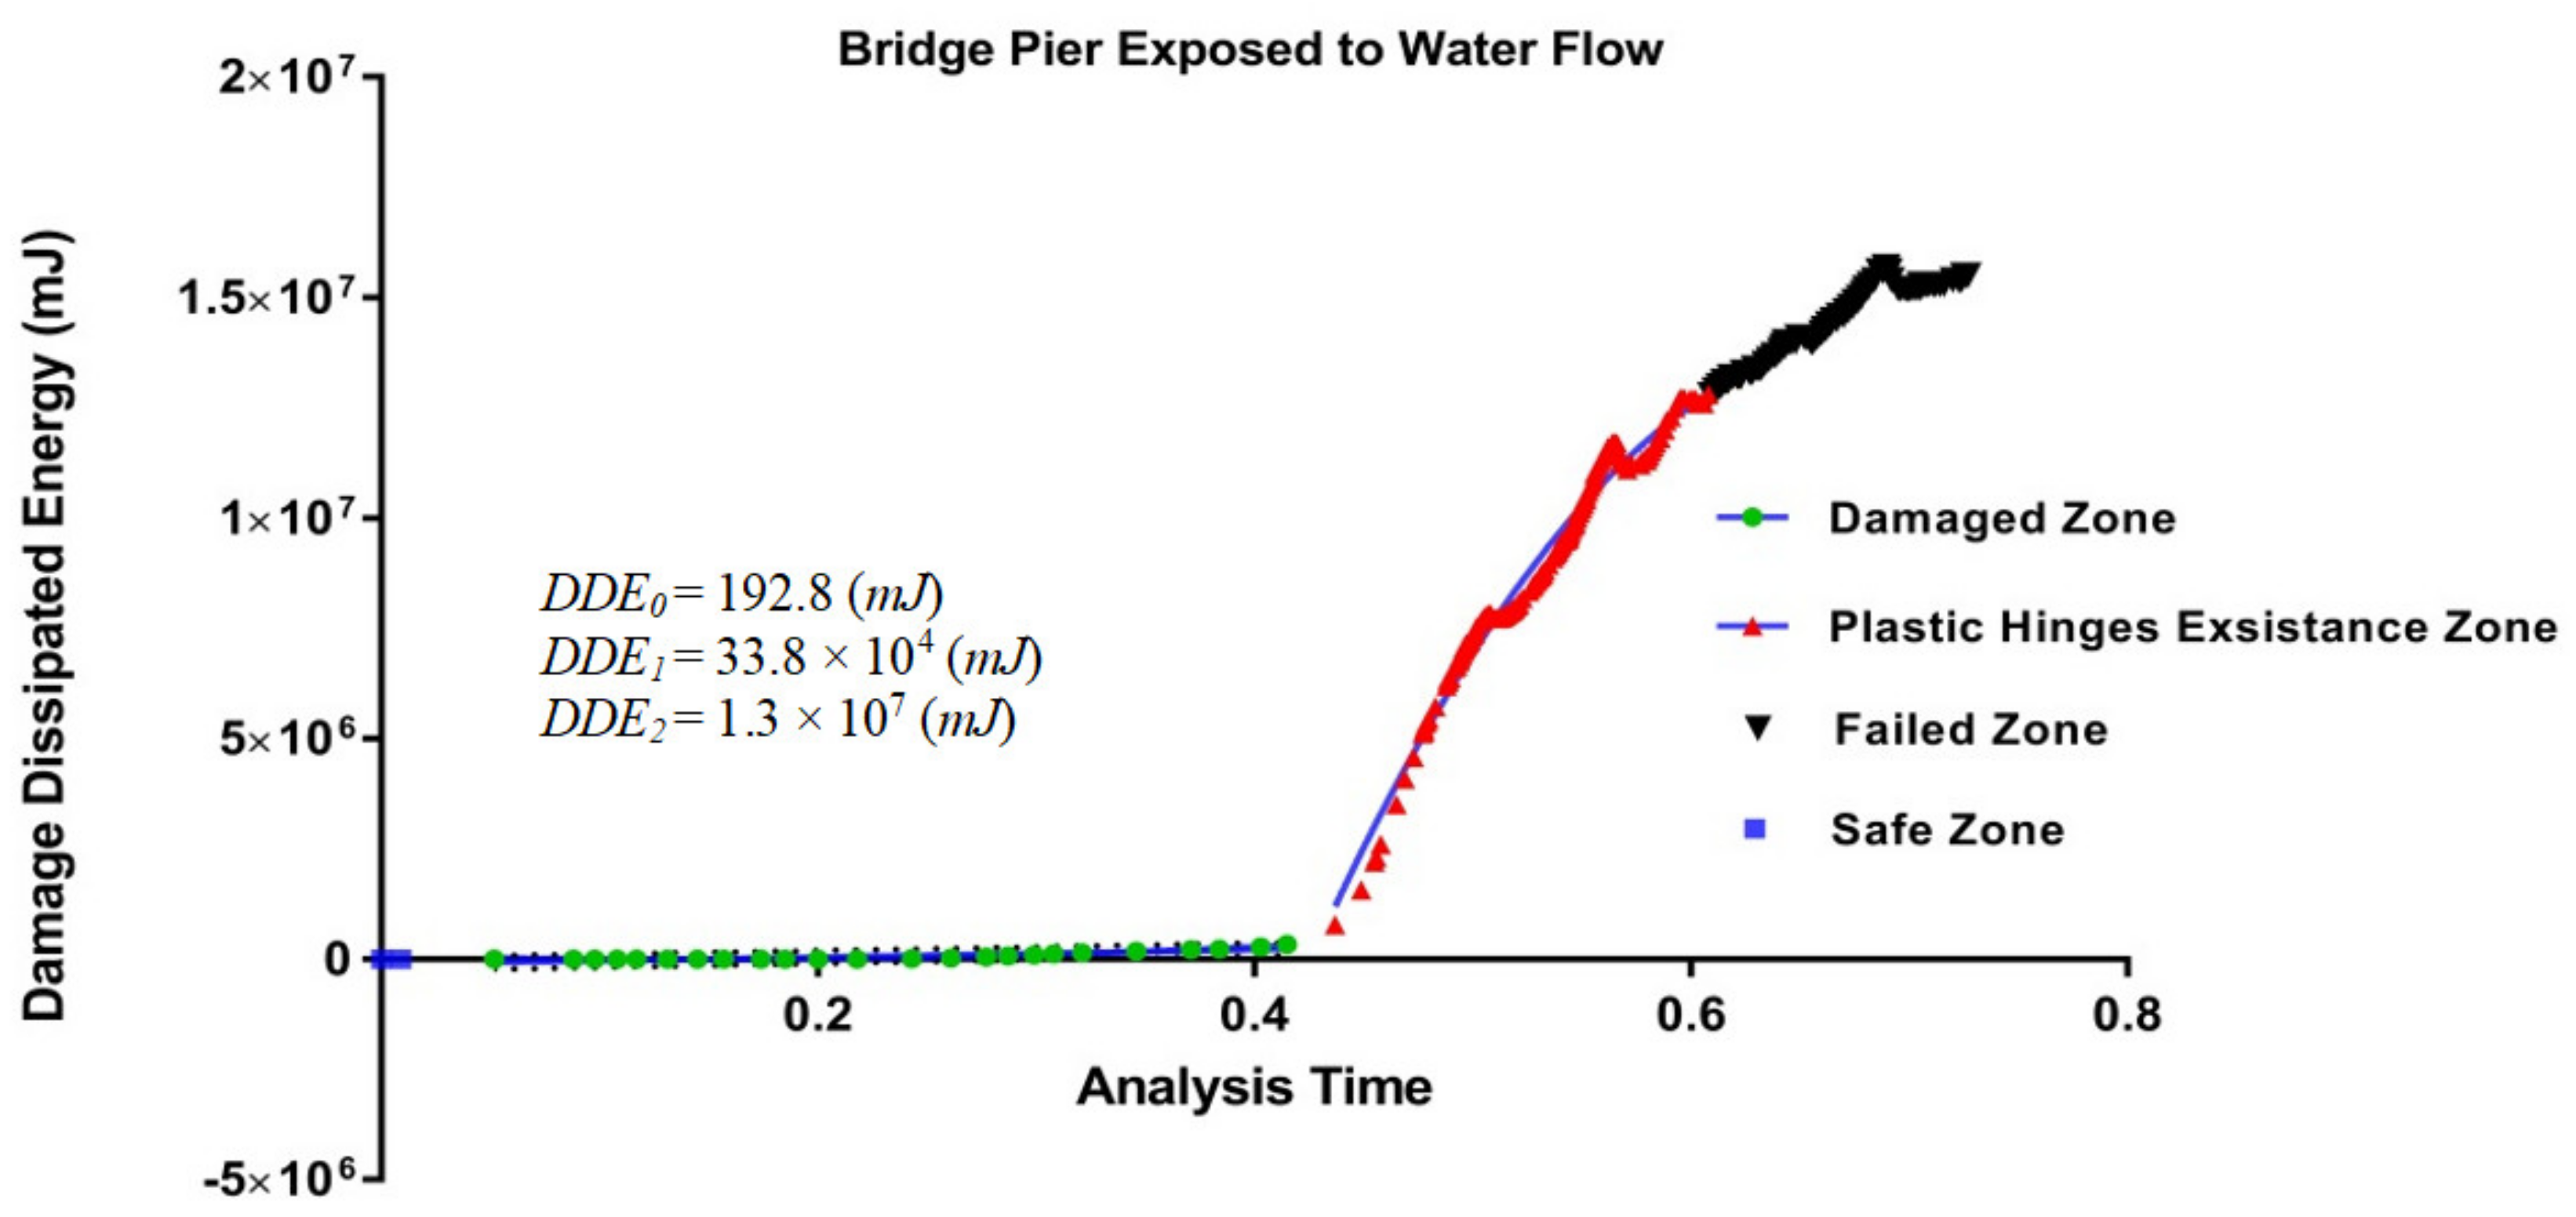
Figure 10 shows the variation of dissipated damage energies (DDE) for the entire model, determined by the area under the load-displacement curve obtained from the ABAQUS output. The DDE values and thresholds for the whole model can be evaluated effectively using ABAQUS results as the entire model’s damage dissipated energy (ALLDMD). By analysing the output, 192 (mJ) energy is consumed to crack formation in the whole structural system. Figure 10 also shows the DDE variation as the water flow pressure increases incrementally. The curve’s trend grows with time, but the amount of energy dissipated before plastic hinges appear steadily increases (see Figure 10 for the second phase of the graph showing the damaged area in green). Following this phase, the energy dissipation develops significantly (see Figure 10 for the third phase of the chart, showing the presence of plastic hinges in red).

Figure 10.
The variation in damage dissipated energy (DDE) for the entire pier model.
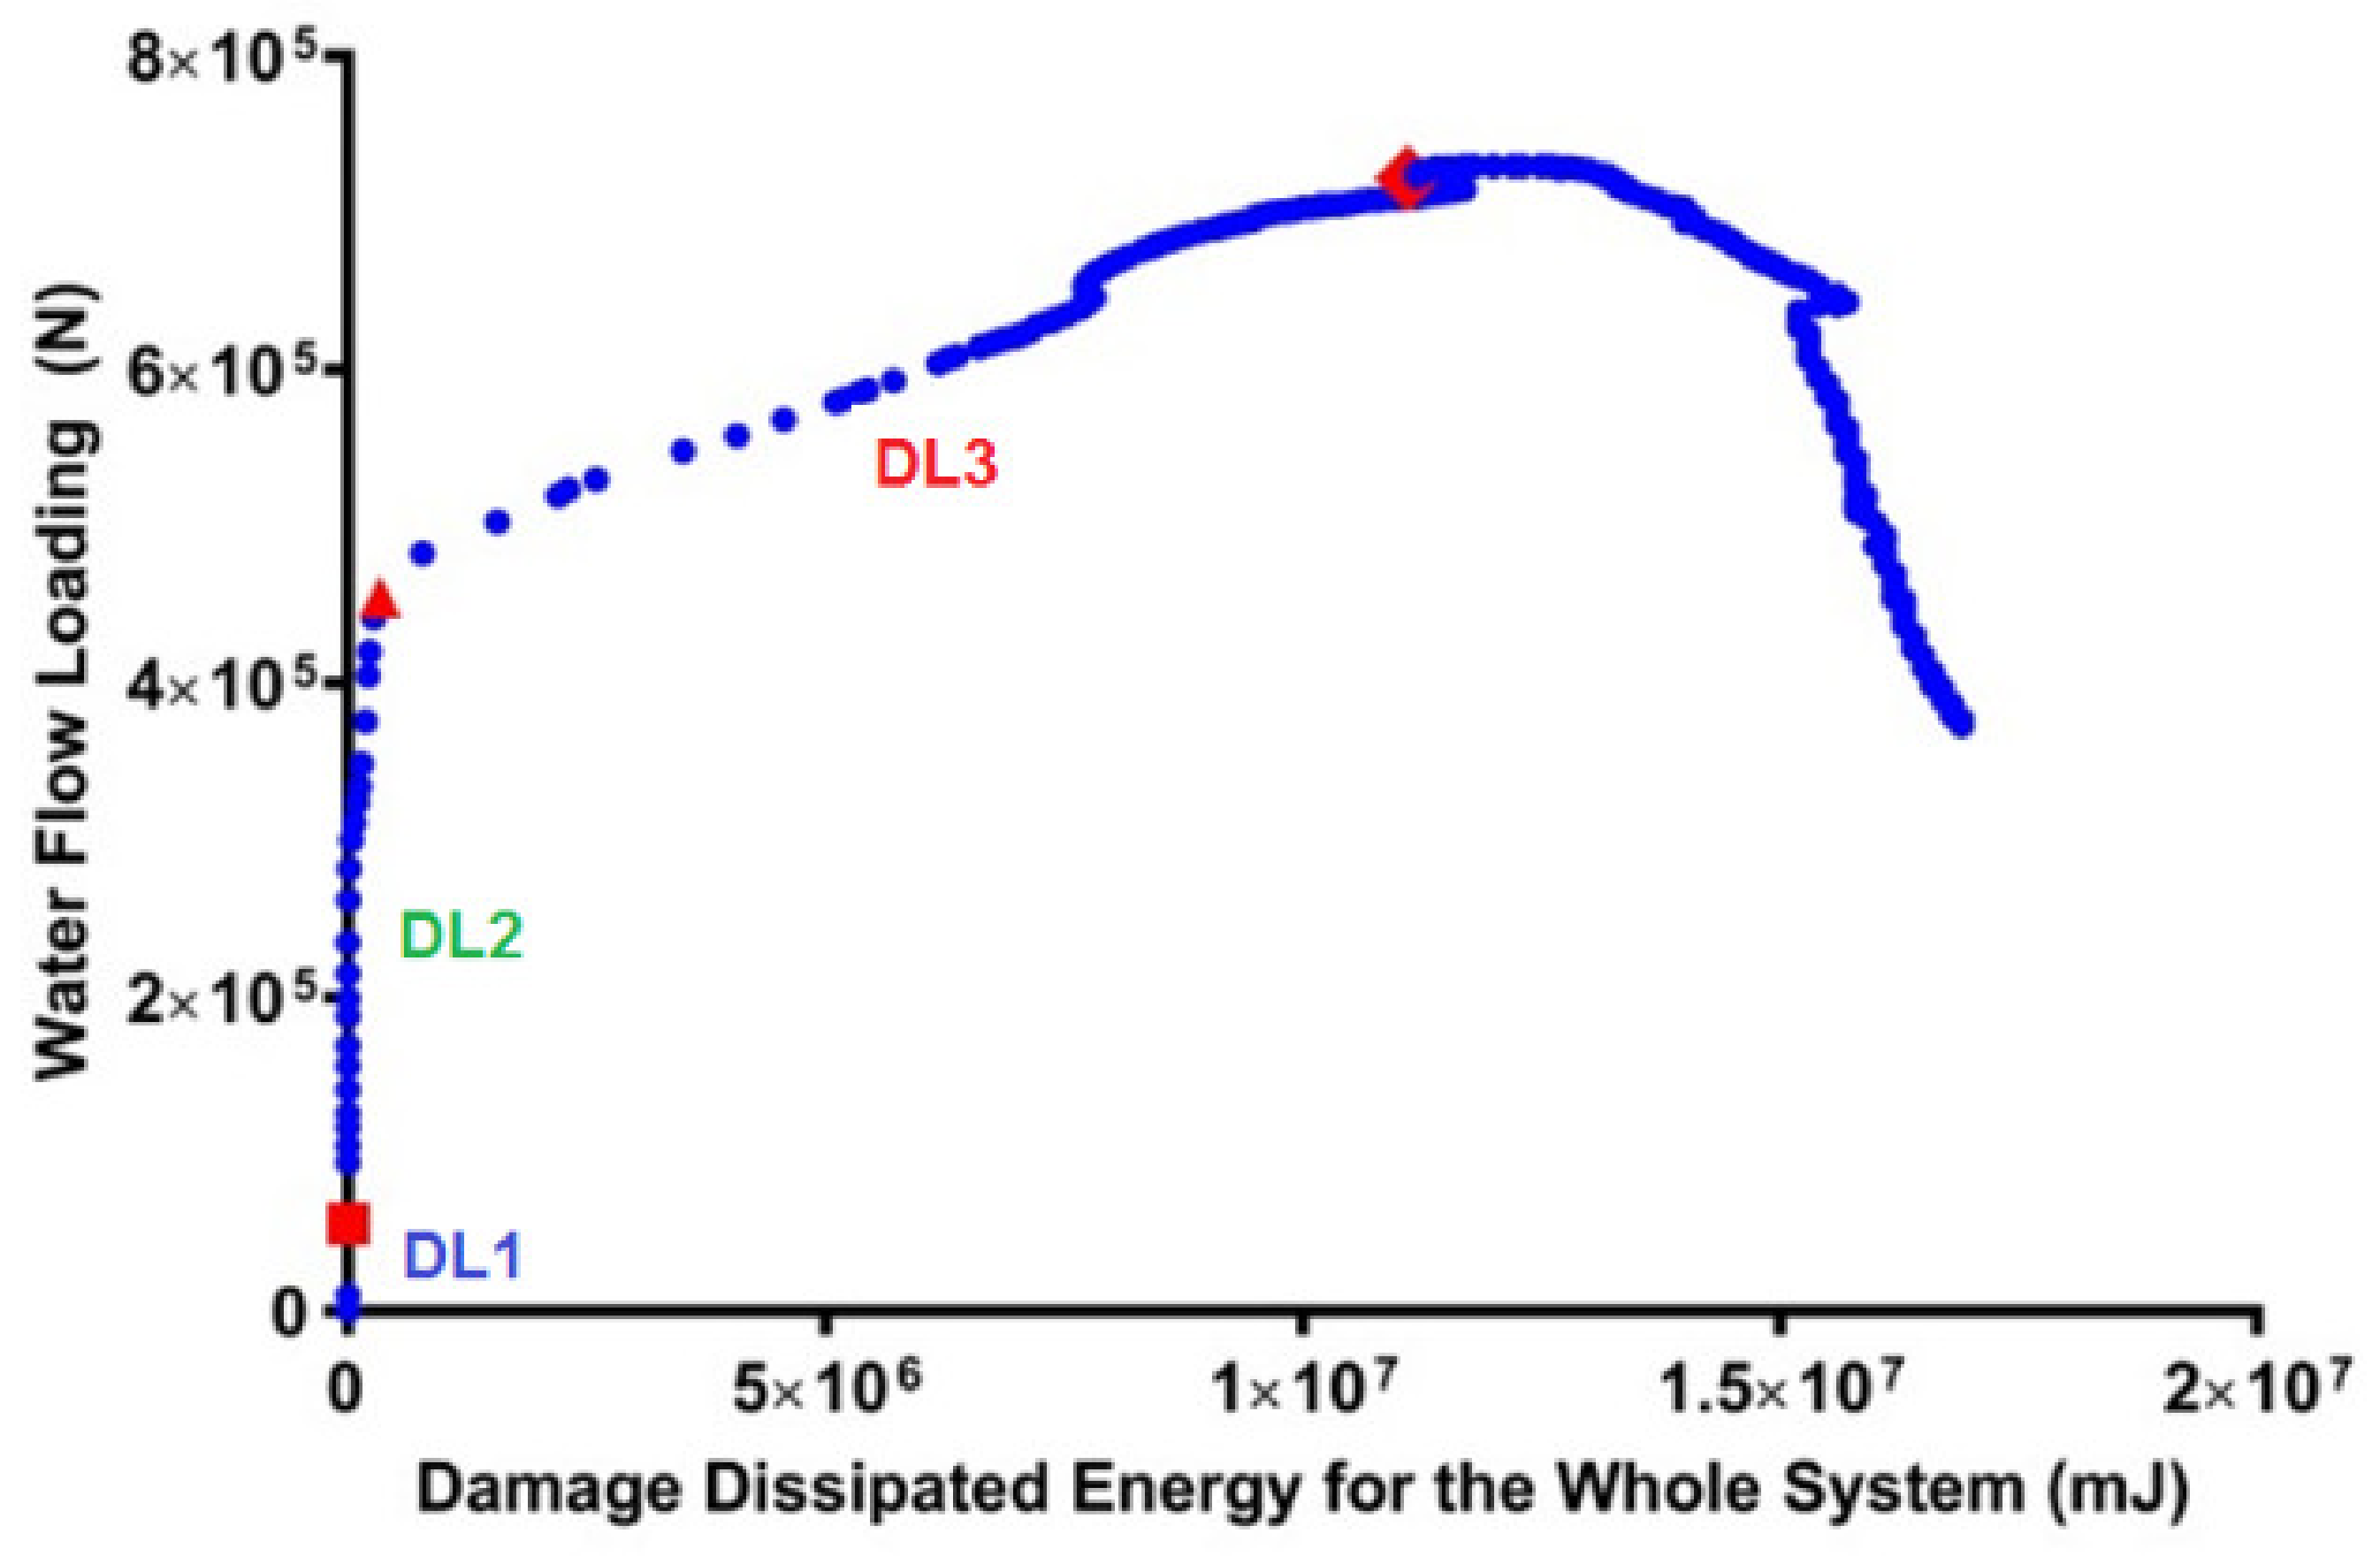
Comparing Figure 7 and Figure 10, an excellent correlation between the deformation and DDE change rate trend is observed during the increase of pressure in water flow. The analysis and plot of the change in dissipated energy versus water flow pressure are shown in Figure 11.

Figure 11.
Variation of the total damage dissipated energy (DDE) using the entire system.
The damage energy dissipation in different damage modes is represented by the DDE outcomes in the whole model. When cracks form in the system, 192.8 mJ of energy is dissipated, and when the plastic hinges are created, the model softens, and 338 mJ of energy is lost. Substantial deflection occurs until the total failure of the structure with a significant softening factor. A complete failure phase (the black area in Figure 10) causes the system to become unstable, reducing structural stiffness. An applicable DI based on the energy outputs can be estimated by analysing the progressive damage observed in Figure 11. The structural response to the increase in load is explained earlier in the first phase; DL1 and DDE are both zero, and the crack has started to grow. Consequently, since the first level’s value is zero, the other two levels of damage are investigated in the energy loss-based approach. The DI variation during the increase in water flow loading is focused on, and an energy loss-based method is contrasted with a deformation-based method.
The turning points in Figure 12 are emphasised, and their damage dissipated energy (DDE) is estimated to calculate DI based on the dissipated energy concept. Then, the energy loss-based DIs described in this paper are calculated with Equation (4):
where is the damage dissipated energy in loading step i and is ultimate damage dissipated energy.
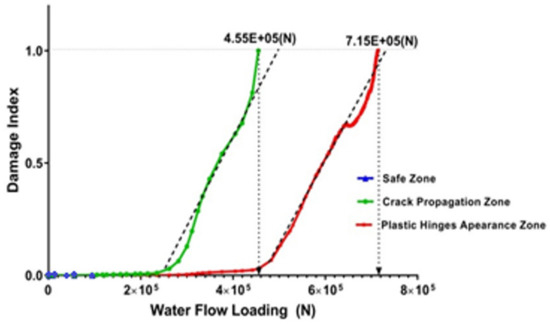
Figure 12.
Variations in the damage index for elastic-plastic and fully plastic damage modes.
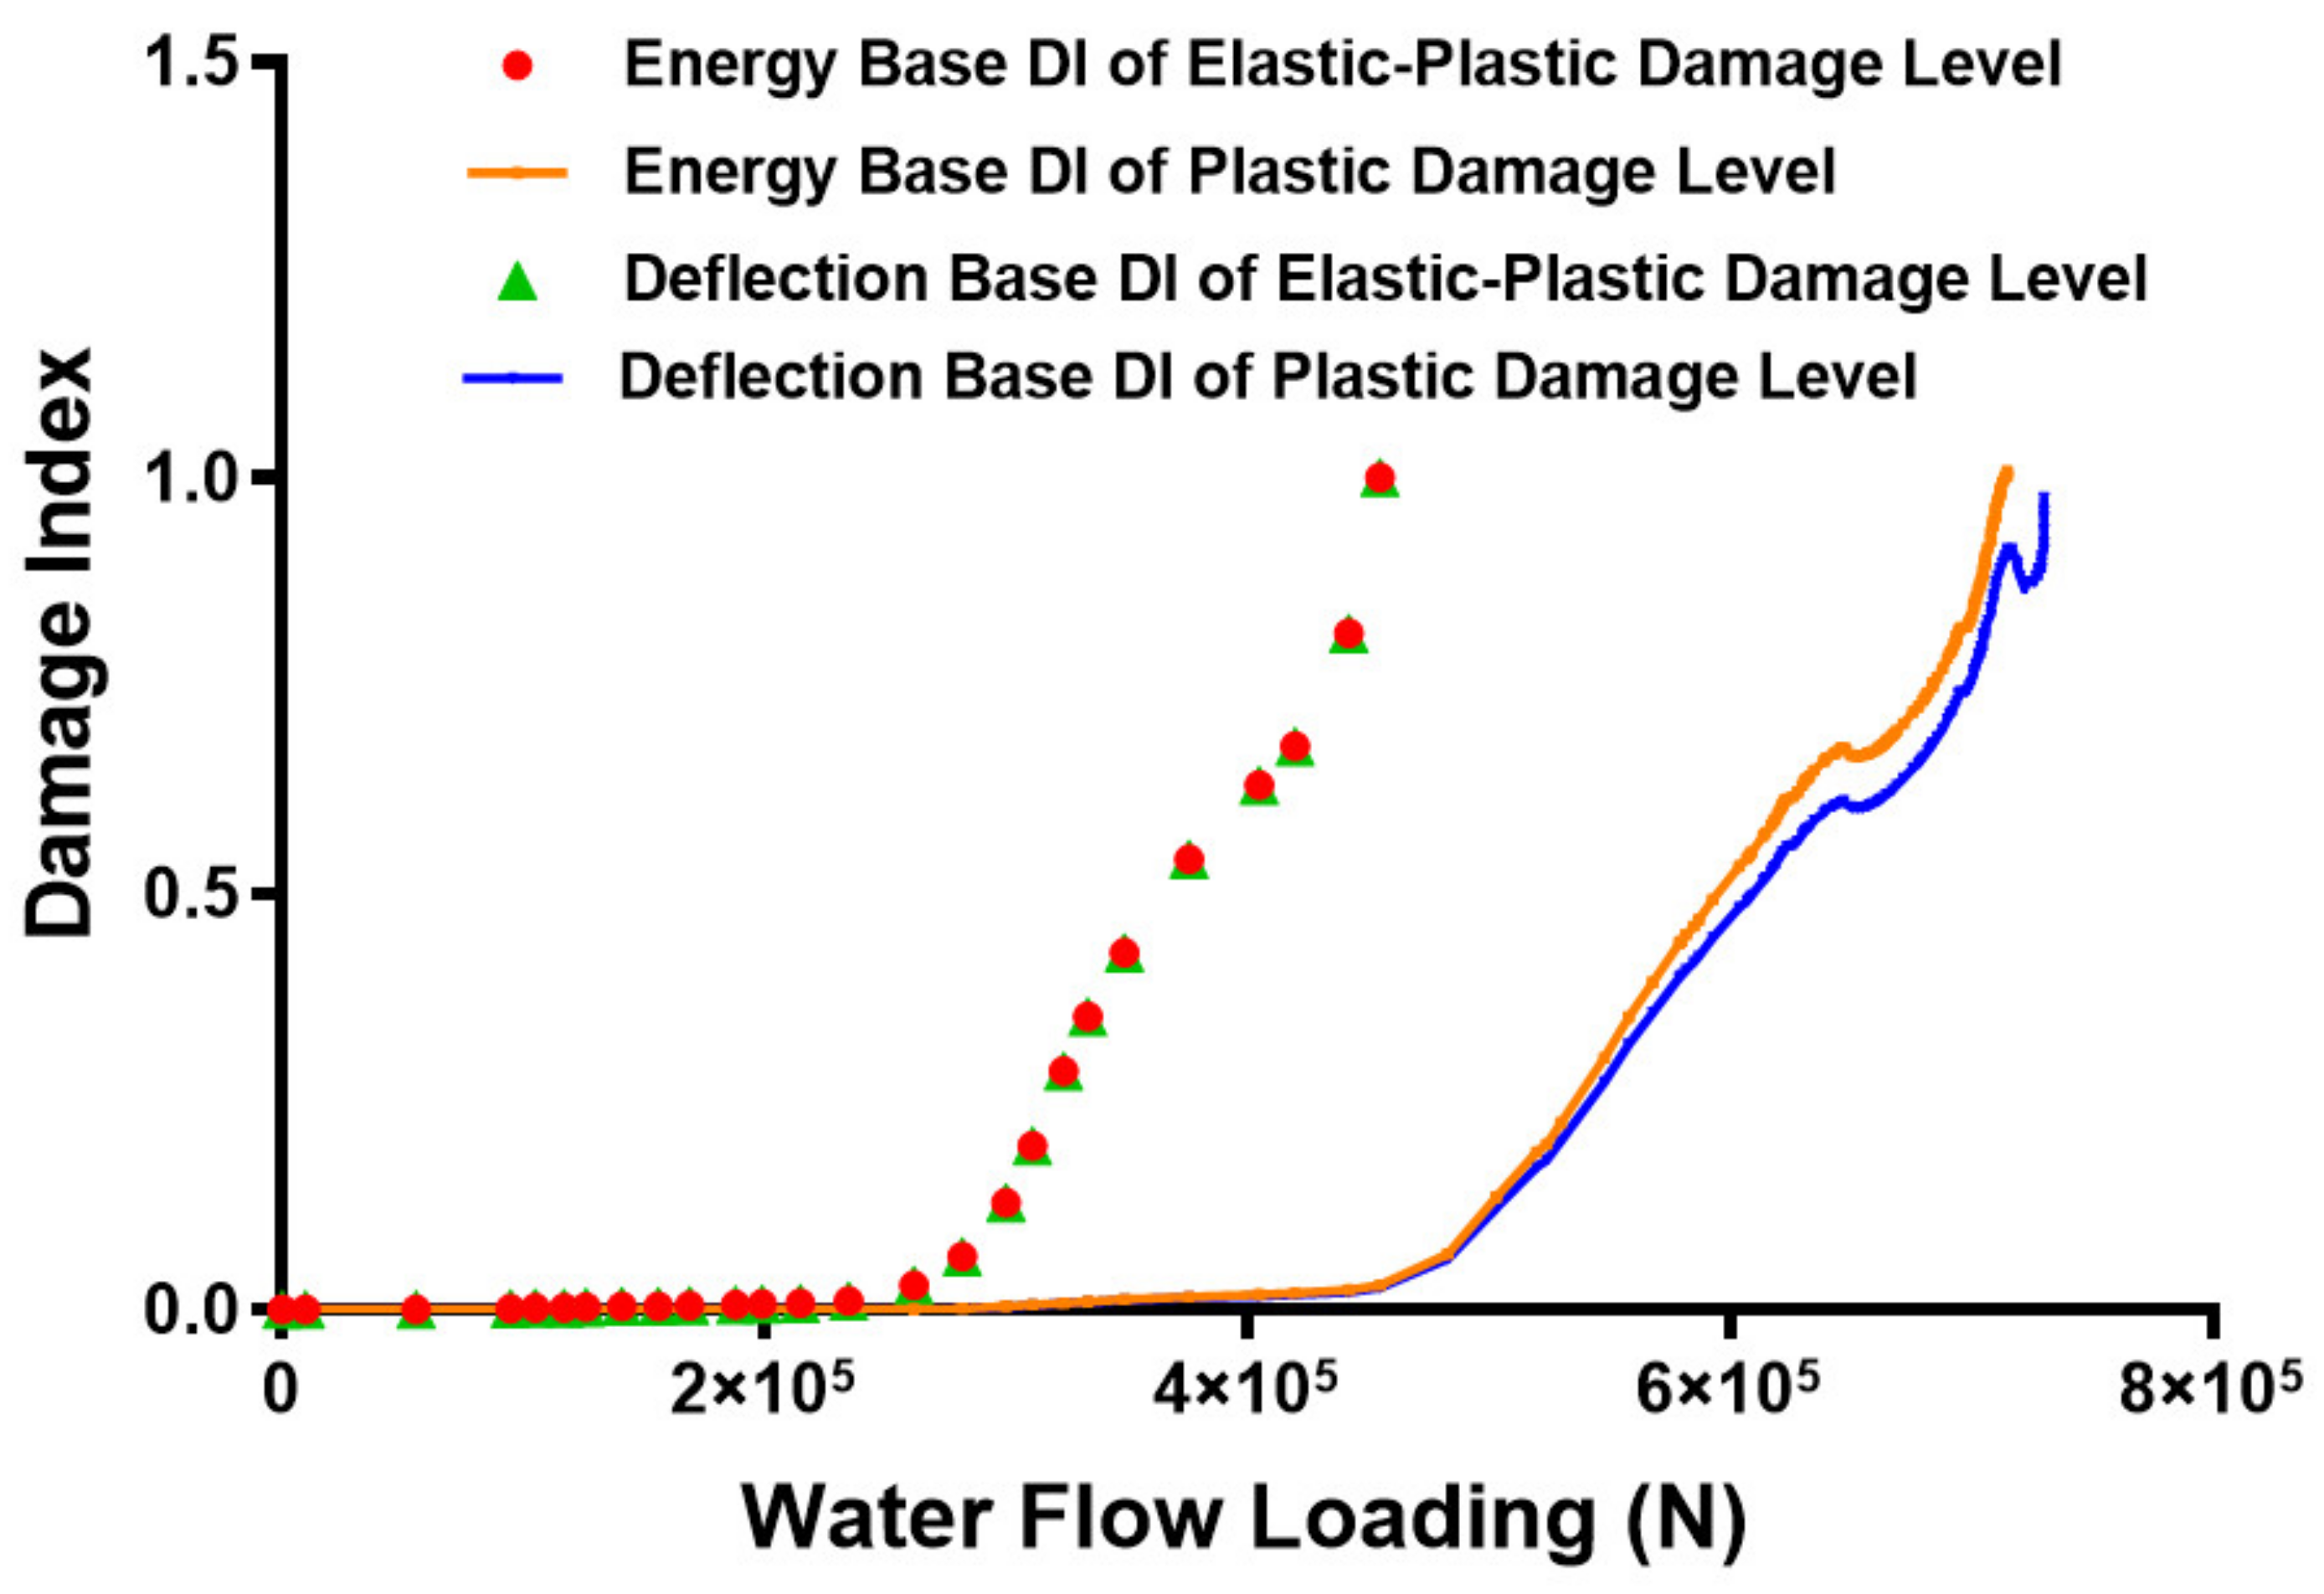
Figure 12 displays the values of the different DLs and shows that increasing the load significantly reduces the damage compared to the displacement-based damage index. The methods described above demonstrate the application of the energy-based damage index, which gives similar results as the displacement-based method.
4.1. Discussion and Comparison of Two Different Concepts of DIs
In this section, the differences between the two methods of damage estimation discussed in this paper are compared for the pier under water-flow pressure. According to the evaluation perception of DIs undertaken by the two different concepts of deflection and DDE, non-linear analysis is conducted for the system under consistent incremental pressure. In order to quantify DIs for every damage level, we use the ultimate deflections and the dissipated energy estimates from the turning points of the discussed curves (see Figure 7, Figure 11 and Figure 12). A quantitative analysis of ABAQUS outputs undertook to determine the DDE parameter for the whole system (ALLDMD parameter).
Figure 13 provides a contrast between both methods for damage value evaluation. It should be emphasised that the safe zone is at the zero-damage level and that it is not discussed here. The DI comparisons indicate they provide similar outputs at lower loading levels, where the structure experiences moderate damage. In contrast, estimated DI values using the energy concept are approximately 6–10% more than those observed using the displacement concept at the plastic damage level. The deflection method captures only the displacement changes for the mid-height of the pier, where it experiences the most critical displacement. Not only does the mid-height of the pier experience large deformations, but also rotational damages occur close to the fixed boundary condition. The results indicated that the assessed damage using the energy concept quantifies the total damage to the structure, including displacement and rotational damage.
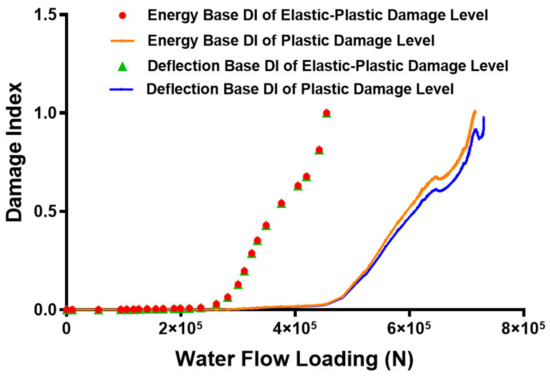
Figure 13.
Comparison of the displacement and energy concepts of the elastic-plastic and fully plastic damage phases.
In contrast, the displacement concept considers only damage to maximum displacement. ABAQUS as a FE tool provides a straightforward and general approach to estimating the whole system’s energy loss and dissipated energy. Therefore, estimation of damage based on the energy concept is applicable.
In this study, the pier was one degree more indeterminate than the pin-pin model. The above results and the observation show that if the structural indeterministic degree increases, the energy concept can be a more reliable tool for assessing the total damages. In other words, it can evaluate the other independent damage concepts, i.e., deflection, rotational, and lateral.
Correspondent Water Current Velocity
To recognise the impact of water flow on the bridge pier, reverse calculations can be performed to assess the effective water flow velocity. Flow loading results can be correlated with the flow velocity. The following equation determines the equivalent static drag load according to AS5100 [32]:
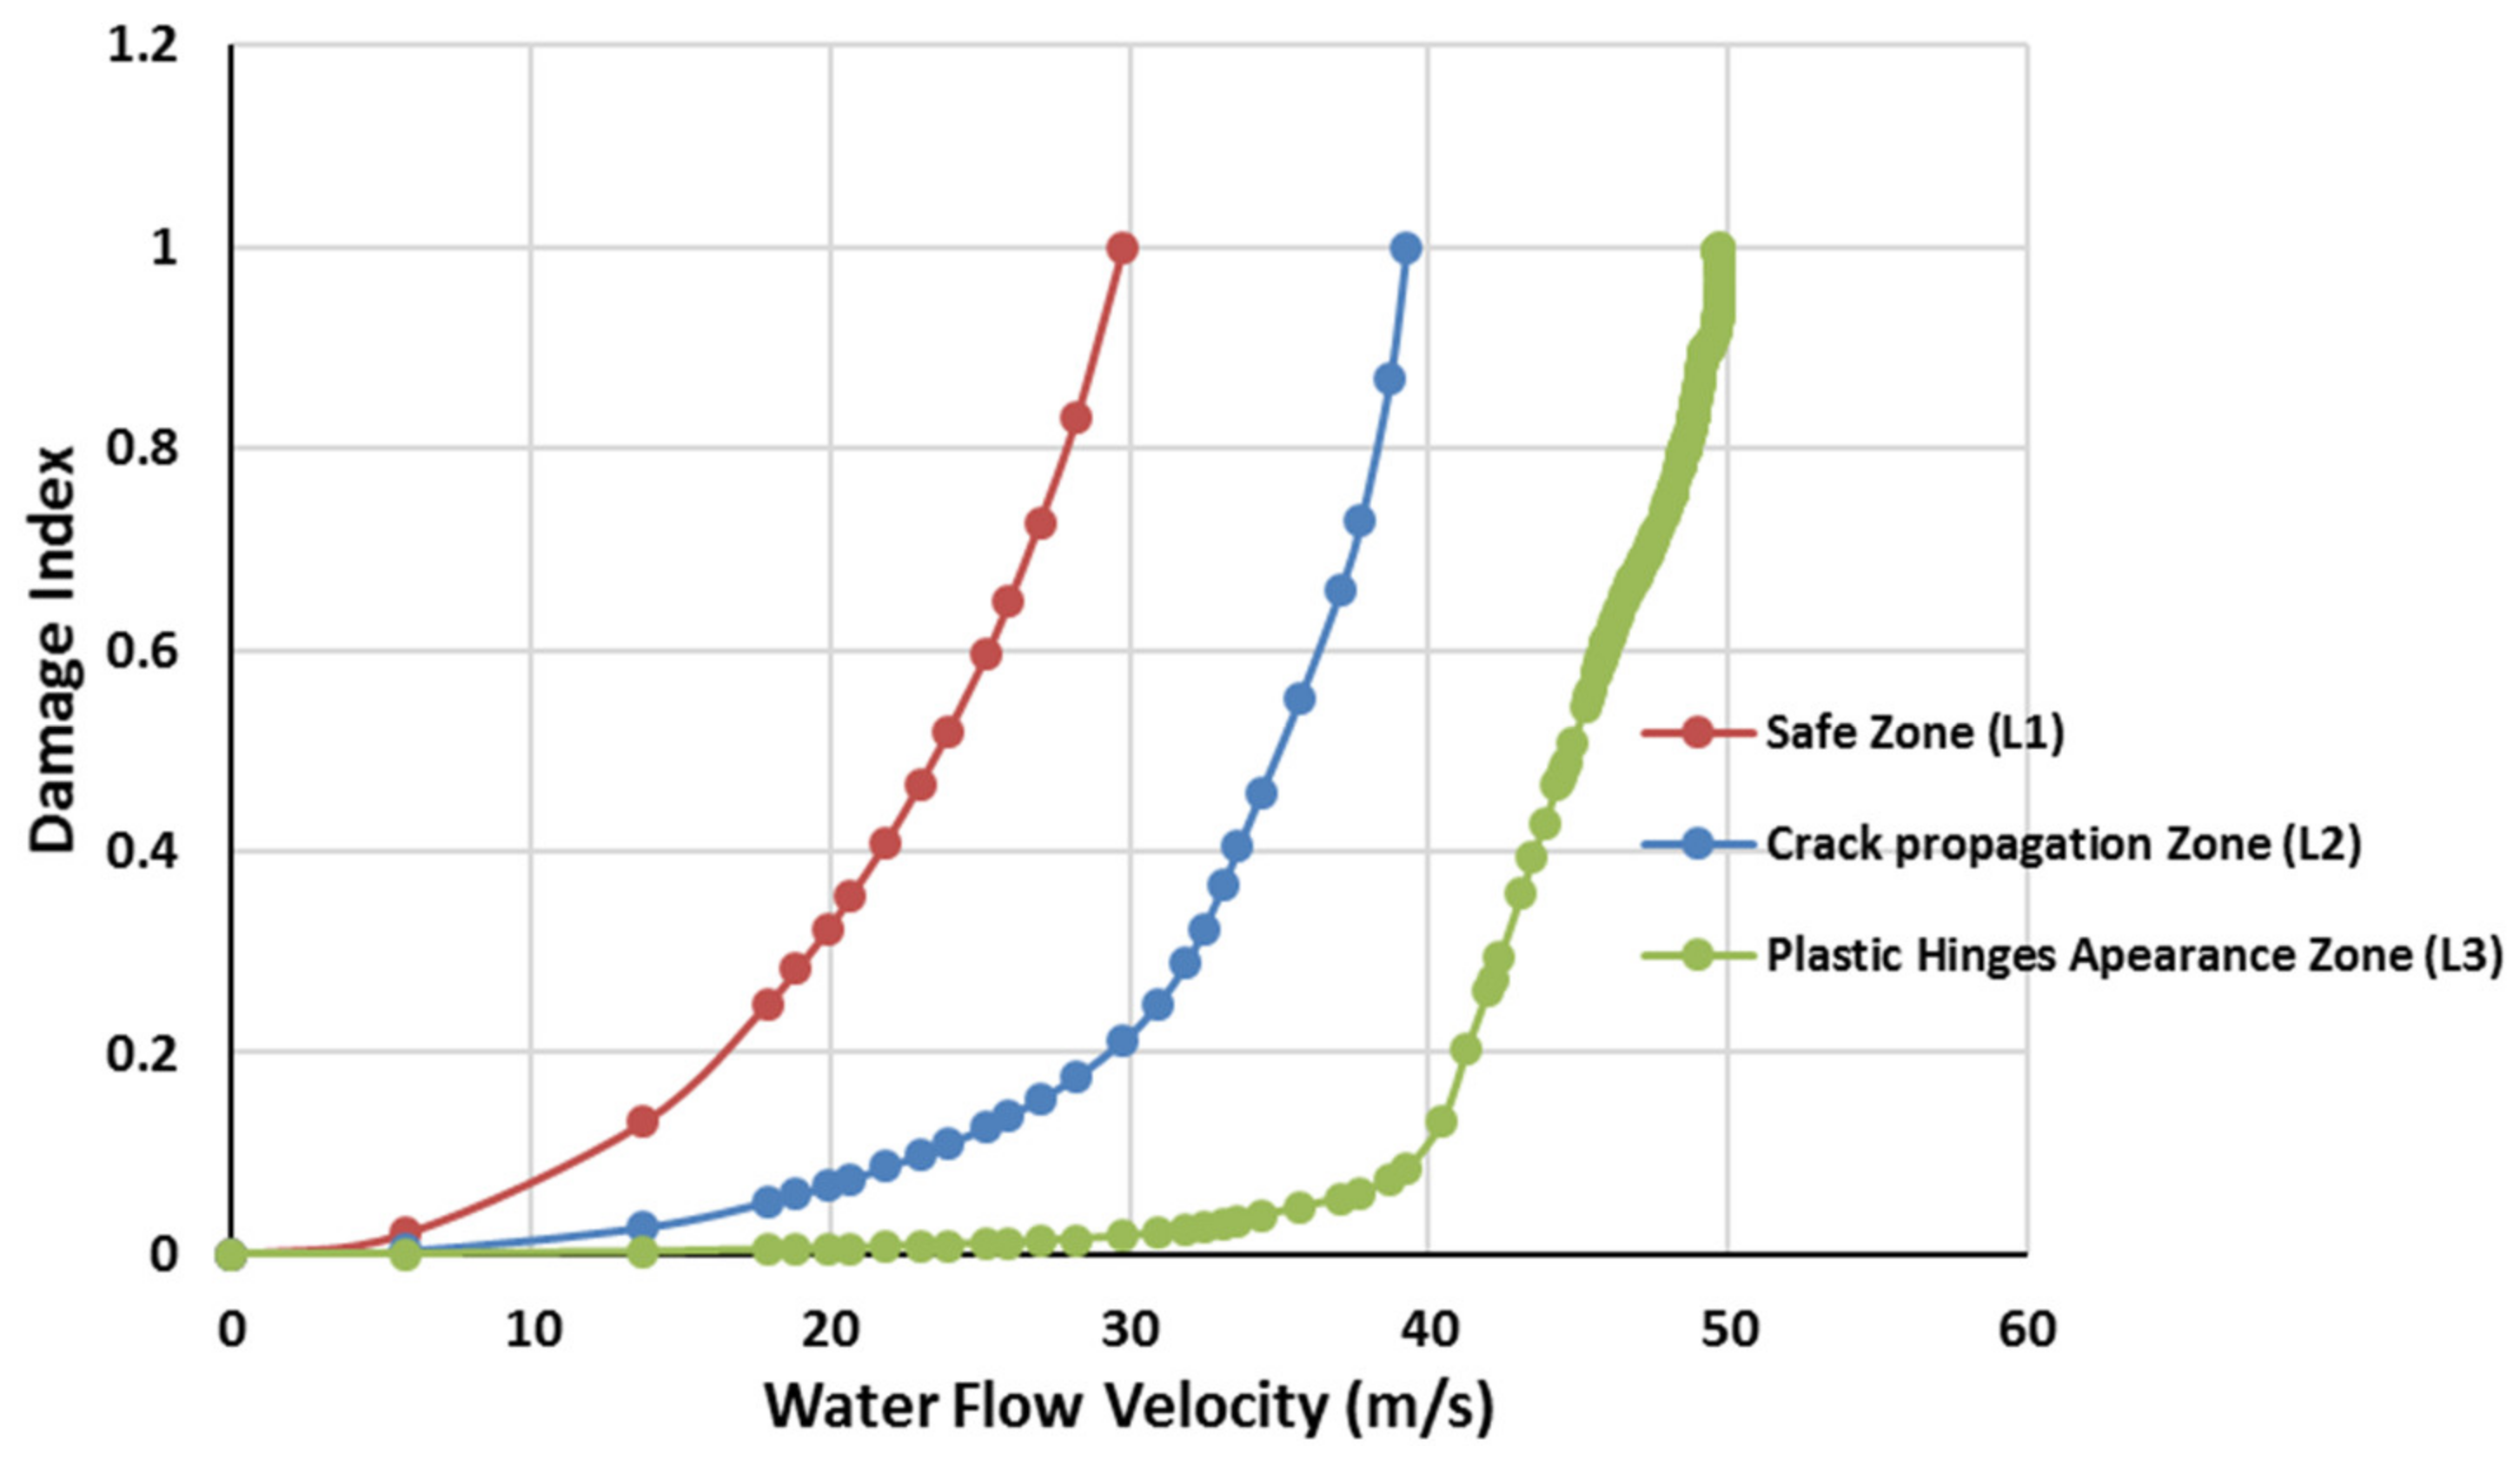
where represents the drag coefficient, depending on the pier shape and flow factors [32,33], and and are the fluid density and velocity, respectively. The surface facing the water flow is represented as ; here, it is a rectangle of 130 × 2700 mm2. The equivalent water flow velocity could be calculated applying Equation (5) based on the analysis and the related calculation. According to the standards’ description, the drag coefficient of the square component is considered, = 1.4 [32]. No damage occurs in the safe zone, DL1, and the structure experiences no cracks. Figure 14 presents the results. An extremely high velocity, more than 30 m/s, is necessary to collapse the pier (as shown in the graphs), which is not practical.
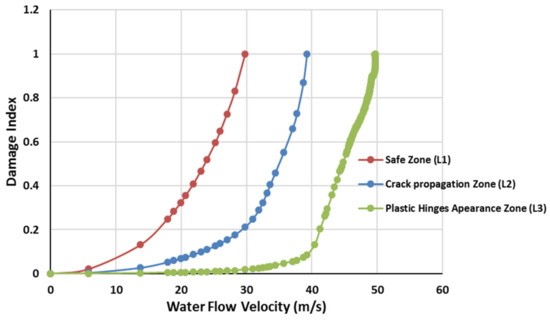
Figure 14.
Damage index changes for numerous damage levels of water flow velocity.
In contrast, the hydrodynamic load will increase if debris is collected incrementally behind the pier during the flood. If the velocity and the vertical area of the flood loading on the surface of the structure increases, Equation (5), the resulting water flow pressure will significantly increase, which can be evaluated using the approach presented in this study. The increase in debris load will eventually result in structural collapse, and damage level 3 will occur.
5. Conclusions
The current study presents the methodologies for assessing the concrete structure under flood and debris loading. A suitable technique for estimating concrete structural damage under ever-increasing static loading applying ABAQUS is built using CDP modelling. The system’s authentication leads to the challenge of assessing different damage evaluation methodologies. An incremental pressure load distributed on the pier’s surface is applied to the structure, assessing damage behaviour at three different levels.
Three discrete levels of damage have been identified in this study. The first is the elastic level. When assessing damage to a structure with high performance, this method should be used (the serviceability limit). In the first level, no surface cracks in the system are anticipated. Limits are calculated based on the structural response to load at this level. A second level is the degree of damage before the appearance of plastic hinges. The structure is expected to exhibit elastic-plastic behaviour at this level, which is the ultimate limit state. Calculations for this level can be made the same way as those for the initial level. Finally, the remaining DL is associated with full structural failure in which it cannot endure any further loading. This section calculates the overall damage sustained by the structure for three separate DLs.
A new energy loss-based method can evaluate the damage to vertical structures, such as bridge piers under lateral, flood, and loading. The displacement-based approach and the new energy loss-based approach have been evaluated by applying a bridge pier case study. Based on the findings, the following conclusions can be drawn. The displacement-based and the energy loss-based DIs’ estimation yield comparable results for moderate damage (second level of damage).
- Increasing the degree of freedom seems to increase the reliability of the energy-based DI for determining the damage of complex structures.
- Deflections of fixed boundary conditions could not be considered, while overall damage dissipation energy considers the deterioration of the whole system.
- Using the finite element analysis results, an energy-based approach provides a superior method because it applies more easily to structural systems.
- Damage detection and estimation depend heavily on the structural boundary conditions and degree of indeterminacy.
Author Contributions
The Supervision, review and funding acquisition, S.S. conceptualisation, methodology, validation, formal analysis, investigation, resources, writing original draft preparation, visualisation M.N. All authors have read and agreed to the published version of the manuscript.
Funding
This research is funded by the Bushfire and Natural Hazard CRC.
Institutional Review Board Statement
Not applicable.
Informed Consent Statement
Not applicable.
Data Availability Statement
Not applicable.
Acknowledgments
This research is supported by RMIT University.
Conflicts of Interest
The authors declare no conflict of interest.
References
- Khan, M.A. Accelerated Bridge Construction: Best Practices and Techniques; Elsevier: Amsterdam, The Netherlands, 2014. [Google Scholar]
- BITRE Australian Bureau of Statistics (ABS). Summary of Industry Performance, Small and Medium Businesses. Available online: https://treasury.gov.au/sites/default/files/2019-03 (accessed on 7 May 2022).
- Melbourne Water. Flood Management Strategy Port Phillip and Westernport 2021–2031. 2015. Available online: https://www.melbournewater.com.au/about/strategies-and-reports/flood-management-strategy-port-phillip-and-westernport-2021-2031 (accessed on 7 May 2022).
- US Department of Transport. US Department of Transport Manual; US Department of Transport: Washington, DC, USA, 2010.
- Nasim, M.; Setunge, S.; Zhou, S.; Mohseni, H. An investigation of water-flow pressure distribution on bridge piers under flood loading. Struct. Infrastruct. Eng. 2019, 15, 219–229. [Google Scholar] [CrossRef]
- Farrar, C.R.; Worden, K. An introduction to structural health monitoring. Philos. Trans. R. Soc. A Math. Phys. Eng. Sci. 2007, 365, 303–315. [Google Scholar] [CrossRef] [PubMed]
- Hamad, W.; Owen, J.; Hussein, M. Modelling the degradation of vibration characteristics of reinforced concrete beams due to flexural damage. Struct. Control Health Monit. 2015, 22, 939–967. [Google Scholar] [CrossRef]
- Ulfkjær, J.P.; Krenk, S.; Brincker, R. Analytical model for fictitious crack propagation in concrete beams. J. Eng. Mech. 1995, 121, 7–15. [Google Scholar] [CrossRef] [Green Version]
- Neild, S.; Williams, M.; Mcfadden, P. Nonlinear vibration characteristics of damaged concrete beams. J. Struct. Eng. 2003, 129, 260–268. [Google Scholar] [CrossRef]
- Alsina, C.; Guadarrama, S.; Renedo, E.; Trillas, E. Numerical simulation of R.C. frame testing with damaged plasticity model. Comparison with simplified models. In Proceedings of the Second European Conference on Earthquake Engineering and Seismology, Istanbul, Turkey, 25–29 August 2014. [Google Scholar]
- Rabczuk, T.; Zi, G.; Bordas, S.; Nguyen-Xuan, H. A simple and robust three-dimensional cracking-particle method without enrichment. Comput. Methods Appl. Mech. Eng. 2010, 199, 2437–2455. [Google Scholar] [CrossRef]
- Rabczuk, T.; Belytschko, T. A three-dimensional large deformation meshfree method for arbitrary evolving cracks. Comput. Methods Appl. Mech. Eng. 2007, 196, 2777–2799. [Google Scholar] [CrossRef] [Green Version]
- Bazant, Z.P.; Cedolin, L. Blunt crack band propagation in finite element analysis. ASCE J. Eng. Mech. Div. 1979, 105, 297–315. [Google Scholar] [CrossRef]
- Rashid, Y. Ultimate strength analysis of prestressed concrete pressure vessels. Nucl. Eng. Des. 1968, 7, 334–344. [Google Scholar] [CrossRef]
- Jirasek, M. Modeling of Fracture and Damage in Quasibrittle Materials. Ph.D. Thesis, Northwestern University, Evanston, IL, USA, 1993. [Google Scholar]
- Hillerborg, A.; Modéer, M.; Petersson, P.-E. Analysis of crack formation and crack growth in concrete by means of fracture mechanics and finite elements. Cem. Concr. Res. 1976, 6, 773–781. [Google Scholar] [CrossRef]
- Dassault Systems. 6.14 Analysis User’s Guide, Theory Manuals Volume 2: Analysis; Dassault Systems: Vélizy-Villacoublay, France, 2013. [Google Scholar]
- Rabczuk, T.; Akkermann, J.; Eibl, J. A numerical model for reinforced concrete structures. Int. J. Solids Struct. 2005, 42, 1327–1354. [Google Scholar] [CrossRef]
- Park, Y.-J.; Ang, A.H.-S. Mechanistic Seismic Damage Model for Reinforced Concrete. J. Struct. Eng. 1985, 111, 722–739. [Google Scholar] [CrossRef]
- Dassault Systems. Solidworks Help: Theory of Cumulative Damage; Dassault Systems: Vélizy-Villacoublay, France, 2012. [Google Scholar]
- Roufaiel, M.S.L.; Meyer, C. Reliability of Concrete Frames Damaged by Earthquakes. J. Struct. Eng. 1987, 113, 445–457. [Google Scholar] [CrossRef]
- Ghobarah, A.; Abou-Elfath, H.; Biddah, A. Response-based damage assessment of structures. Earthq. Eng. Struct. Dyn. 1999, 28, 79–104. [Google Scholar] [CrossRef]
- Massumi, A.; Moshtagh, E. A new damage index for RC buildings based on variations of nonlinear fundamental period. Struct. Des. Tall Spec. Build. 2013, 22, 50–61. [Google Scholar] [CrossRef]
- Stephens, J.E.; Yao, J.T.P. Damage Assessment Using Response Measurements. J. Struct. Eng. 1987, 113, 787–801. [Google Scholar] [CrossRef]
- Cao, V.V.; Ronagh, H.R.; Ashraf, M.; Baji, H. A new damage index for reinforced concrete structures. Earthq. Struct. 2014, 6, 581–609. [Google Scholar] [CrossRef]
- Nasim, M. Damage Modelling of Reinforced Concrete Bridge Piers under Flood and Log Impact. Ph.D. Thesis, RMIT University, Melbourne, VIC, Australia, 2019. [Google Scholar]
- Hamad, W.I.; Owen, J.S.; Hussein, M.F. A flexural crack model for damage detection in reinforced concrete structures. J. Phys. Conf. Ser. 2011, 305, 012037. [Google Scholar] [CrossRef]
- Hanif, M.U.; Ibrahim, Z.; Jameel, M.; Ghaedi, K.; Aslam, M. A new approach to estimate damage in concrete beams using non-linearity. Constr. Build. Mater. 2016, 124, 1081–1089. [Google Scholar] [CrossRef]
- Rabczuk, T.; Belytschko, T. Application of particle methods to static fracture of reinforced concrete structures. Int. J. Fract. 2006, 137, 19–49. [Google Scholar] [CrossRef] [Green Version]
- Rabczuk, T.; Zi, G.; Bordas, S.; Nguyen-Xuan, H. A geometrically nonlinear three-dimensional cohesive crack method for reinforced concrete structures. Eng. Fract. Mech. 2008, 75, 4740–4758. [Google Scholar] [CrossRef]
- Park, Y.-J. Seismic Damage Analysis and Damage-Limiting Design for R/C Structures (Earthquake, Building, Reliability, Design; University of Illinois Urbana-Champaign: Champaign, IL, USA, 1985. [Google Scholar]
- AS 5100.2:2017; Australian Standard, Bridge Design, Part 2. Austroads: Sydney, NSW, Australia, 2017.
- Chen, H.P. Structural Health Monitoring of Large Civil Engineering Structures; John Wiley & Sons: Hoboken, NJ, USA, 2018; ISBN 978-1-119-16643-6. [Google Scholar]


Publisher’s Note: MDPI stays neutral with regard to jurisdictional claims in published maps and institutional affiliations. |
© 2022 by the authors. Licensee MDPI, Basel, Switzerland. This article is an open access article distributed under the terms and conditions of the Creative Commons Attribution (CC BY) license (https://creativecommons.org/licenses/by/4.0/).