Article

CFD-FEM Analysis of Flow-Induced Vibrations in Waterjet Propulsion Unit

1
Science and Technology on Water Jet Propulsion Laboratory, Shanghai 200011, China
2
Marine Design and Research Institute of China, Shanghai 200011, China
*
Author to whom correspondence should be addressed.
J. Mar. Sci. Eng. 2022, 10(8), 1032; https://doi.org/10.3390/jmse10081032
Submission received: 20 June 2022 / Revised: 16 July 2022 / Accepted: 24 July 2022 / Published: 27 July 2022
(This article belongs to the Special Issue Hydrodynamic Analysis on Ship Performance)

Abstract

:
This paper investigates the problem of vibration in an axial flow waterjet propeller with high power density and low specific speed. Based on fluid–structure coupling vibration analysis, combined with modal analysis and ship tests, the unsteady fluid–structure coupling of a waterjet propeller is examined, and the vibration characteristics of the propeller under different speed conditions are studied. The results show that the vibrations of the waterjet propeller mainly come from the frequency response of the rotor and the structural resonance response. The frequency distribution characteristics and amplitude intensity are observed to increase with increasing rotation speed. The variations in the propeller vibration characteristics, with respect to parameter changes, are analyzed at different gap spacings between the rotor and stator, allowing the variation law of vibration intensity with rotor stator spacing to be obtained.

1. Introduction

In recent decades, international trade increased significantly and the quantity of merchant ships rose as a consequence. The rapid development of human activities is also leading to advances in marine engineering facilities, offshore fast ferries, and fishing boats. Indeed, human activities led to widespread changes in the marine environment. Many ships are driven by a propeller. Under the excitation of the fluctuating surface pressure, the propeller’s rotating blade produces structural vibrations and flow noise, and generates strong acoustic radiation through the shaft and stator. This noise created by ships affects marine organisms and destroys the marine environment [1].
The adverse effects of shipping noise on marine mammals raised concern in the 1970s, when the overlap between the main frequencies used by large baleen whales and the dominant components of noise from ships was noted [2]. Fish are also disturbed by the noise emitted from ships [3]. As well as commercial ship traffic, the numbers of small boats are increasing around the world. For example, the number of registered recreational vessels in the United States increased by 1% per annum between 1980 and 2017 [4]. The noise from small boats peaks at higher frequencies [5], at which coastal odontocetes are more sensitive.
Waterjet thrusters absorb water from the bottom of the ship, pushing the vessel through the momentum difference between the inlet and outlet flow created by the rotating waterjet pump. This changes the direction of the water flow through the steering reversal mechanism, thus controlling the ship’s cruising direction [6]. Waterjet pumps are widely applied in high-speed ferries due to their strong propulsive efficiency, reduced vibrations, and good maneuverability [7].
The importance of waterjet pumps to marine engineering applications led to extensive studies of their performance characteristics and internal flow features in recent decades [8]. However, our understanding of unsteady fluid excitation and the resulting structural vibrations in a waterjet propulsion system remains inadequate. Unsteady vibrations are produced when the waterjet propeller is operating. Excessive fluid vibration during the operation of the waterjet not only affects the stable operation of other equipment but also harms the physical and mental health of people in the vicinity of the equipment.
Fluid–structure coupling calculations are often used to solve the load and response problems of engineering structures in the flow field [9]. Many scholars studied the external load and structural dynamic characteristics of rotating fluid machinery under vibration excitations using the fluid–structure coupling method of computational fluid dynamics with the finite element method (CFD-FEM) [10]. The objective of this work is to study the unsteady flow characteristics of a waterjet propulsion system at cruising speeds, with the emphasis on the pressure fluctuations and unsteady forces. The fluid-induced vibrations are then studied through the unsteady fluid excitation in the waterjet propulsion unit.

2. Numerical Calculation Modeuel and Strategy

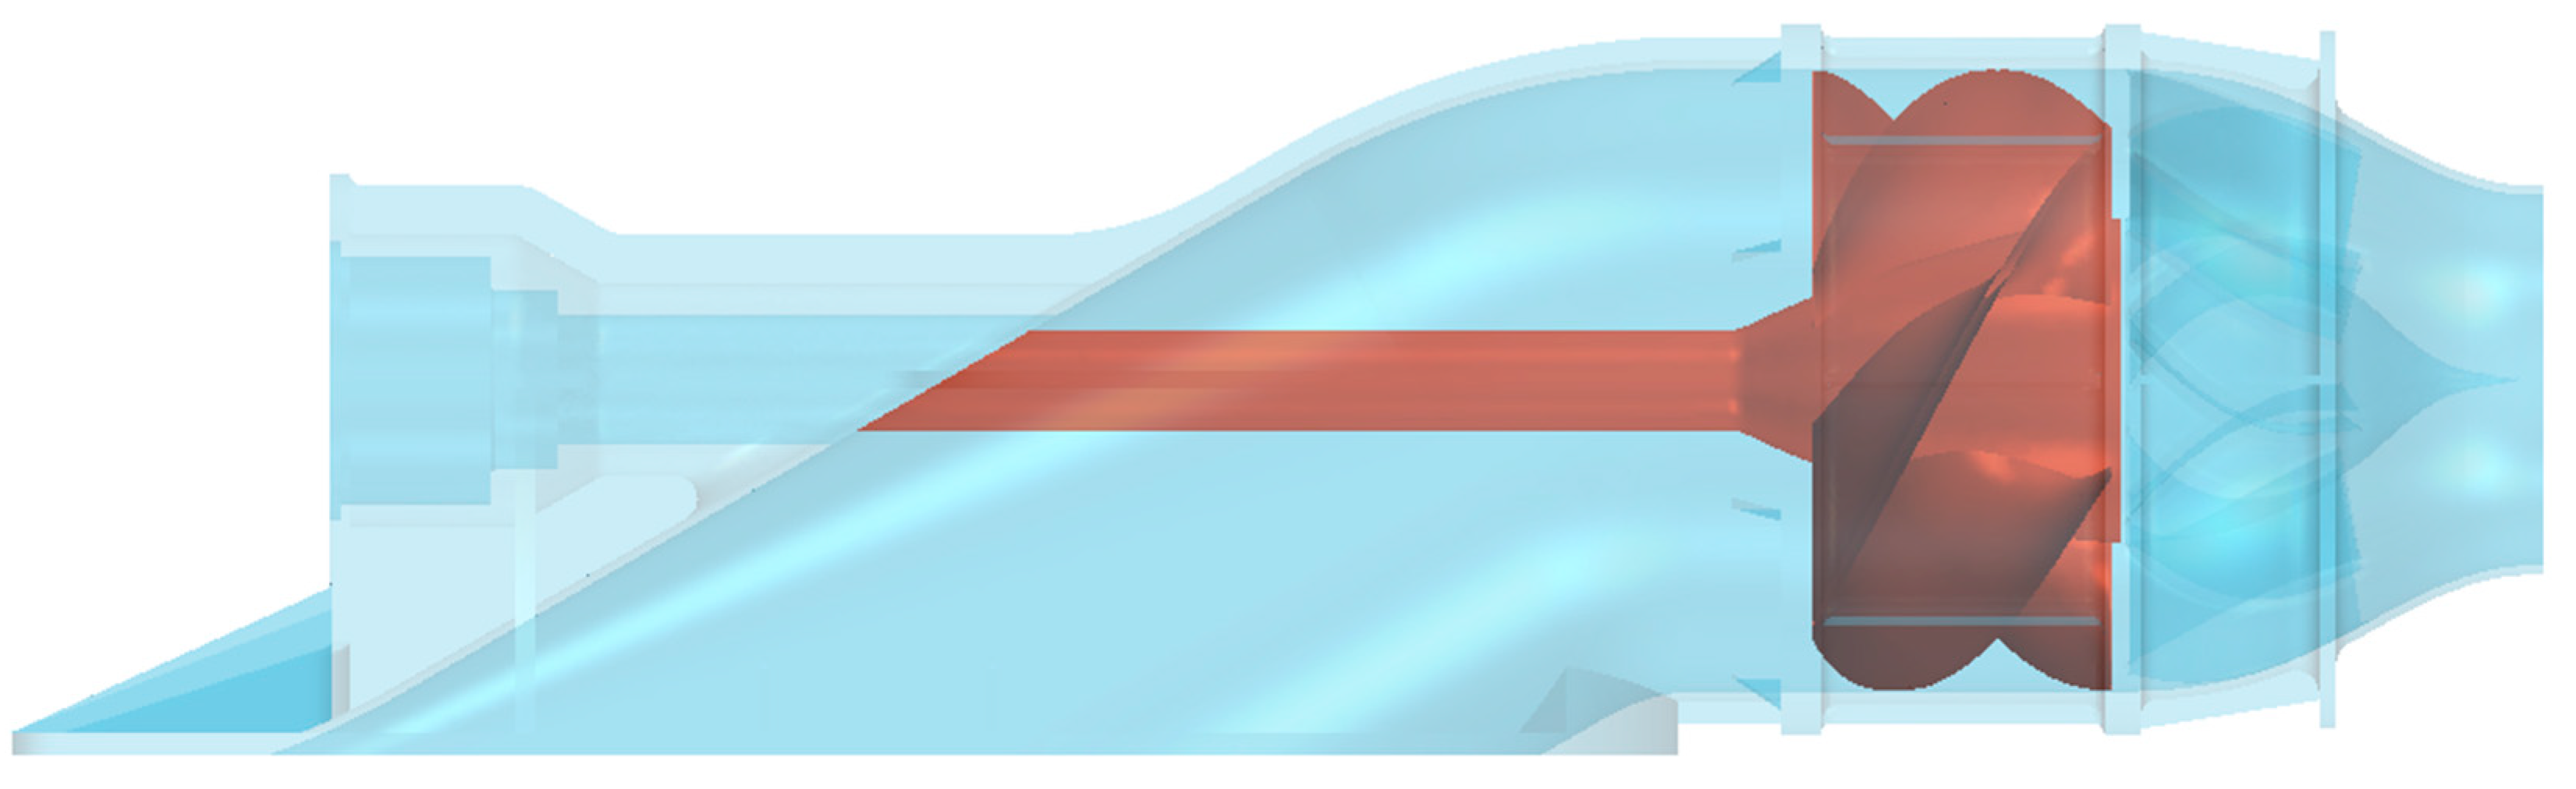
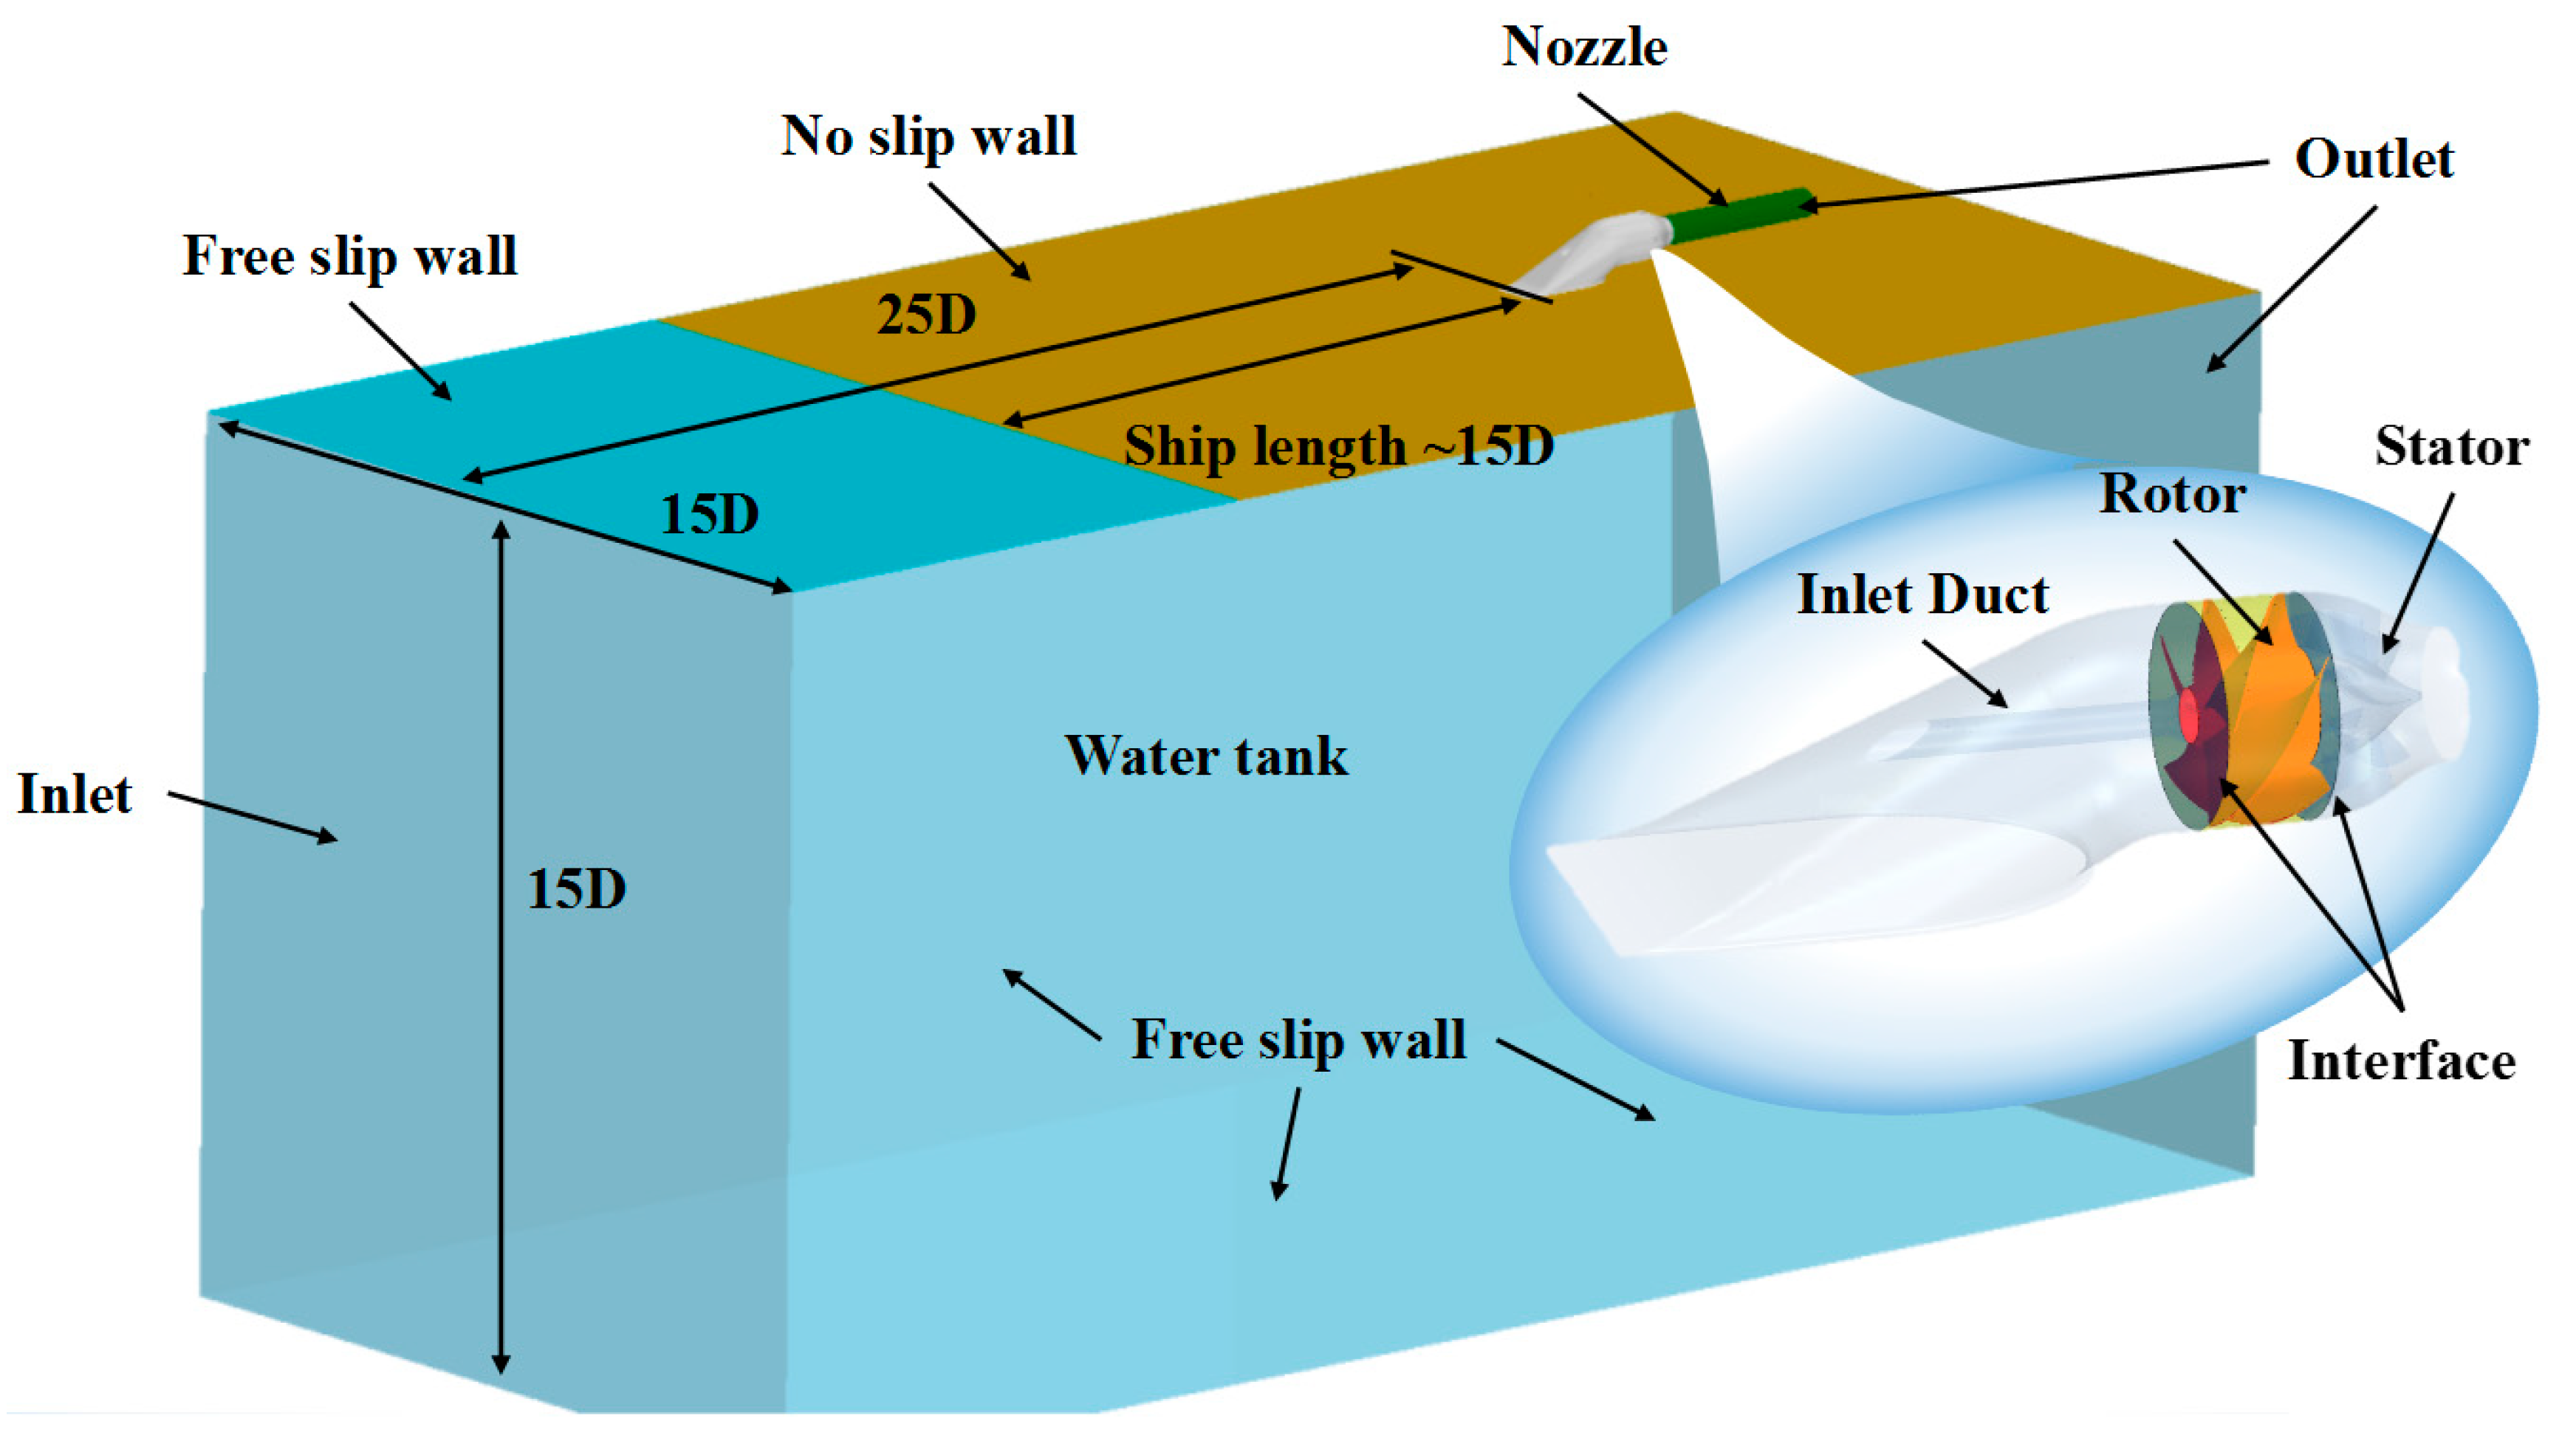
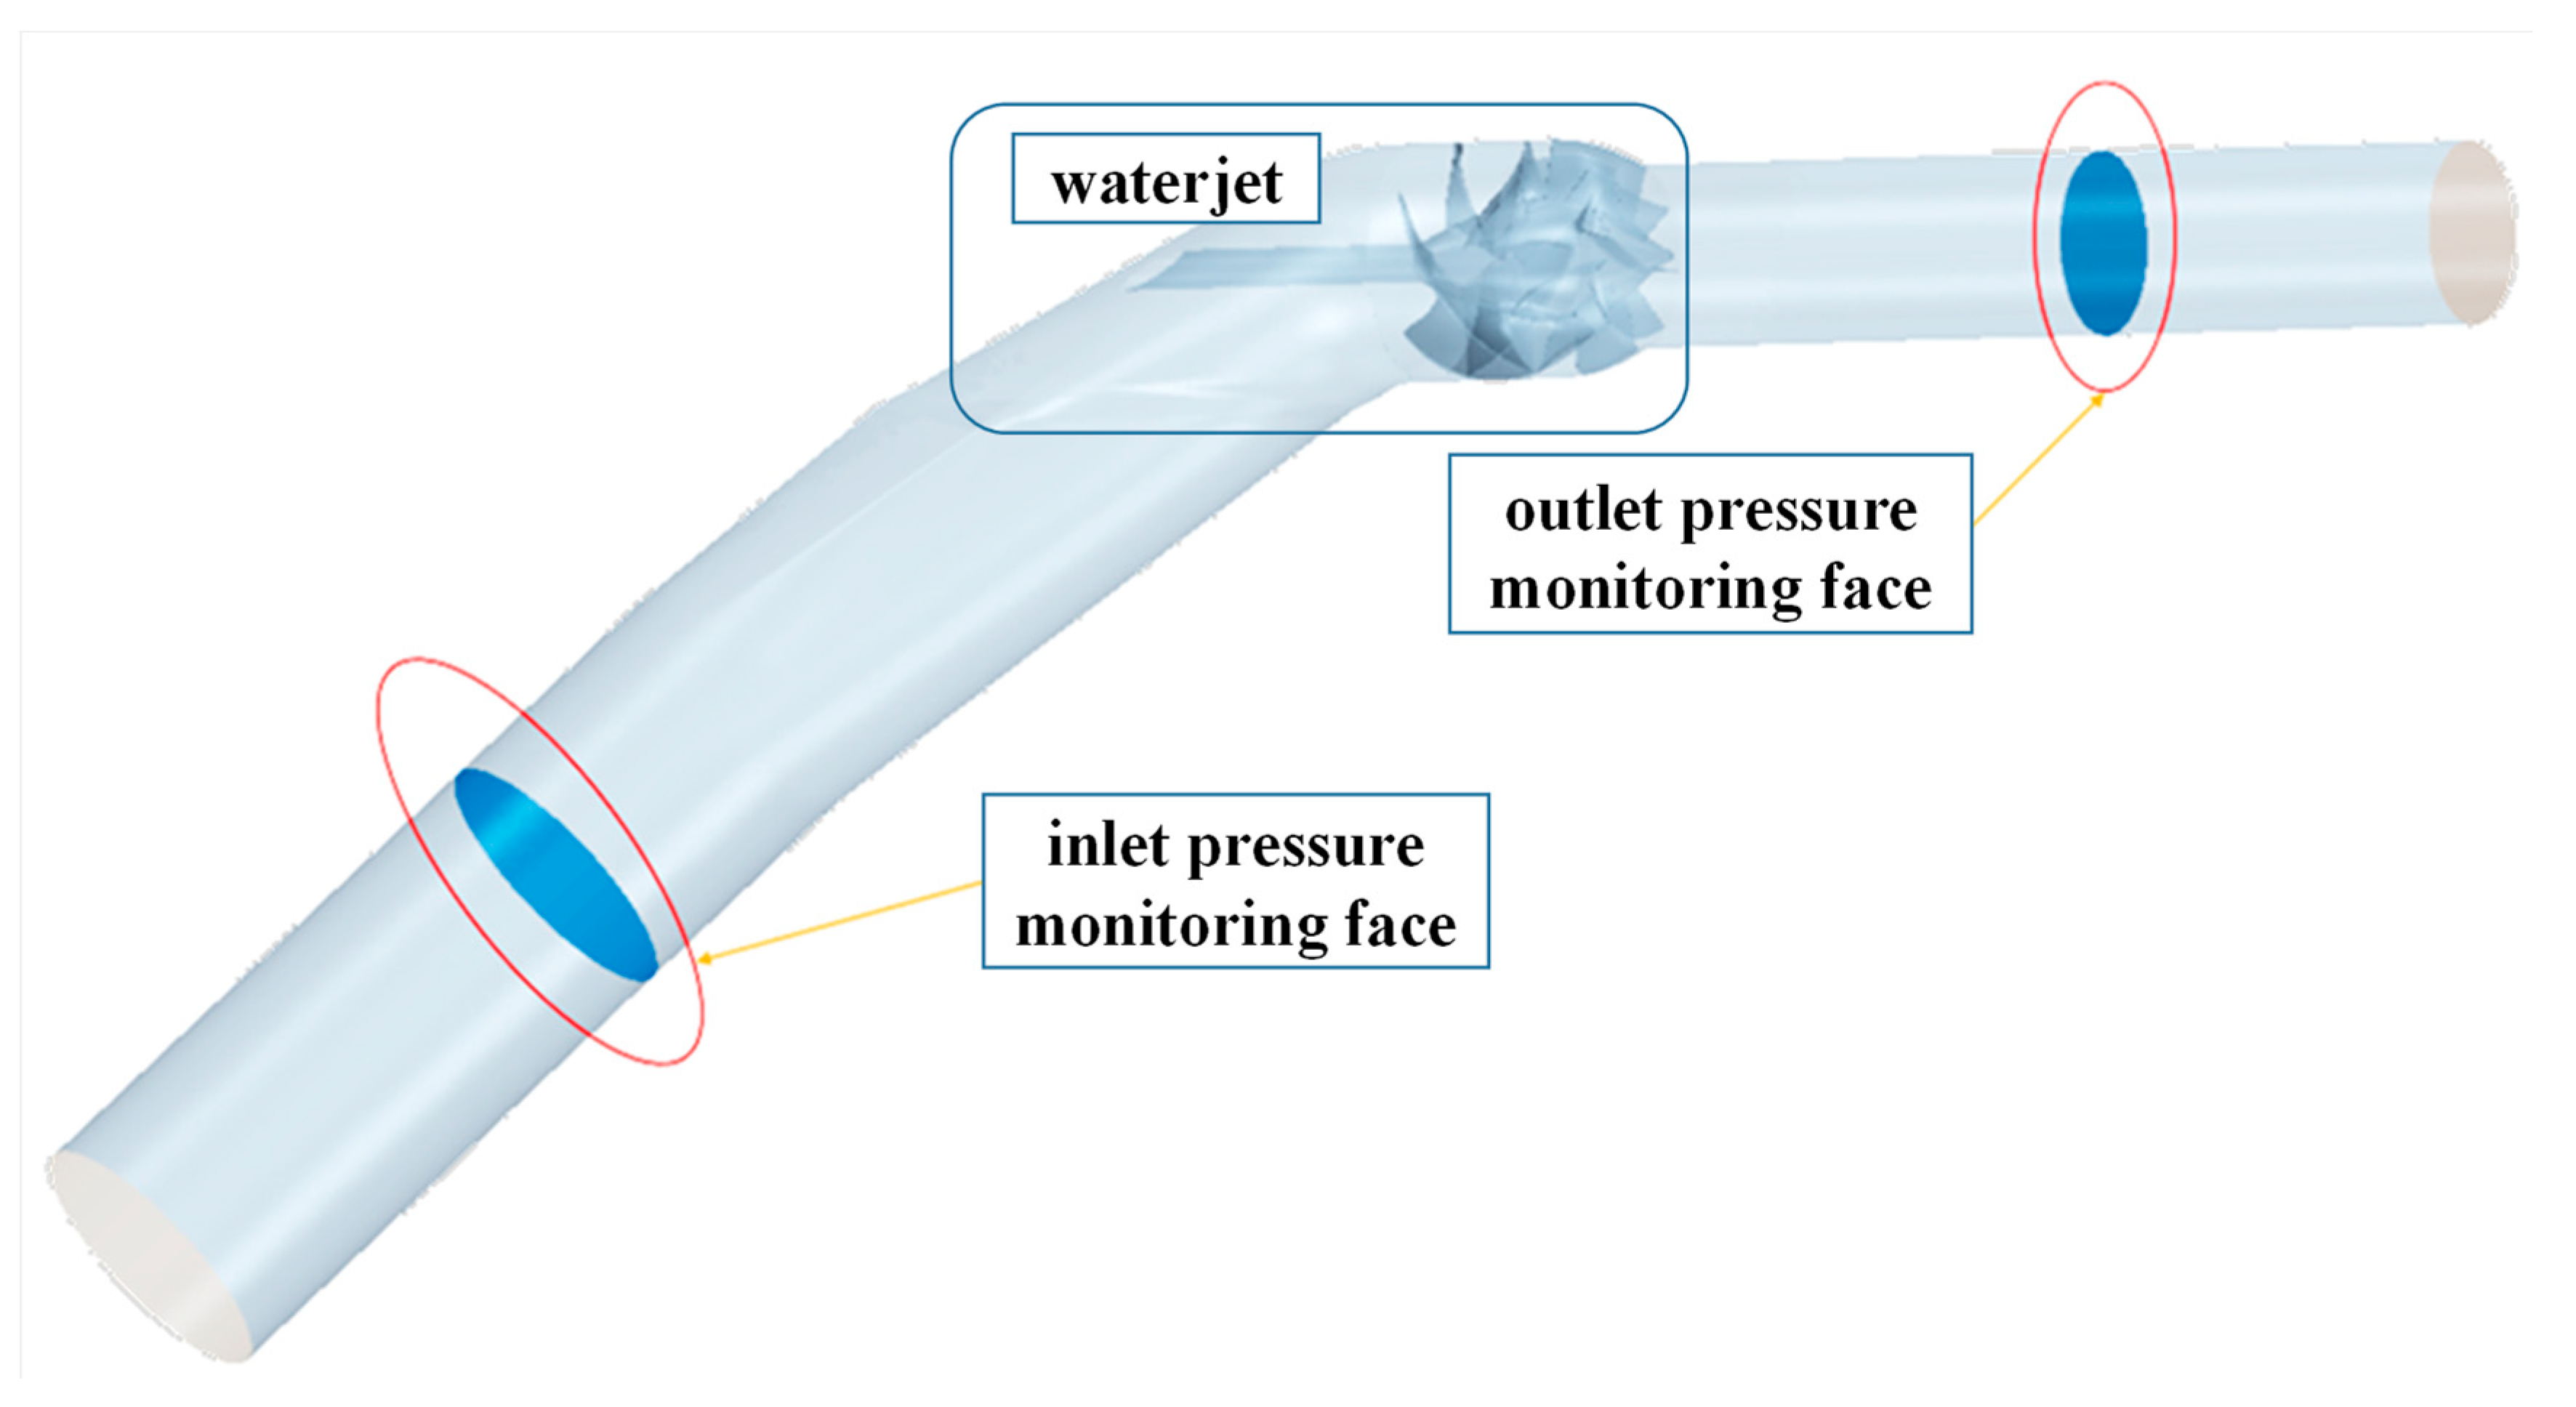
2.1. Three-Dimensional Model

This paper studies a marine waterjet propulsion unit. The unit is a compact axial waterjet consisting of a five-blade rotor, nine-blade stator, shaft, inlet duct, and nozzle section. The whole model is shown in Figure 1. The diameter of the rotor is 550 mm, and the operating rotation speed is 1200 r/min. The pump case and guide vane are made of cast aluminum alloy, the impeller is made of Cu3 copper alloy, and the shaft is made of stainless steel. The three-dimensional (3D) numerical calculation domain of the waterjet propulsion system contains a structure region and a fluid region.

2.2. Flow Field Numerical Methods

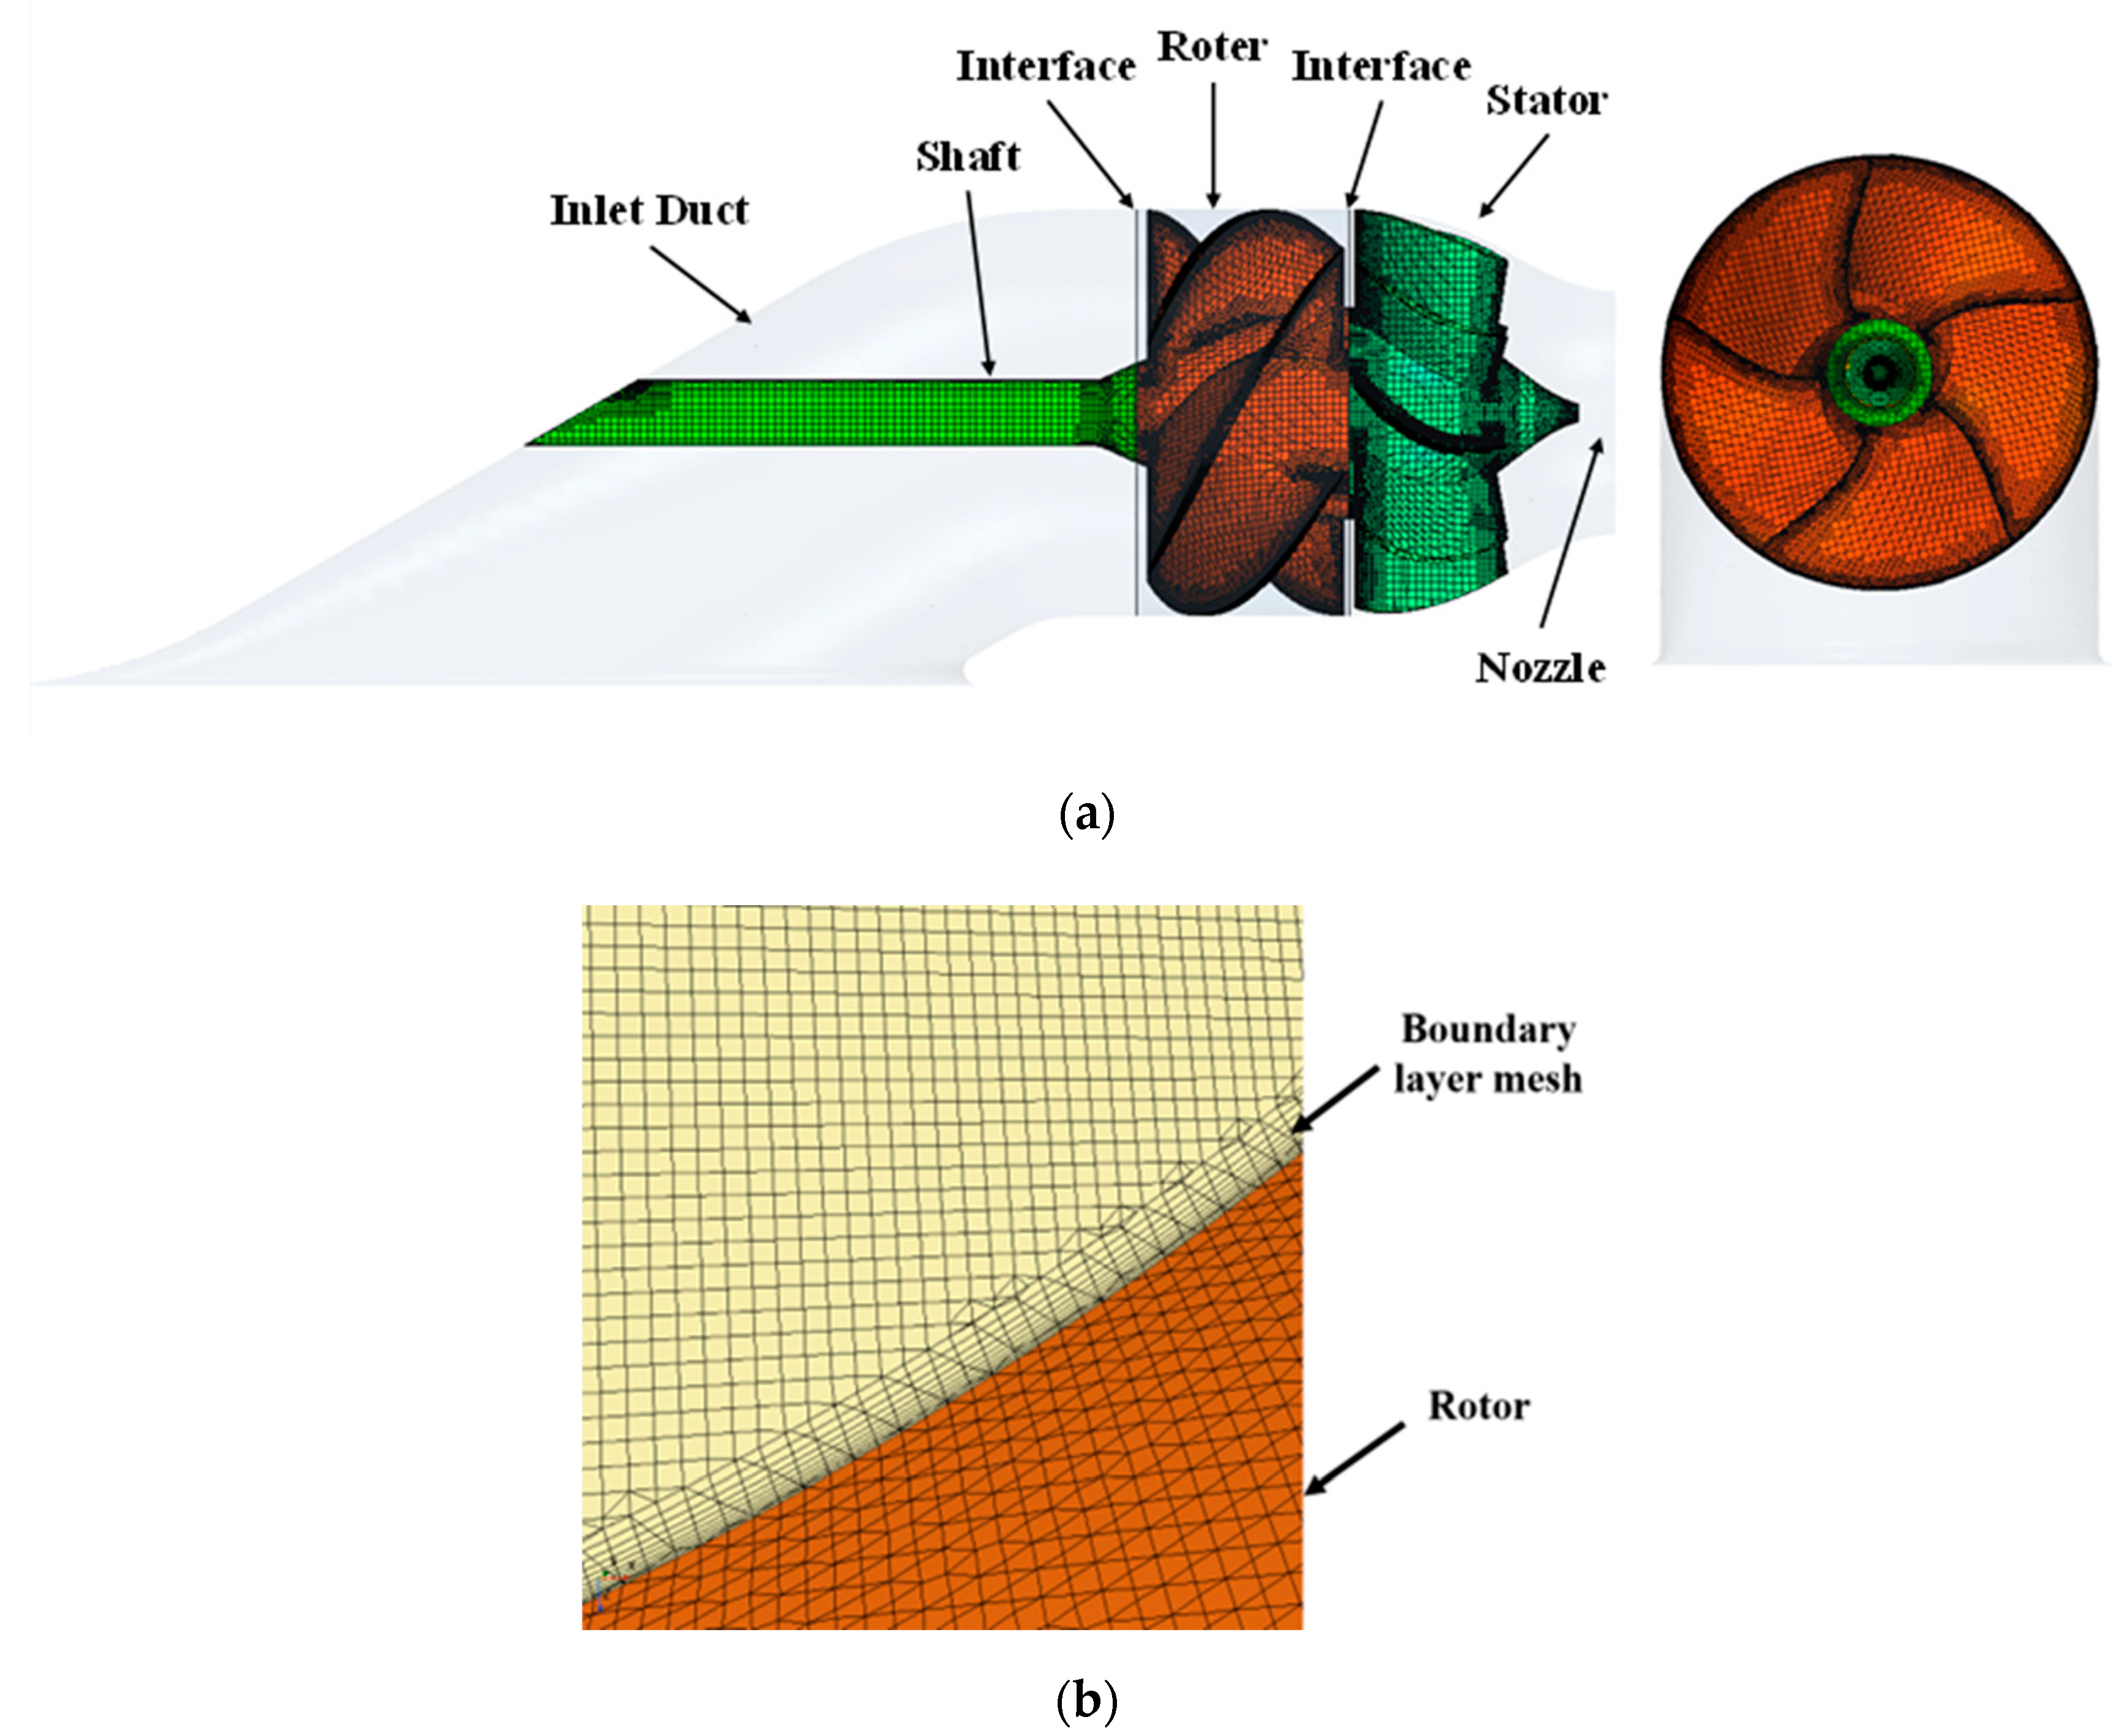
2.2.1. Numerical Methods

In this study, the finite volume method is employed through the commercial software STAR-CCM+ V12.0 from CD-adapco Group. The numerical calculation domain of the entire waterjet propulsion system consists of the waterjet propulsion unit and the watershed at the bottom of the hull. To reduce the influence of the boundary conditions on the numerical simulations, the nozzle of the guide vane is extended by a cylindrical extension with a diameter of five times the diameter of the duct. The incoming flow of the waterjet is affected by the boundary layer of the hull, rendering the water flow into the inlet flow channel uneven. A wall boundary with the same length as the ship is positioned in the direction of the incoming flow along the computational domain to simulate the boundary layer of the hull. The width and depth of the computational domain are both 15 times the diameter of the inlet duct of the water jet, as recommended by Huang et al. [11]. The computational boundary conditions are shown in Figure 2. The inlet of the computational domain is assigned as a velocity inlet, where the velocity is the same as the design speed of the ship. The outlet of the computational domain and the nozzle of the waterjet are both assigned as pressure outlets. Free-slip wall boundary conditions are imposed on the bottom and sides, allowing the mesh near these walls to be relatively rough without decomposing the boundary layer. The no-slip boundary condition is applied on the top and wall of the duct
The computational domain is split into two different regions: a stationary region and a rotation region, divided by an interface. An unstructured trimmed mesh is generated, with six layers of prism-shaped cells with a growth ratio of 1.2 forming the boundary layer. Mesh refinement is applied in the inlet duct, inside the duct, and around the spout. the shear stress transport (SST) k-ω turbulence model is adopted, which is a suitable model for rotating mechanical flow field calculations [12,13]. The viscosity solver based on separation flow, and the SIMPLE method is used to couple the pressure and velocity. The convection term is discretized using a second-order upwind scheme. The Cartesian cut-cell method is used to generate the unstructured computational grids, with a boundary layer that consists of 10 prism layer mesh and a trimmed mesh, as shown in Figure 3. The total number of grids is 8.65 million, of which the rotational domain is 3.3 million. The height of the first element of the boundary mesh is set so that the y+ value is maintained in the range 30–60. This grid scheme is determined by grid independence verification, as shown in the next section.
The SST k-ω model is applied to simulate the 3D unsteady viscous incompressible flow in the waterjet pump. The basic Navier-Stokes (N-S) equation is introduced into the Boussinesq hypothesis. The resulting flow control equations are the continuity equation in time-homogeneous form and the N-S equation in the form
( ρ u i ¯ ) x i = 0
( ρ u i u j ¯ ) x i = p x i + x j [ μ ( u i ¯ x j ρ u i u j ¯ ) ] + ρ F i
where F i is the volume force, p is the pressure acting on the fluid, ρ is the density of the medium, and ν is the kinetic viscosity coefficient of the medium. The standard SST model is used to close the Reynolds-averaged N-S equations by introducing a two-equation model of the dissipation rate of turbulent kinetic energy.

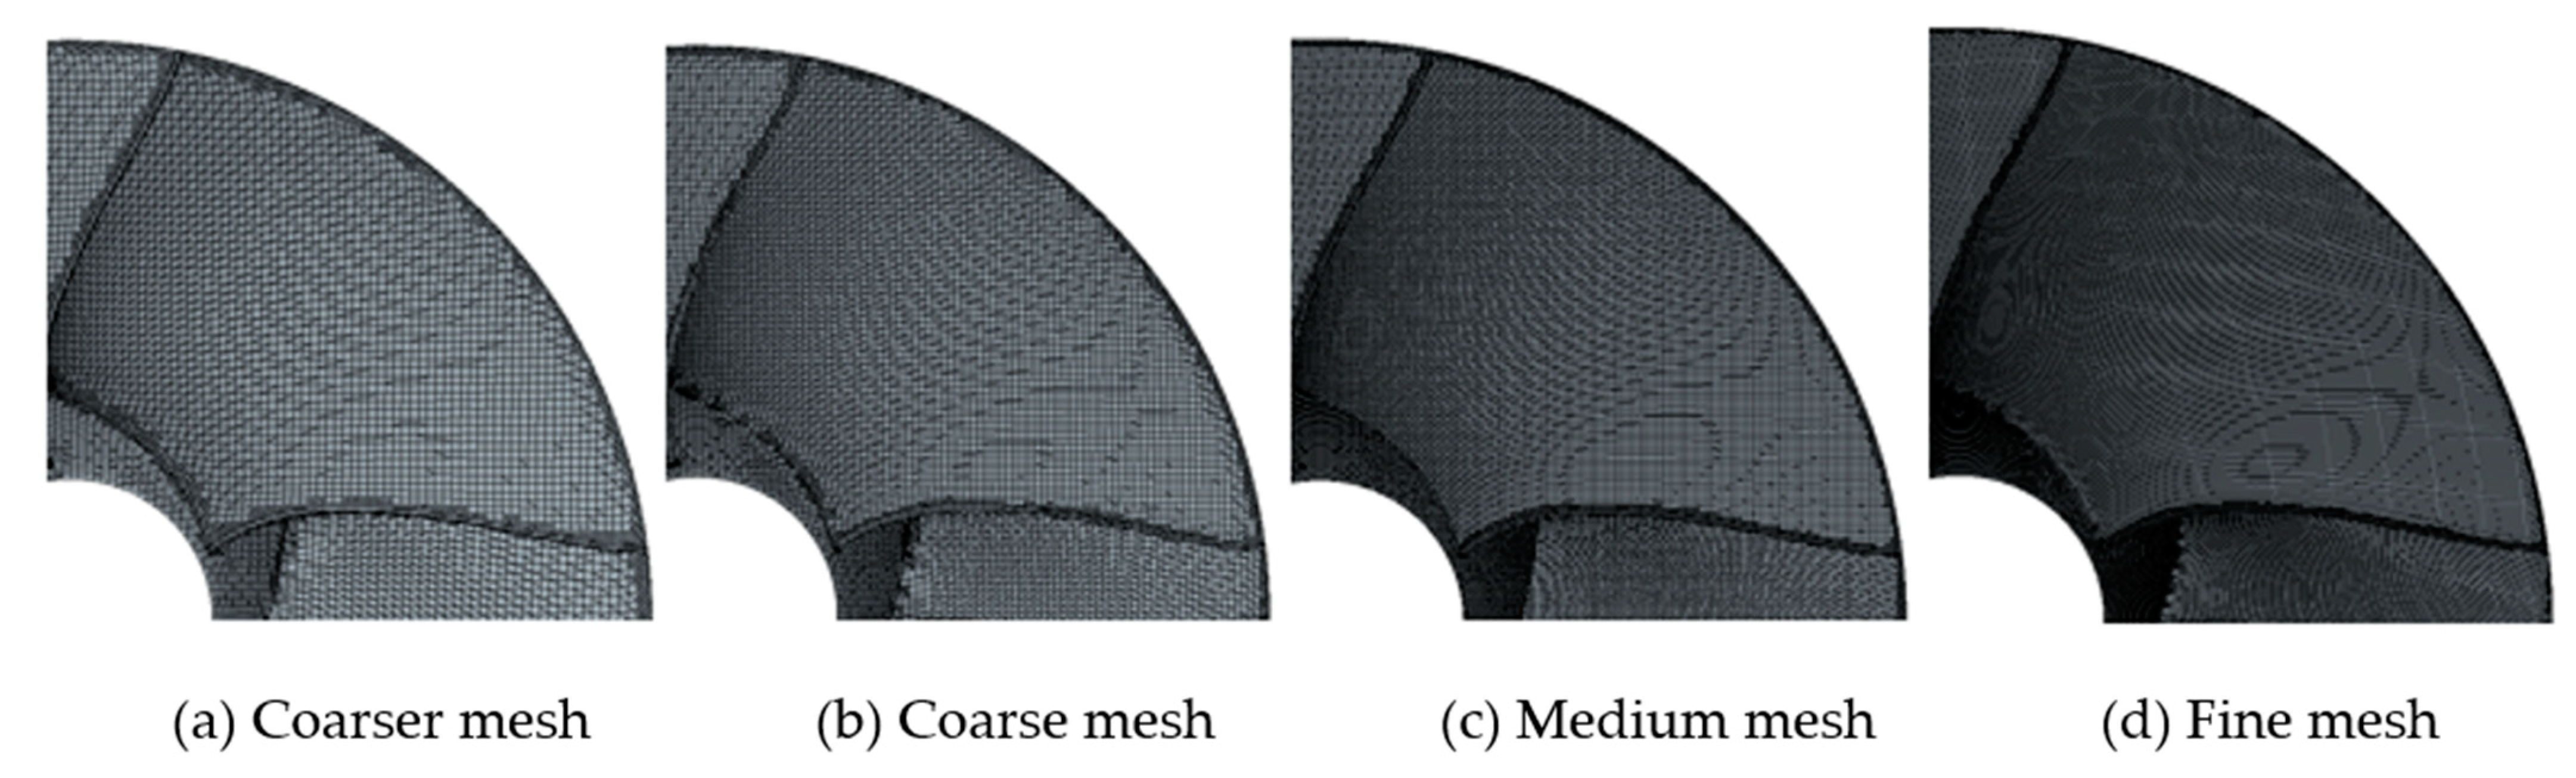
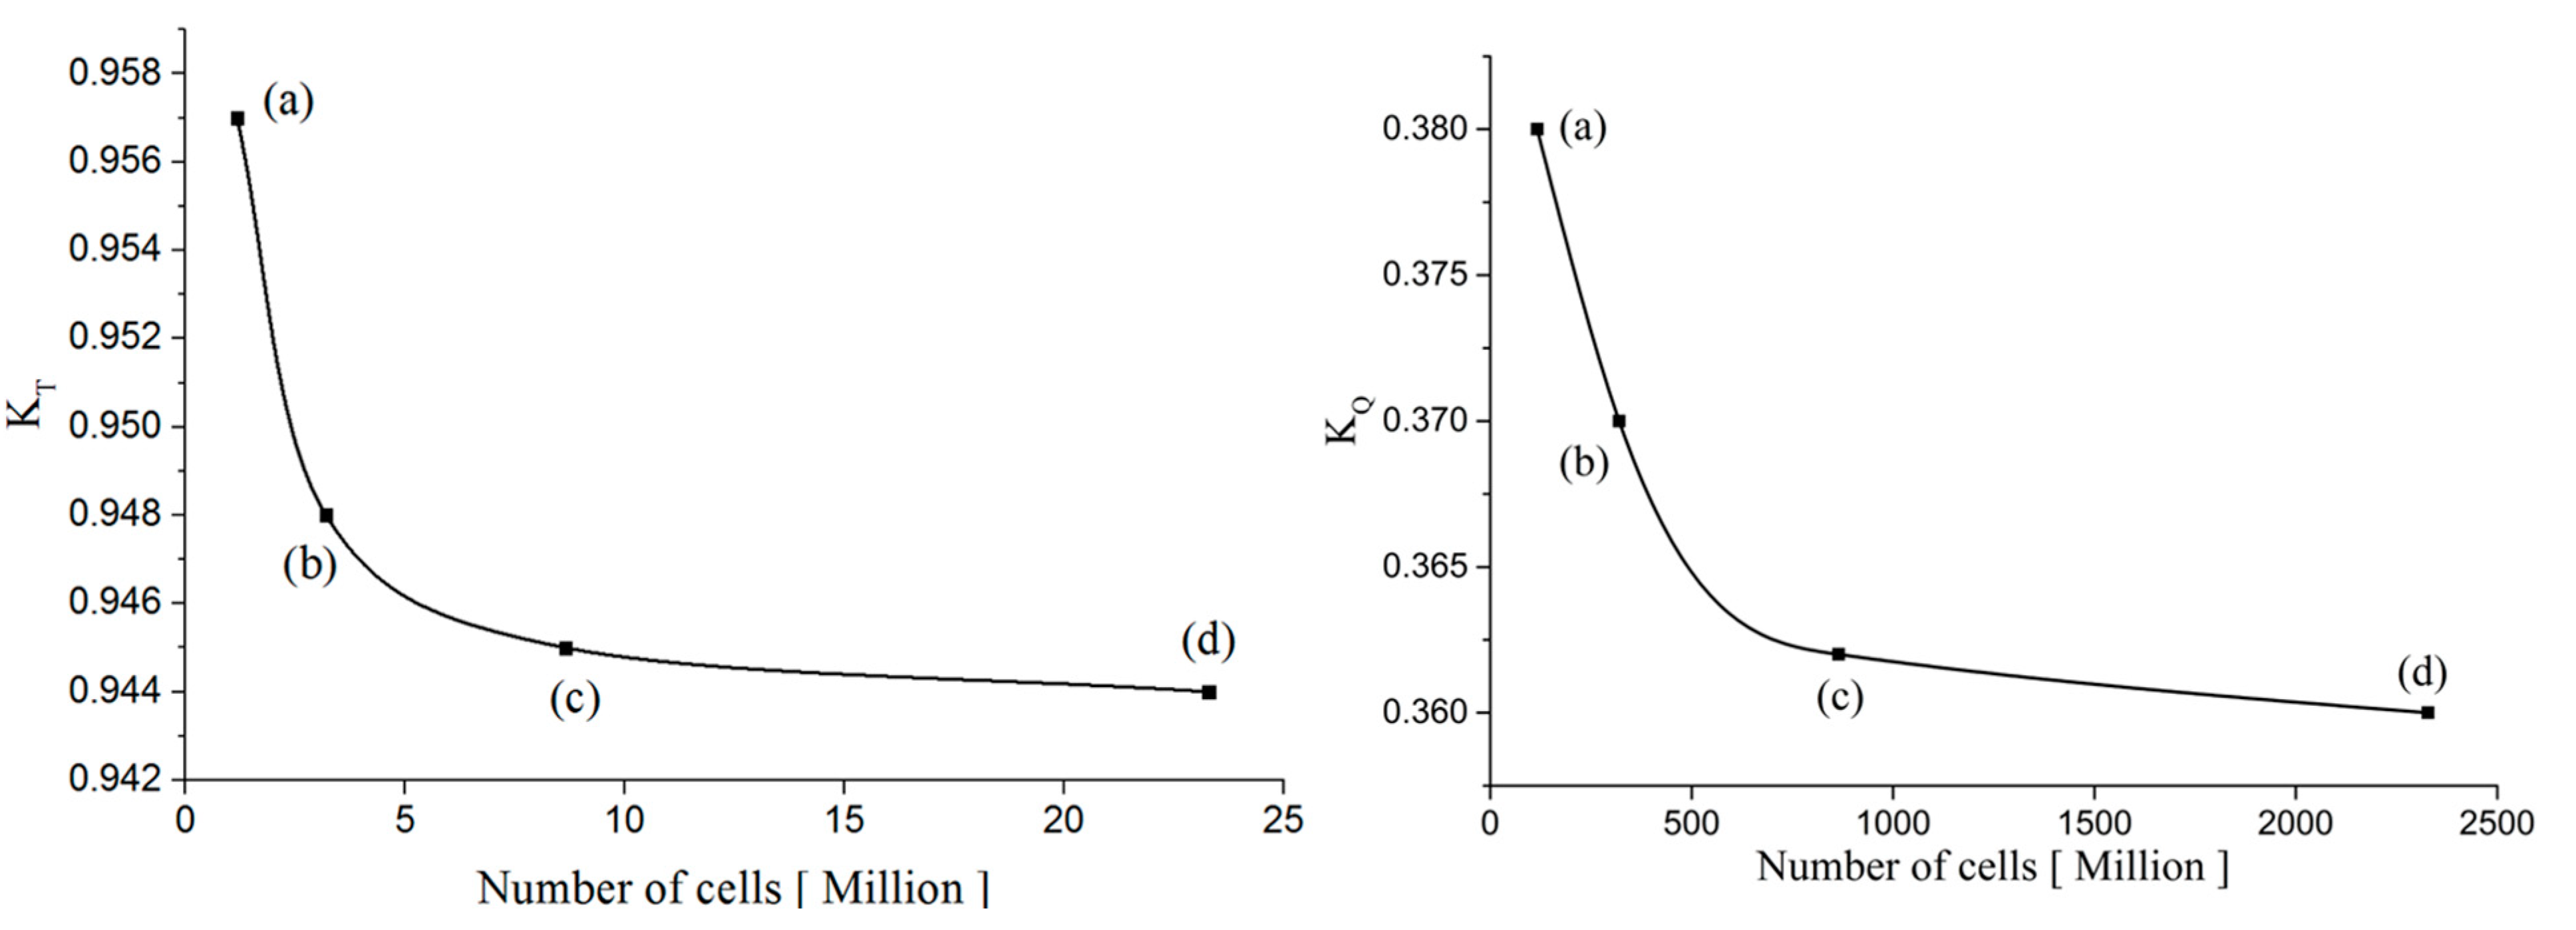
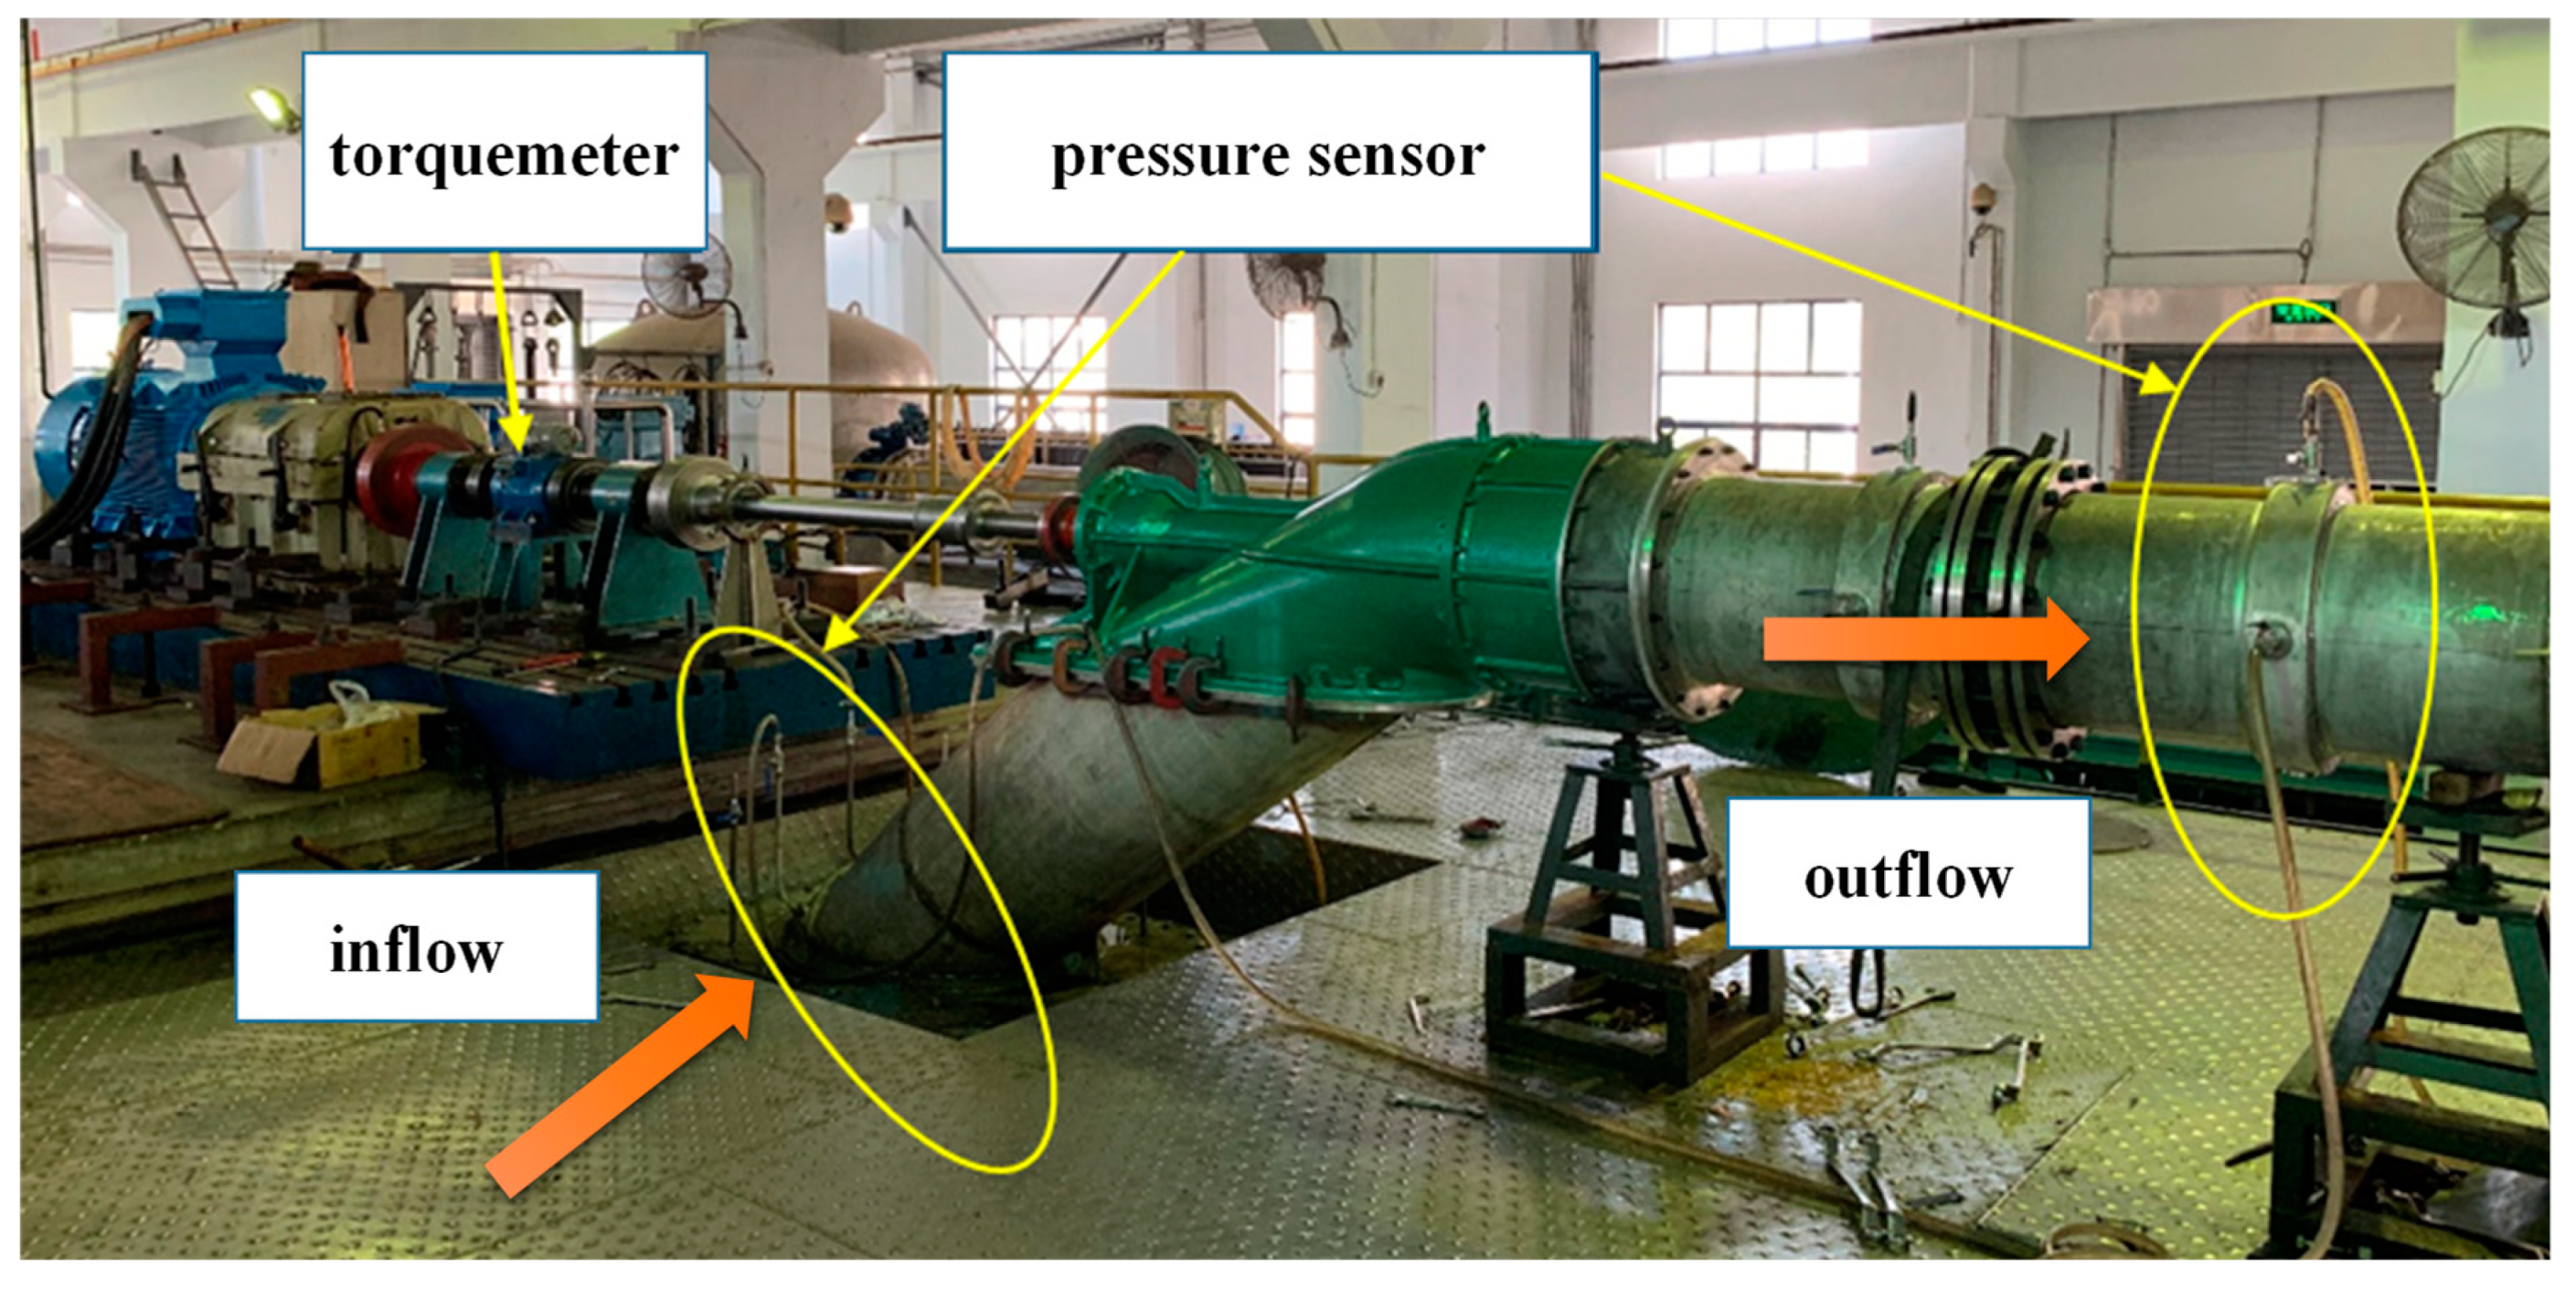
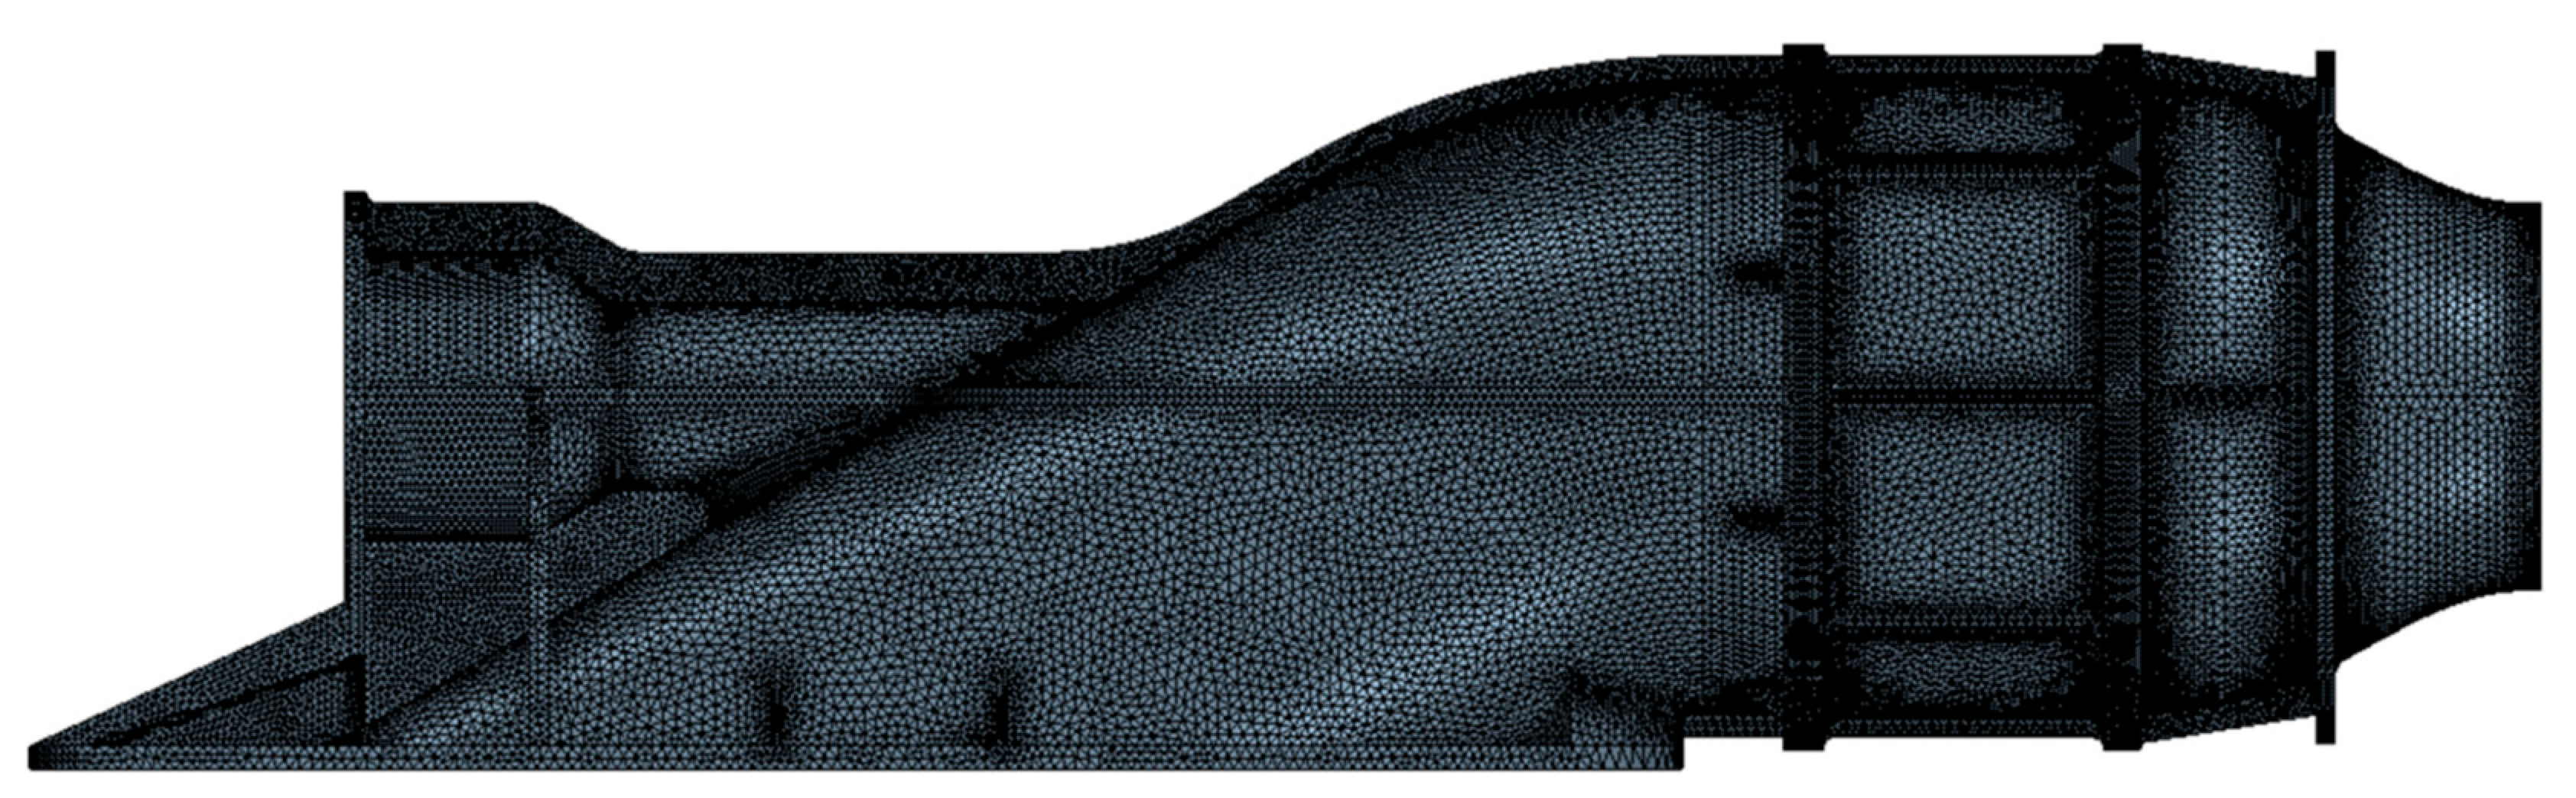
2.2.2. Grid Independence Study and Waterjet Bench Test

Considering the influence of the grid scale on the calculation results, it is necessary to analyze the grid independence [14]. To analyze the independence of the grid, we made four sets of grids, with the basic dimensions increasing in the ratio of 2 . The dimensions of the grids in different areas are given in the form of the percentage of the basic dimensions. Figure 4 are the surface grids of rotor blades, and the key parameters of the four sets of grids are shown in Table 1.
The thrust coefficients KT and torque coefficients K Q of the rotor calculated based on four sets of grids are shown in Figure 5. It can be seen that the thrust and torque coefficients converge gradually with the refinement of the grids.
K T = T r ρ n 2 D r 4
K Q = Q r ρ n 2 D r 5
As can be seen in Figure 5, the calculation results gradually converge with the increase in the number of grids, and the grid (c) reached a relatively high actuarial accuracy. Considering the calculation time and calculation accuracy, grid (c) is used for the subsequent calculation.
To verify the mesh method and the reliability of the numerical simulation results, the external characteristics of the waterjet are compared with experimental results. The system used for the model tests, which were carried out in the waterjet test system of the Science and Technology on Water Jet Propulsion Laboratory, China, is shown in Figure 6. The waterjet test facility is a closed circulation pipeline, including a test pipeline, regulator tank, cavitation tank, and control valve. A motor drives the rotor to produce water circulation in the test pipeline. A torque meter (uncertainty of 0.1%) was positioned between the output shaft of the motor and the input shaft of the propeller. Two pressure sensors (uncertainty of 0.2%) were placed on a stabilization ring in the pipeline between the inlet and outlet, and the pressure was recorded at these positions. The flow rate in the test system was measured by an electromagnetic flowmeter (uncertainty of 0.3%). The external characteristics were then obtained from the measured flow rate (Q), inlet and outlet pressure, rotation rate (n), and shaft torque (T). The pump head (H), shaft power (P), and efficiency (η) were derived from these measured data according to
H = ( v j 2 v i 2 ) 2 g + ( p j p i ) ρ g
P = 2 π n τ
η = ρ g Q H P
where p j and p i are the static pressures measured by the pressure sensors at the inlet and outlet of the test facility, respectively; V j and V i are the outlet velocities of the waterjet pump calculated from the measured flow rate (Q) and the pipe diameter; and τ represents the torque of the impeller [15,16].
The computational domain of the waterjet test system is shown in Figure 7. The external characteristics are compared in Table 2. Under three test rotation rate conditions, the numerical simulation results for the head differ by less than 2% from the test values, and the power difference is less than 1.30%. This shows that the adopted mesh strategy and the numerical simulation calculation method are reliable. Thus, the same strategy is adopted for all subsequent fluid–structure interaction analysis discussed in this paper.

2.3. CFD-FEM Simulation Model

The vibration excitation sources of the waterjet unit can be divided into two types according to the generation mechanism: shafting excitation and fluid excitation. Shafting excitation is mainly caused by a rotor fault or rolling bearing fault [17]. Fluid excitation is mainly the result of unsteady fluid excitation in the waterjet propulsion unit. Compared with shaft excitation, the occurrence mechanism of fluid excitation is more complex [18].
To simulate the inner flow of the waterjet, an unsteady Reynolds-averaged N-S simulation method for incompressible flow is adopted. The data exchange across the interface between the moving and static parts is handled by sliding mesh technology. The boundaries include an inlet, outlet, and solid wall. The inlet boundary is assigned a mass flow condition, while the outlet boundary adopts the free outlet condition, that is, the fluid at the outlet is fully developed by default, and the gradient of the fluid parameters along the normal direction of the outlet is zero. The solid wall is considered to be a no-slip boundary. A fixed constraint is applied at the bottom and the outlet flange, and the interface between the fluid domain and the structure is considered as the fluid–structure interaction surface.
The duct of the waterjet is made of cast aluminum alloy with a density of 2700 kg/m3, Poisson’s ratio of 0.3, and elastic modulus of 70 GPa. The structural mesh of the waterjet unit is shown in Figure 8.
A time step ΔT of 0.139 ms is used in the unsteady calculations (ΔT = T/360, where T is the rotation period of the impeller). With this time step, the highest fluctuating frequency that can be accurately analyzed from the flow field fluctuating signal is 3600 Hz [1/(2ΔT)], which is much higher than the blade passing frequency (BPF, 100 Hz). In a single time step, the impeller moves through a rotation angle of 1°, and the number of iterations in the inner loop is set to 20. After 20 spin cycles, the unsteady data for the last eight cycles are extracted for further analysis.

3. Analysis of Numerical Simulation Results

3.1. Pressure Fluctuation Characteristics

The pressure fluctuations inside the waterjet propulsion unit are an important reason for the vibration and noise produced by jet propulsion [19]. In this study, pressure fluctuation monitoring points were placed at different locations to study how the pressure fluctuations change inside the waterjet, allowing us to clarify the characteristics of fluid excitation. A schematic diagram of the monitoring points is shown in Figure 9, Figure 10 and Figure 11. There are eight monitoring points arranged evenly along the circumferential direction in Figure 11, seven monitoring points from the impeller inlet to the impeller outlet at the top of the duct in Figure 10 and six monitoring points arranged evenly along the radial direction at the inlet edge of the guide vane in Figure 9.
Figure 12, Figure 13 and Figure 14 show that the pressure fluctuations at each monitoring point exhibit a clear peak at the BPF (100 Hz) and its harmonic frequencies, indicating that impeller rotation is the main reason for the pressure fluctuation. The amplitude of the pressure fluctuations increases gradually as we move outward along the radial direction.
Under the combined effect of the complex vortices and high relative velocity at the tip and the large blade load, the pressure fluctuation coefficient at the tip clearance region of the waterjet is significantly higher than that at other positions. A comparison of the maximum fluctuation pressure coefficients at the seven measuring points from the impeller inlet to the impeller outlet at the top of the duct shows that the pressure fluctuations at the impeller inlet are larger than those at the impeller outlet, and the maximum pressure fluctuation value is located in the tip clearance region close to the impeller inlet edge. The maximum pulsation pressure coefficient at the rotor outlet is lower than that at the rotor inlet, and far lower than that in the blade tip clearance region.

3.2. Unsteady Radial and Axial Force Analysis

The fluid excitation force acting on the impeller surface causes axial and radial vibrations of the rotor, which are transferred to the waterjet. This is one of the main factors leading to vibrations in the marine pump unit. The inlet flow of the water jet propulsion pump, which has obvious nonuniform characteristics, is influenced by the hull boundary layer and the blade shaft.
The axial flow velocity of the inlet passage of the rotor gradually decreases from bottom to top, especially in the upper part of the shaft where the low-speed region is significantly enhanced. The uneven inlet flow affects the pressure distribution on the impeller surface. Unsteady radial and axial forces are generated during the pump’s operation, and these directly affect the operation stability of the waterjet propulsion. The radial force is crucial for the circumferential balance, whereas the axial force is the key factor in guaranteeing the safe working of the bearing.
To explore the law of pump vibration caused by fluid excitation, the characteristics of the fluid excitation force on the rotor are analyzed. A Fourier transform was applied to the forces in the axial and radial directions, and the frequency domain characteristics of the unsteady forces were obtained, as shown in Figure 15. The main frequency of the unsteady axial force of the impeller is at the shaft frequency, and the other characteristic frequencies are insignificant. The maximum unsteady axial force amplitude is 1.34% of the blade thrust. The main frequency of the unsteady radial force of the impeller is at 2BPF, and the amplitude is 1.12% of the blade thrust. The other high peaks of the unsteady radial force are at 1BPF.

3.3. Vibration Characteristics of the Waterjet

The stator and pump case of the waterjet are stationary components, while the impeller is a rotating component. During operation, strong rotor–stator interaction effects induce vibrations in the stator and the pump case. By arranging a series of measuring points on the leading edge of the stator and collecting the vibration displacement amplitude, the distribution law of the vibration intensity of the stator blades can be determined. The waterfall diagram in Figure 16 shows that the displacement amplitudes of measuring points at different radii on the stator leading edge have obvious peaks at 1BPF and 2BPF, of which 1BPF is dominant. The largest magnitude occurs at 0.8R.
Figure 17 shows the distribution of the vibration velocity amplitude on the surface of the pump case at 1BPF. Darker colors indicate larger velocity amplitudes. It can be seen from the figure that, at 1BPF, the position with the largest vibration velocity is concentrated in the rotor segment and the adjacent rotor segment, which indicates where subsequent vibration reduction measures should be focused.

3.4. Vibration Tests

Vibration analysis is widely used in pump condition monitoring, fault diagnosis, and other fields [20]. Unlike pressure fluctuation sensors, vibration sensors do not need to contact the fluid and do not modify the flow characteristics in the centrifugal pump. In addition, vibration sensors can be placed on the surface of the pump body, providing better measurements of the high-frequency characteristics of the centrifugal pump during operation.
In actual operation, the vibration performance of waterjet propulsion units is of serious concern. Therefore, we tested the vibration data obtained from ship trials. This test used a KISTLER vibration acceleration sensor with a sampling frequency of 2564 Hz over a sampling time of 80 s. The vibration measuring points were arranged along the top of the duct flange, as shown in Figure 18.
Figure 19 shows the acceleration time-frequency spectrum of the test data for the total duration of 80 s. From the figure, it can be seen that there are large amplitudes around 1BPF, 2BPF, and 650 Hz. Over the entire 80 s period, the vibration signal spectrum changes little with time, i.e., the signal is relatively stable and the time-varying characteristics are not obvious.
Figure 20 compares the experimental measured vibration displacement response on the pump case (dotted line) and the numerically predicted vibration displacement response (solid line). Both the test results and the numerical predictions have obvious peaks at 1BPF, but the experimental results are 25% higher than the numerical results. In addition, the test results have obvious discrete line spectra in the range of 0–100 Hz, including at the axial frequency (20 Hz) and twice the axial frequency, as well as other frequencies. This means that, in the actual test, there are excitation forces or physical mechanisms in addition to the impeller excitation force, but this is not reflected in the numerical simulations. The analysis of the natural frequency of the pump case indicates that this is caused by the excitation of the first-order natural frequency of the pump case. The first-order mode shape of the pump case structure is shown in Figure 21.

4. Influence of the Axial Gap

The gap between the rotor and the stator is an important factor in the design of the waterjet propulsion pump. The pump has a compact internal space, and the axial size is limited by the space at the stern of the hull. In some research literature on flow channels [21], an increase in the straight section of the flow channel is observed to improve the uniformity of the incoming flow, but this affects the design space between the rotor and stator. A small rotor–stator gap may increase the risk of vibration from static and dynamic interference. To analyze the influence of the gap on the hydrodynamic performance and vibration performance of the thruster, we increased the gap between the rotor and stator by 15 mm and 30 mm compared with the original gap of 20 mm. Figure 22 illustrates these three rotor–stator gaps.

4.1. Influence on Performance

Table 3 compares the average thrust and torque of the impellers with different rotor and stator gaps. Within the internal size constraints of the waterjet, the rotor thrust decreases significantly as the rotor–stator gap increases, with an amplitude of about 5%. As the gap continues to increase, however, the thrust no longer decreases. The average torque changes little as the rotor–stator gap increases, which means that the efficiency of the thruster decreases with the increasing rotor–stator gap.
Figure 23 and Figure 24 compare the unsteady performance. As the axial gap increases from Gap 1 to Gap 2, the axial unsteady force at 1BPF decreases from 1.34% to 1.02% and the radial unsteady force at 2BPF decreases from 1.12% to 0.34%. The radial unsteady force at 1BPF does not exhibit a monotonous variation pattern.

4.2. Influence on Vibration Characteristics

As the distance between the rotor and stator increases, the rotor–stator interaction effect is weakened, which affects the distribution of the pressure fluctuations on the stator. Figure 25 shows the fluctuating pressure on the stator with respect to the radius of the three axial gaps at a frequency of 1BPF. The fluctuating pressure acting on the stator increases monotonically with the radius of all three axial gaps. Additionally, with increasing axial gap, the fluctuating pressure on the stator decreases at all measuring points, which means that the excitation effect of the flow field on the stator structure is correspondingly weakened. It can be concluded that increasing the axial gap between the rotor and stator is beneficial in terms of weakening the flow-induced vibration of the stator structure.
Figure 26 shows the vibration displacement response of a certain measuring point on the pump case as a function of frequency for the three rotor–stator gaps. The position of the measuring point is shown in the figure. For each axial gap, the vibration displacement response has an obvious peak at 1BPF, while the displacement response at other frequencies is almost negligible. This indicates that the vibration energy is highly concentrated. In addition, as the axial gap between the rotor and the stator increases, the displacement response at the measuring point gradually decreases. This shows that increasing the axial gap is beneficial to weakening the flow-induced vibration response of the pump case.

5. Conclusions

This paper described a steady numerical simulation of the flow field of a waterjet. The numerical results for the hydrodynamic performance were found to be in good agreement with experimental data. On this basis, unsteady fluid–structure coupled vibration simulations were carried out, allowing us to analyze the unsteady excitation of the rotor, the fluid–structure interaction vibration characteristics, and the fluctuating pressure characteristics of the inner flow. Additionally, the effect of the rotor–stator gap on the fluid–structure interaction characteristics was studied. The following conclusions were obtained:
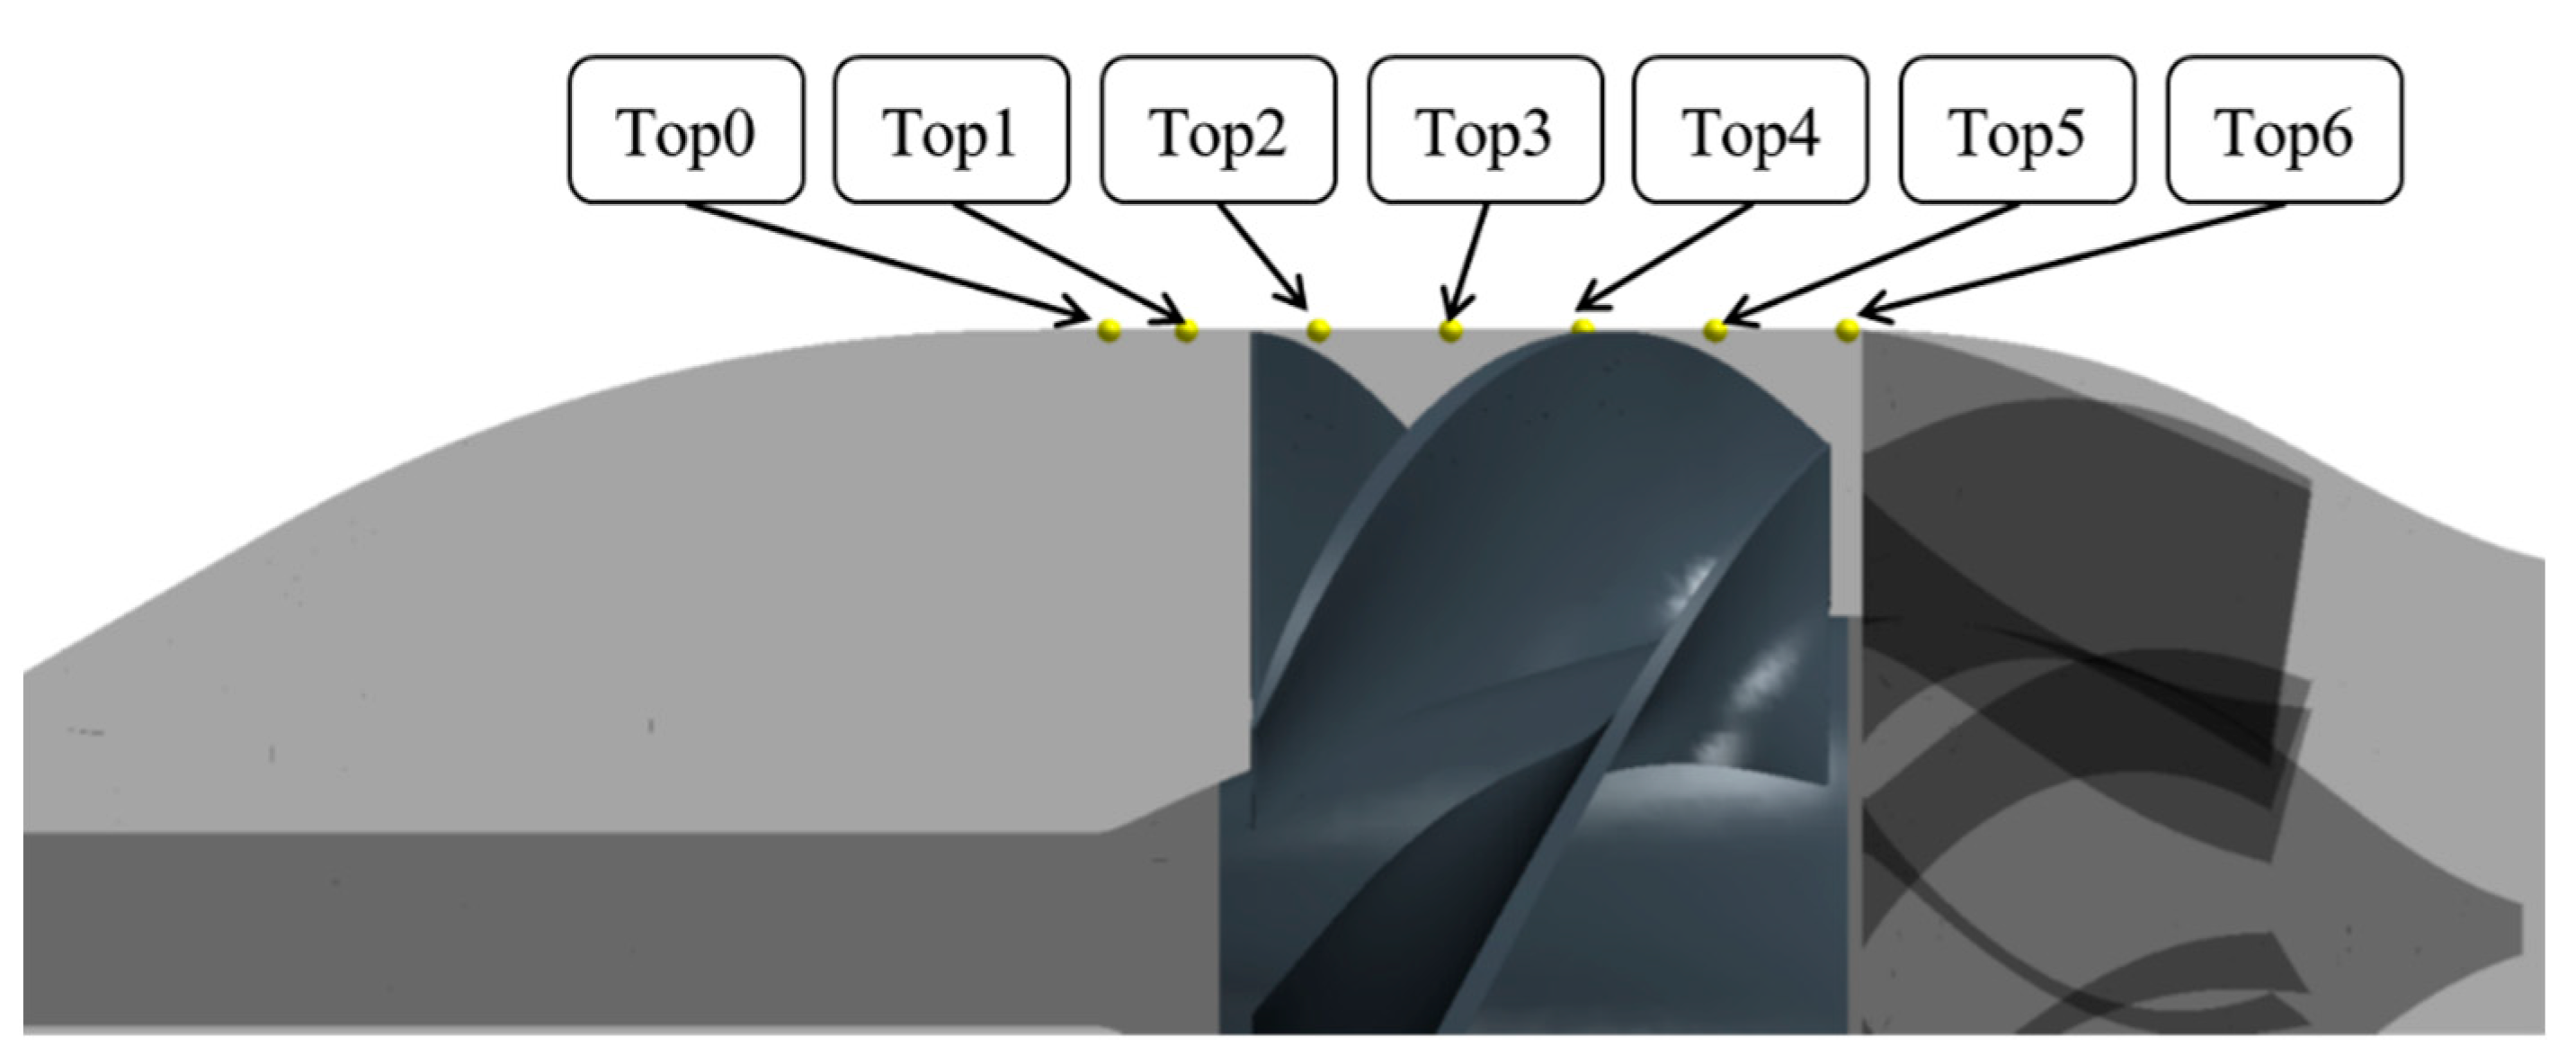
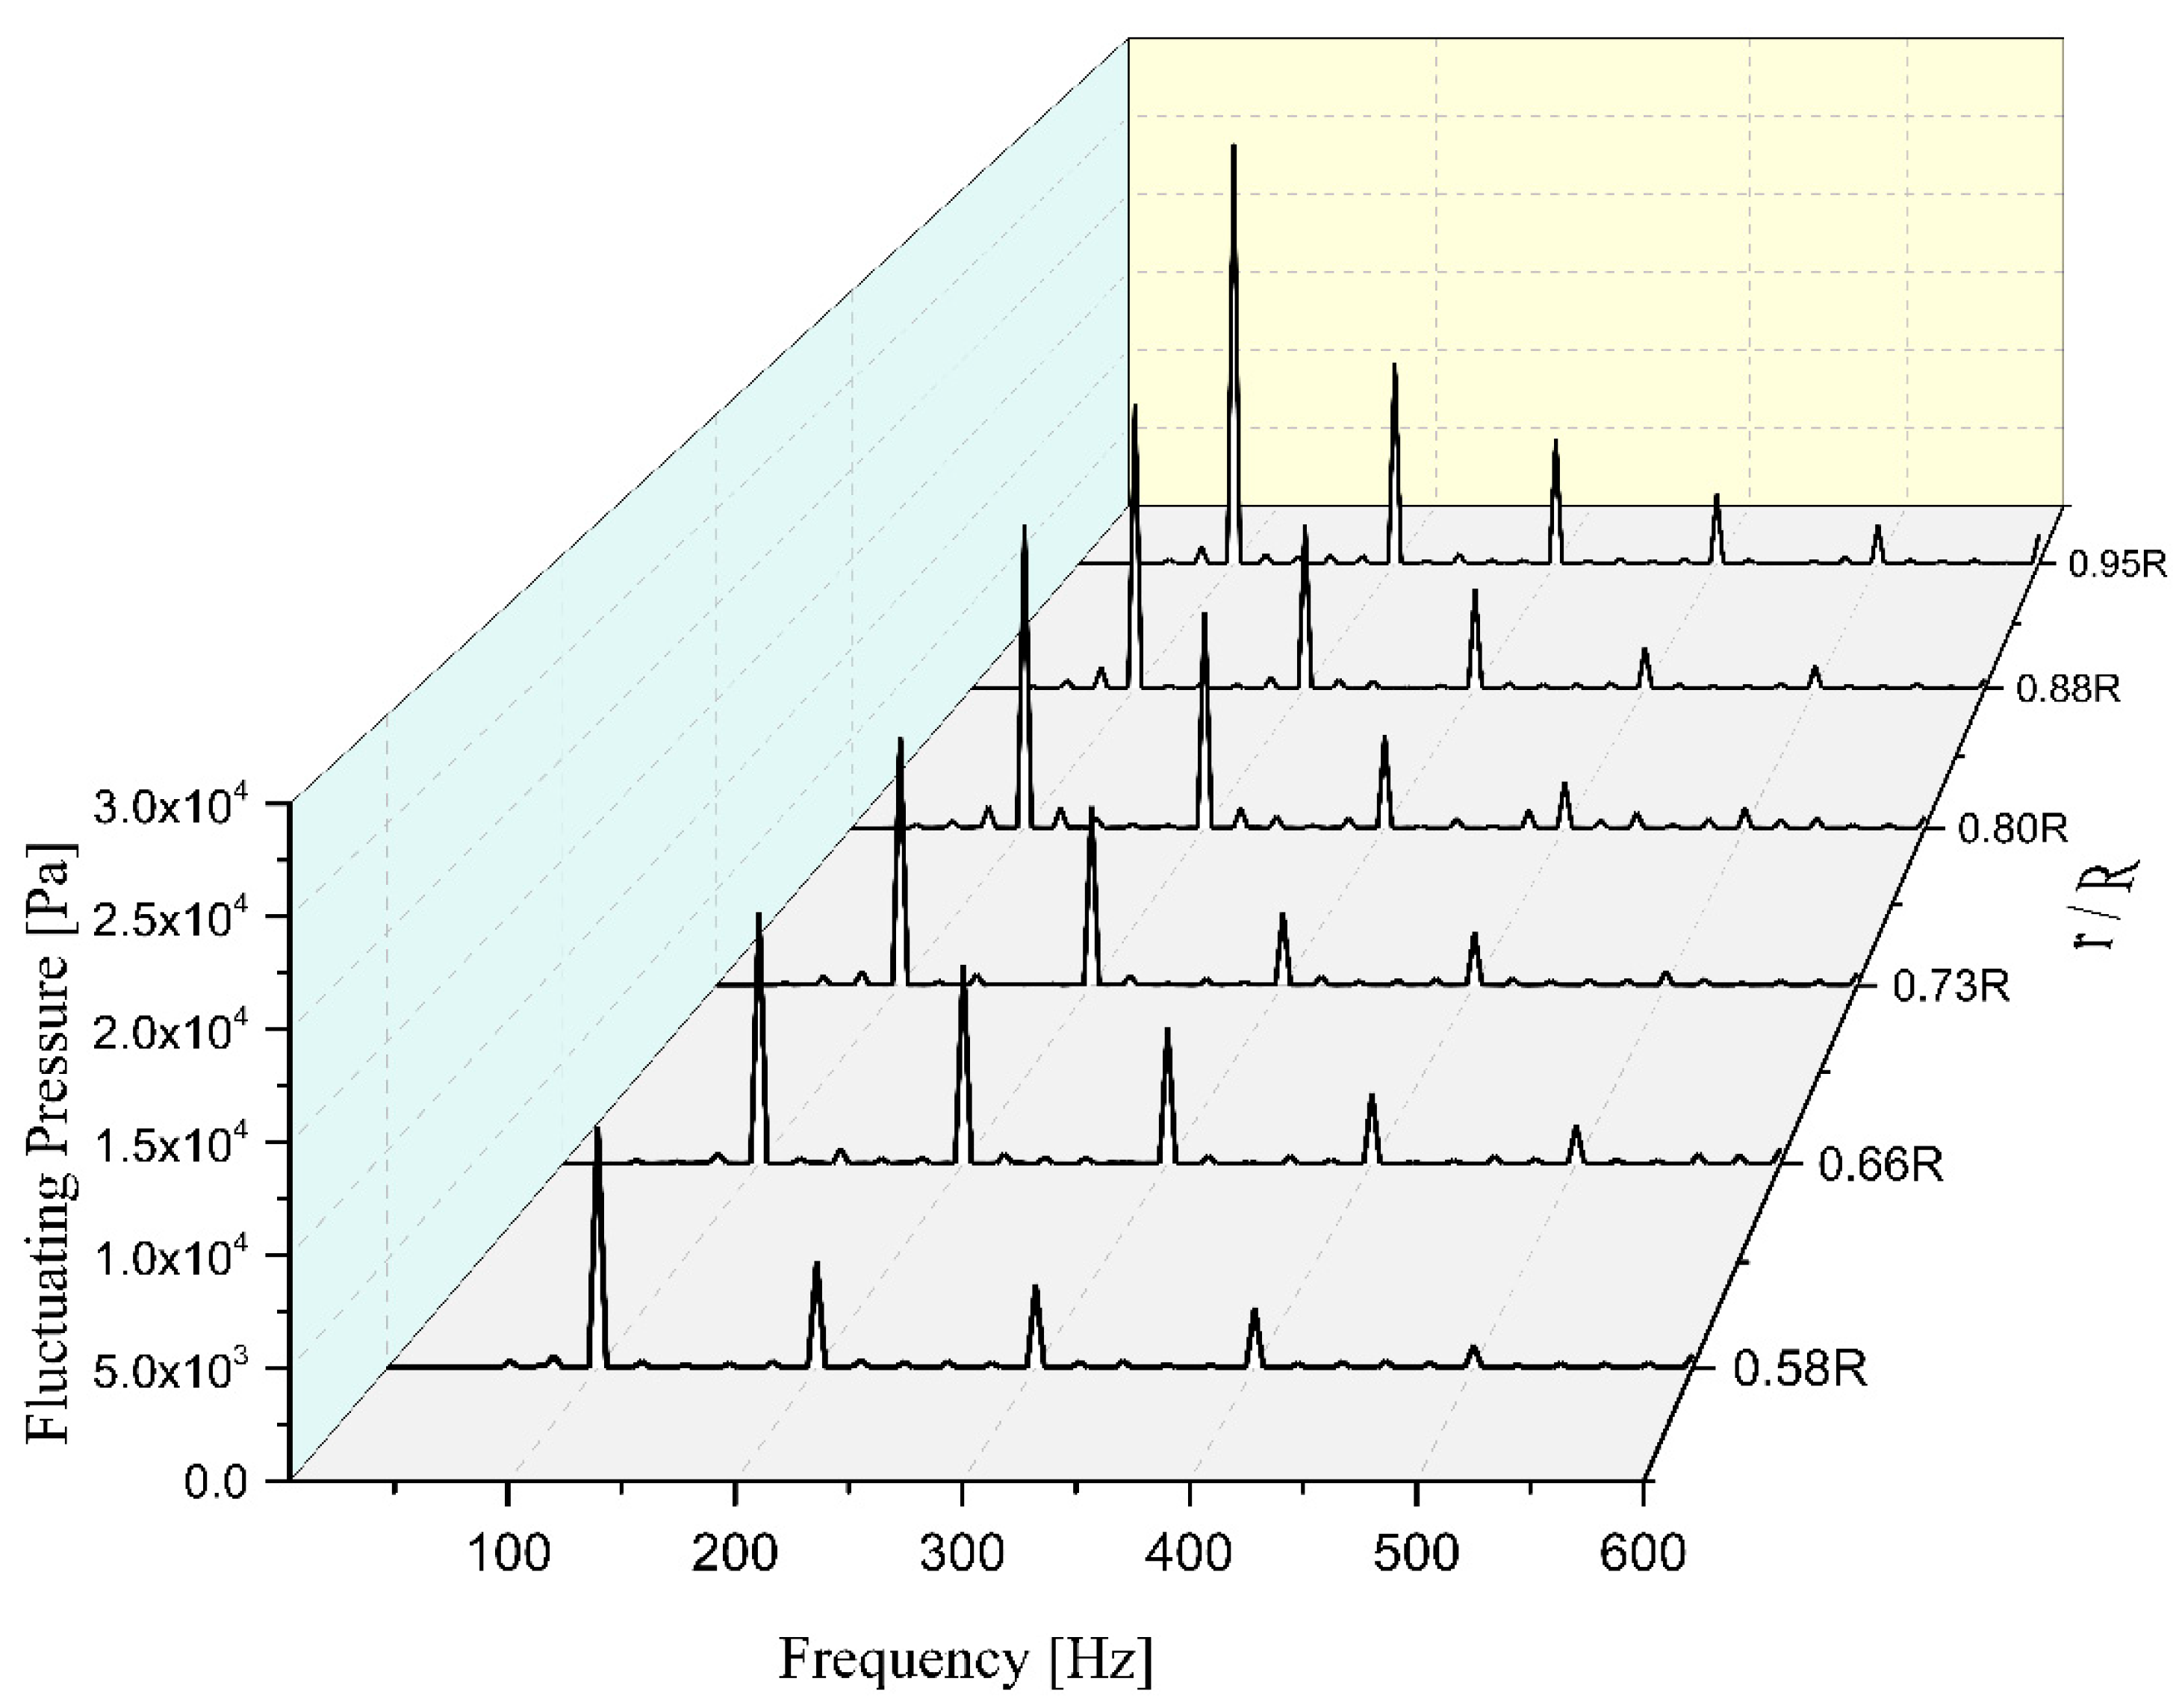
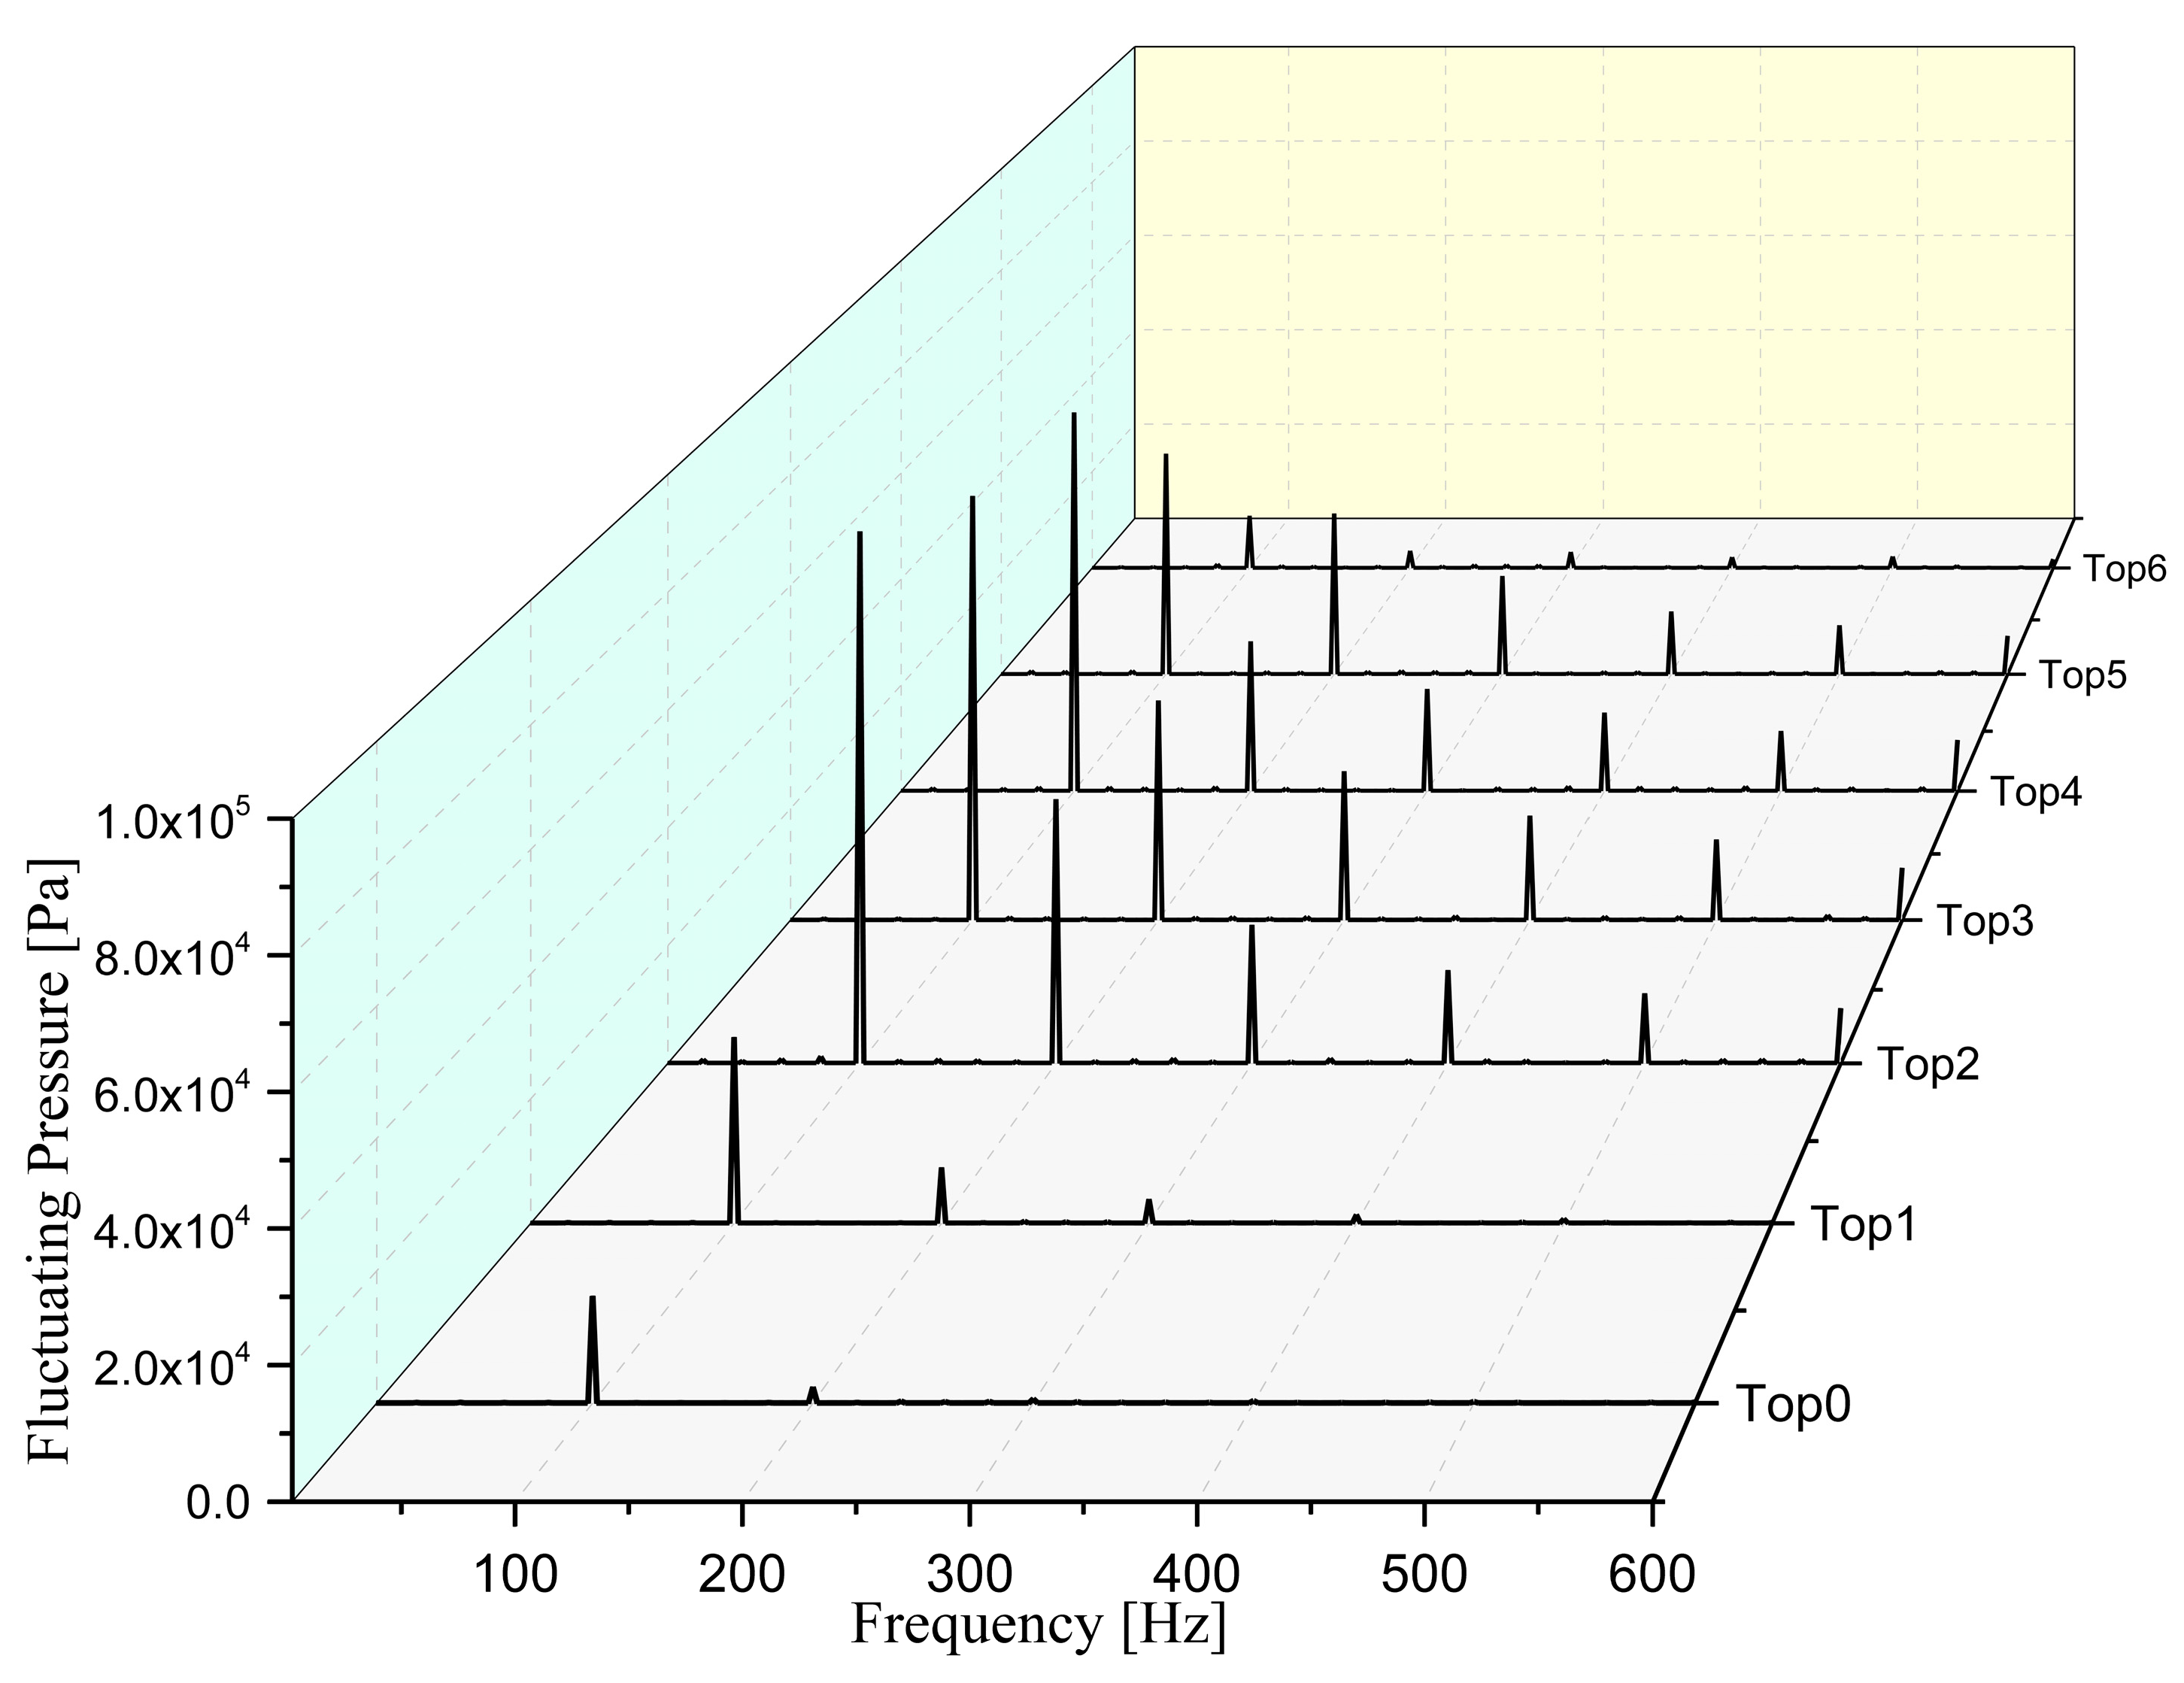
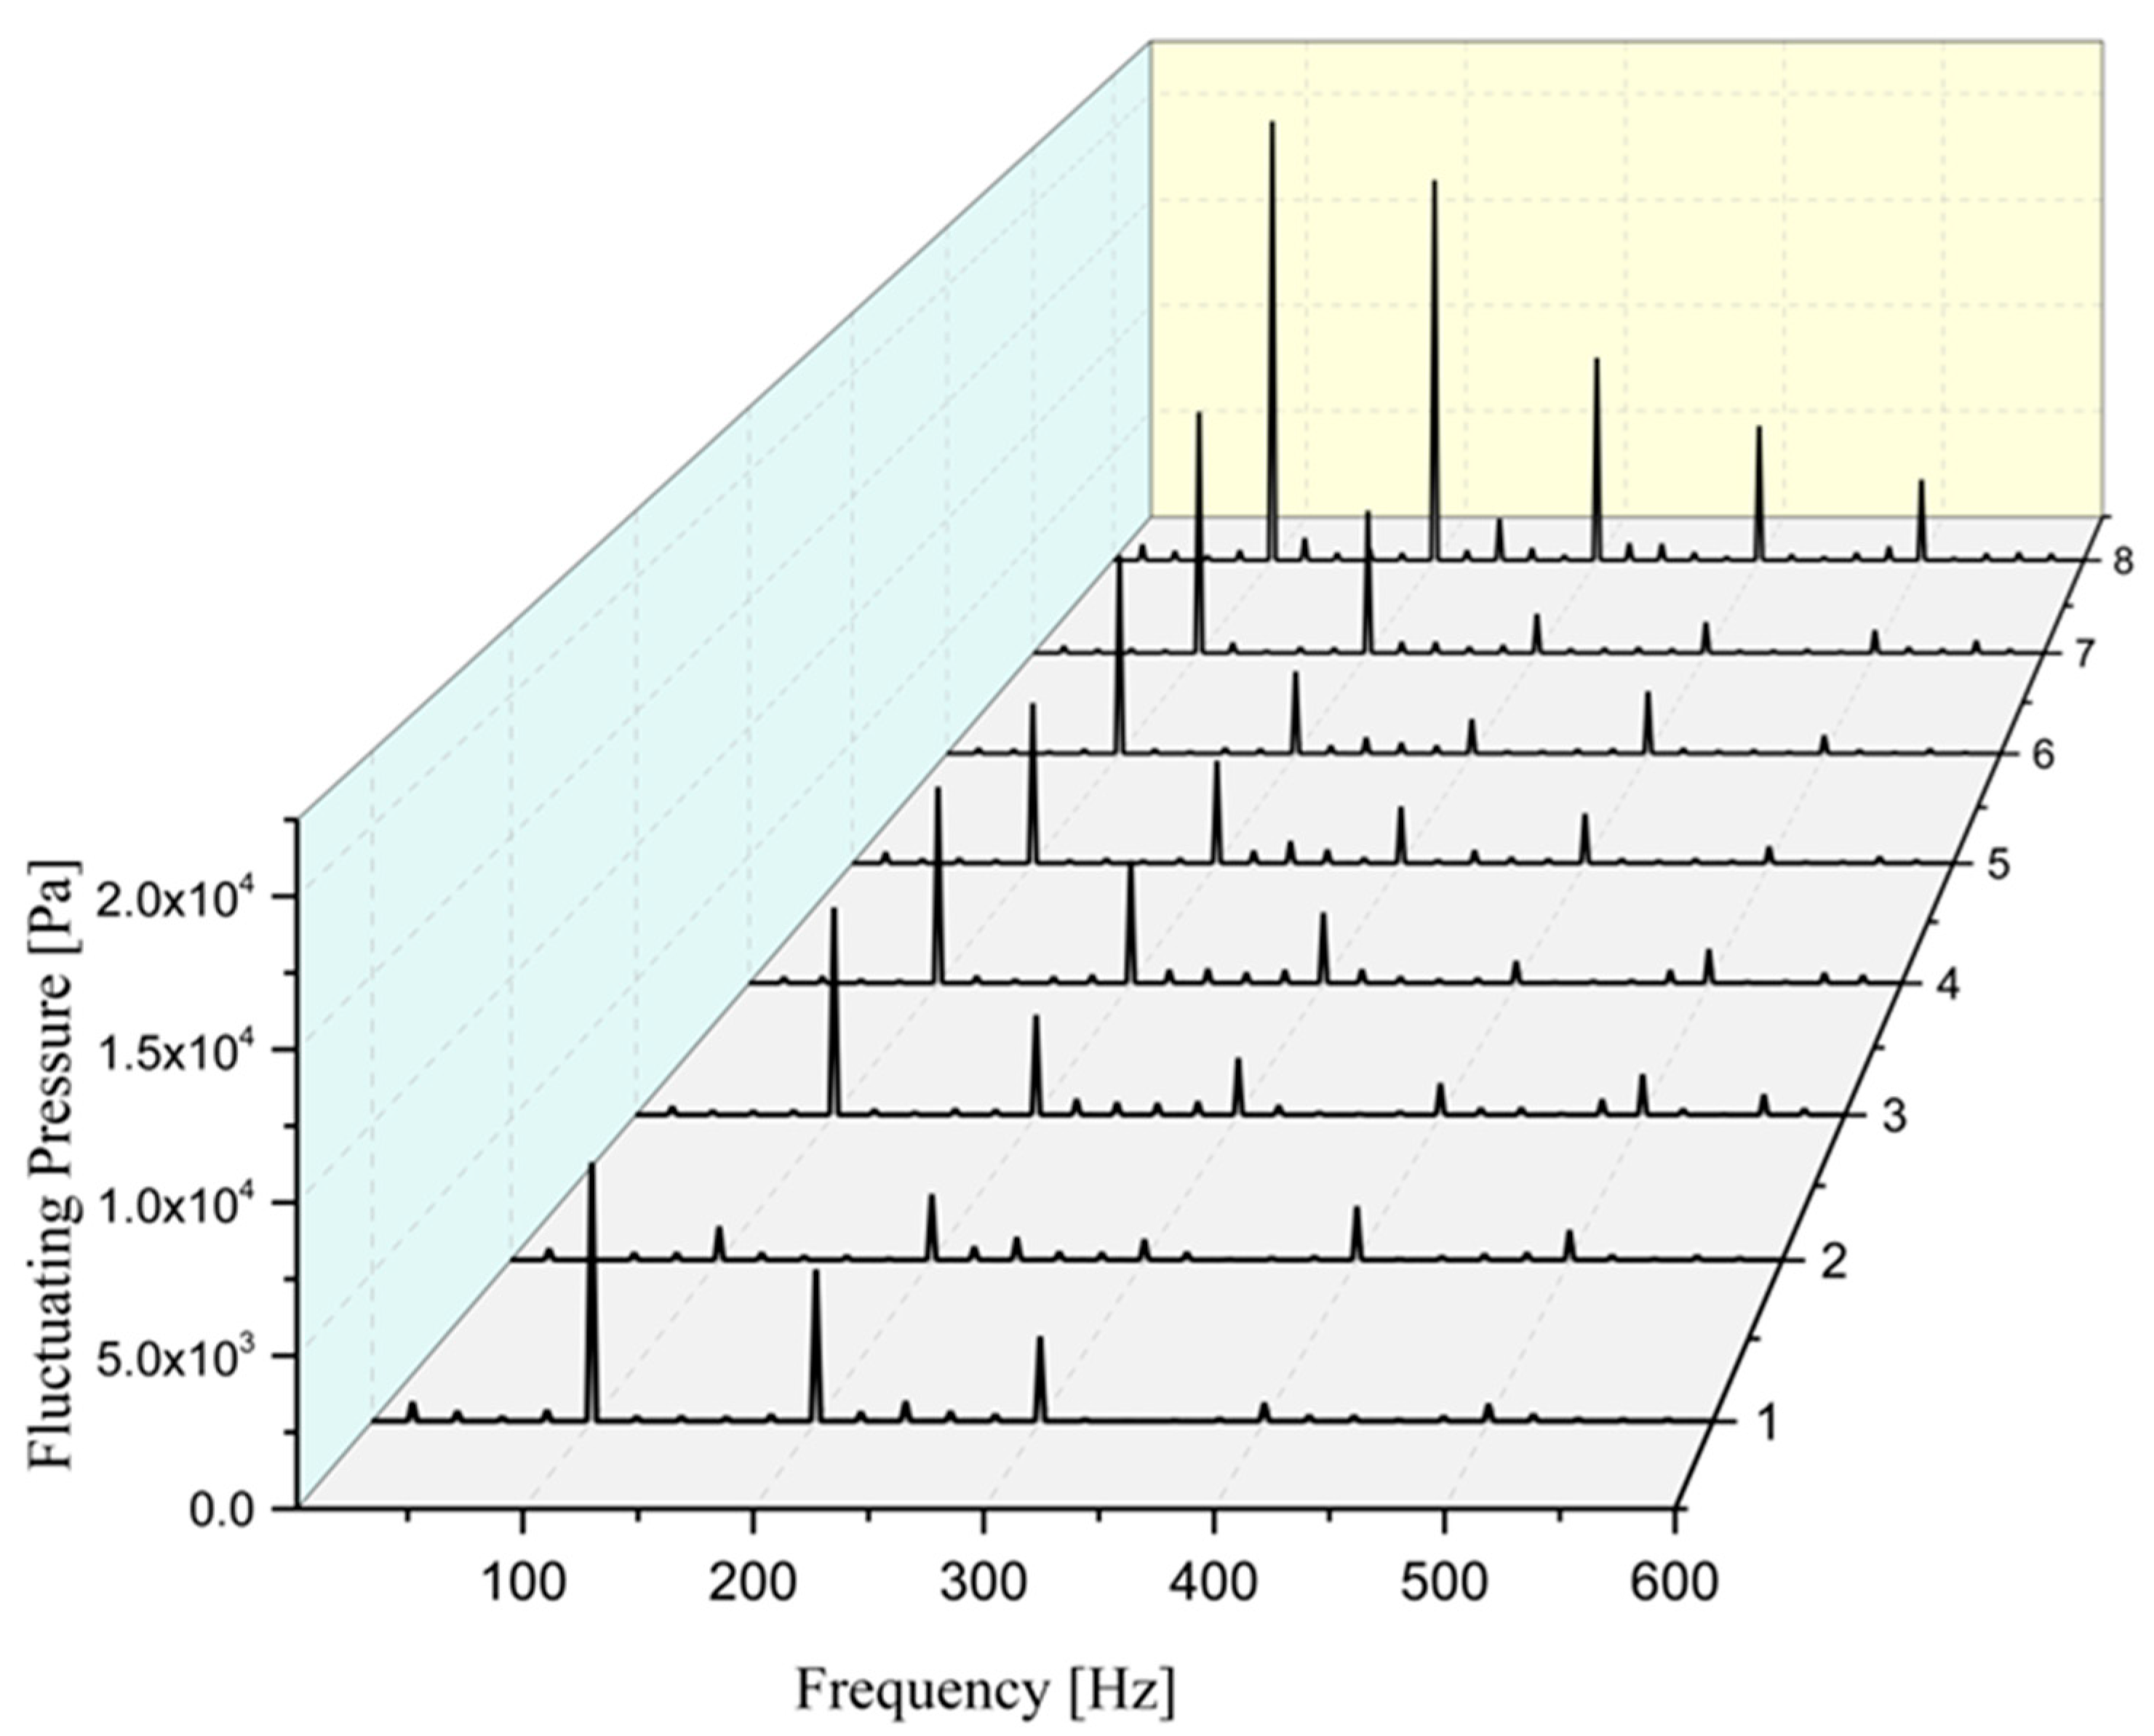
  • The dominant frequency of the fluctuating pressure in the waterjet thruster is the first BPF of the impeller. Therefore, the natural frequency of the main structure should avoid integer multiples of the BPF to improve the operational stability of the waterjet. The hydrodynamic loads near the tip of the blade are high and the flow in the blade tip clearance region is complex. The amplitude of the fluctuating pressure in the blade tip clearance region is significantly higher than that at the rotor outlet and the stator inlet. The maximum fluctuating pressure value is located at the tip clearance region, close to the blade inlet edge.
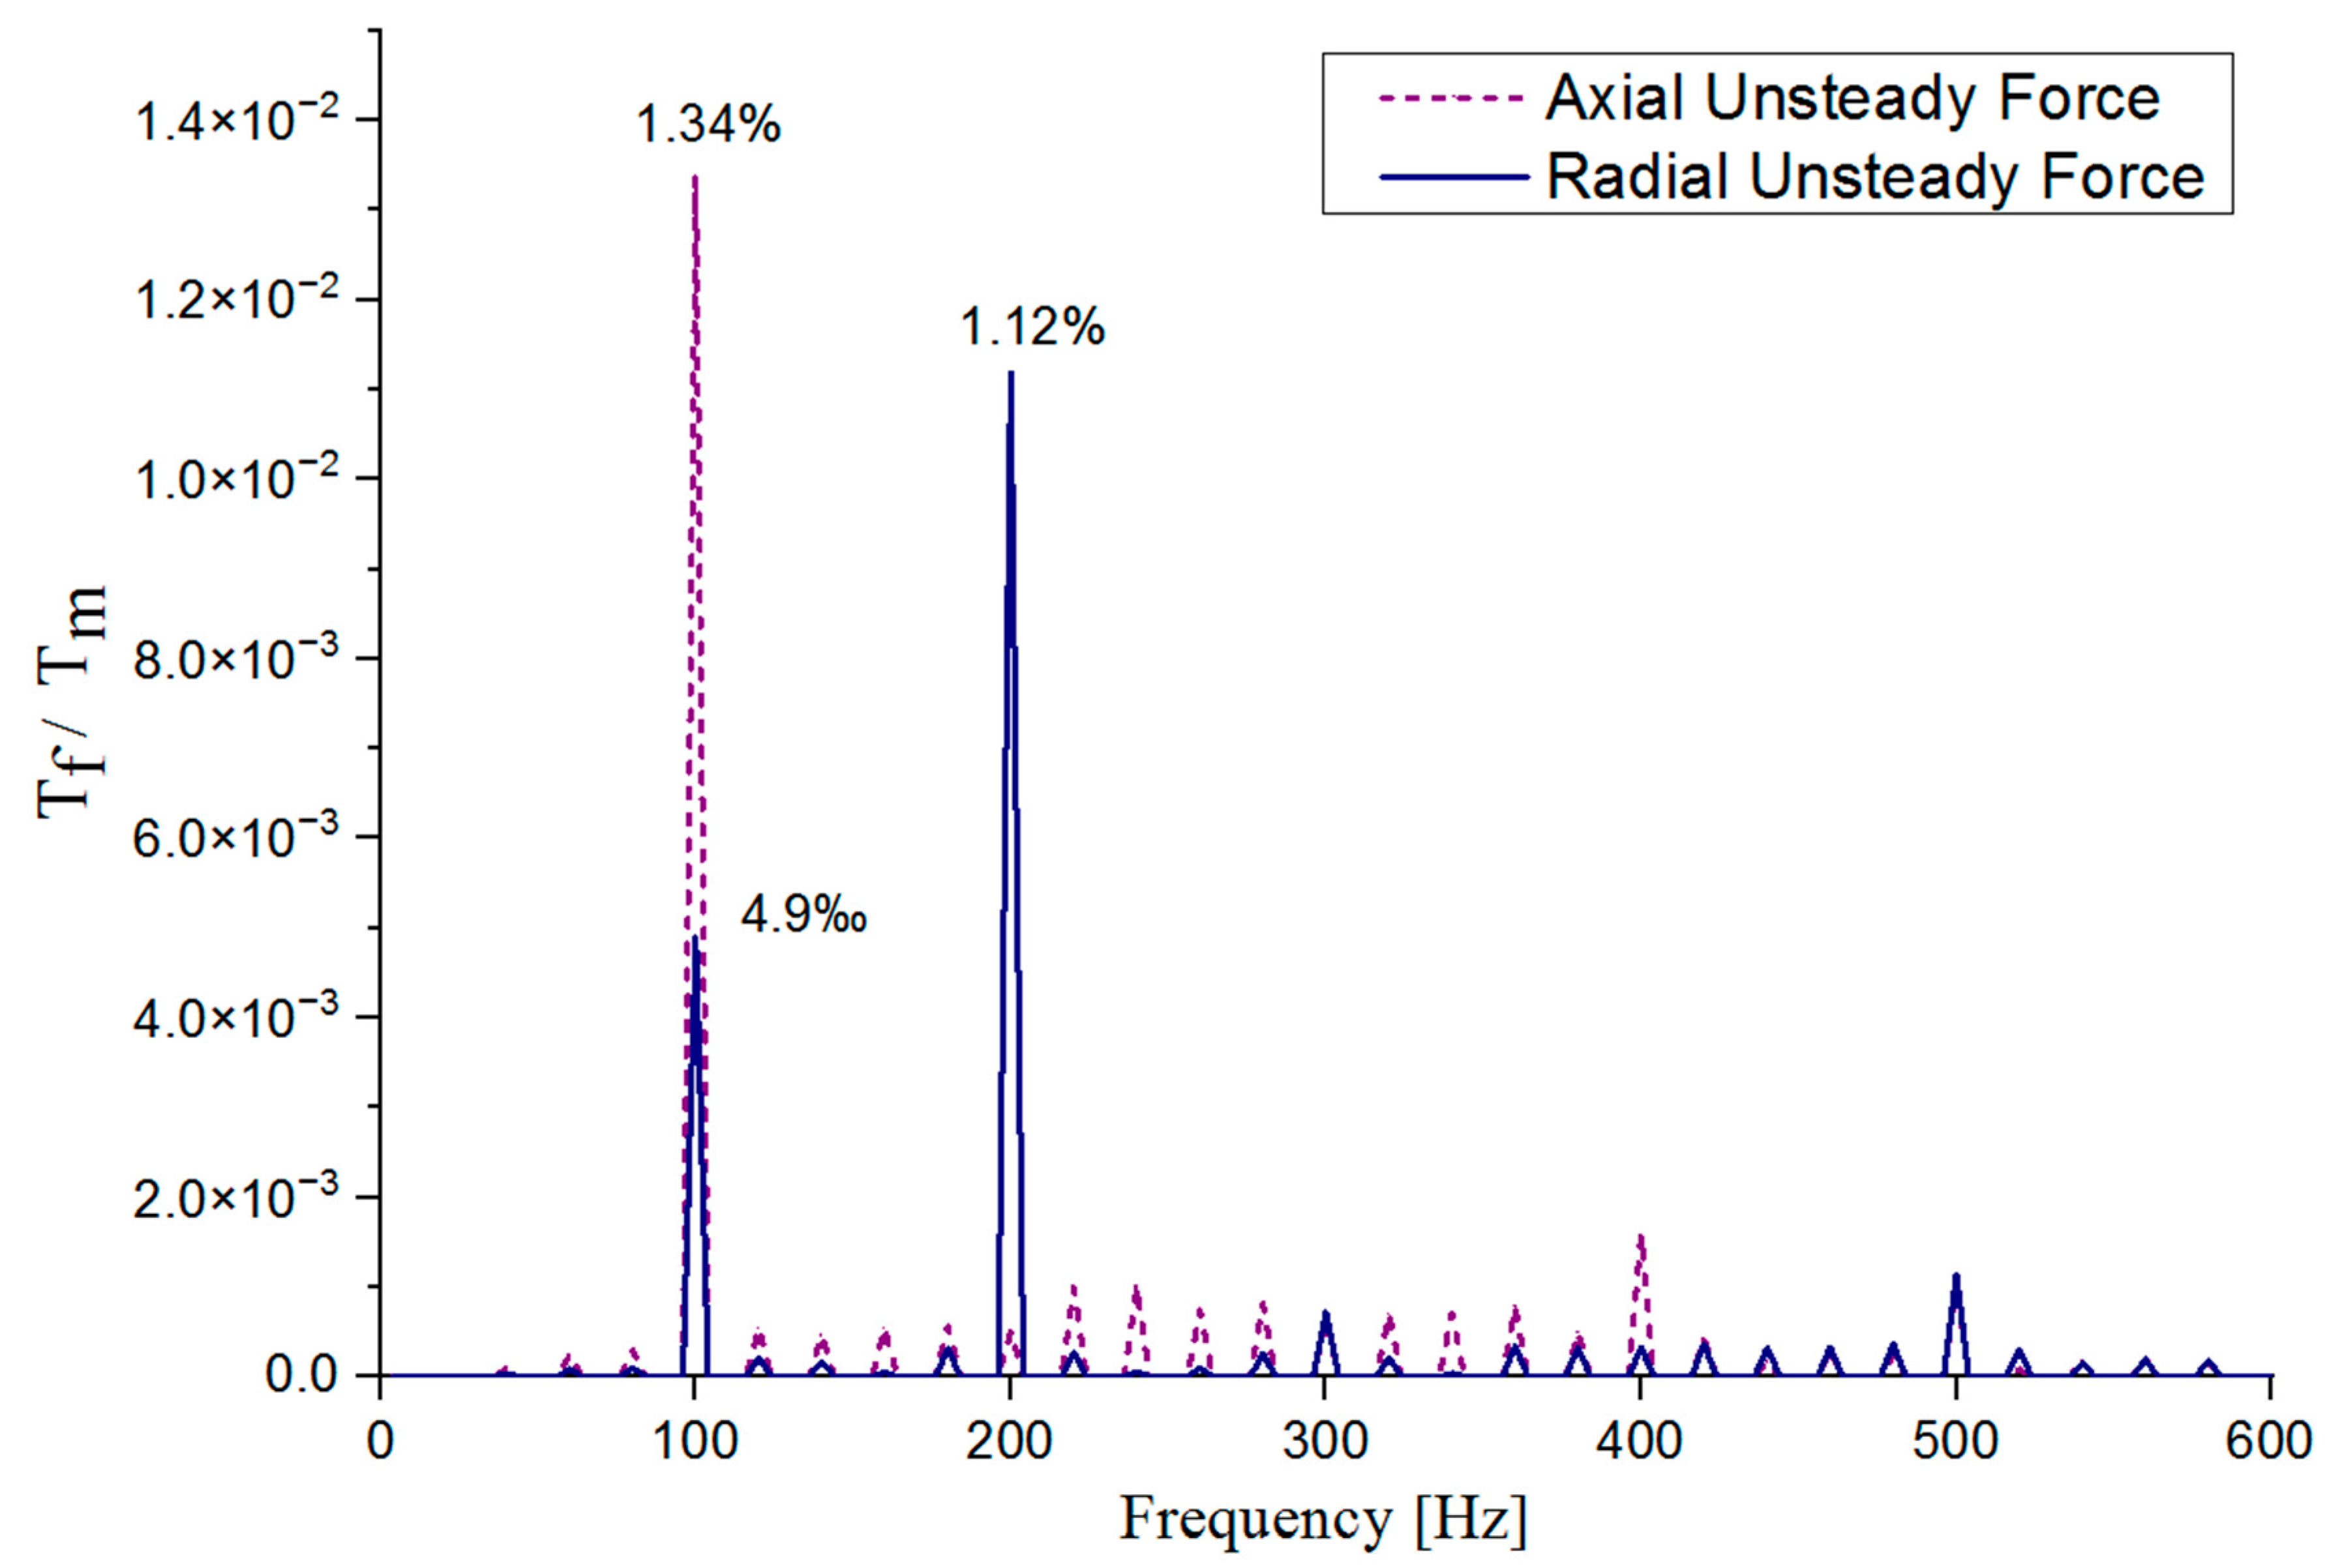
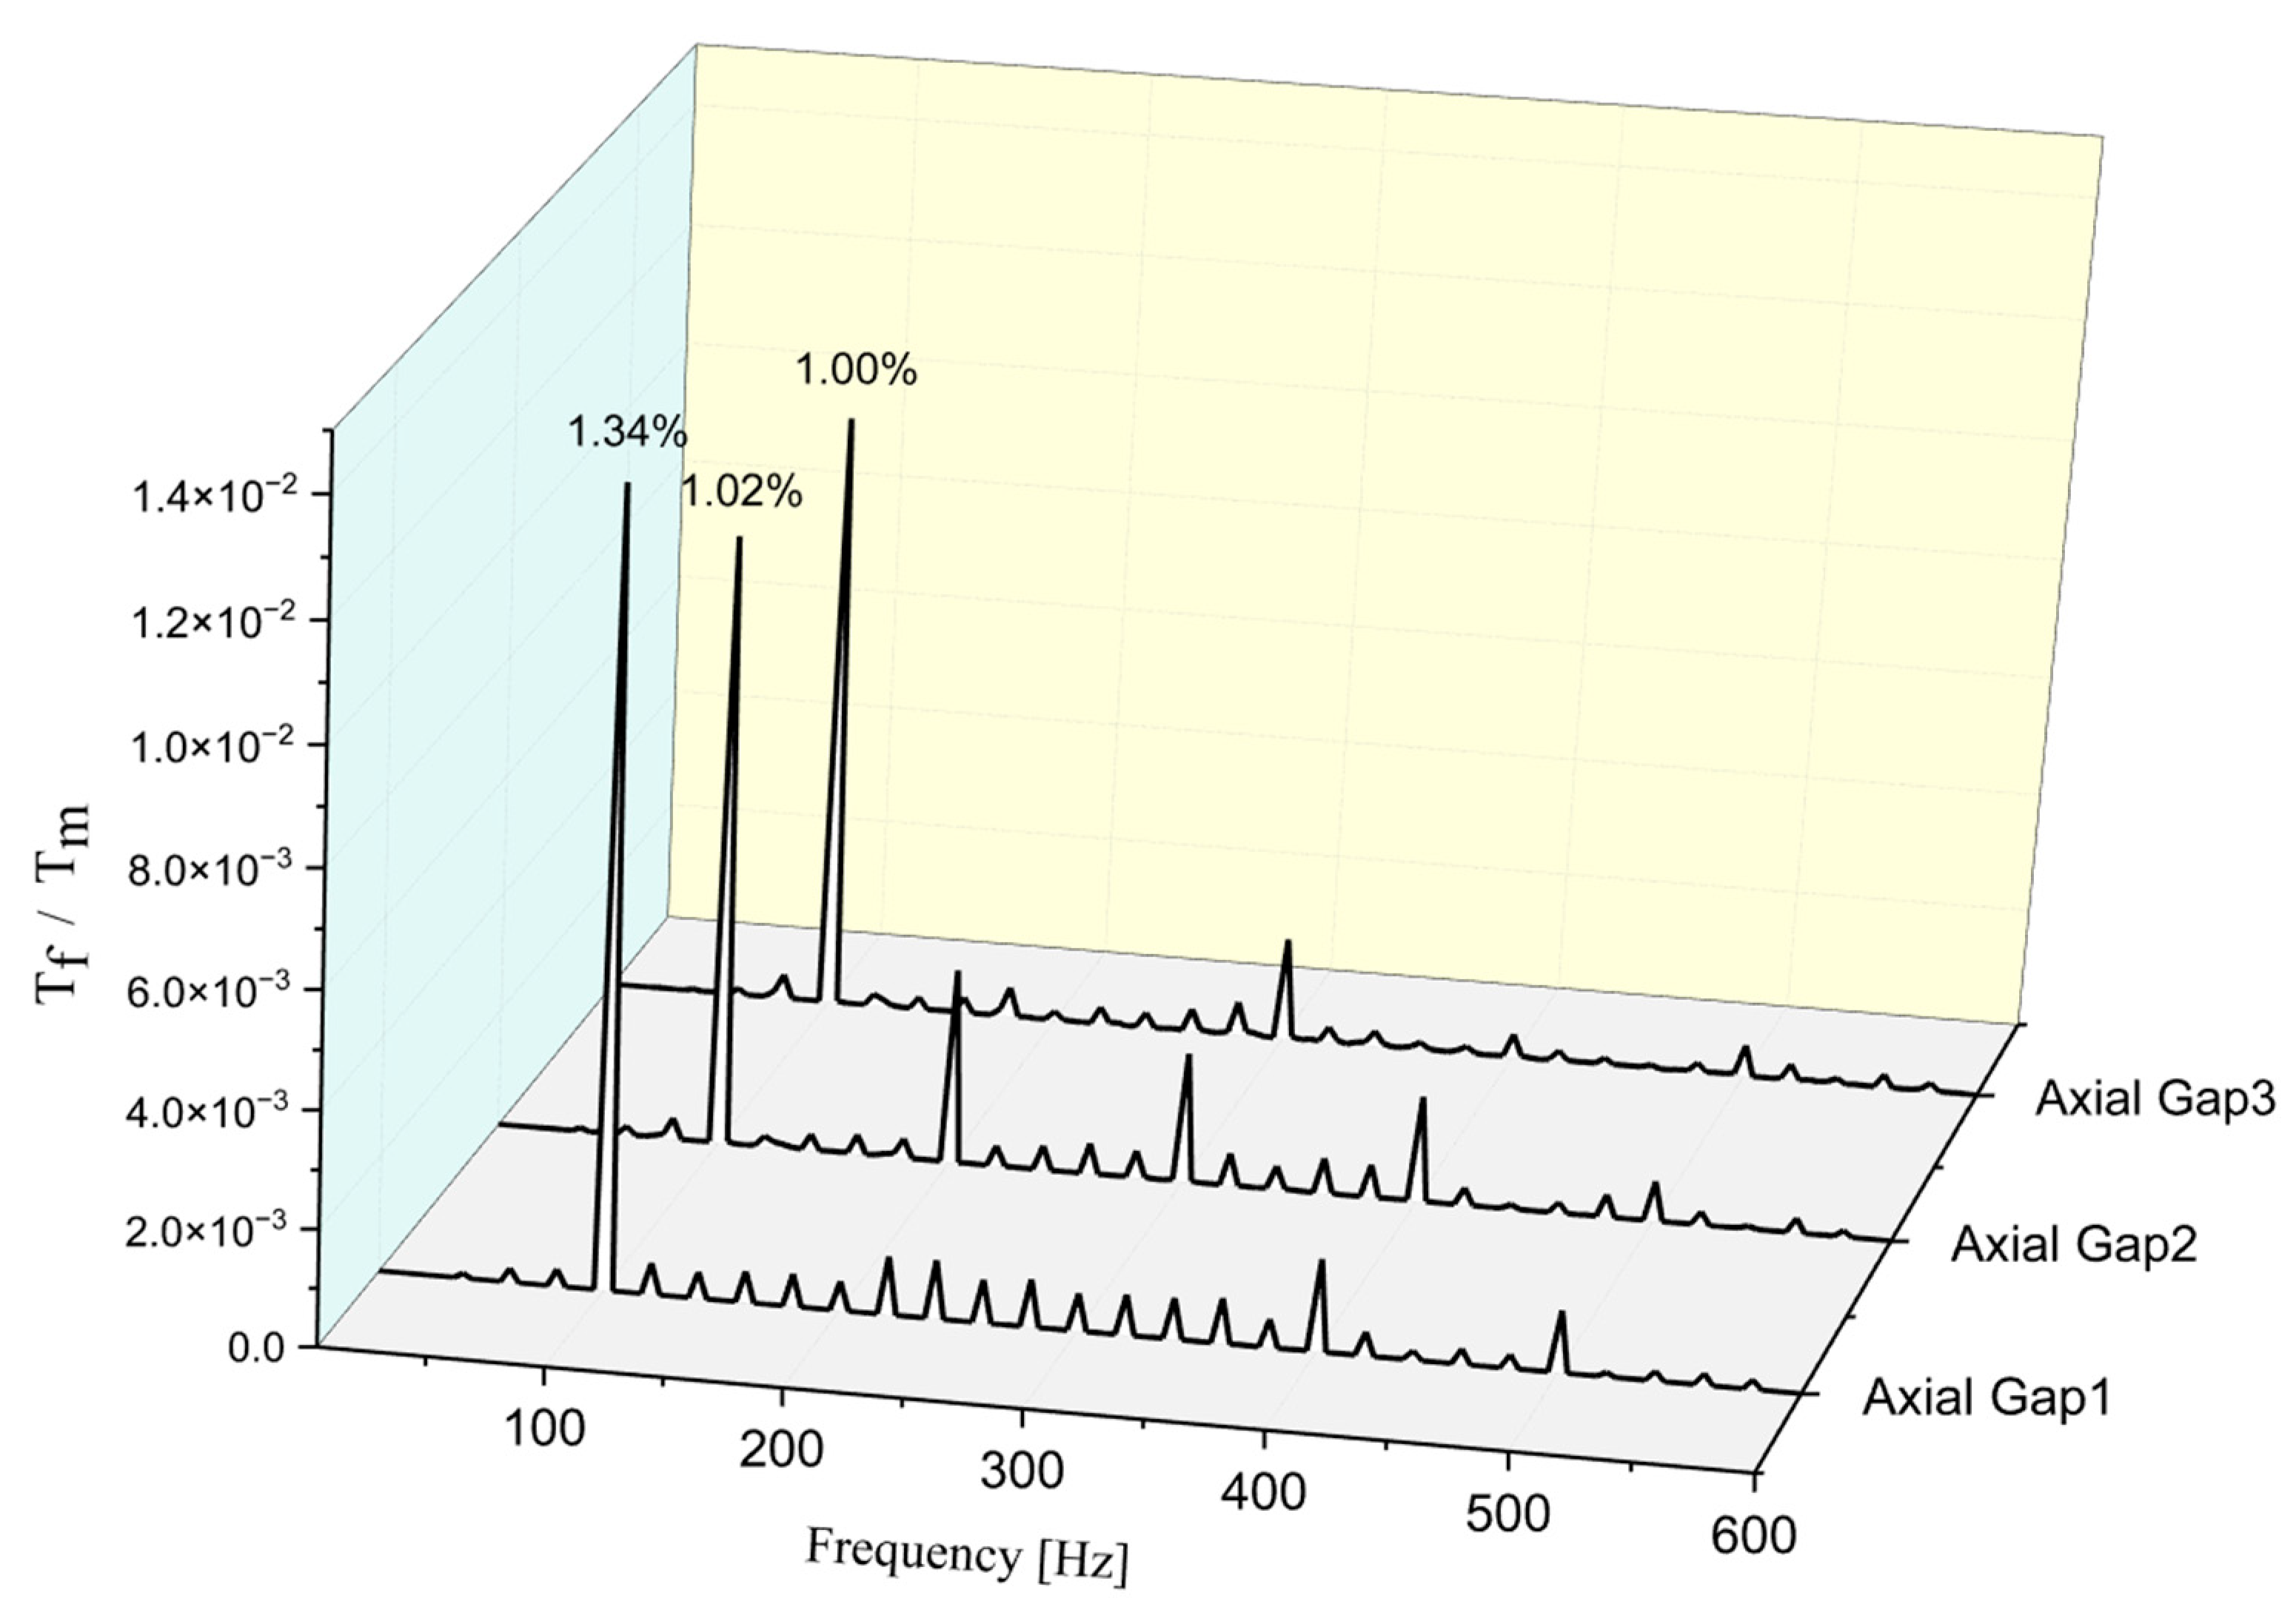
  • The axial flow velocity at the inlet duct to the rotor decreases gradually from bottom to top. Unsteady radial and axial forces are generated during the pump’s rotation operation. The main frequency of the unsteady axial force of the impeller occurs at the 1× shaft frequency, and the amplitude is 1.34% of the blade thrust. The main frequency of the unsteady radial force of the impeller occurs at 2BPF, where the amplitude is 1.12% of the blade thrust.
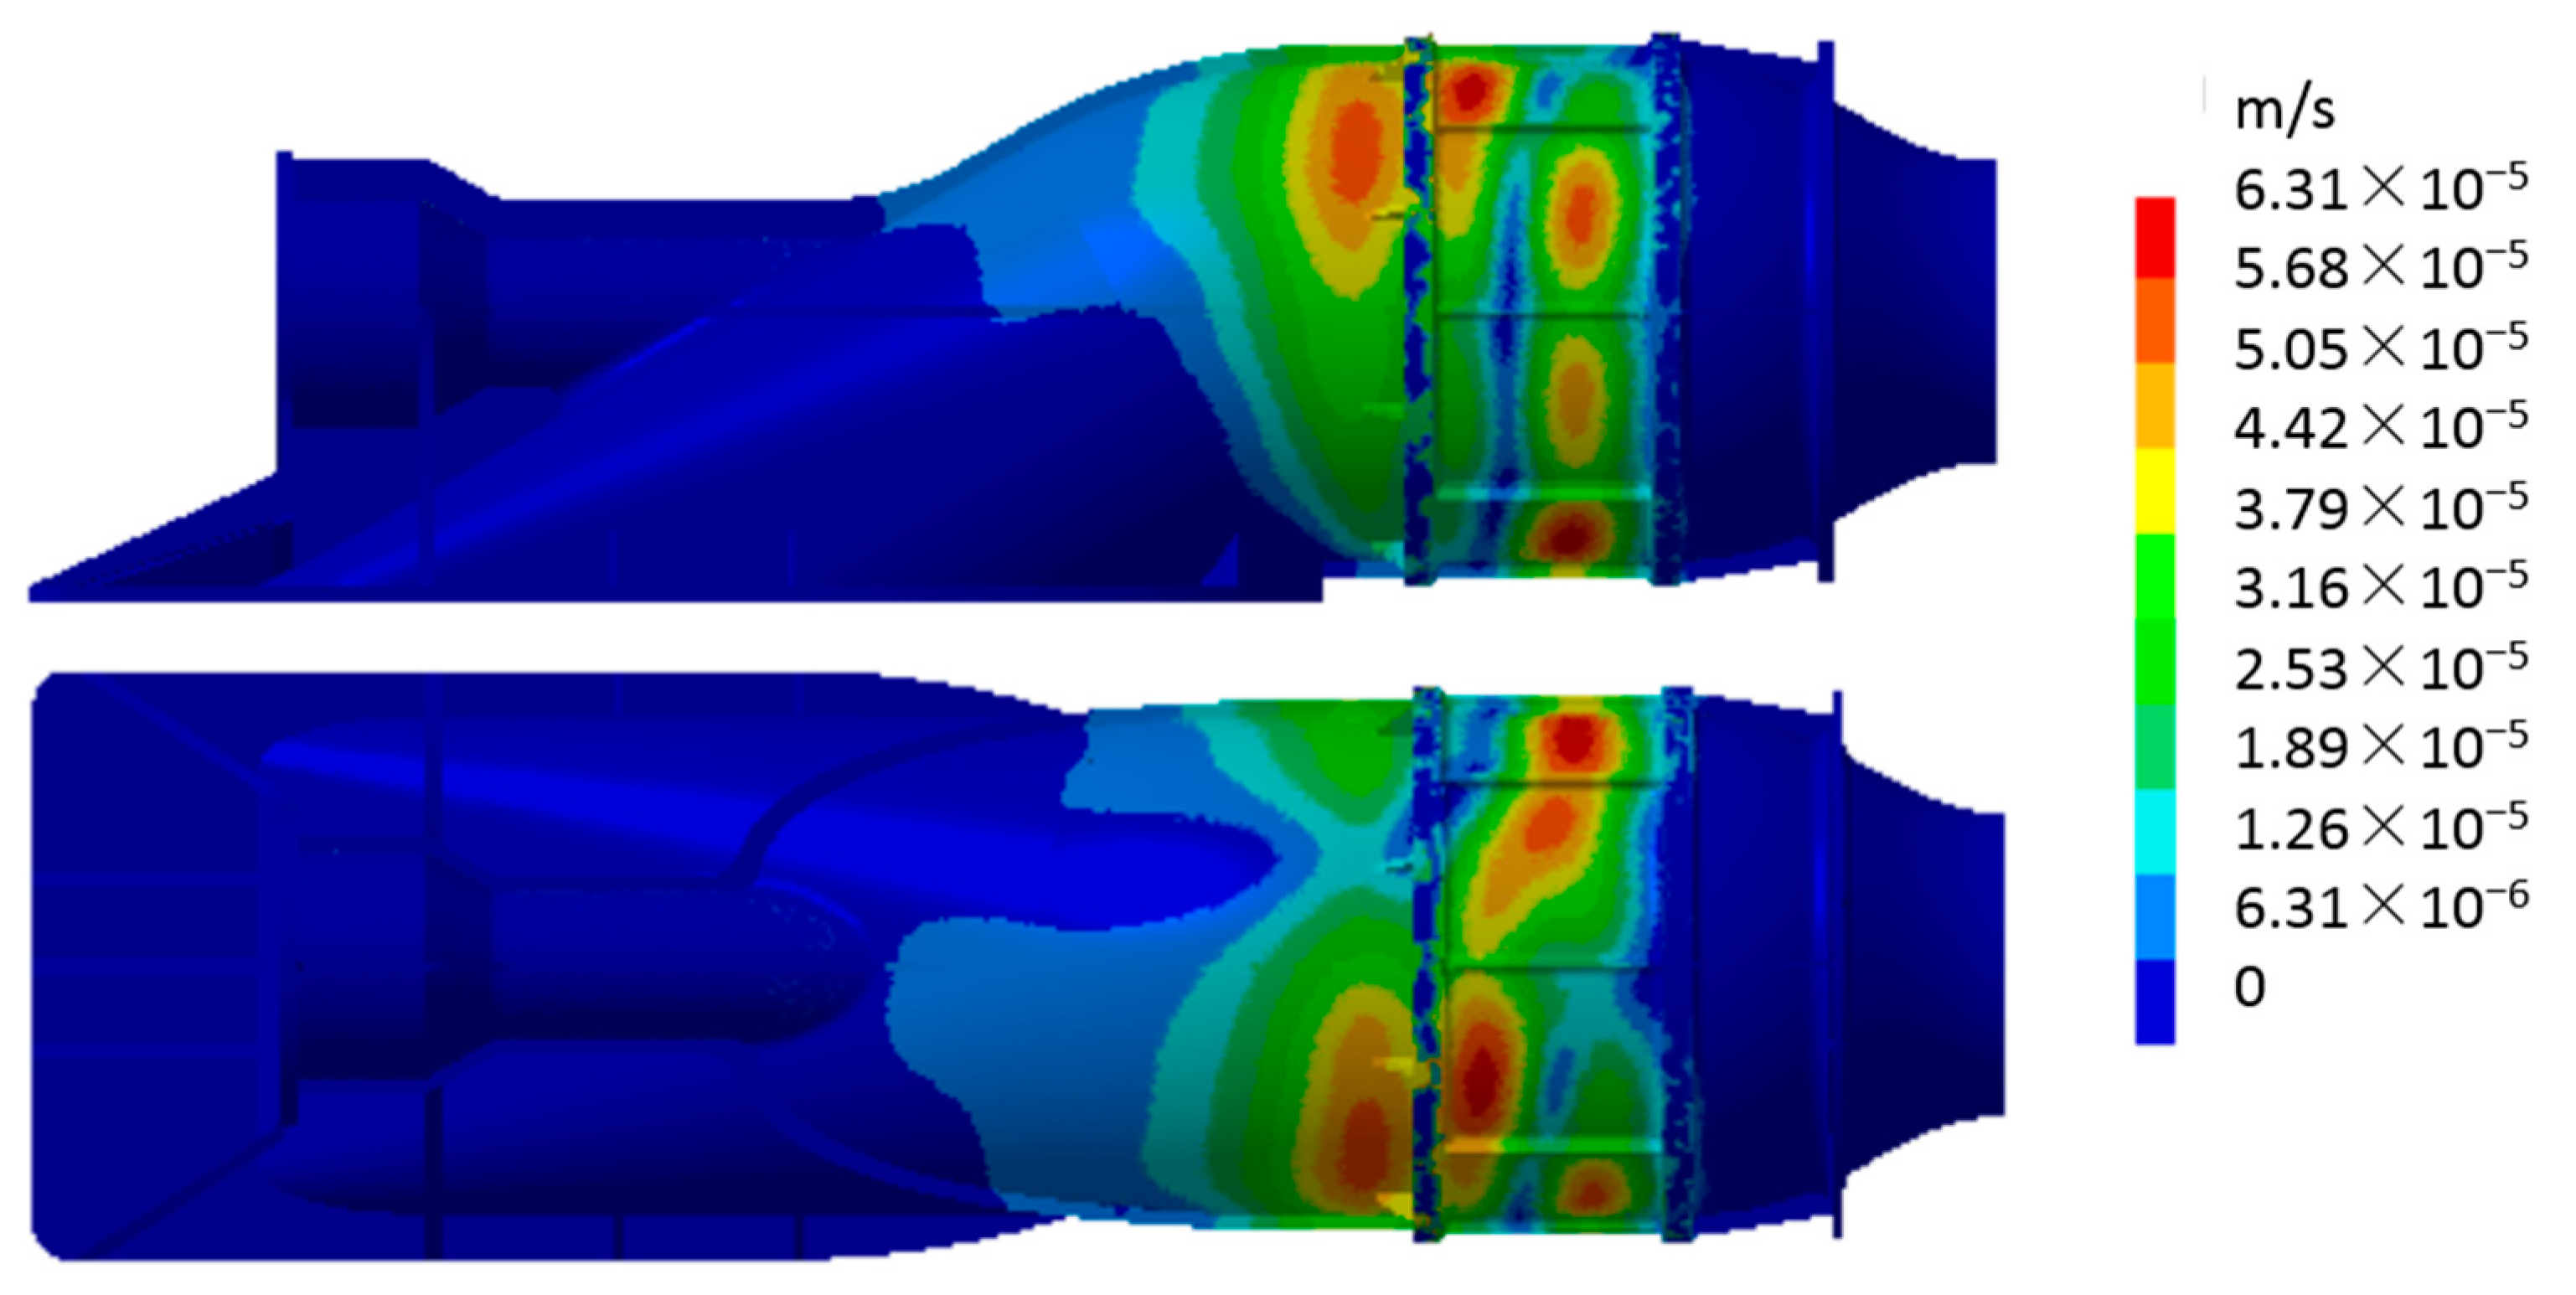
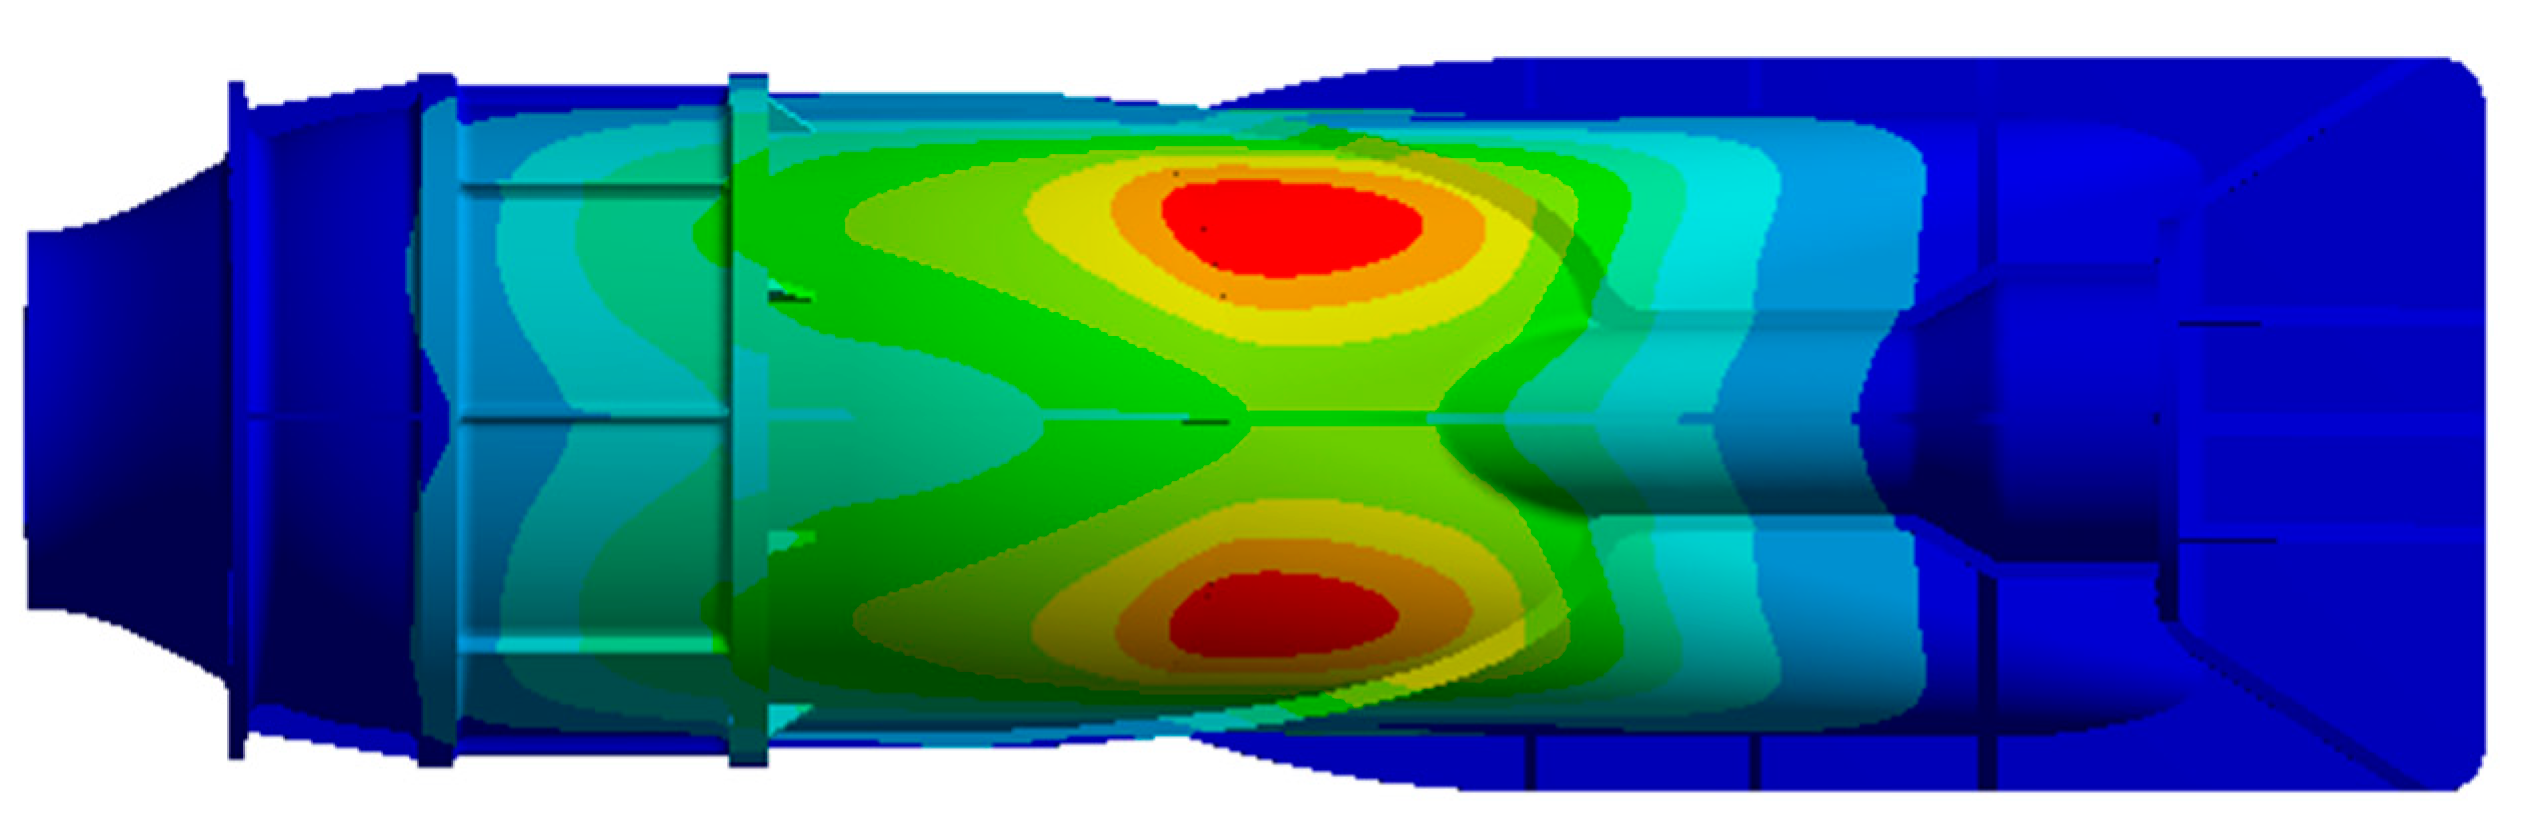
  • At 1BPF, the maximum vibration velocity on the surface of the pump case occurs near the rotor section. This is consistent with the maximum fluctuating pressure here, and so this is the key position for vibration and noise control. For example, the flow-induced vibration of the structure can be weakened by increasing the wall thickness and adding stiffeners.
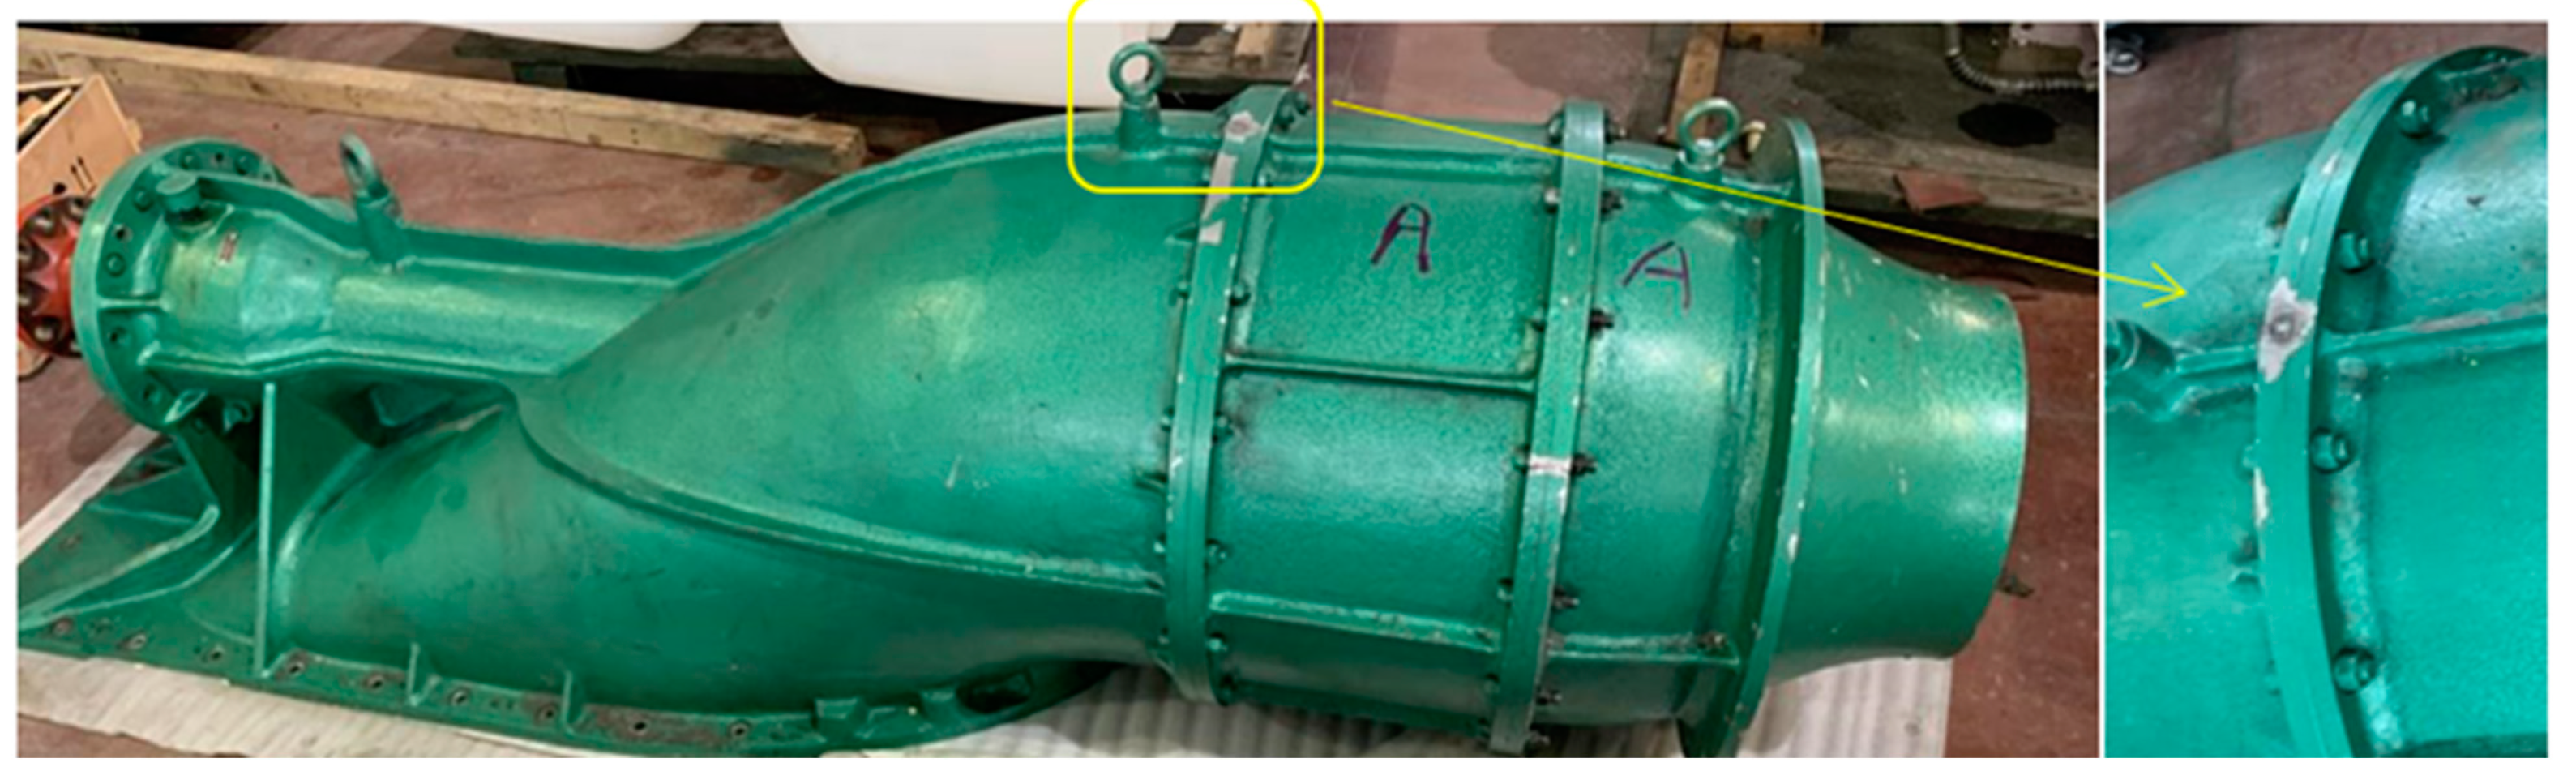
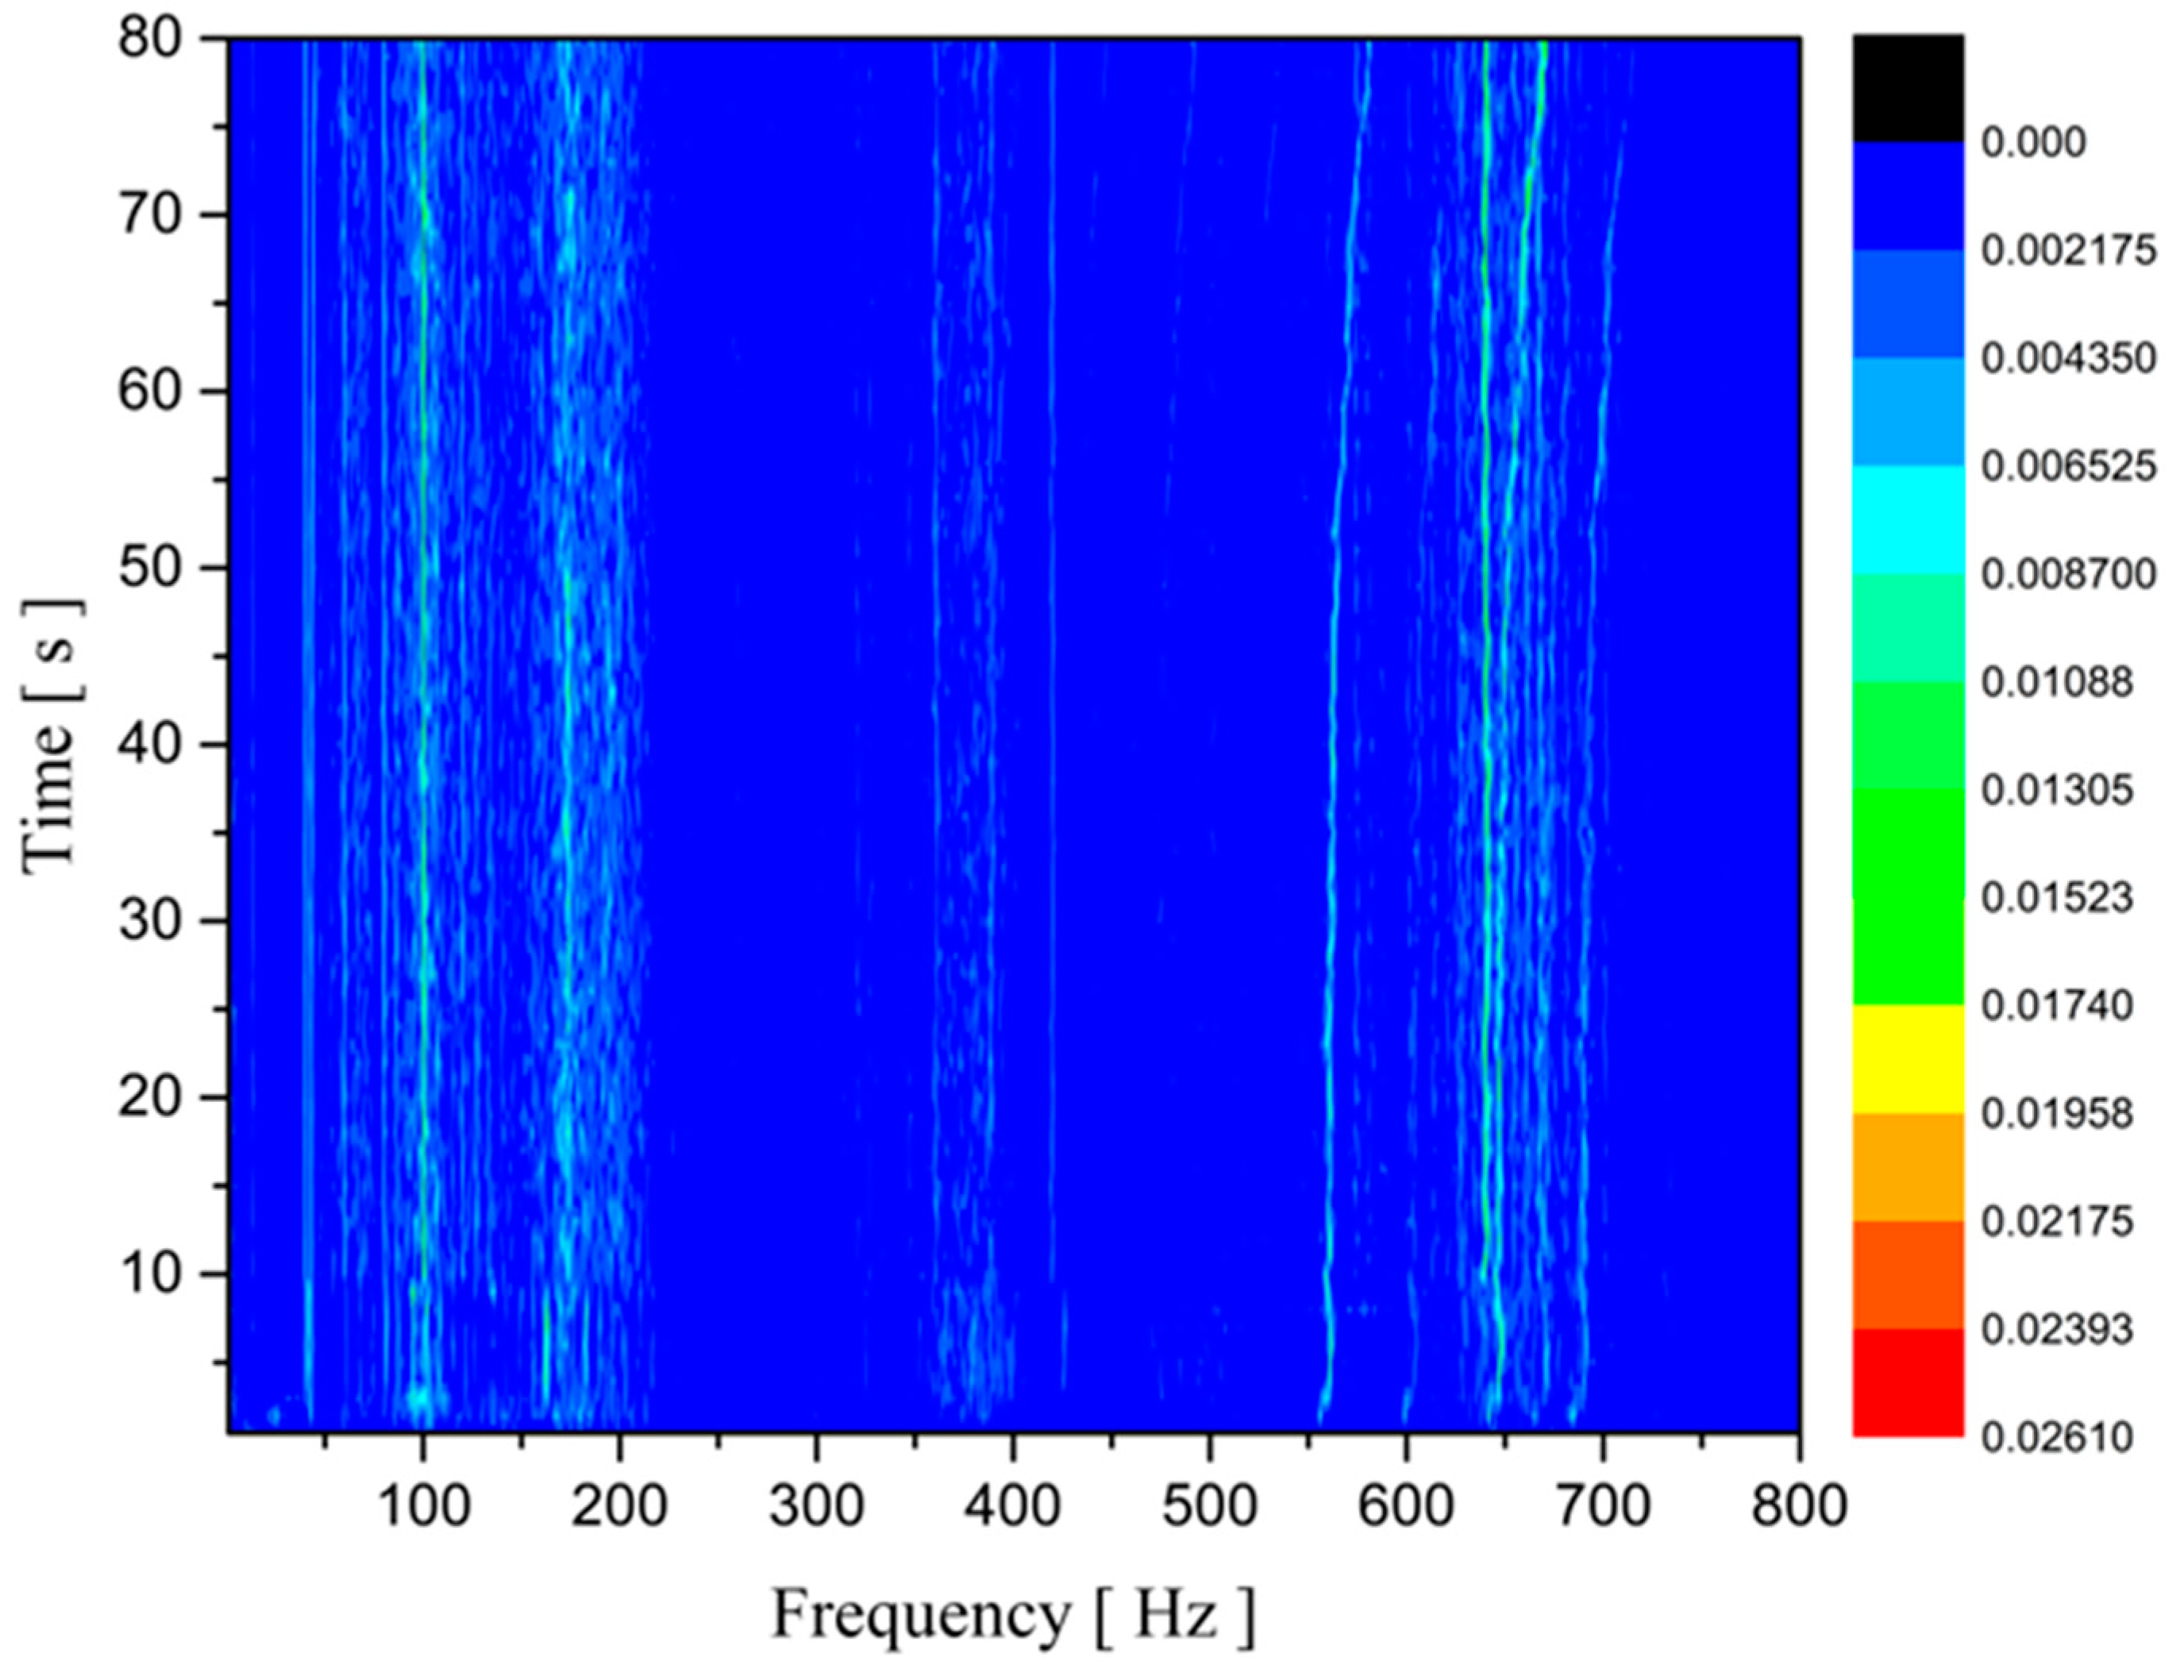
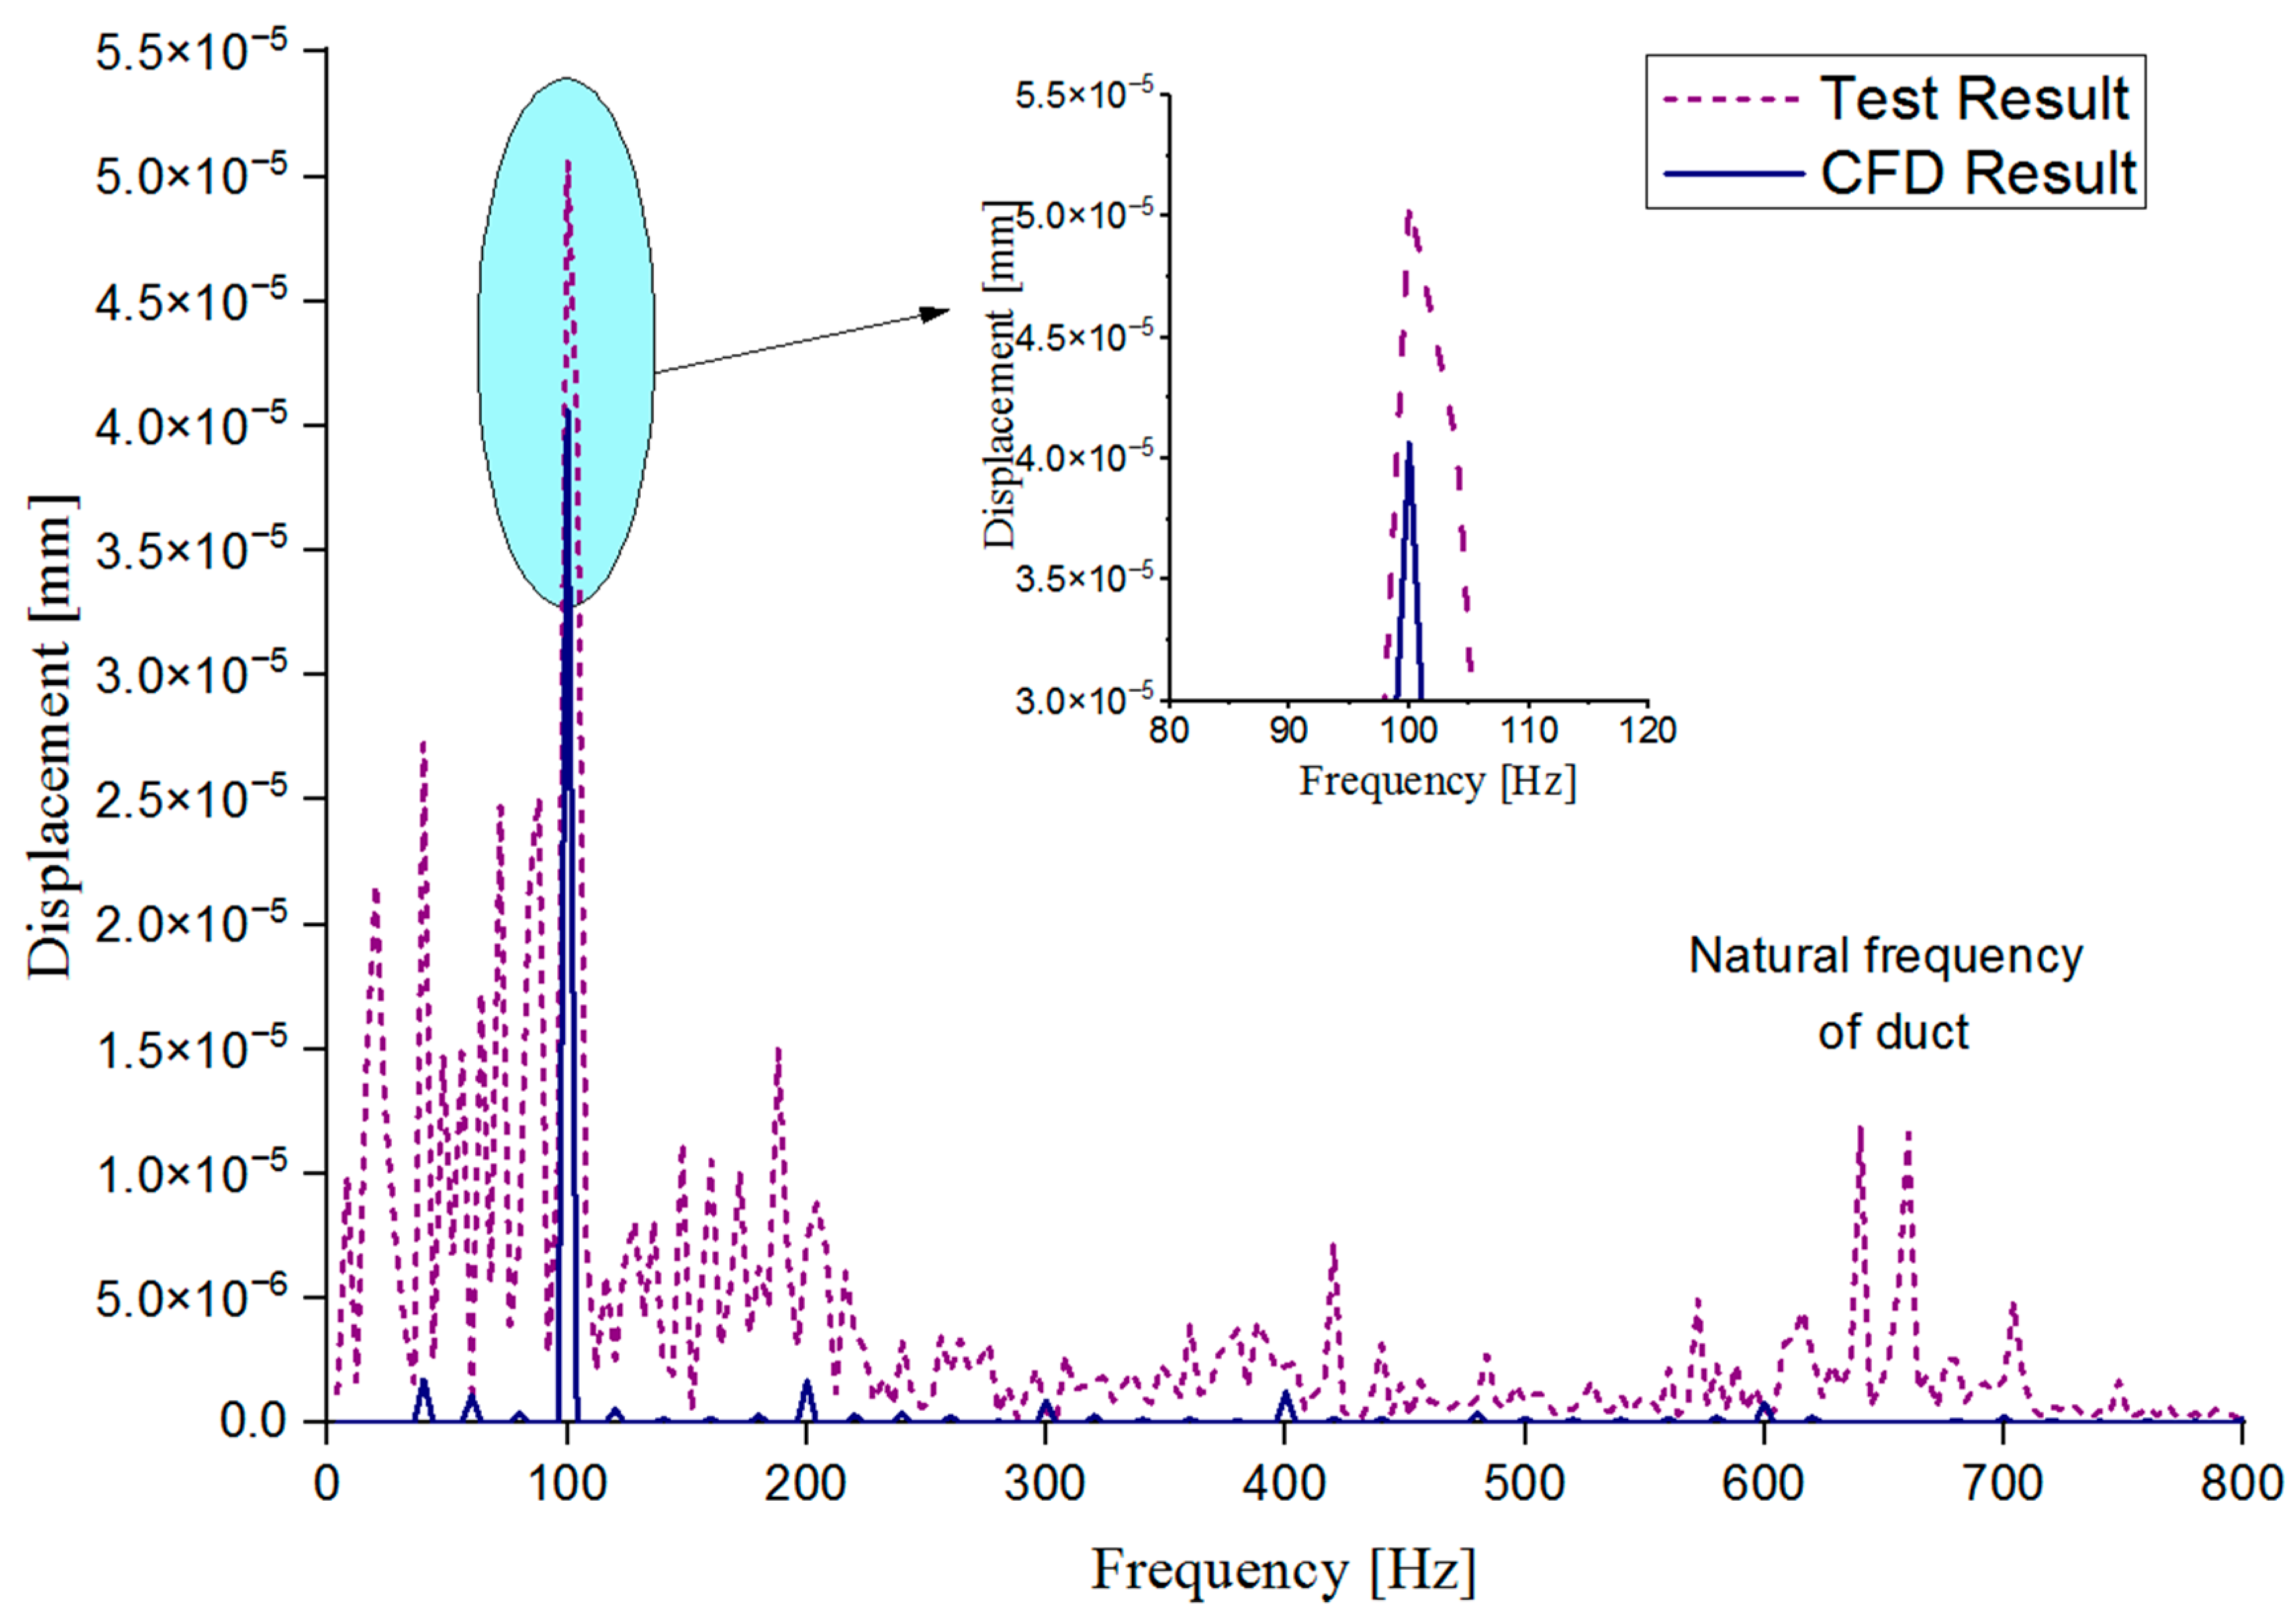
  • On the pump case flange, there are more discrete line spectra in the measured vibration displacement response than in the numerical calculation results. This means that in the actual tests, there are more types of excitation, and the real physical mechanism is more complicated. At 1BPF, the test results are 25% higher than the numerical results.
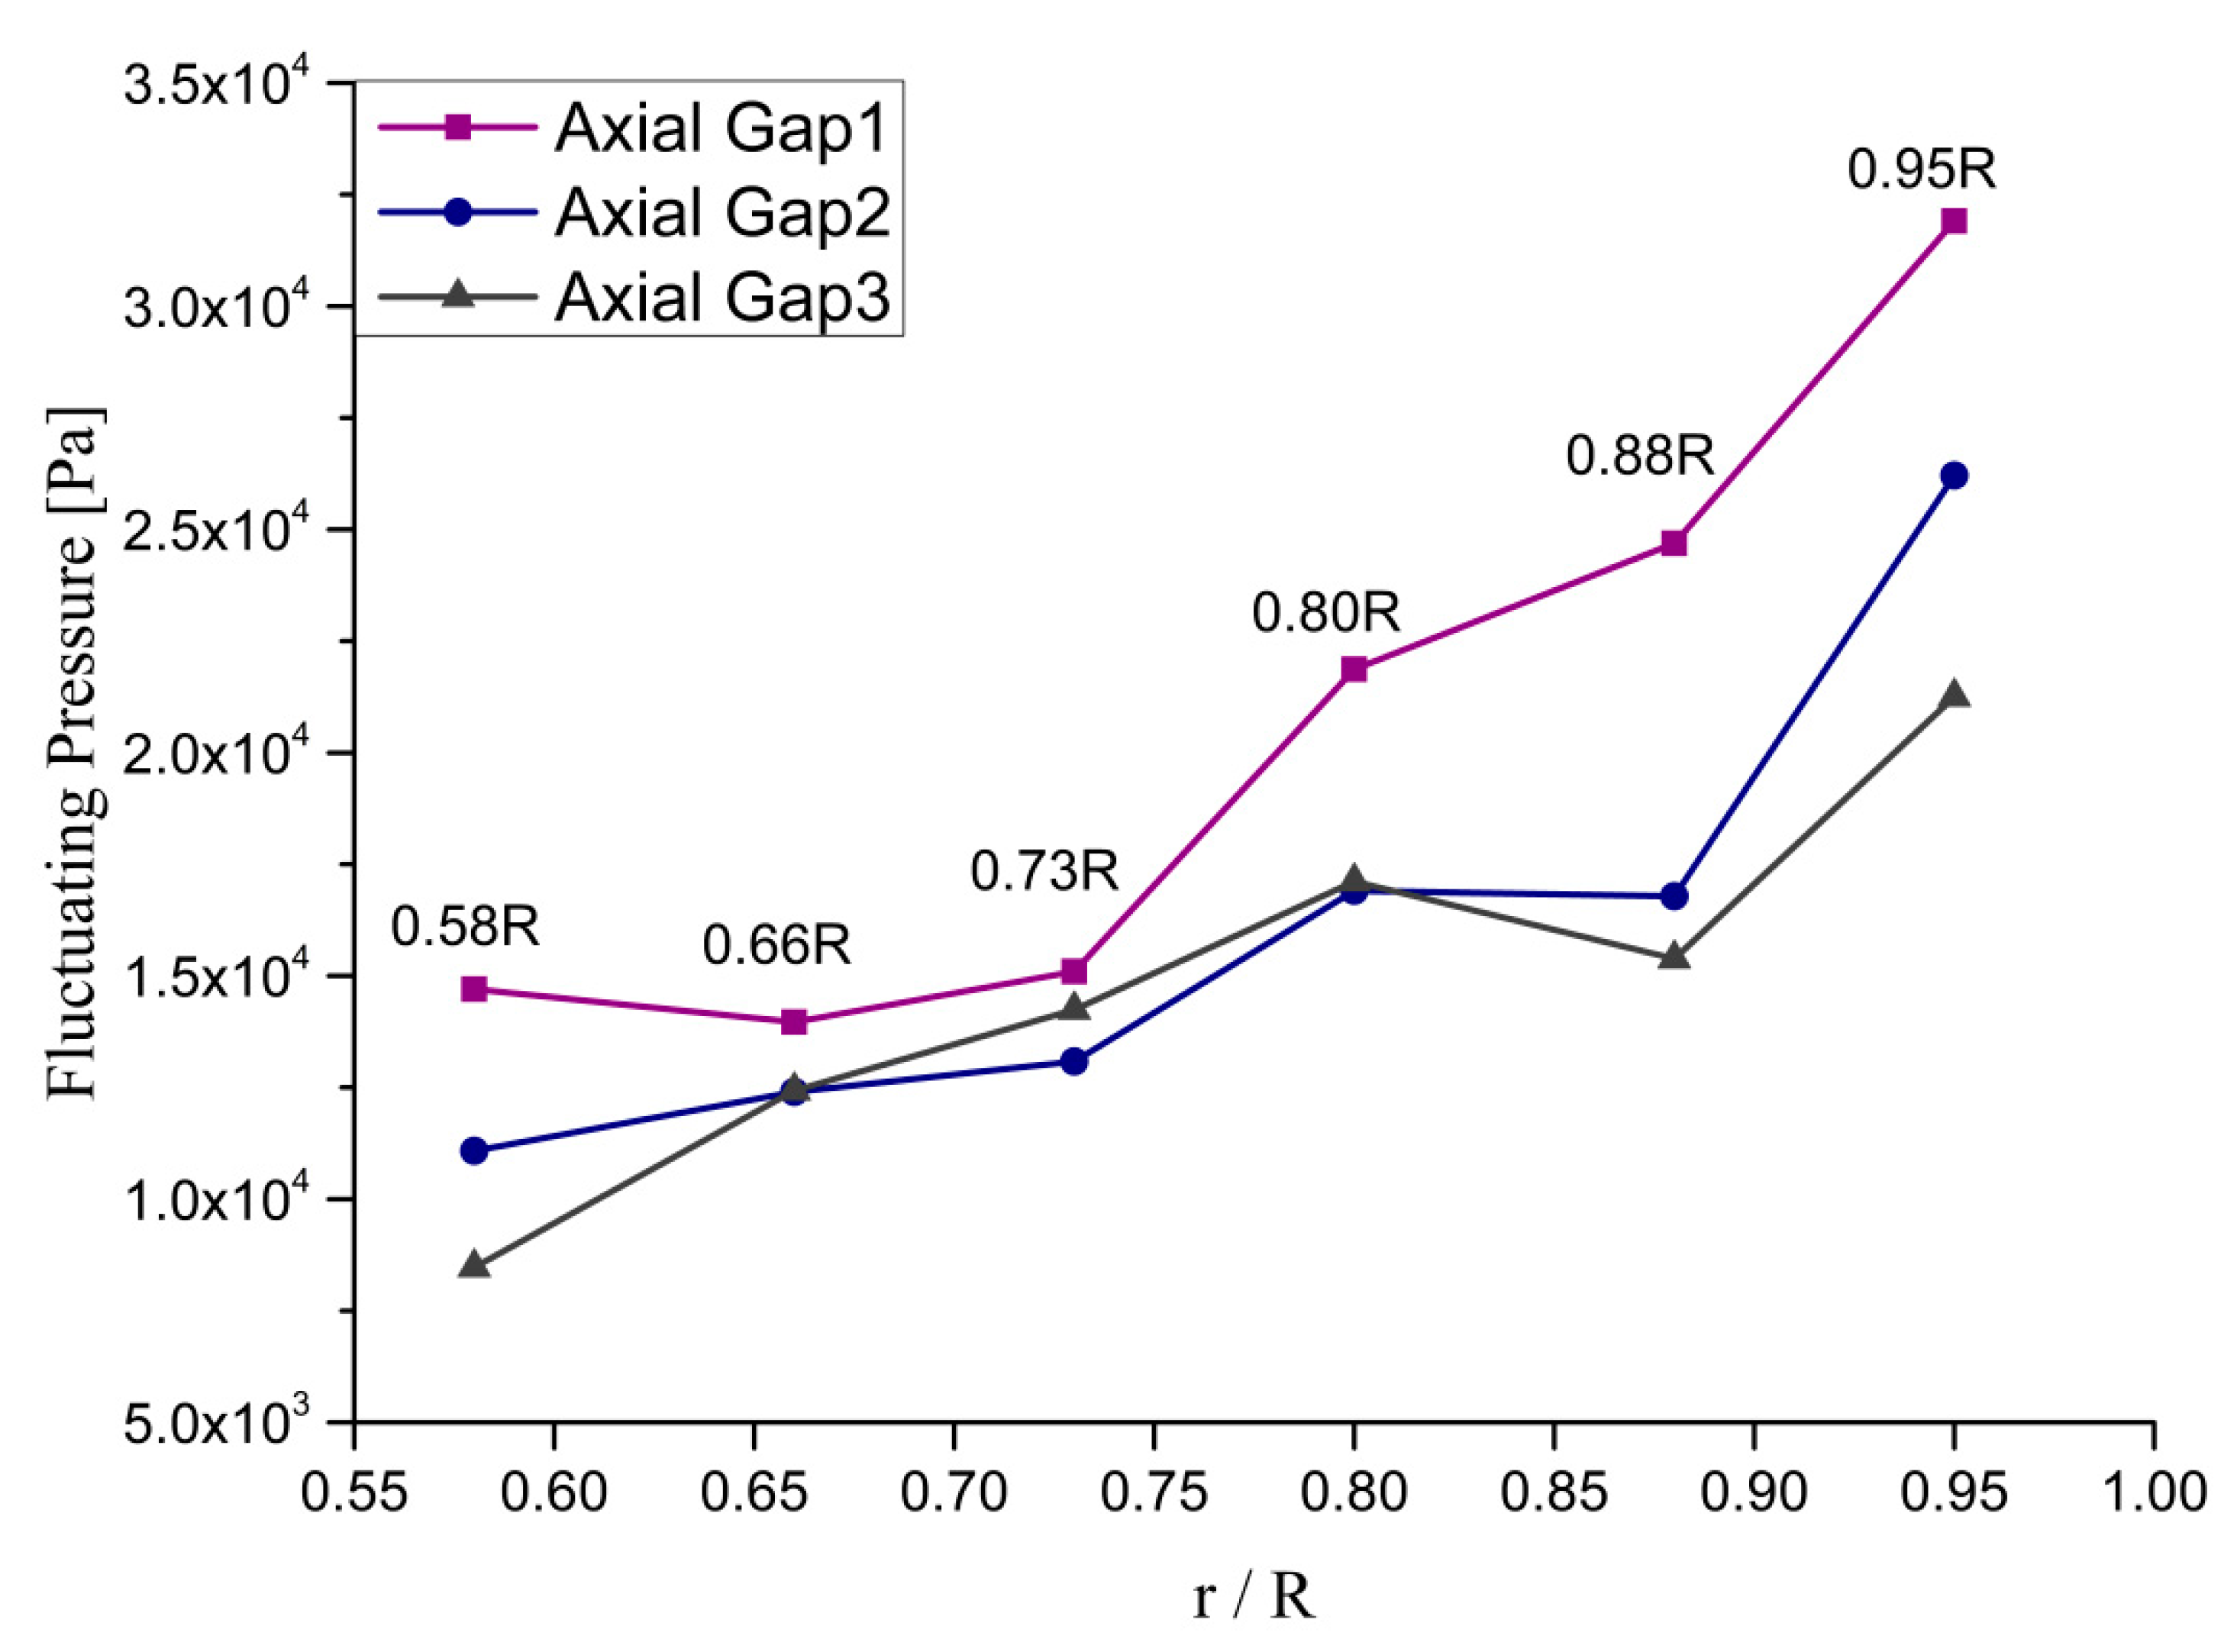
  • As the axial gap between the rotor and the stator increases, the fluctuating pressure on the leading edge of the stator decreases, and the unsteady axial and radial forces are reduced. In addition, the displacement response at the measuring point gradually decreases, which shows that increasing the axial gap is beneficial to weakening the flow-induced vibration response of the waterjet.

Author Contributions

Conceptualization, Y.D. and Z.L.; methodology, Y.D., Z.L. and W.Z.; software, J.C.; validation, Z.L. and J.L.; investigation, Y.D.; data curation, Z.L.; writing—original draft preparation, Y.D.; writing—review and editing, W.Z., J.L. and J.C. All authors have read and agreed to the published version of the manuscript.

Funding

This research received no external funding.

Institutional Review Board Statement

This study did not require ethical approval.

Informed Consent Statement

Not applicable.

Conflicts of Interest

The authors declare no conflict of interest.

Nomenclature

F i   Volume force
p   Pressure
τ   Torque of the impeller
Q  Measured flow rate
T  Shaft torque
H  Pump head
Dr  Rotor Diameter
KQ  Torque coefficients
P   Shaft power
η   Efficiency
p j , p i   Static pressures
V j , V i   Outlet velocities
ΔT  Time step
BPF  Blade passing frequency
n  Rotation speed
KT  Thrust coefficients
ρ   Density of water

References

  1. Erbe, C.; Marley, S.A.; Schoeman, R.P.; Smith, J.N.; Trigg, L.E.; Embling, C.B. The effects of ship noise on marine mammals—A review. Front. Mar. Sci. 2019, 6, 606. [Google Scholar] [CrossRef] [Green Version]
  2. Payne, R.; Webb, D. Orientation by means of long range acoustic signaling in baleen whales. Ann. N. Y. Acad. Sci. 1971, 188, 110–141. [Google Scholar] [CrossRef] [PubMed]
  3. ICES. Underwater Noise of Research Vessels: Review and Recommendations; Mitson, R.B., Ed.; ICES Cooperative Research Report No. 209; ICES: Copenhagen, Denmark, 1995; 61p, ISBN 978-87-7482-463-3. [Google Scholar] [CrossRef]
  4. U.S. Department of Homeland Security. 2017 Recreational Boating Statistics; Report No. COMDTPUB P16754.31; U.S. Department of Homeland Security: Washington, DC, USA, 2018. [Google Scholar]
  5. Erbe, C. Underwater noise of small personal watercraft (jet skis). J. Acoust. Soc. Am. 2013, 133, EL326–EL330. [Google Scholar] [CrossRef] [PubMed] [Green Version]
  6. Carlton, J. Marine Propellers and Propulsion; Elsevier Ltd.: Amsterdam, The Netherlands, 2007; pp. 357–358. [Google Scholar]
  7. Bulten, N.W.H. Numerical analysis of a waterjet propulsion system. Diss. Abstr. Int. 2006, 68, 5–199. [Google Scholar]
  8. Lu, Y.; Liu, H.; Wang, X.; Wang, H. Study of the operating characteristics for the high-speed water jet pump installed on the underwater vehicle with different cruising speeds. J. Mar. Sci. Eng. 2021, 9, 346. [Google Scholar] [CrossRef]
  9. Dai, C.; Zhang, Y.; Pan, Q.; Dong, L.; Liu, H. Study on vibration characteristics of marine centrifugal pump unit excited by different excitation sources. J. Mar. Sci. Eng. 2021, 9, 274. [Google Scholar] [CrossRef]
  10. Trivedi, C.; Cervantes, M.J. Fluid-structure interactions in Francis turbines: A perspective review. Renew. Sustain. Energy Rev. 2017, 68, 87–101. [Google Scholar] [CrossRef]
  11. Huang, R.; Ye, W.; Dai, Y.; Luo, X.; Wang, Y.; Du, T.; Huang, C. Investigations into the unsteady internal flow characteristics for a waterjet propulsion system at different cruising speeds. Ocean. Eng. 2020, 203, 107218. [Google Scholar] [CrossRef]
  12. Guo, J.; Chen, Z.; Dai, Y. Numerical study on self-propulsion of a waterjet propelled trimaran. Ocean. Eng. 2020, 195, 106655. [Google Scholar] [CrossRef]
  13. Gong, J.; Liu, J.G.; Dai, Y.X.; Guo, C.Y.; Wu, T.C. Dynamics of stabilizer fins on the waterjet-propelled ship. Ocean. Eng. 2021, 222, 108595. [Google Scholar] [CrossRef]
  14. Zhang, Z.; Chen, G.; Gong, J.; Yang, C. Numerical Simulation and Experimental Verification of the Nozzle Flow of a Waterjet Model. In Proceedings of the 32nd International Ocean and Polar Engineering Conference, Shanghai, China, 6–10 June 2022. [Google Scholar]
  15. Chesnakas, C.J.; Donnelly, M.J.; Pfitsch, D.W.; Becnel, A.J.; Schroeder, S.D. Performance Evaluation of the ONR Axial Waterjet 2 (AxWJ-2); Naval Surface Warfare Center Carderock Div Bethesda MD Total Ship Systems Directorate: West Bethesda, MD, USA, 2009. [Google Scholar]
  16. Dang, J.; Liu, R.; Pouw, C. Waterjet system performance and cavitation test procedures. In Proceedings of the SMP13-Third International Symposium on Marine Propulsion, Tasmania, Australia, 5–8 May 2013; pp. 87–96. [Google Scholar]
  17. Schmucker, H.; Flemming, F.; Coulson, S. Two-way coupled fluid structure interaction simulation of a propeller turbine. Int. J. Fluid Mach. Syst. 2010, 3, 342–351. [Google Scholar] [CrossRef]
  18. Wang, F.J.; Qu, L.X.; He, L.Y.; Gao, J.Y. Evaluation of flow-induced dynamic stress and vibration of volute casing for a large-scale double-suction centrifugal pump. Math. Probl. Eng. 2013, 2013, 831–842. [Google Scholar] [CrossRef] [Green Version]
  19. van Esch, B.; Cheng, L. Unstable operation of a mixed-flow pump and the influence of tip clearance. In Proceedings of the ASME-JSME-KSME 2011 Joint Fluids Engineering Conference, Hamamatsu, Japan, 24–29 June 2011; American Society of Mechanical Engineers: New York, NY, USA, 2011; pp. 79–87. [Google Scholar]
  20. Duan, X.; Tang, F.; Duan, W.; Zhou, W.; Shi, L. Experimental investigation on the correlation of pressure pulsation and vibration of axial flow pump. Adv. Mech. Eng. 2019, 11, 1687814019889473. [Google Scholar] [CrossRef] [Green Version]
  21. Huang, R.; Dai, Y.; Luo, X.; Wang, Y.; Huang, C. Multi-objective optimization of the flush-type intake duct for a waterjet propulsion system. Ocean. Eng. 2019, 187, 106172. [Google Scholar] [CrossRef]
Figure 1. Three-dimensional model of the unit for the fluid–structure coupling modal analysis.
Jmse 10 01032 g001
Figure 2. Computational domain and boundary conditions.
Jmse 10 01032 g002
Figure 3. Mesh of the rotor for the fluid calculation: (a) rotor and stator (b) rotor boundary layer mesh.
Jmse 10 01032 g003
Figure 4. The surface grids of rotor blades.
Jmse 10 01032 g004
Figure 5. Thrust (left) and torque (right) coefficients calculated for different grids.
Jmse 10 01032 g005
Figure 6. Waterjet test system at the Laboratory of Water Jet Technology, China.
Jmse 10 01032 g006
Figure 7. Computational domain of the waterjet test system.
Jmse 10 01032 g007
Figure 8. Structural mesh of the waterjet unit.
Jmse 10 01032 g008
Figure 9. Pressure fluctuation characteristics of monitoring points at different radii of the stator.
Jmse 10 01032 g009
Figure 10. Pressure fluctuation characteristics of monitoring points from the impeller inlet to the impeller outlet at the top of the duct.
Jmse 10 01032 g010
Figure 11. Eight pressure fluctuation monitoring points in the circumferential direction.
Jmse 10 01032 g011
Figure 12. Pressure fluctuation amplitudes of monitoring points at different radii of the stator.
Jmse 10 01032 g012
Figure 13. Pressure fluctuation amplitudes of monitoring points from the impeller inlet to the impeller outlet at the top of the duct.
Jmse 10 01032 g013
Figure 14. Pressure fluctuation amplitudes of monitoring points in the circumferential direction.
Jmse 10 01032 g014
Figure 15. Calculated unsteady axial and radial forces in the frequency domain.
Jmse 10 01032 g015
Figure 16. Displacement amplitudes of measuring points with different radii on the stator leading edge.
Jmse 10 01032 g016
Figure 17. Distribution of the vibration velocity amplitude on the surface of the pump case at 1BPF.
Jmse 10 01032 g017
Figure 18. Arrangement of vibration measuring points.
Jmse 10 01032 g018
Figure 19. Acceleration time-frequency spectrum of the test data.
Jmse 10 01032 g019
Figure 20. Comparison of measured vibration displacement response of pump case (dotted line) and numerically predicted displacement response (solid line).
Jmse 10 01032 g020
Figure 21. First-order mode shape of the pump case structure (637 Hz).
Jmse 10 01032 g021
Figure 22. 3D models of the three axial gaps.
Jmse 10 01032 g022
Figure 23. Unsteady axial forces in the frequency domain of the three axial gaps.
Jmse 10 01032 g023
Figure 24. Unsteady radial forces in the frequency domain of the three axial gaps.
Jmse 10 01032 g024
Figure 25. Pressure fluctuation characteristics of monitoring points under the three axial gaps.
Jmse 10 01032 g025
Figure 26. Displacement response of measuring points on the pump case.
Jmse 10 01032 g026
Table 1. Key parameters of the computational grids.
Grid IDMaximum Cell Size on Blade Surface/DrFirst-Layer Cell Height from Blade Surface (mm)Total Number of Cells (Million)
(a)1.4%0.321.17
(b)1.0%0.233.20
(c)0.71%0.168.65
(d)0.5%0.1123.28
Table 2. Waterjet comparison results.
Mass Flow Rate
(m3/s)
Head
(m)
Power
(kW)
Rotation Speed
(r/min)
Pump
Efficiency
Head ErrorPower Error
1.29510.57152.4697.70.8771.8%0.8%
1.54914.91256.7830.00.8791.8%1.3%
1.74219.27372.9941.80.8791.3%0.3%
Table 3. Comparison of thrust and moment under different axial gap conditions.
Thrust
(N)
Divided by A1Moment
(N·m)
Divided by A1
A1
(Axial Gap 1)
33,920.01.006509.51.00
A2
(Axial Gap 2)
32,305.20.956509.91.00
A3
(Axial Gap 3)
32,234.70.956478.21.00
Publisher’s Note: MDPI stays neutral with regard to jurisdictional claims in published maps and institutional affiliations.

