Article

Physicochemical Control of Caribbean Coral Calcification Linked to Host and Symbiont Responses to Varying pCO2 and Temperature

by
Robert A. Eagle
1,2,*,
Maxence Guillermic
1,2,3,
Illian De Corte
1,2,
Blanca Alvarez Caraveo
1,
Colleen B. Bove
4,5,
Sambuddha Misra
6,7,
Louise P. Cameron
8,
Karl D. Castillo
4,5 and
Justin B. Ries
8
1
Department of Atmospheric and Oceanic Sciences, Institute of the Environment and Sustainability, Center for Diverse Leadership in Science, University of California, 520 Portola Plaza, Los Angeles, CA 90095, USA
2
Université de Brest Occidentale, Institut Universitaire Européen de la Mer, LGO, Rue Dumont d’Urville, 29280 Plouzané, France
3
Department of Earth, Planetary, and Space Sciences, University of California, Los Angeles, 595 Charles Young Drive E., Los Angeles, CA 90095, USA
4
Environment, Ecology, and Energy Program, University of North Carolina at Chapel Hill, Chapel Hill, NC 27599, USA
5
Department of Earth, Marine, and Environmental Sciences, University of North Carolina at Chapel Hill, Chapel Hill, NC 27599, USA
6
Indian Institute of Science, Centre for Earth Sciences, Malleshwaram, Bengaluru 560012, Karnataka, India
7
The Godwin Laboratory for Palaeoclimate Research, Department of Earth Sciences, University of Cambridge, Cambridge CB2 3EQ, UK
8
Department of Marine and Environmental Sciences, Marine Science Center, Northeastern University, 430 Nahant Rd, Nahant, MA 01908, USA
*
Author to whom correspondence should be addressed.
J. Mar. Sci. Eng. 2022, 10(8), 1075; https://doi.org/10.3390/jmse10081075
Submission received: 13 January 2022 / Revised: 24 July 2022 / Accepted: 25 July 2022 / Published: 5 August 2022
(This article belongs to the Special Issue The Effect of Ocean Acidification on Skeletal Structures)

Abstract

:
It is thought that the active physiological regulation of the chemistry of a parent fluid is an important process in the biomineralization of scleractinian corals. Biological regulation of calcification fluid pH (pHCF) and other carbonate chemistry parameters ([CO32−]CF, DICCF, and ΩCF) may be challenged by CO2 driven acidification and temperature. Here, we examine the combined influence of changing temperature and CO2 on calcifying fluid regulation in four common Caribbean coral species—Porites astreoides, Pseudodiploria strigosa, Undaria tenuifolia, and Siderastrea siderea. We utilize skeletal boron geochemistry (B/Ca and δ11B) to probe the pHCF, [CO32−]CF, and DICCF regulation in these corals, and δ13C to track changes in the sources of carbon for calcification. Temperature was found to not influence pHCF regulation across all pCO2 treatments in these corals, in contrast to recent studies on Indo-Pacific pocilloporid corals. We find that [DIC]CF is significantly lower at higher temperatures in all the corals, and that the higher temperature was associated with depletion of host energy reserves, suggesting [DIC]CF reductions may result from reduced input of respired CO2 to the DIC pool for calcification. In addition, δ13C data suggest that under high temperature and CO2 conditions, algal symbiont photosynthesis continues to influence the calcification pool and is associated with low [DIC]CF in P. strigosa and P. astreoides. In P. astreoides this effect is also associated with an increase in chlorophyll a concentration in coral tissues at higher temperatures. These observations collectively support the assertion that physicochemical control over coral calcifying fluid chemistry is coupled to host and symbiont physiological responses to environmental change, and reveals interspecific differences in the extent and nature of this coupling.

1. Introduction

Corals are foundational for some of earth’s most biologically productive and diverse ecosystems, many of which are threatened by a combination of rising ocean temperatures, disease, ocean acidification (OA), and other pressures. Ocean warming can cause a breakdown in the symbiotic relationship between corals and their algal symbionts leading to coral “bleaching” and eventual mortality [1] and represents a significant threat to corals [2]. In addition, as atmospheric carbon dioxide partial pressure continues to rise, so does uptake of CO2 into seawater, which reduces seawater pH (pHSW) and calcium carbonate saturation state (Ω), thereby making seawater less chemically favorable for organisms that produce CaCO3 shells and skeletons [3]. However, it is understood that some species of marine calcifying organisms are resilient to external acidification or may even benefit by utilizing the additional dissolved inorganic carbon (DIC) available for shell building, and in some cases photosynthesis [4,5,6,7].
Coral calcification responses to ocean acidification are known to be diverse, with observations of negative skeletal growth responses [8,9,10,11,12,13,14,15,16,17,18,19,20]. Coupled ocean acidification and temperature stress has revealed a variety of responses due to interactions with temperature stress, including negative synergistic [14,21,22,23,24].
Whilst interactive effects of temperature and acidification on corals are known, the underlying physiological causes of those effects are less well understood. In two Indo-Pacific pocilloporid coral species, Pocillopora damicornis and Stylophora pistillata, we observed that corals cultured at 28 °C exhibit increased net calcification with increasing pCO2, but a shift to negligible or negative net calcification at 31 °C [7]. At the 28 °C treatment, CO2 fertilization of symbiont photosynthesis appeared to be occurring, which supplied the energy resources for corals to increase calcification [7,25]. At 31 °C, loss of symbiont density was observed from coral color analyses [7,25]. Using two independent approaches, pH microelectrodes and skeletal boron geochemistry, it was found that temperature compromised the corals’ ability to maintain biological regulation of its internal parent fluids for calcification (calcifying fluids; CF), with pHCF and [CO32−]CF reduced at 31 °C and more sensitive to changes in the carbonate chemistry of external seawater [7]. Similar observations using pH sensitive dyes [26] and geochemical proxies [27,28,29] have been reported in field-collected corals with different thermal exposure histories. As it is thought that biological upregulation of the pHCF, [CO32−]CF, [DIC]CF, and the saturation state of aragonite (ΩAr)CF is important in allowing corals to calcify [30,31,32,33,34,35], loss of this control on thermal stress may explain how temperature and pCO2-induced ocean acidification could interact to negatively impact coral calcification [7]. Both laboratory experiments and observations on field collected corals have their limitations. In culture experiments, the question is how well are natural physiological responses to stressors simulated by the experiment and, in field collected corals, it can be difficult to constrain and disentangle complex and covarying relationships between the seawater carbonate system and their geochemical proxies [36]. Whilst coral calcifying chemistry regulation in response to acidification has been widely investigated in Indo-Pacific species, it has not to our knowledge been examined in depth in culture experiments on the Caribbean species studied here, with the exception of a study by [37] on S. siderea using a spatially resolved laser ablation approach.
Here, we further explore the independent and combined effect of temperature and pCO2 on coral and algal symbiont physiology in a study on four species of common Caribbean scleractinian corals Porites astreoides, Pseudodiploria strigosa, Undaria tenuifolia, and Siderastrea siderea (Figure 1). These corals were recovered from the Belize Mesoamerican Barrier Reef System, cultured at 28 °C and 31 °C, and at ~280 to 3300 µatm pCO2, and characterized for their structural and physiological responses to these conditions [38,39]. The coral species exhibited interspecific variations in host and symbiont responses to changing environmental conditions in the experiment, which allows us to investigate the link between host and symbiont physiology and the control of calcification and calcification fluid chemistry [38,39]. It was found that all four coral species exhibited nonlinear decreases in net calcification rate with increasing pCO2 [38]. The 31 °C treatment reduced calcification rate in only one species, P. strigosa, although U. tenuifolia exhibited too low survival rates at 31 °C to be assessed [38]. Siderastrea siderea was the most resilient coral maintaining positive rates of net calcification under all conditions, even when seawater was undersaturated with respect to aragonite [38]. Siderastrea siderea was found to maintain relatively unaltered symbiosis under experimental conditions, and relatively constant host energy reserves, consistent with its resilient calcification response [39]. Pseudodiploria strigosa did not maintain indicators of coral symbiont physiology under warming, such as chlorophyll content and symbiont cell density, and was the most bleached coral in the experiment [39]. Conversely, P. astreoides exhibited improved symbiont physiological indicators and chlorophyll content at 31 °C, which were reduced under the acidification conditions [39], although the 31 °C condition was characterized by lower survival rates [38]. Pseudodiploria strigosa and S. siderea showed stronger correlations between symbiont density and host energy reserves, consistent with a tighter coupling between these physiological indicators than were found in P. astreoides [39]. It was concluded in previous work that this may result from P. astreoides symbionts being more efficient in delivering autotrophically derived carbon to the host, whereas P. strigosa and S. siderea require relatively greater concentrations of their symbionts to support the host [39]. Therefore, this experiment represents an opportunity to expand on our previous work [7] to explore the underlying mechanisms behind the interaction of temperature and pCO2 on corals and, in particular, how symbiont and host physiological responses could influence corals’ ability to exert active biological control on physicochemical parameters, such as pHCF, [DIC]CF, and [CO32−]CF. We applied a combined approach of boron geochemistry to constrain pHCF, [DIC]CF, and [CO32−]CF and δ13C to trace changes in the source of carbon for calcification linked to coral and symbiont physiological responses to environmental changes.

2. Materials and Methods

2.1. Sample Collection

Samples from the tropical Caribbean Scleractinian coral species Siderastrea siderea, Pseudodiploria strigosa, Porites astreoides, and Undaria tenuifolia (Figure 1) were collected from inshore and offshore reef environments along the southern portion of the Mesoamerican Barrier Reef System (MBRS) off the coast of Belize in June 2015, at depths of 3–5 m [38]. For each species, six colonies were collected from both an inshore and offshore reef environment, totaling 48 colonies (4 species × 6 colonies × 2 reef environments), as described in Supplementary Table S3. Samples were then transported to a natural seawater flow-through aquarium system at Northeastern University’s Marine Science Center in Nahant, MA, USA, where each colony was sectioned into eight fragments to be acclimated and subsequently undergo the 93-day experiment [38]. New data from a second experiment on Indo-Pacific corals are also presented here, in this experiment specimens of Stylophora pistillata, were obtained from DeJong MarineLife (Lingewaal, The Netherlands) and cultured as described previously [7,25].

2.2. Experimental Culturing

Following a ~70 day conditioning period, fragmented coral colonies from S. siderea, P. strigosa, P. astreoides, and U. tenuifolia were reared for 93 days under four pCO2 conditions corresponding to preindustrial (311 µatm), present-day control (405 µatm), end-of-century (701 µatm), and extreme (3309 µatm) carbon dioxide partial pressures, and under two temperature conditions corresponding to control (28 °C, as determined by in situ reef temperature records near the collection site) and elevated temperature treatments (31 °C), as predicted for end-of-century mean sea-surface temperature near the collection site [40]. The extreme pCO2 condition allows for an exploration of the physiological limits of the species, as well as simulates conditions in past greenhouse periods in earth history which are relevant to understand coral evolution. Coral fragments within each tank were fed every other day with a mixture of ca. 6 g frozen adult Artemia sp. and 250 mL concentrated newly hatched live Artemia sp. (500 mL−1) to satisfy any heterotrophic feeding by each species. Supplementary Tables S1 and S2 reproduce the measured and calculated experimental parameters from the original study [38].

2.3. Net Calcification Rate, Coral Symbiont and Host Physiological Measurements

Net coral calcification rates from this experiment were estimated from surviving coral fragments using the buoyant weight method, as described in [38], and reported in units of mg cm−2 d−1. Algal symbiont cell density was assessed using Lugol’s iodine staining, with cell counts standardized to total coral tissue volume to yield values in cells per cm2 as described in [39]. Chlorophyll a (Chl a) was measured on a Turner Design 10-AU fluorometer and expressed in units of g of pigment per cm2 of coral tissue surface area [39]. Coral host protein, host lipids, and host carbohydrate were determined by spectrophotometry and recorded in units of mg per cm2 of coral tissue surface area. Whilst these data have been reported in previous publications [38,39], they are reproduced here in Table S3 to provide easy reference for interpreting the geochemical data.

2.4. Coral Sample Preparation for Geochemical Analyses

New skeletal growth was identified relative to a calcein marker emplaced in the coral skeleton at the start of the experiment, which was visualized using fluorescent light microscopy [38]. Powdered and homogenized samples underwent clay-removal and oxidative cleaning following the method from Barker et al. [41]. Sample material was then dissolved in 1 M HCl (80–100 μL).

2.5. Boron Isotopic Analysis

Boron was purified via microdistillation [42,43] following similar methods described in our previous work [7,44]. Measurements were carried out on a Thermo Scientific ®Neptune Plus MC-ICP-MS at the University of Cambridge equipped with 1013 Ω resistors [45]. Boron isotopic composition is reported in standard δ11B per mil (‰) notation with respect to the NIST SRM 951a boric acid standard (Catanzaro et al., 1970). A laboratory coral standard (NEP; Porites sp.) from the University of Western Australia and the Australian National University was analyzed for assessing internal reproducibility between analytical sessions as well as external reproducibility with other labs.
Sample blanks typically contained less than 0.6 ng-B (<5 ppb B). The δ11B composition of the NEP (δ11BNEP) was measured at 25.6 ± 1.0‰ (2 SD, n = 20) across 13 analytical sessions (Table S4), with each number representing an ab initio processed sample from the present study, which are within analytical uncertainty of published values for the same in-house standard of 25.96 ± 0.30‰, 26.2 ± 0.88‰, n = 27, (25.8 ± 0.89‰, n = 6, 25.71 ± 0.79‰, n = 27, from [46,47,48]. The proposed international standard JCP−1 [49] was not analyzed across our analytical sessions due to lack of availability, nevertheless, previous work [7,44] was performed over the same period and report values within analytical uncertainty of published data, thereby validating the method utilized in the present study [7,49].

2.6. B/Ca Analysis

Elemental ratios were analyzed on a Thermo Scientific® Element HR ICP-MS at Cambridge University, UK and at European Institute for Marine Studies (IUEM), France, after calcium concentration checks on the Agilent® ICP-OES at Cambridge University, UK and at IUEM, France. Isotope concentrations of the acid blanks relative to a typical Ca concentration session (10 ppm) were: Li7 < 7%, B11 < 0.75%, Mg25 < 0.5%, Sr87 < 0.01%, Ca43 < 0.1%. External reproducibility is reported relative to the consistency standard CamWuellestorfi, as published by [43] and measurements of the NEP coral. Our data were within one standard error of published values (Table S5). The analytical uncertainties (2sd) on the B/Ca ratios were 15 µmol/mol.

2.7. Modelled pHCF

The pH of the calcifying fluid (pHCF) was calculated from the boron isotopic composition of the coral skeleton following rationale from Hemming and Hanson [50] and using the MATLAB code provided in De Carlo et al. [51], where δ11BSW represents the boron isotopic composition of seawater (δ11BSW = 39.61‰) [52] and δ11BCARB represents the boron isotopic composition of the coral skeleton. The isotopic fractionation factor between the boron forms from Klochko et al. (2006) was used, α(B3-B4) = 1.0272. The dissociation constant of boron (KB) was calculated from salinity, temperature and pressure [53], and the boron concentration was calculated from salinity after Lee et al., 2010 [54].
pHCF = pKB − log{−[δ11BSW − δ11BCARB]/[δ11BSW − α(B3-B4)11BCARB − ε(B3-B4))]}
[H+]SW and [H+]CF were calculated based on pHSW and pHCF with [H+] = 10−pH. The proton gradient [H+]SW − [H+]CF was evaluated to better visualize the scale of pH regulation in comparison to a logarithmic scale.

2.8. Modelled [CO32−]CF, DICCF, and ΩCF

DICCF and [CO32−]CF were calculated using the method and Matlab© code from DeCarlo et al. [51]. This study uses combined B/Ca and δ11B to calculate [CO32−]CF, where:
[ CO 3 2 ] CF ] = K D   [ B ( OH ) 4 ) ] B / Ca
We use the KD defined in McCulloch et al. [33], KD = 0.00297*exp(−0.0202*[H+]), where [H+] is determined based on pHCF as calculated from δ11B following Equation (1). Given pHCF and [CO32−]CF, DICCF can be calculated using the known dissociation constants for carbonate speciation at known temperatures and pressure. ΩCF can also be calculated but requires and additional assumption on the [Ca2+] of the calcifying fluid. The saturation state of aragonite in the calcifying medium (ΩCF) defined following Equation (3) is dependent on the accuracy of the [CO32−]CF and is limited to the additional assumption on the [Ca2+] of the calcifying fluid.
[ ] CF ] =   [ CO 3 2 ] CF ] × [ Ca 2 + ] CF ] Ksp
We calculated the saturation state of aragonite of the calcifying fluid using the [Ca2+]sw determined using the salinity of the culture condition ([Ca2+]sw (mol/kg sw) = 0.02128/40.1*((Salinity − 0.03)/1.805)).

2.9. Carbon Stable Isotope Analyses

Analyses on Caribbean corals were conducted on two Nu Perspective isotope ratio mass spectrometers (IRMS) at UCLA [55]. Most samples were analyzed using a Nu Carb specific sample preparation system. This system reacts 0.48 mg (±0.03 mg) of pure calcium carbonate material, for 20 min at 70 °C in individual reaction vials, thus eliminating any potential memory effects that are associated with analyses using a common acid bath system. Gases released by acid digestion of CaCO3 are purified in a series of liquid N2-cooled, temperature controlled cold-fingers, an Adsorption Trap (AdTrap), an in-line, short Gas Chromatograph (GC) column packed with Porapak Type-QTM50/80 and silver wool, before introduction to the mass-spectrometer dual inlet for isotope analysis. The second digestion system is the common acid bath (CAB) system [55]. Analyses of Stylophera pistillata skeletal δ13C and δ18O was carried out on a GasBench II coupled to a Delta V mass spectrometer at the stable isotope facility of Pôle spectrometrie Océan (PSO), Plouzané, France. Results were calibrated to the Vienna Pee Dee Belemnite (V-PDB) scale and referenced to the international standard NBS19.

2.10. Statistical Methods

For elemental data, the most restrictive false discovery rate (Q = 0.1%) was used to thin data using the ROUT method set, meaning that <0.1% of identified outliers would have been falsely identified as such. To test for statistically significant changes in net calcification, we performed a one-way ANOVA followed by Dunnett’s multiple comparisons tests on skeletal B/Ca composition, δ11B, δ13C, pHCF, and ΩCF across experimental treatment conditions relative to the control condition (28 °C, 400 μatm pCO2). To determine the best fit by linear or second-order polynomial (quadratic) regressions, we used a combined linear and quadratic fit test, using the Akaike’s Information Criteria (AIC). We compared the best-fit regressions across temperature conditions by first determining if the slopes of the two regressions are statistically different, and if the slopes are not significantly different (p-value > 0.05), we tested to see if the intercepts were significantly different (p-value < 0.05). This was done using an Analysis of Covariance (ANCOVA) method. The statistical analyses above were carried out GraphPad Prism version 9.0.0 for macOS, GraphPad Software, San Diego, CA, USA.
δ11B, B/Ca, and δ13C data were tested to see if it met assumptions of normality using the Shapiro–Wilks test (p > 0.05). At the level p < 0.05 we found that most of the data were not normally distributed. In order to perform a two-way AVOVA test, we transformed the data using the Tukey ladder of powers method to reduce negative and positive skew of non-normal data methodologically [56]. Method until it met the test of normality. Table S6 gives information about whether data were transformed and how they were transformed. Following confirmation that the data were normal, we analyzed isotope and elemental data using a two-way ANOVA to test the influence of the individual and combined effects of pCO2 and temperature. The same approach was taken to analyze the calculated parameters pHCF, [CO32−]CF, and DICCF and the coral and symbiont physiological data; calcification rate, symbiont cell density, chlorophyll a, and total host energy data from [38,39]. All statistical analysis was conducted using the ‘MASS’ package in R version 4.0.2 (R Core Development Team 2016, Vienna, Austria).
As coral species were collected from inshore and offshore reef environments, so we also tested whether there were significant effects of temperature, pCO2, and reef environment on geochemical and physiological parameters in a three-way ANOVA. As this analysis did not resolve a significant effect of reef environments, it justified the pooling of data across reef environments to conduct the two-way ANOVA tests described above.

2.11. Data Compilation

Data from previous publications was compiled to construct synthesis figures on coral calcifying fluid chemistry derived from geochemistry and other approaches such as electrodes and pH sensitive dyes. Literature data used for this metanalysis is summarized in Table S12 and was derived from the following publications [7,17,32,34,35,47,57,58,59,60,61,62,63,64,65,66,67,68,69,70]. In order to include the data from Allison et al., 2014 [32] on the carbonate chemistry of the calcification fluid from P. damicornis cultured under different concentrations of the ruthenium red (RR, 3.7 and 5.3 µM) inhibitor of Ca-ATPase activity, new calculations of the original data were performed using the framework described in this paper. Carbonate chemistry of the cultured experiments were calculated from alkalinity and pH provided in a previous publication [71] and using the CO2sys program [72].

3. Results

3.1. Analyses of (δ11B), B/Ca, and δ13C

Mean boron geochemistry (δ11B and B/Ca) and δ13C for each experimental condition of the Caribbean coral experiment are reported in Table 1, individual coral specimen data are reported in Table S7. B/Ca (±SD) measurements for the control culturing conditions were averaged for each species under the experimental control conditions of 28 °C and 405 μatm pCO2: P. astreoides (437 ± 31 μmol/mol), P. strigosa (495 ± 70 μmol/mol), S. siderea (436 ± 18 μmol/mol), U. tenuifolia (518 ± 32 μmol/mol). Under the experimental control culturing conditions, coral skeletal aragonite δ11B compositions (±SD) were averaged for each species: P. astreoides (24.54 ± 0.74‰), P. strigosa (24.40 ± 1.40‰), U. tenuifolia (24.63 ± 0.68‰), and S. siderea (23.87 ± 0.47‰). Mean δ13C (±SD) for each species under the control temperature and pCO2 experimental condition (28 °C, 405 μatm pCO2) was: P. astreoides (−2.58 ± 0.92‰), P. strigosa (−1.11 ± 1.51‰), S. siderea (−3.94 ± 0.61‰), and U. tenuifolia (−2.65 ± 0.34‰) (Table 1).
Boron geochemical data for S. pistillata have previously been reported in Guillermic et al. Here, we report δ13C and δ18O data from S. pistillata skeletal aragonite from this additional experiment on Indo-Pacific corals, given in Table S8. The principal reason for presenting these data in this study is that they provide context for the interpretation of data from the Caribbean corals, as described in more detail below.
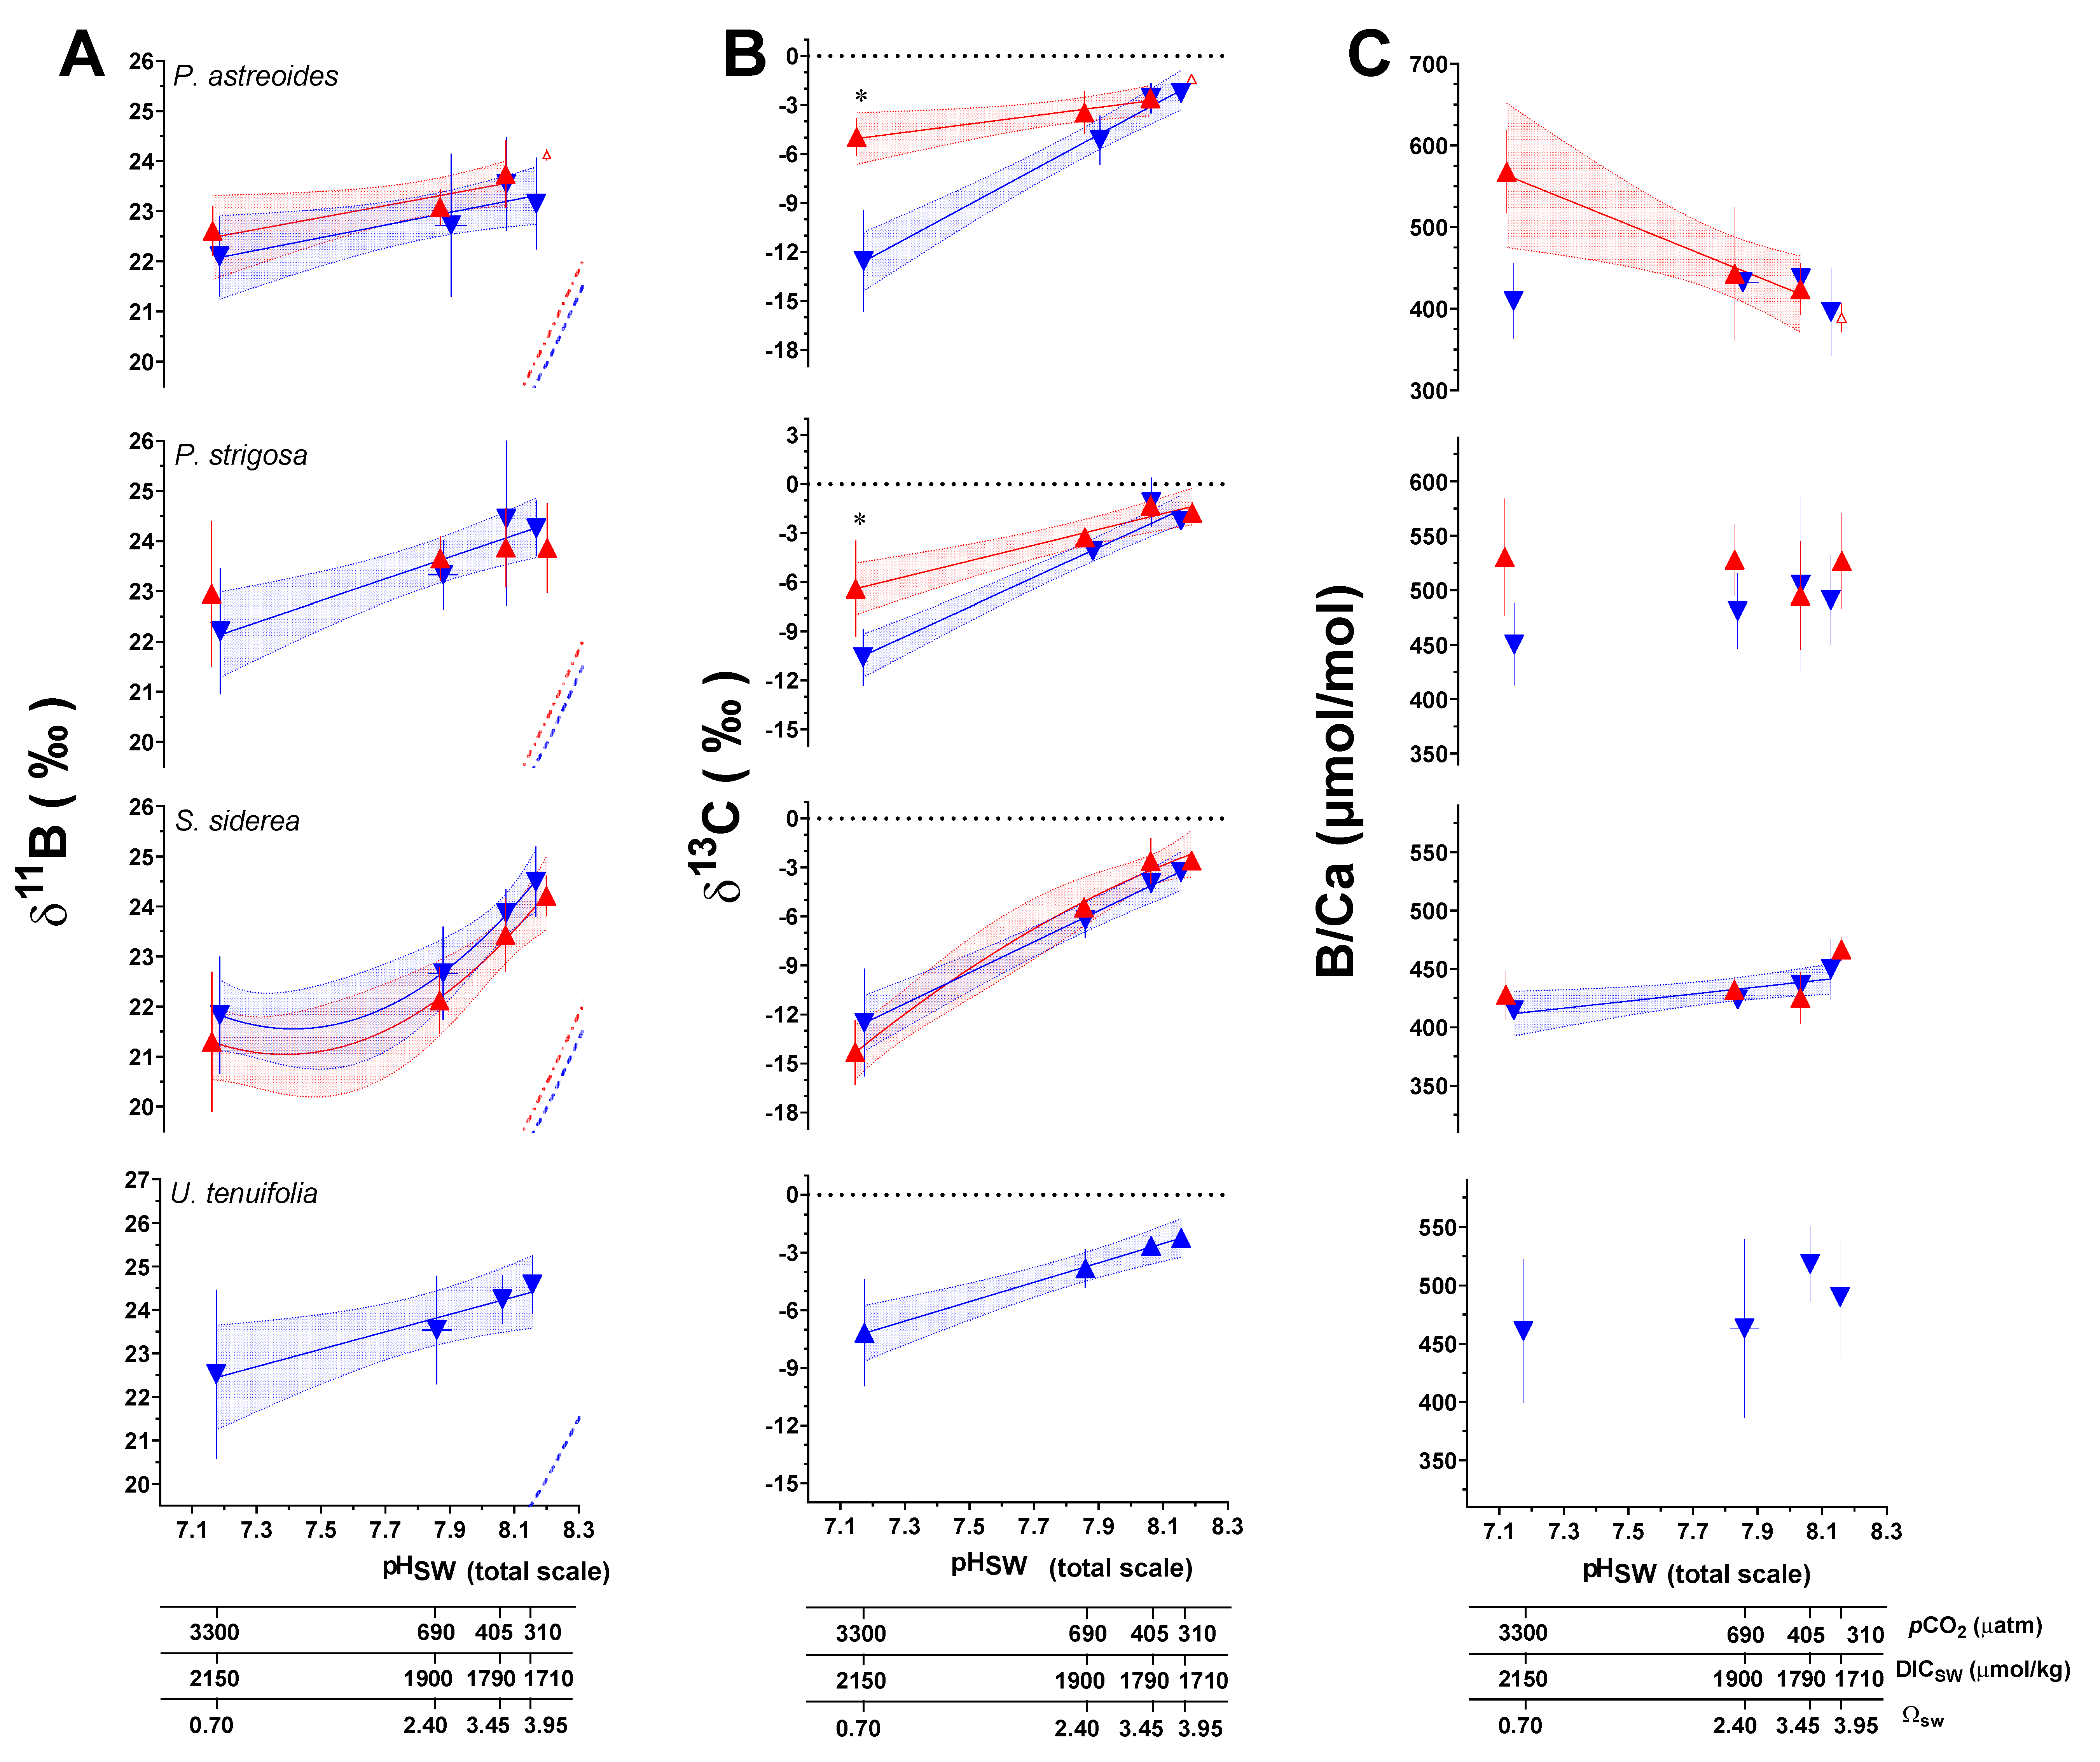
Trends in measured geochemical parameters as a function of culture seawater pH (pHSW) were explored using Akaike’s Information Criteria (AIC) to determine whether a linear or second-order polynomial (quadratic) regression best fit the data (Figure 2; Table S9). In all cases, a linear regression was found to fit the data better, with the exception of δ11B and B/Ca data for S. siderea, where a nonlinear fit was preferred (Figure 2, Table S9). In terms of geochemical proxy development for historical seawater pH reconstruction, the three species that exhibited relationships between δ11B and pHSW that were best described by linear regressions seem best suited for this endeavor. P. strigosa showing the greatest sensitivity of δ11B to pHSW, with a regression slope of 2.15 compared to 1.46 in P. astreoides and U. tenuifolia at the 28 °C temperature condition. However, S. siderea showed the greatest sensitivity with a slope of the linear regression between δ11B and pHSW of 2.52 but was best fit by a nonlinear regression. At 31 °C, it is notable that the relationship between δ11B and pHSW within P. strigosa was no longer statistically significant, indicating a potential influence of temperature on δ11B in this species, although this was not significant in the ANOVA tests described below (Figure 2, Tables S9 and S11).
To further constrain trends in the data, two-way ANOVA tests were used to explore the individual and combined effects of pCO2 and temperature on geochemical parameters. For P. astreoides, pCO2 alone had a significant individual effect on δ11B and δ13C, while temperature had no effect on geochemical parameters. However, the combined effect of temperature and pCO2 was found to significantly impact B/Ca. For P. strigosa, pCO2 had a significant effect on δ11B and δ13C, and temperature only influenced B/Ca. In S. siderea, pCO2 had a significant effect on δ11B, δ13C, and B/Ca, whereas temperature had an effect on δ13C alone. Lastly, in U. tenuifolia, only pCO2 had a significant effect on δ13C, and no temperature effects were observed. Results of these analyses are presented in Table 2 and Table S10.
Coral specimens were collected from both the inshore and offshore reef environments (Supplementary Table S3). Although previous work showed that reef environment had an effect on the physiological response of the corals [39], we found no significant effect of reef environment on the geochemical data or on the carbonate system parameters calculated for the coral calcifying fluid (Table S10). A lack of effect of local reef environment in skeleton boron and carbon geochemistry is a positive feature in terms of using the species as palaeoceanographic archives.
It is important to note that the principal driver of trends in δ13C data across variable pCO2 and pHSW treatments is the isotopic composition of the CO2 gas used to manipulate the pCO2 of the treatment seawater. This gas is combustion sourced and therefore has a relatively negative δ13C composition that influences the δ13C of DIC more in cultures with higher pCO2. Despite these trends being influenced by the δ13C of the source gas, there is potential to meaningfully interpret the difference between the δ13C values between the two temperature treatments for a given pCO2. For example, Welch’s T-Tests indicate a statistically significant difference in δ13C data between the 28 °C and 31 °C treatments at the highest pCO2 treatment for P. astreoides and P. strigosa, but not at the lowest pCO2 condition (Figure 3). Additionally, ANCOVA tests reveal the linear regressions through δ13C data as a function of pCO2 for both P. astreoides and P. strigosa have significantly different slopes at 28 °C versus 31 °C (p < 0.0001 and p = 0.0021, respectively), while S. siderea did not exhibit a significant change in slope across temperature conditions (p = 0.102). These trends in δ13C are likely to reflect changes in the sources of DIC for calcification linked to the coral host and symbiont physiological responses to temperature and pCO2, as further explored in the following sections.

3.2. Net Calcification, pHCF, [CO32−]CF, and DICCF

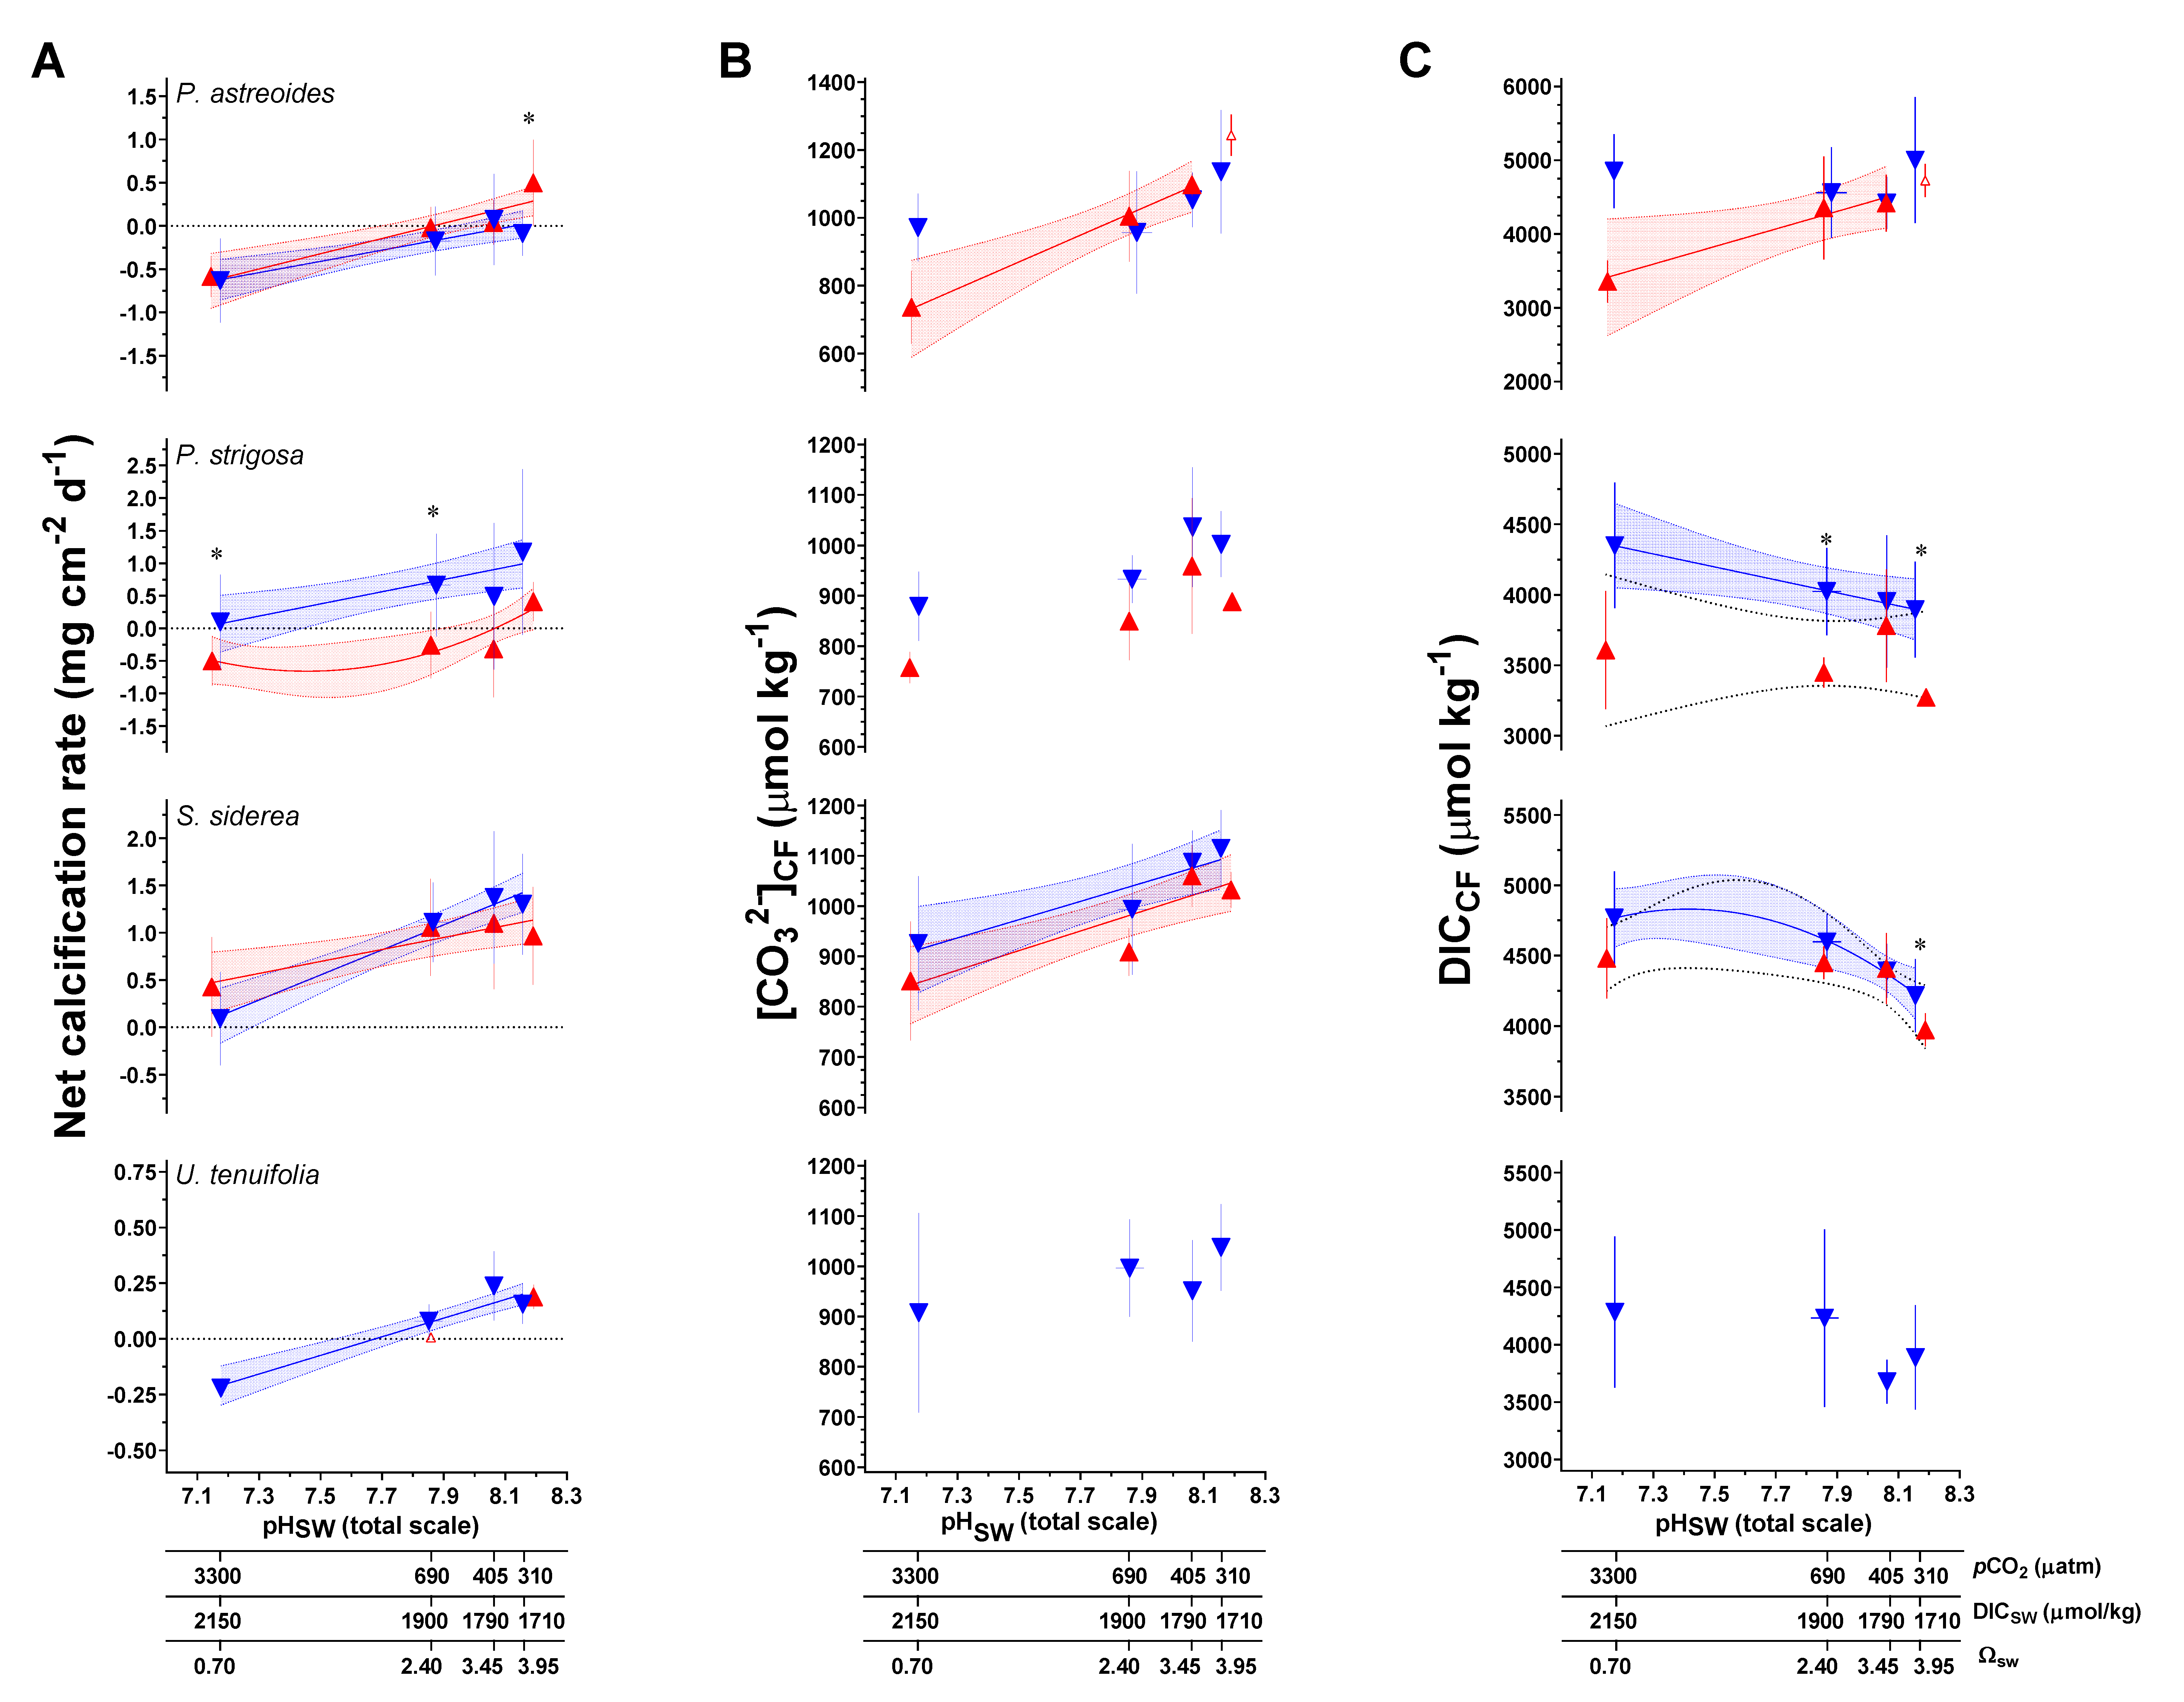
Net calcification rates for the Caribbean corals were reported in Bove et al. [38], which found that all four coral species showed non-linear reductions in net calcification with increasing pCO2. Corals showed interspecific differences, with S. siderea maintaining positive net calcification under all experimental conditions, P. strigosa exhibited a shift to negative net calcification at 31 °C only, and P. astreoides exhibited an increase in calcification with elevated temperature at the lower pCO2 condition, but a shift toward negative calcification (i.e., net dissolution) under the higher pCO2 treatments (Figure 3).
The pH of the coral calcifying fluid (pHCF) was calculated from δ11B data using canonical methods from the literature, as described in the methods section. Although the δ11B approach to calculating pHCF in corals has been independently verified based on comparison with pH sensitive dye and pH microelectrode approaches [7,30,47,61,73], significant differences in sensitivities in those approaches appear to exist, and different hypotheses have been advanced to explain these differences [7,47]. At the control temperature and pCO2 experimental condition (28 °C, 405 μatm pCO2), mean δ11B-derived pHCF (total scale, ±1 SD) for each species was as follows: P. astreoides (8.45 ± 0.06), P. strigosa (8.50 ± 0.11), S. siderea (8.47 ± 0.03), U. tenuifolia (8.49 ± 0.04) (Table 3).
The [CO32−]CF and DICCF were calculated from δ11B and B/Ca data using the KD of McCulloch et al. [74] and the approach of DeCarlo et al. [51] (Table 3), as described in in the methods section. The B/Ca proxy is still prone to uncertainties [70,75] and would benefit from additional validation. One critique is that the proxy is based on limited inorganic precipitation datasets [76,77] which have been difficult to reconcile due to different experimental conditions and from varying [Ca2+] in the experiment leading in turn to varying saturation states of aragonite (Ω) within the precipitation experiments [70]. This leads to potential difficulties when translating to highly biologically controlled fluids (such as the calcifying fluid in corals). Additionally, it is possible that coral biomineralization involves transformation of amorphous precursor phases, as evidenced by the detection of amorphous calcium carbonate (ACC) in corals [78], although it is unclear whether this is the universal pathway by which corals calcify. Amorphous or metastable phases of calcium carbonate may have different KD, which could contribute to differences in biomineral chemistry [79,80], although given that ACC transformation seems to occur via dissolution and reprecipitation into crystalline phases [81], precursor phase KD may not be relevant for the final mineral. Despite these uncertainties, results of Guillermic et al. [7] showed that the KD formulations used by DeCarlo et al. [51] (Termed D18); McCulloch et al. [74] (M17); Holcomb et al. [77] (H16) resulted in similar reconstructed [CO32−]CF among biological replicates and that the outcome was within error of independent measurements from [CO32−] microelectrodes as reported by Sevilgen et al. [35] (S19) for the same coral species (S. pistillata) (M17: 909 ± 313 (SD, n = 8), H16: 757 ± 342 (SD, n = 8), D18: 848 ± 392 (SD, n = 7), S19: 679 ± 183 (SD); at 311 ppm pCO2, 28 °C) [7].
Regression analysis of net calcification, calculated pHCF, [CO32−]CF, and DICCF as a function of pHSW were explored using an AIC approach (Figure 3 and Figure 4; Table S9). pHCF as a function of pHSW follows a similar pattern to the originating δ11B data (Figure 3; Table S9). Patterns in [CO32−]CF as a function of pHSW differ from patterns in pHCF as a function of pHSW, with only P. strigosa and S. siderea showing statistically significant regressions under the 28 °C treatment (Figure 4; Table S9).
In addition, regression analyses of net calcification as a function of pHCF, [CO32−]CF, and [DIC]CF were explored using the AIC approach. Here, linear regressions were typically favored but rarely reached statistical significance (Table S9). This result is not surprising given the previous findings of Liu et al. [69] that pHCF is not necessarily tightly coupled to net calcification responses to seawater acidification in a wide range of marine calcifiers, including the temperate coral Oculina arbuscula. Net calcification represents a balance of dissolution and calcification and will be influenced by both physicochemical and other controls over calcification, all of which may confound a clear relationship with pHCF.
Two-way ANOVA tests were again used to explore the individual and combined effects of pCO2 and temperature on calculated calcifying fluid parameters of pHCF, [CO32−]CF, and DICCF. In P. astreoides, pCO2 had a significant effect on pHCF and [CO32−]CF. Temperature and the combined effect of temperature and pCO2 had significant effects on DICCF. Similarly, in P. strigosa, pCO2 had a significant effect on pHCF and [CO32−]CF, but temperature only had an individual effect on DICCF. In S. siderea, the calculated pHCF data did not meet assumptions of normality after transformation and, consequently, ANOVA results are not presented. There was a significant effect of pCO2 on [CO32−]CF of S. siderea and significant individual effects of both pCO2 and temperature on DICCF. Lastly, U. tenuifolia displayed no significant effects of either pCO2 or temperature on the calculated calcifying fluid parameters. Results of these analyses are presented in Table 4.
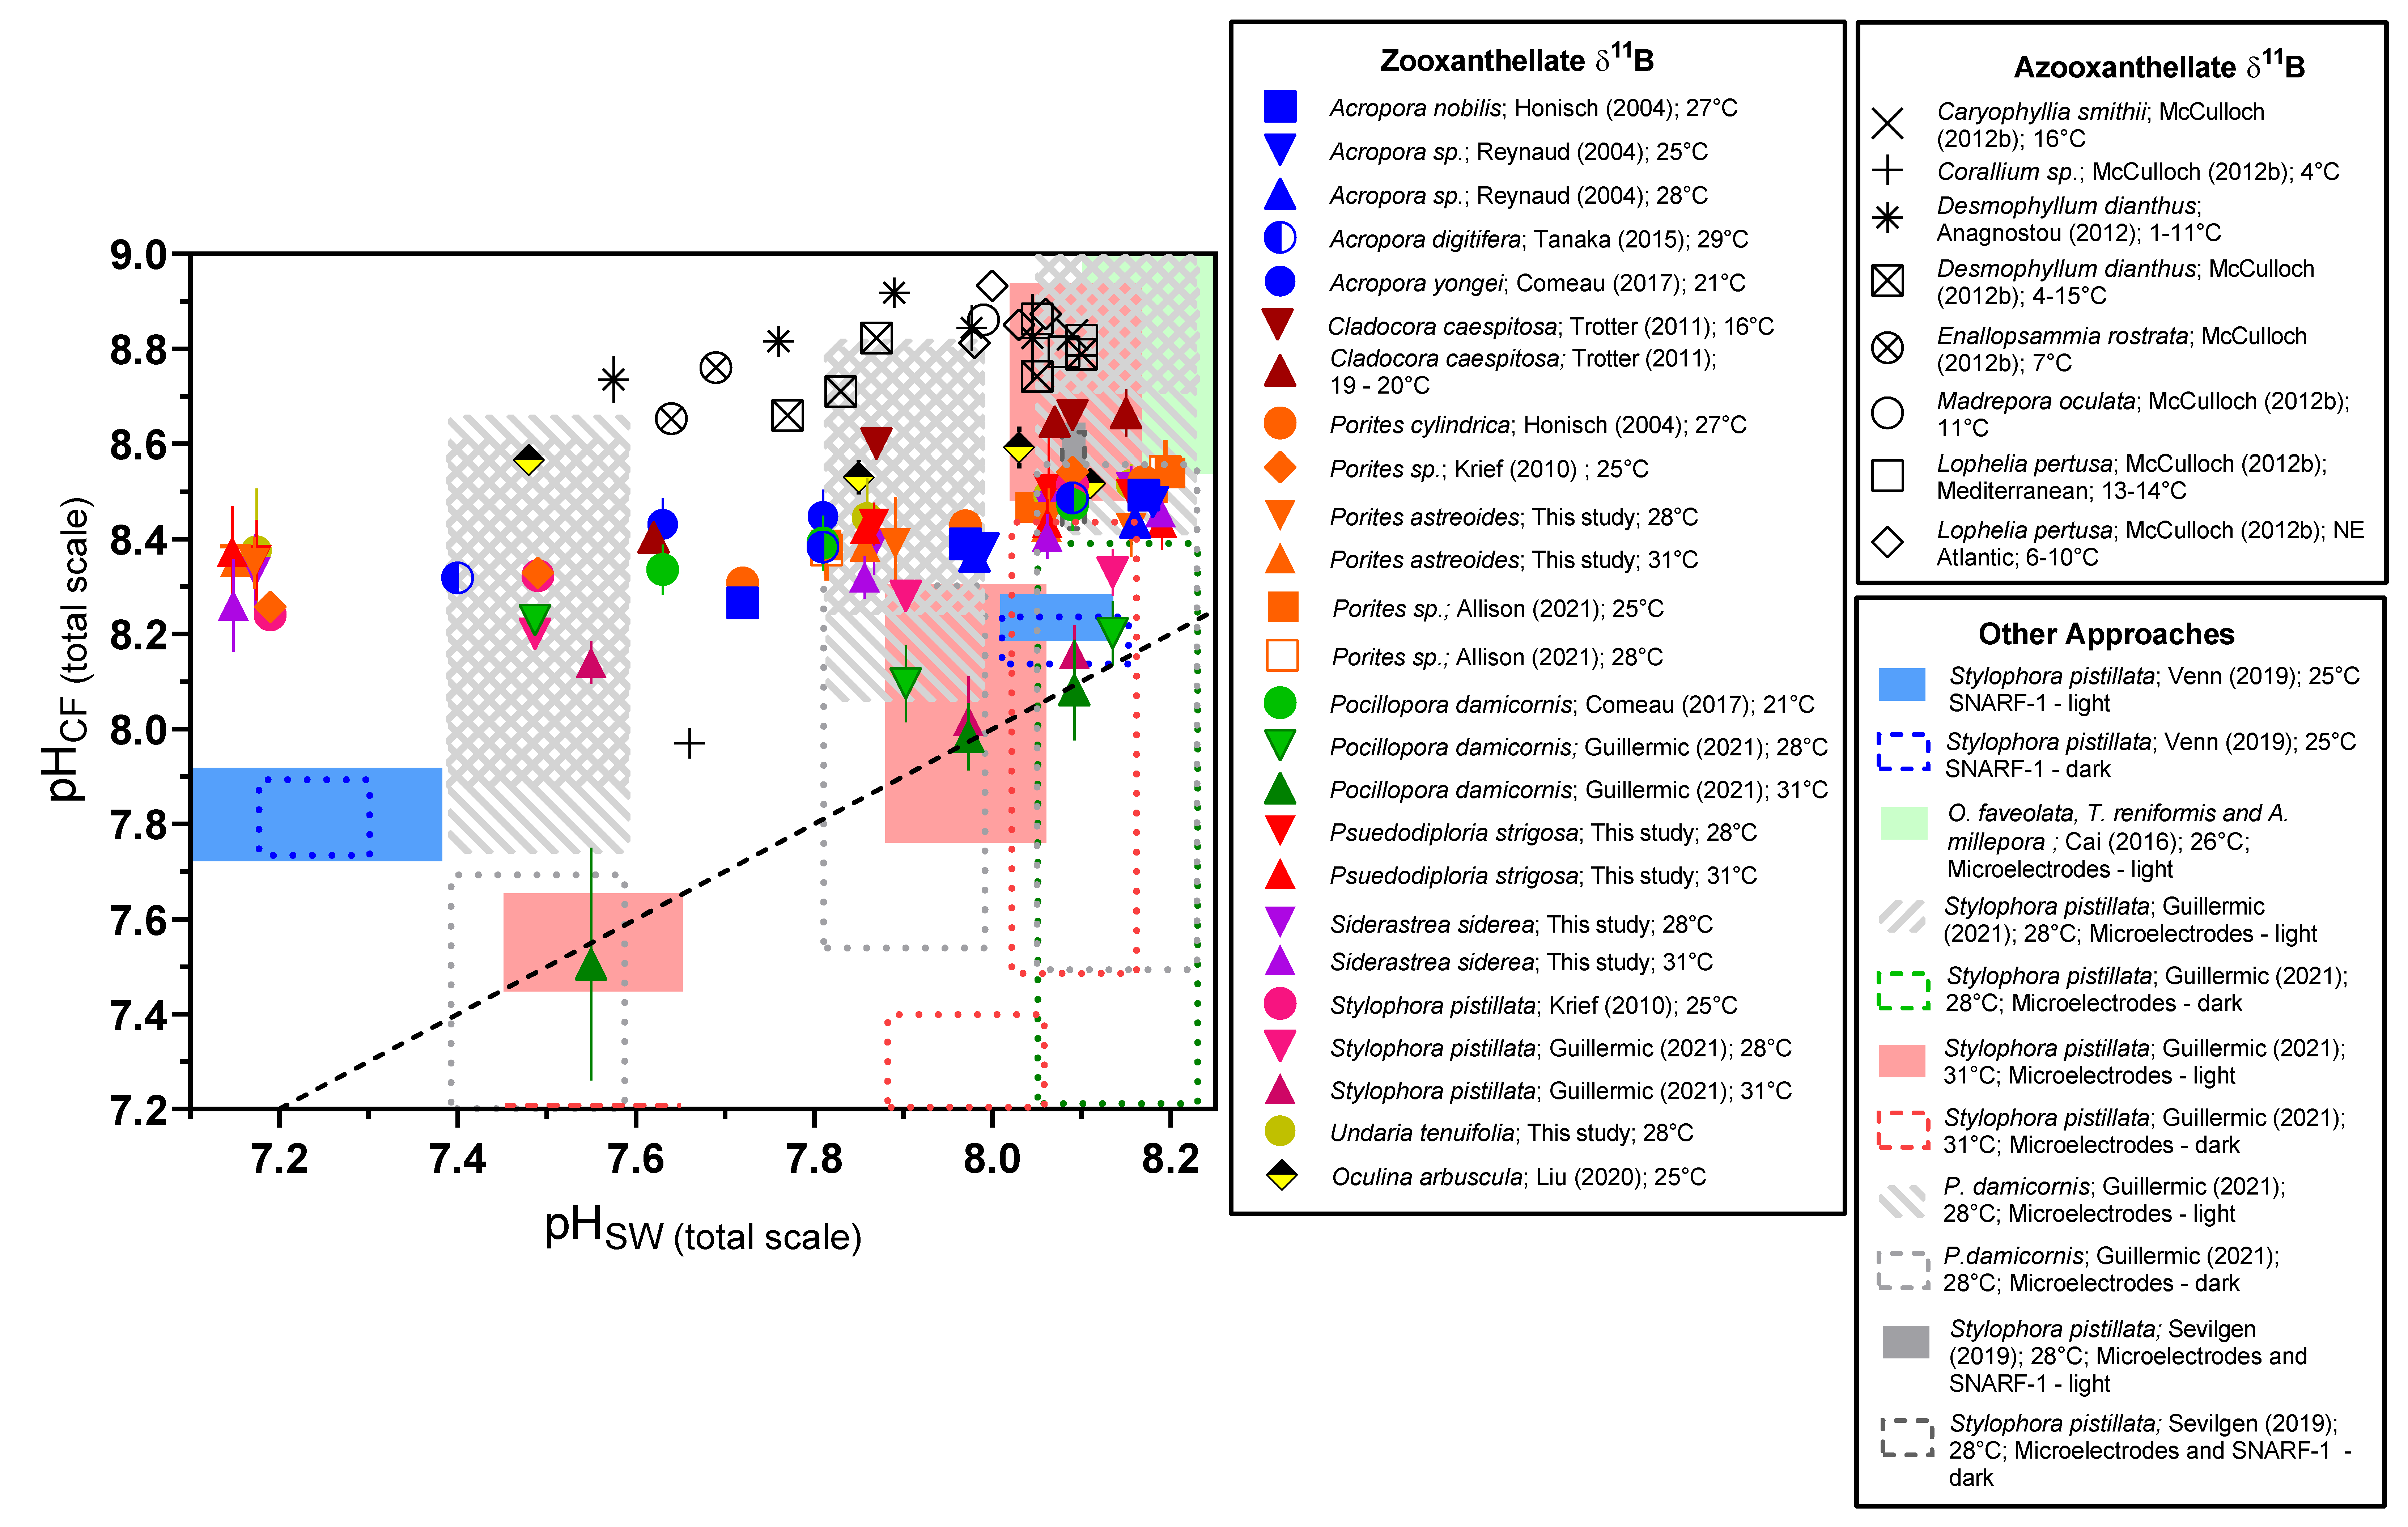
We combined our data with a compilation of coral data from the literature using different approaches (geochemistry, microelectrode, pH-sensitive dye; Table S11). It is clear from almost all published studies that pHCF, [CO32−]CF, and DICCF are differentiated from seawater values and that this is an active compensatory process as pHCF, and [CO32−]CF values are increasingly elevated relative to seawater values under acidified conditions (Figure 5 and Figure 6).

3.3. Biological Compensation for External pH Changes, and the Importance of Coral and Symbiont Physiology

Changes in pHCF across experimental conditions are relatively small, with values changing, for example, from 8.52 to 8.26 in the most sensitive coral species S. siderea. However, it is important to note that this represents a substantial compensation or buffering by the coral with respect to the much larger changes in pHSW, which range from 8.3 to 7.3 in the experiment.
To illustrate the chemical effects of this compensation, we provide calculations of the proton differential ([H+]SW − [H+]CF), maintained by the coral with respect to seawater under all experimental conditions (Figure 7, Table S9), for which larger values represent a greater difference in proton concentration in the calcification fluid relative to seawater. For example, for P. astreoides at 28 °C, the comparison between the 311 µatm pCO2 and the ~33,309 µatm pCO2 treatments show a proton differential of 0.5 × 10⁻⁸ mol/L at 400 µatm pCO2 and 6.3 × 10⁻⁸ mol/L at 3000 µatm, which represents a differential 12.4 times higher at the elevated pCO2 condition. At 31 °C for P. astreoides, the differential is 13.4 times higher between the ~400 µatm and ~3000 µatm pCO2 conditions. The same comparison shows a proton differential 11.4 and 13.4 times higher for P. strigosa at 28 °C and 31 °C, 11.9 and 13.9 times higher for S. siderea at 28 °C and 31 °C and 11.5 times higher for U. tenuifolia at 28 °C.
Using the compilation of pHCF data from the literature and from the present study, we compare the slopes of the relationships between pHCF and pHSW (Figure 8), with a slope of 1 indicating that changes in pHCF perfectly track changes in pHSW, and a slope of 0 indicating that the coral is perfectly compensating for external changes in pHSW and that pHCF is invariant across the experimental conditions. This compilation demonstrates that although there are cases where corals perfectly compensate for external pHSW changes, in most cases corals exhibit a modest decrease in pHCF with decreasing pHSW (Figure 8). Furthermore, δ11B-based estimates of pHCF were generally lower than that found by the microelectrode approach (Figure 8). We hypothesized in previous work that this could reflect different time intervals being recorded by these approaches [7], but it cannot be ruled out that there are systematic differences in the techniques, such as recording different microenvironments.
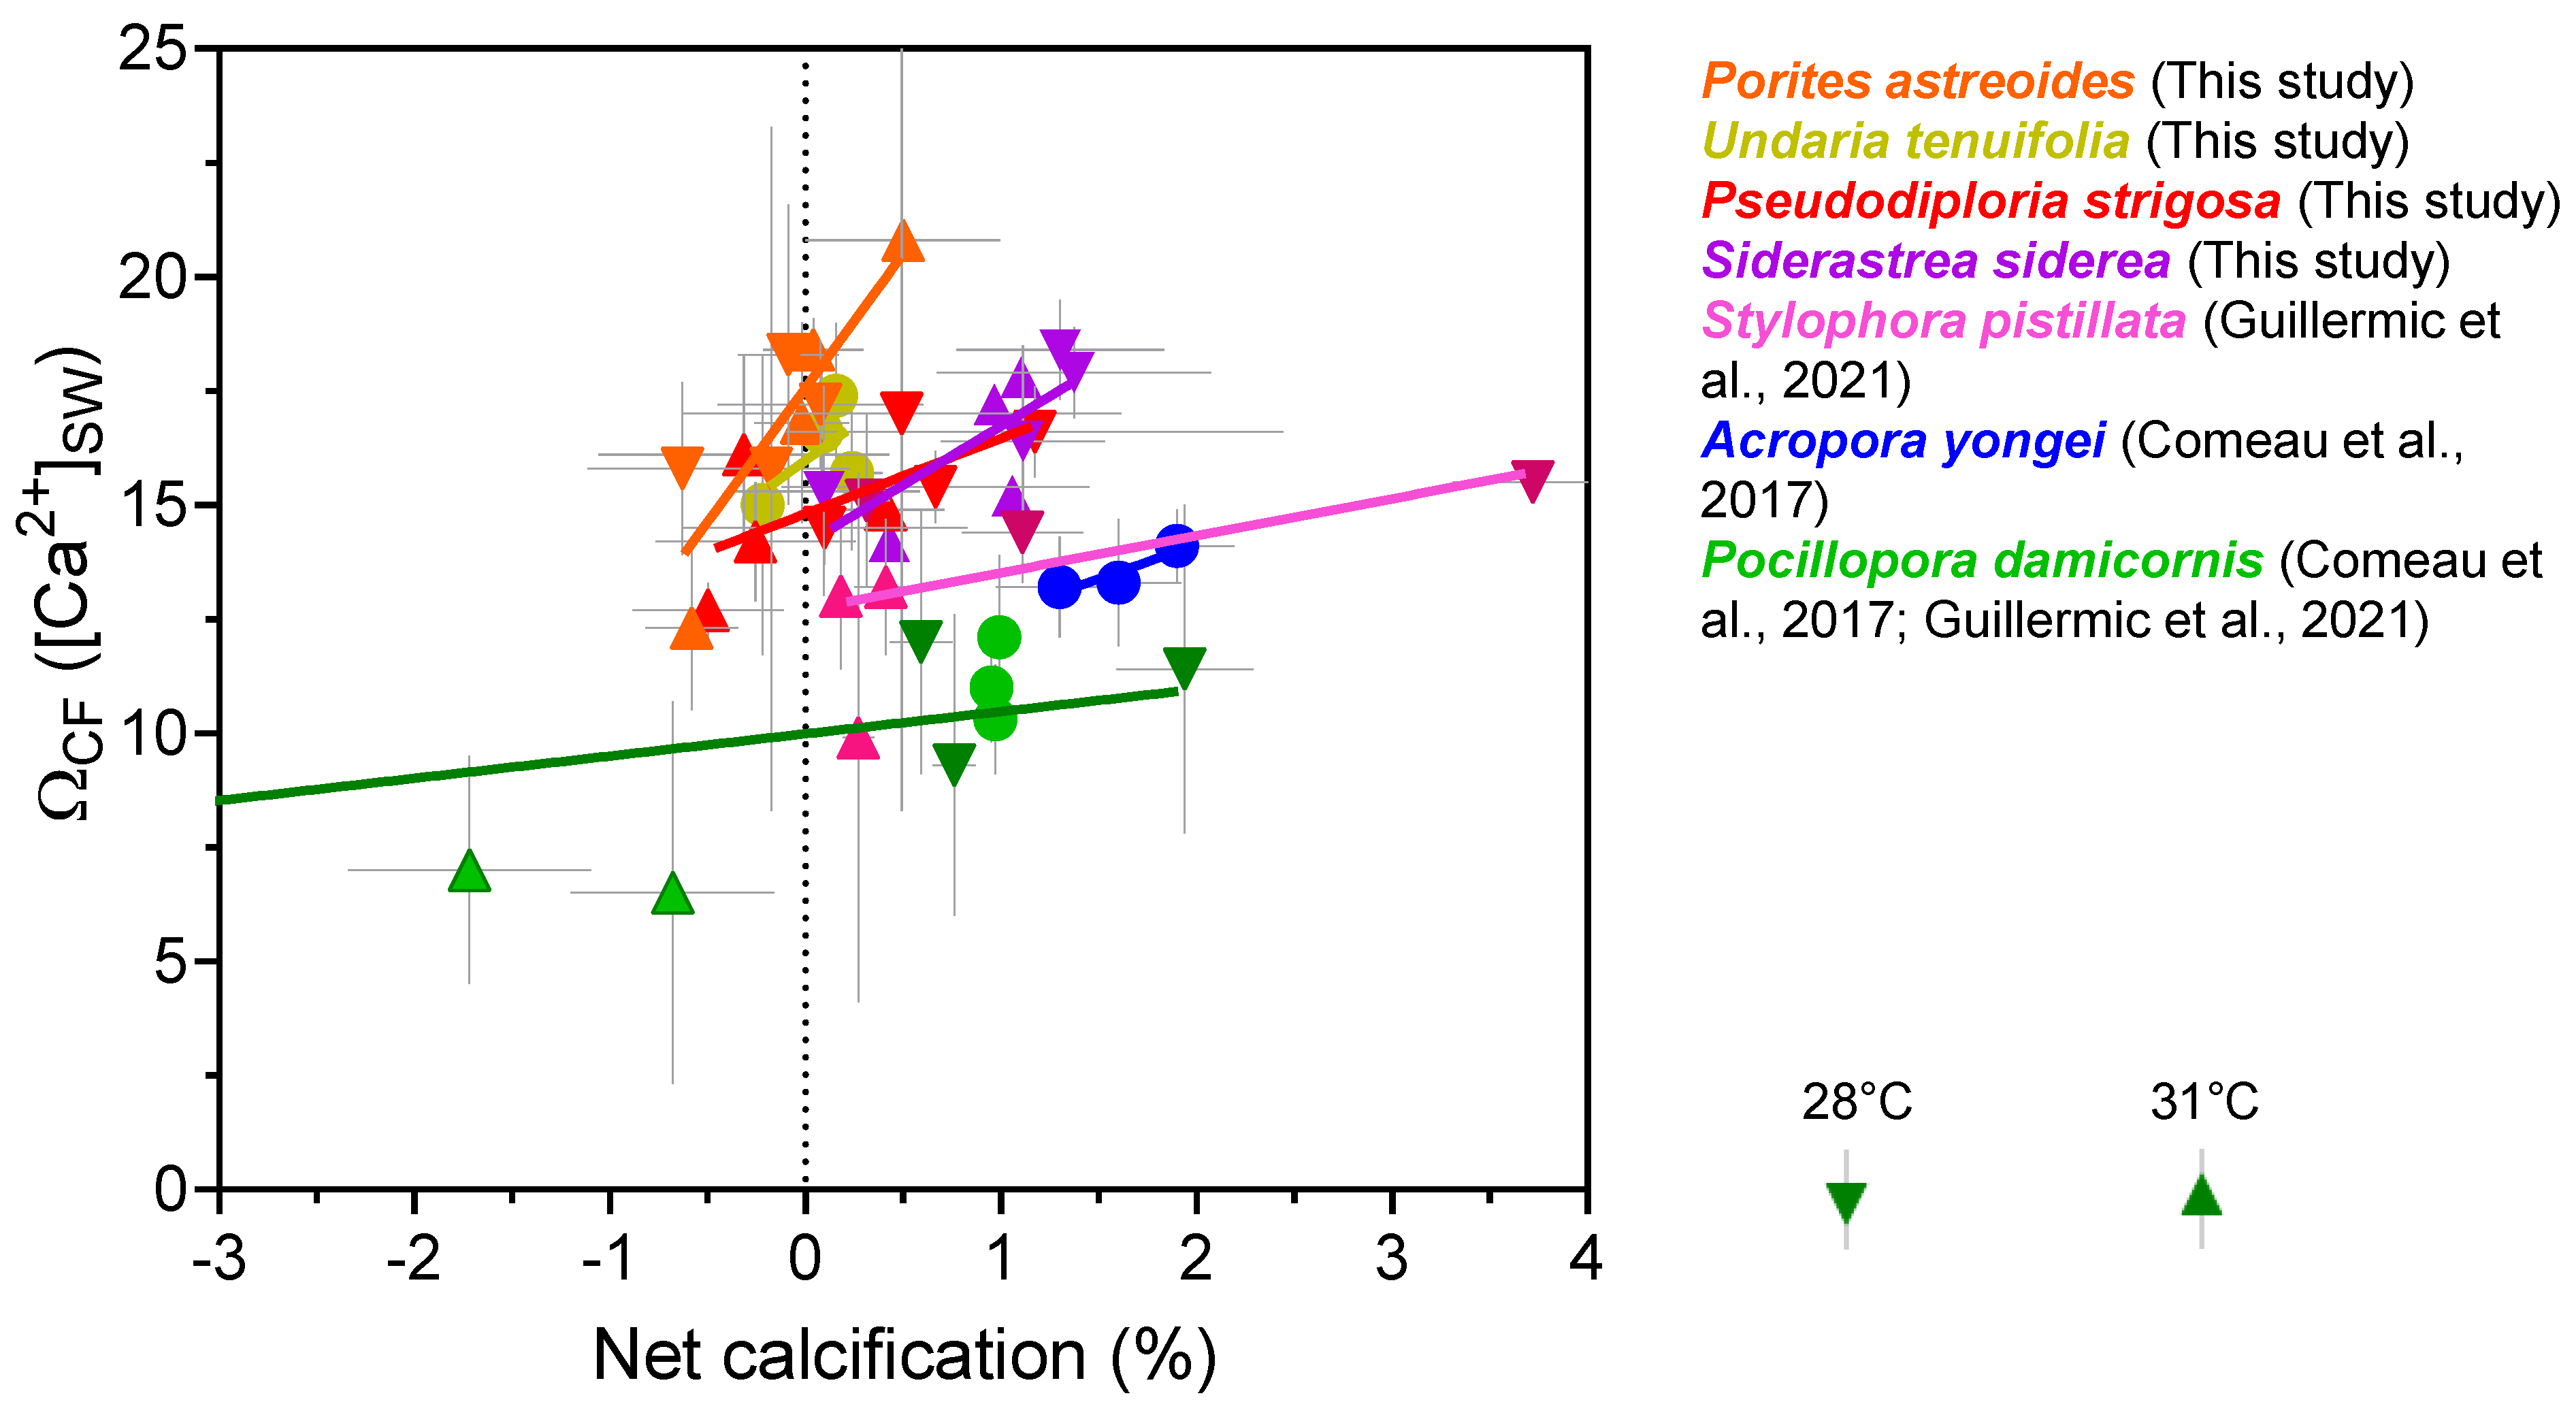
It should ultimately be ΩCF that is the most influential factor in coral calcification. If pHCF modestly decreases, but ΩCF remains high enough to support efficient coral calcification, then this may explain how corals continue calcifying despite acidification of their calcifying fluid. Calculating ΩCF requires an additional assumption due to the lack of constraints on [Ca2+]CF. We conducted a set of calculations where [Ca2+]CF is assumed to be equivalent to [Ca2+]SW (Table 2 and Table S7). The calculated saturation states were then plotted against coral calcification data (Figure 9). Our compilation of ΩCF exhibits inter-species variation, but none of the four species (S. siderea, P. strigosa, P. astreoides and U. tenuifolia) exhibit significantly different values from each other at under control temperature and pCO2 conditions (ANOVA test, p = 0.2), but were significantly higher compared to that calculated for S. pistillata [7], A. yongei (p < 0.05) and P. damicornis (p < 0.05) [7,67] using the same assumptions. Species-specific threshold values of ΩCF, where calcification is outweighed by dissolution, can be estimated from Figure 9, but care should be taken interpreting those absolute values due to the lack of constraints on [Ca2+]CF. There is a possibility that [Ca2+]CF could differ between species, as highlighted by previous work on A. yongei and P. damicornis [51]. In addition, the highest calculated ΩCF values do not translate to highest calcification rates for the corals, which may reflect prior observations that coral calcification is complex process beyond simple physicochemical manipulation of the calcifying fluid [78,82].
Statistical analyses of coral and symbiont physiological data from this experiment have been explored elsewhere [39]. Here, we perform additional 2-way ANOVA tests on the same data to produce statistical tests that are handled identically between the geochemical and physiological data. In P. astreoides, we found significant individual and combined effects of pCO2 and temperature on Chl a, and total host energy reserves, but not on symbiont cell density. Significantly, and as noted in previous work of Bove et al. [39], the significant effect of temperature on Chl a in P. astreoides is actually to increase levels, whereas for all other significant effects reported from our ANOVA test they are characterizing decreases. However, it is important to note that temperature actually improved symbiont physiological parameters in this species, rather than repressing them as reported previously for this species [39]. In P. strigosa, only temperature had an effect on both symbiont cell density and total host energy reserves. Significant individual effects of both temperature and pCO2 on both symbiont cell density and Chl a were observed for S. siderea, whilst only temperature had an effect on total host energy for this species. For U. tenuifolia, only pCO2 had an effect on Chl a. Results of these analyses are presented in Table 4. Specimens of S. siderea were collected from both the inshore and offshore environments and previous work showed that reef environment affected physiological response; however, our results show a nonsignificant effect of reef environment on physiological data (Table S10), which likely reflects the difference in statistical approaches, with ANOVA tests employed here on single parameters versus the principal component analyses conducted by Bove et al. [39].
These physiological data are relevant for understanding how host and symbionts responses to environmental change may influence the chemistry of the calcifying fluid. It is notable that in the three coral species examined (excluding U. tenuifolia), temperature was found to influence total host energy reserves, or the total of the lipid, carbohydrate, and protein concentrations for a given area of coral host tissue. Temperature was not found to influence pHCF and [CO32−]CF, but in all three corals was found to reduce [DIC]CF (Table 4). Whilst this observation does not prove cause and effect, it is consistent with temperature stress causing depletion of host energy reserves, and reduced host input of respiration produced CO2 into the DIC pool for calcification. As temperature increase was associated with reduced symbiont cell density and Chl a in some of the corals, this is consistent with a scenario where the symbiont was less efficiently supplying energy to the host, leading to the observed decrease in energy reserves.
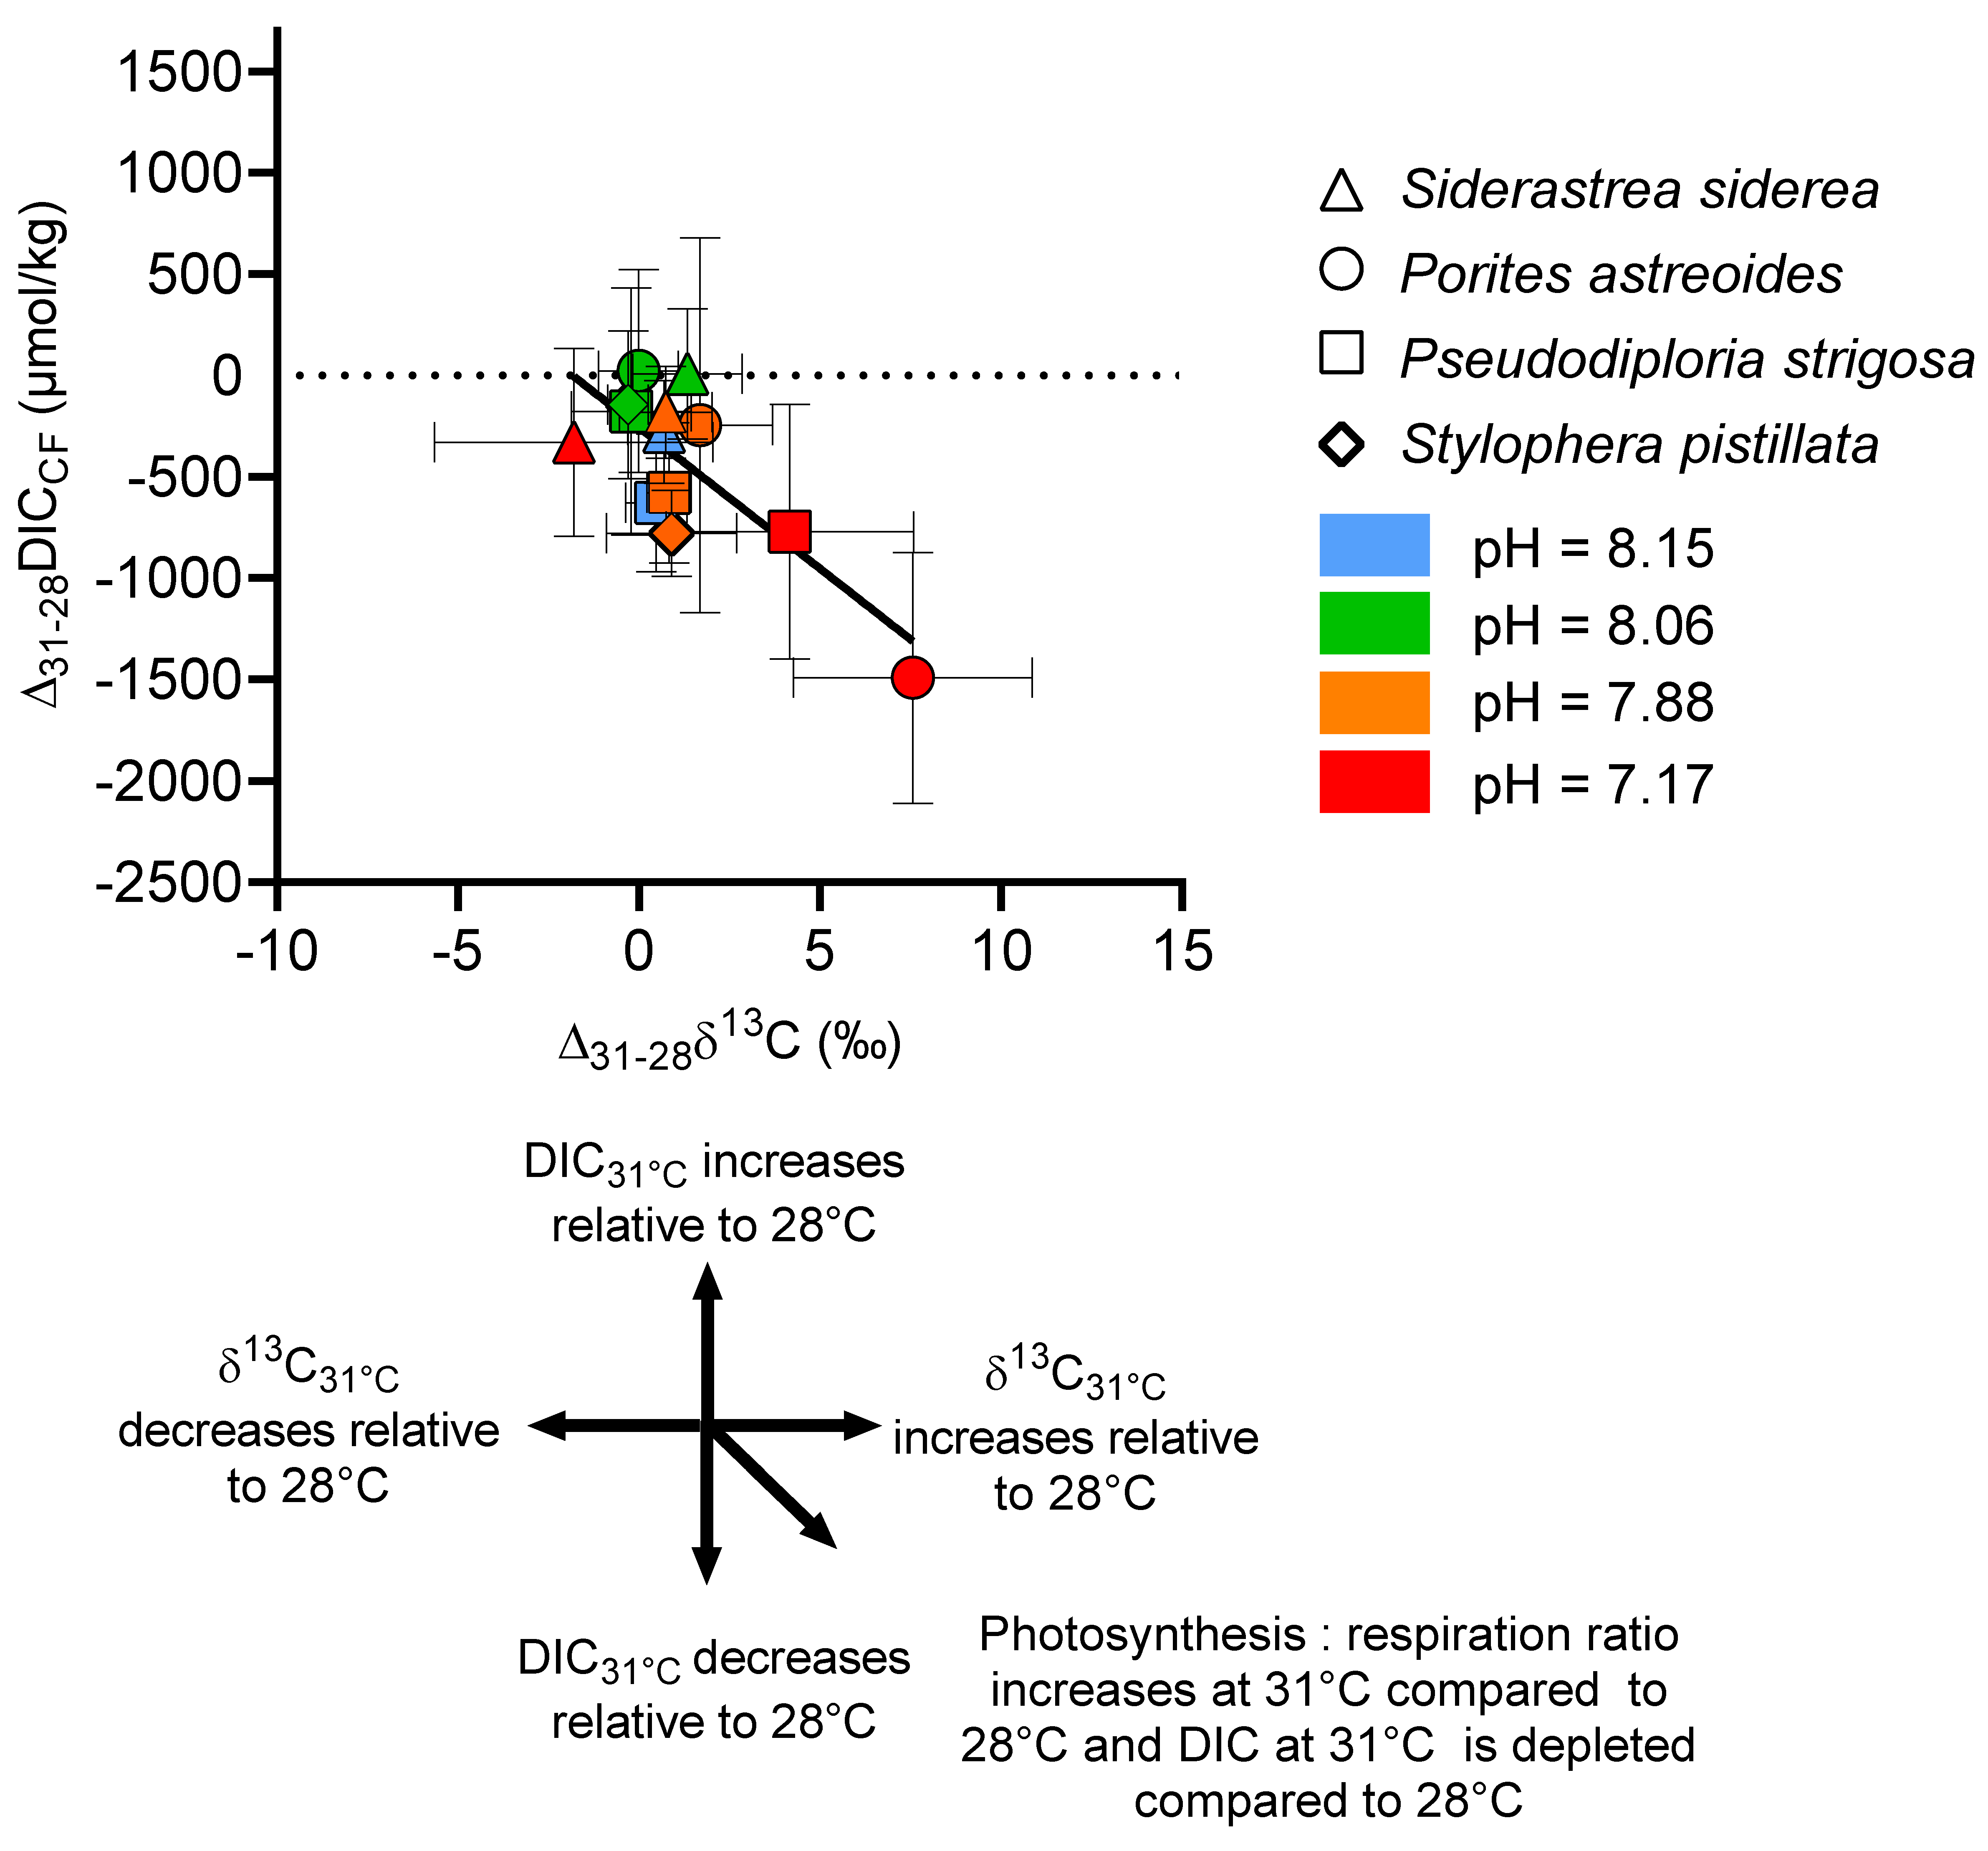
To further explore the relationship between these host and symbiont physiological changes and the source of carbon in the calcification fluid, we examined ∆δ13C (δ13C31°C − δ13C28°C) for each pCO2 treatment. In Figure 10, ∆δ13C is plotted against ∆[DIC] ([DIC]31°C − [DIC]28°C). This analysis shows that, on one hand, there is a significant difference in the source of carbon for calcification between S. siderea and S. pistillata, for which temperature did not influence δ13C at the higher pCO2 conditions. On the other hand, it shows that at higher pCO2 conditions, ∆δ13C of P. astreoides and P. strigosa (Figure 10) shifted to more positive values and that ∆[DIC] shifted towards more negative values compared to the other corals, with the overall effect most pronounced in P. astreoides. The potential mechanisms driving these trends are discussed below.

4. Discussion

Collectively, the data from this study and the literature suggest that most corals experience a degree of acidification of their internal calcification fluid media in response to external seawater acidification. Nonetheless, considerable biological compensation is observed for the studied species, which maintain a larger proton differential between the calcifying fluid and seawater under elevated pCO2. Therefore, the slight decreases in pHCF under elevated pCO2 may represent either a practical tradeoff by the coral, or a biological limit to controlling calcifying fluid chemistry that still allows the coral to maintain [CO32−]CF and ΩCF at a level that supports efficient calcification. The hypothesis that this is an active and energy-consuming adaptation by corals is supported by the finding that the ability of corals to regulate pH and carbonate chemistry of their calcifying fluid can be impaired by thermal stress and symbiont loss [7,25]. In contrast to our studies of S. pistillata and P. damicornis [7,25], we found that temperature did not result in a statistically significant change in pHCF regulation across all conditions in the Caribbean species investigated here, although it did under a subset of the experimental conditions in S. siderea. This may reflect that the highest temperature treatment in the present experiment [38,39], did not elicit as severe an effect on the corals and their symbionts as in the prior experiment [7,25], with the exception of U. tenuifolia that had too high a mortality at elevated temperature to be examined. Notably, the Ca-ATPase inhibitor experiments of Allison et al. [32], and the heat stress experiments of Guillermic et al. [7], on Pocillopora damicornis are the only experiments where corals appeared to almost completely lose the ability to elevate pHCF relative to seawater, as shown in Figure 5.
Furthermore, we are able to examine associations between coral and symbiont physiological responses and calcifying fluid regulation. This revealed a significant depletion in total host energy reserves at elevated temperature, as well as a reduction in [DIC]CF in all three corals examined. The reduction in calculated [DIC]CF with temperature increase was also seen in the S. pistillata and P. damicornis experiment described in Guillermic et al. [7]. This result is consistent with a reduction in the energy transfer between the symbiont and host leading to the host depleting its energy reserves and/or the host consuming more energy in response to temperature stress. Although we cannot prove cause and effect, changes in the energy balance between host and symbiont could then lead to a reduction in the production of metabolic CO2 that is contributed to the DIC pool for calcification, which is consistent with the reduction we see in calculated [DIC]CF in these corals. The story is also more complex, however, with additional interactions apparent from the δ13C data.
Although the δ13C data did not indicate major differences in host and symbiont physiological influence on [DIC]CF for the different coral species under the control CO2 conditions, significant differences in δ13C emerged under elevated temperature and CO2 amongst the species, with shifts towards positive δ13C associated with amplified reductions in [DIC]CF in two of the coral species studied.
It is thought that changes in the flux of carbon to and from photosynthesis and respiration, respectively, may change the δ13C of the DIC pool used for calcification. Photosynthesis preferentially consumes 12C, which may then result in 13C enrichment in the DIC pool for calcification if this pool acts as a source of CO2 for photosynthesis [83]. As the rate of photosynthesis increases and/or the rate of respiration decreases, the DIC pool should have more positive δ13C resulting in more positive coral skeletal δ13C [83,84]. In the present experiment, we can see that host respiration input is likely decreasing as the host consumes energy reserves at elevated temperature. There is also an overall reduction in [DIC]CF, which is likely due to a reduction in CO2-input from respiration. One way to explain the relationship between the ∆δ13C and ∆[DIC] data in Figure 10 is that, in addition to the reduction in respiration-sourced CO2 to the DIC pool for calcification, photosynthetic drawdown of 12CO2 by the symbiont is significantly enriching the δ13C of the DIC pool in P. astreoides and P. strigosa at highest temperature and pCO2 conditions, which could further deplete [DIC]CF and drive more positive ∆δ13C. This effect was not seen in a similar experiment on S. pistillata [7] where symbiont loss and bleaching of the coral occurred [25], which suggests that photosynthetic influence over the DIC pool was minimal at the higher temperature and pCO2 conditions. This interpretation is also congruent with observations from this experiment that the symbiont in P. astreoides is not negatively impacted by increased temperature [39] and is evidence for a divergent host and symbiont physiological response to environmental parameters in this coral species. Conversely, the effects of host respiration and symbiont photosynthesis remained relatively balanced in terms of their influence on the source of DIC for calcification in S. siderea. It has been previously noted that P. astreoides, S. siderea, and P. strigosa host differing algal symbiont communities which may result in differing carbon allocation between the host and symbiont [39]. For example, S. siderea mainly hosts Cladocopium and Breviolum whereas P. astreoides hosts Breviolum and Symbiodinium [39]. The potential changes in carbon flux between the host and symbiont is interesting to consider in the context of the debate on the extent of mutualism between the coral host and symbiont, and whether the symbiont develops features that are more parasitic in nature under environmental change [39,85,86].
Overall, the results presented here and in previous work on these corals [7,38,39,87] highlight the considerable complexity in host and symbiont responses to ocean warming and acidification, demonstrating that these responses are closely coupled to a coral’s physicochemical control of their calcification process. The combined physiological data from this study, preceding studies [38,39,87], as well as the work of other groups (e.g., [88]), converge on the conclusion that S. siderea is a relatively resilient species to environmental change and so may be amongst the least impacted by future warming and acidification, compared to a number of more sensitive Caribbean species studied such as O. faveolata, M. cavernosa, and U tenuifolia [38,88]. Some differences in observations on P. astreoides between studies exist in its temperature sensitivity [38,88] which may reflect intraspecific differences in host or symbiont physiology, with the evidence here suggesting thermal sensitivity can be relatively low for the symbiont of at least some Caribbean P. astreoides but that reductions in net calcification can still occur in non-bleached corals in acidified seawater.
The type of data presented here provides useful insights into the underlying physiological mechanisms of coral adaptation, and the variation in responses between species in an experiment. Whilst difficult to make regional or global predictions from single studies, a recent metanalyses of experimental data suggested that at the levels predicted over the next century acidification is less of a threat to Caribbean corals compared to warming but that there is evidence for variation across the region and considerable data gaps [89]. Despite this finding, the evidence presented in this paper suggest acidification resilient Caribbean corals maintain increasingly large proton differentials with seawater under acidification, highlighting that there may be an energetic cost to this adaption that corals would have to maintain indefinitely in the future. The work here also highlights that warming can have complex influences on the calcification processes even outside a severe bleaching event through changes to the partitioning of carbon between the host, symbiont, and the pool of ions used for calcification. The sustainability of these adaptations to acidification and warming are largely unexplored in Caribbean corals, but is highly relevant given findings from this experiment that even if positive net calcification is maintained in environmental challenge experiments corals could be depleting energy reserves [39]. Therefore, it will be important for future research to attempt to determine whether even the relatively resilient species such as S. siderea can maintain their short-term adaptive responses over the longer term.
Overall, the results presented here and in previous work on these corals [7,38,39,87] highlight the considerable complexity in host and symbiont responses to ocean warming and acidification, and demonstrate that these responses are closely coupled to a coral’s physicochemical control of their calcification process.

Supplementary Materials

The following supporting information can be downloaded at: https://www.mdpi.com/article/10.3390/jmse10081075/s1, Table S1: Measured Culture Conditions in the 8 Experimental Setups from Bove et al., 2019; Table S2: Calculated Culture Conditions in the 8 Experimental Setups from Bove et al., 2019; Table S3: Physiological data of the host and the symbionts originally published in Bove et al. (2021) from the same corals used in this study; Table S4: Boron isotope standard reproducibility; Table S5: Reproducibility of B/Ca analyses of CamWuellestorfi and NEP standards; Table S6: Functions used for data transformations according the method of Tukey et al., 1977; Table S7: Geochemical data and calculated parameters from individual Caribbean coral specimens, of which the average per experimental condition are given in main text Table 1 and Table 2; Table S8: Average and individual coral specimen geochemical data and calculations from Stylophera pistillata; Table S9: AIC results for Caribbean coral geochemical data as a function of the pH of seawater in the experiment and net calcification as a function of calculated CF parameter data; Table S10: Calculations of pH gradient between seawater and the calcifying fluid; Table S11: ANOVA results for Caribbean coral geochemical and physiological data; Table S12: Compilation of published data used in the main text.

Author Contributions

Conceptualization, R.A.E., K.D.C. and J.B.R.; methodology, R.A.E., S.M., K.D.C. and J.B.R.; formal analysis, C.B.B., L.P.C., S.M., B.A.C., M.G., I.D.C. and R.A.E.; investigation, C.B.B., L.P.C., M.G., I.D.C., K.D.C., R.A.E. and J.B.R.; resources, R.A.E., K.D.C. and J.B.R.; data curation, M.G. and R.A.E.; writing—original draft preparation, R.A.E. and I.D.C.; writing—review and editing, all authors; visualization, M.G., I.D.C. and R.A.E.; supervision, R.A.E., K.D.C. and J.B.R.; project administration, R.A.E., K.D.C. and J.B.R.; funding acquisition, R.A.E., K.D.C. and J.B.R. All authors have read and agreed to the published version of the manuscript.

Funding

RAE and JBR acknowledge support from National Science Foundation grants OCE-1437166 and OCE-1437371. KDC acknowledges support from NSF grant OCE-1459522. RAE, MG, ID, and BA were also supported by the “Laboratoire d’Excellence” LabexMER (ANR-10-LABX-19) Chair to RAE, co-funded by a grant from the French government under the program “Investissements d’Avenir” and MG was supported by an IAGC student grant 2017. RAE acknowledges support from the Pritzker Endowment to UCLA IoES, and JBR acknowledges support from the ZMT and the Hanse-Wissenschaftskolleg Fellowship Program. BA was supported by an NSF GRFP. M.G., I.D., and BA were supported by the Center for Diverse Leadership in Science, funded by NSF, the Packard Foundation, Sloan Foundation, and Silicon Valley Community Foundation.

Data Availability Statement

Data will be archived in the BCO-DMO archive on publication of this article (https://www.bco-dmo.org/, accessed on 24 July 2022).

Acknowledgments

We thank Belize Fisheries Department for all associated permits, the Toledo Institute for Development and Environment (TIDE), and the Southern Environmental Association (SEA) for their continued support, as well as Garbutt’s Marine for assistance in the field.

Conflicts of Interest

The authors declare no conflict of interest. The funders had no role in the design of the study; in the collection, analyses, or interpretation of data; in the writing of the manuscript, or in the decision to publish the results.

References

  1. Glynn, P.W. Coral reef bleaching in the 1980s and possible connections with global warming. Trends Ecol. Evol. 1991, 6, 175–179. [Google Scholar] [CrossRef]
  2. Hughes, T.P.; Kerry, J.T.; Álvarez-Noriega, M.; Álvarez-Romero, J.G.; Anderson, K.D.; Baird, A.H.; Babcock, R.C.; Beger, M.; Bellwood, D.R.; Berkelmans, R.; et al. Global warming and recurrent mass bleaching of corals. Nature 2017, 543, 373–377. [Google Scholar] [CrossRef] [PubMed]
  3. Doney, S.C.; Fabry, V.J.; Feely, R.A.; Kleypas, J.A. Ocean Acidification: The Other CO2 Problem. Annu. Rev. Mar. Sci. 2009, 1, 169–192. [Google Scholar] [CrossRef] [PubMed]
  4. Iglesias-Rodriguez, M.D.; Halloran, P.R.; Rickaby, R.E.M.; Hall, I.R.; Colmenero-Hidalgo, E.; Gittins, J.R.; Green, D.R.H.; Tyrrell, T.; Gibbs, S.J.; von Dassow, P.; et al. Phytoplankton Calcification in a High-CO2 World. Science 2008, 320, 336–340. [Google Scholar] [CrossRef]
  5. Ries, J.B.; Cohen, A.L.; McCorkle, D.C. Marine calcifiers exhibit mixed responses to CO2-induced ocean acidification. Geology 2009, 37, 1131–1134. [Google Scholar] [CrossRef]
  6. Kroeker, K.; Micheli, F.; Gambi, M.C. Ocean acidification causes ecosystem shifts via altered competitive interactions. Nat. Clim. Chang. 2012, 3, 156–159. [Google Scholar] [CrossRef]
  7. Guillermic, M.; Cameron, L.P.; De Corte, I.; Misra, S.; Bijma, J.; de Beer, D.; Reymond, C.E.; Westphal, H.; Ries, J.B.; Eagle, R.A. Thermal stress reduces pocilloporid coral resilience to ocean acidification by impairing control over calcifying fluid chemistry. Sci. Adv. 2021, 7, eaba9958. [Google Scholar] [CrossRef]
  8. Marubini, F.; Atkinson, M. Effects of lowered pH and elevated nitrate on coral calcification. Mar. Ecol. Prog. Ser. 1999, 188, 117–121. [Google Scholar] [CrossRef]
  9. Langdon, C.; Takahashi, T.; Sweeney, C.; Chipman, D.; Goddard, J.; Marubini, F.; Aceves, H.; Barnett, H.; Atkinson, M.J. Effect of calcium carbonate saturation state on the calcification rate of an experimental coral reef. Glob. Biogeochem. Cycles 2000, 14, 639–654. [Google Scholar] [CrossRef]
  10. Langdon, C. Effect of elevated pCO2 on photosynthesis and calcification of corals and interactions with seasonal change in temperature/irradiance and nutrient enrichment. J. Geophys. Res. Earth Surf. 2005, 110, C9. [Google Scholar] [CrossRef]
  11. Marubini, F.; Barnett, H.; Langdon, C.; Atkinson, M.J. Dependence of calcification on light and carbonate ion concentration for the hermatypic coral Porites compressa. Mar. Ecol. Prog. Ser. 2001, 220, 153–162. [Google Scholar] [CrossRef]
  12. Renegar, D.; Riegl, B. Effect of nutrient enrichment and elevated CO2 partial pressure on growth rate of Atlantic scleractinian coral Acropora cervicornis. Mar. Ecol. Prog. Ser. 2005, 293, 69–76. [Google Scholar] [CrossRef]
  13. Schneider, K.; Erez, J. The effect of carbonate chemistry on calcification and photosynthesis in the hermatypic coral Acropora eurystoma. Limnol. Oceanogr. 2006, 51, 1284–1293. [Google Scholar] [CrossRef]
  14. Anthony, K.R.N.; Kline, D.I.; Diaz-Pulido, G.; Dove, S.; Hoegh-Guldberg, O. Ocean acidification causes bleaching and productivity loss in coral reef builders. Proc. Natl. Acad. Sci. USA 2008, 105, 17442–17446. [Google Scholar] [CrossRef] [PubMed]
  15. Jokiel, P.L.; Rodgers, K.S.; Kuffner, I.B.; Andersson, A.J.; Cox, E.F.; Mackenzie, F.T. Ocean acidification and calcifying reef organisms: A mesocosm investigation. Coral Reefs 2008, 27, 473–483. [Google Scholar] [CrossRef]
  16. Marubini, F.; Ferrier-Pagès, C.; Furla, P.; Allemand, D. Coral calcification responds to seawater acidification: A working hypothesis towards a physiological mechanism. Coral Reefs 2008, 27, 491–499. [Google Scholar] [CrossRef]
  17. Krief, S.; Hendy, E.J.; Fine, M.; Yam, R.; Meibom, A.; Foster, G.L.; Shemesh, A. Physiological and isotopic responses of scleractinian corals to ocean acidification. Geochim. Cosmochim. Acta 2010, 74, 4988–5001. [Google Scholar] [CrossRef]
  18. Holcomb, M.; Cohen, A.L.; McCorkle, D.C. An investigation of the calcification response of the scleractinian coral Astrangia poculata to elevated pCO2 and the effects of nutrients, zooxanthellae and gender. Biogeosciences 2012, 9, 29–39. [Google Scholar] [CrossRef]
  19. Edmunds, P.J.; Brown, D.; Moriarty, V. Interactive effects of ocean acidification and temperature on two scleractinian corals from Moorea, French Polynesia. Glob. Chang. Biol. 2012, 18, 2173–2183. [Google Scholar] [CrossRef]
  20. Comeau, S.; Carpenter, R.C.; Edmunds, P.J. Effects of irradiance on the response of the coral Acropora pulchra and the calcifying alga Hydrolithon reinboldii to temperature elevation and ocean acidification. J. Exp. Mar. Biol. Ecol. 2014, 453, 28–35. [Google Scholar] [CrossRef]
  21. Reynaud, S.; Leclercq, N.; Romaine-Lioud, S.; Ferrier-Pagés, C.; Jaubert, J.; Gattuso, J.-P. Interacting effects of CO2 partial pressure and temperature on photosynthesis and calcification in a scleractinian coral. Glob. Chang. Biol. 2003, 9, 1660–1668. [Google Scholar] [CrossRef]
  22. Rodolfo-Metalpa, R.; Martin, S.; Ferrier-Pagès, C.; Gattuso, J.-P. Response of the temperate coral Cladocora caespitosa to mid- and long-term exposure to pCO2 and temperature levels projected for the year 2100 AD. Biogeosciences 2010, 7, 289–300. [Google Scholar] [CrossRef]
  23. Edmunds, P.J. Zooplanktivory ameliorates the effects of ocean acidification on the reef coral Porites spp. Limnol. Oceanogr. 2011, 56, 2402–2410. [Google Scholar] [CrossRef]
  24. Schoepf, V.; Grottoli, A.G.; Warner, M.E.; Cai, W.-J.; Melman, T.F.; Hoadley, K.D.; Pettay, D.T.; Hu, X.; Li, Q.; Xu, H.; et al. Coral Energy Reserves and Calcification in a High-CO2 World at Two Temperatures. PLoS ONE 2013, 8, e75049. [Google Scholar] [CrossRef] [PubMed]
  25. Cameron, L.P.; Reymond, C.E.; Bijma, J.; Büscher, J.; De Beer, D.; Guillermic, M.; Eagle, R.A.; Gunnel, J.; Müller-Lundin, F.; Schmidt-Greib, G.; et al. Impacts of warming and acidification on coral calcification linked to symbiont loss and deregulation of calcifying fluid pH. J. Mar. Sci. Eng. 2022, unpublished. [Google Scholar]
  26. Innis, T.; Allen-Waller, L.; Brown, K.T.; Sparagon, W.; Carlson, C.; Kruse, E.; Huffmyer, A.S.; Nelson, C.E.; Putnam, H.M.; Barott, K.L. Marine heatwaves depress metabolic activity and impair cellular acid–base homeostasis in reef-building corals regardless of bleaching susceptibility. Glob. Chang. Biol. 2021, 27, 2728–2743. [Google Scholar] [CrossRef]
  27. D’Olivo, J.P.; McCulloch, M. Response of coral calcification and calcifying fluid composition to thermally induced bleaching stress. Sci. Rep. 2017, 7, 2207. [Google Scholar] [CrossRef]
  28. D’Olivo, J.P.; Ellwood, G.; DeCarlo, T.M.; McCulloch, M. Deconvolving the long-term impacts of ocean acidification and warming on coral biomineralisation. Earth Planet. Sci. Lett. 2019, 526, 115785. [Google Scholar] [CrossRef]
  29. Schoepf, V.; D’Olivo, J.P.; Rigal, C.; Jung, E.M.U.; McCulloch, M.T. Heat stress differentially impacts key calcification mechanisms in reef-building corals. Coral Reefs 2021, 40, 459–471. [Google Scholar] [CrossRef]
  30. Venn, A.; Tambutté, E.; Holcomb, M.; Allemand, D.; Tambutté, S. Live Tissue Imaging Shows Reef Corals Elevate pH under Their Calcifying Tissue Relative to Seawater. PLoS ONE 2011, 6, e20013. [Google Scholar] [CrossRef]
  31. Venn, A.A.; Tambutté, E.; Holcomb, M.; Laurent, J.; Allemand, D.; Tambutté, S. Impact of seawater acidification on pH at the tissue–skeleton interface and calcification in reef corals. Proc. Natl. Acad. Sci. USA 2012, 110, 1634–1639. [Google Scholar] [CrossRef] [PubMed]
  32. Allison, N.; Cohen, I.; Finch, A.A.; Erez, J.; Tudhope, A.W. Corals concentrate dissolved inorganic carbon to facilitate calcification. Nat. Commun. 2014, 5, 5741. [Google Scholar] [CrossRef] [PubMed]
  33. McCulloch, M.T.; D’Olivo, J.P.; Falter, J.; Georgiou, L.; Holcomb, M.; Montagna, P.; Trotter, J.A. Boron Isotopic Systematics in Scleractinian Corals and the Role of pH Up-regulation. In Boron Isotopes. Advances in Isotope Geochemistry; Springer: Cham, Switzerland, 2017; pp. 145–162. [Google Scholar] [CrossRef]
  34. Venn, A.A.; Tambutté, E.; Caminiti-Segonds, N.; Techer, N.; Allemand, D. Effects of light and darkness on pH regulation in three coral species exposed to seawater acidification. Sci. Rep. 2019, 9, 2201. [Google Scholar] [CrossRef] [PubMed]
  35. Sevilgen, D.S.; Venn, A.A.; Hu, M.Y.; Tambutté, E.; de Beer, D.; Planas-Bielsa, V.; Tambutté, S. Full in vivo characterization of carbonate chemistry at the site of calcification in corals. Sci. Adv. 2019, 5, eaau7447. [Google Scholar] [CrossRef]
  36. Guo, W. Seawater temperature and buffering capacity modulate coral calcifying pH. Sci. Rep. 2019, 9, 1189. [Google Scholar] [CrossRef] [PubMed]
  37. Chalk, T.B.; Standish, C.D.; D’Angelo, C.; Castillo, K.D.; Milton, J.A.; Foster, G.L. Mapping coral calcification strategies from in situ boron isotope and trace element measurements of the tropical coral Siderastrea siderea. Sci. Rep. 2021, 11, 472. [Google Scholar] [CrossRef]
  38. Bove, C.B.; Ries, J.B.; Davies, S.W.; Westfield, I.T.; Umbanhowar, J.; Castillo, K.D. Common Caribbean corals exhibit highly variable responses to future acidification and warming. Proc. R. Soc. B Boil. Sci. 2019, 286, 20182840. [Google Scholar] [CrossRef]
  39. Bove, C.B.; Davies, S.W.; Ries, J.B.; Umbanhowar, J.; Thomasson, B.C.; Farquhar, E.B.; McCoppin, J.A.; Castillo, K.D. Global change differentially modulates coral physiology and suggests future shifts in Caribbean reef assemblages. bioRxiv 2021. [Google Scholar] [CrossRef]
  40. Castillo, K.D.; Lima, F.P. Comparison of in situ and satellite-derived (MODIS-Aqua/Terra) methods for assessing temperatures on coral reefs. Limnol. Oceanogr. Methods 2010, 8, 107–117. [Google Scholar] [CrossRef]
  41. Barker, S.; Greaves, M.; Elderfield, H. A study of cleaning procedures used for foraminiferal Mg/Ca paleothermometry. Geochem. Geophys. Geosyst. 2003, 4. [Google Scholar] [CrossRef]
  42. Gaillardet, J.; Lemarchand, D.; Göpel, C.; Manhès, G. Evaporation and Sublimation of Boric Acid: Application for Boron Purification from Organic Rich Solutions. Geostand. Geoanal. Res. 2001, 25, 67–75. [Google Scholar] [CrossRef]
  43. Misra, S.; Owen, R.; Kerr, J.; Greaves, M.; Elderfield, H. Determination of δ11B by HR-ICP-MS from mass limited samples: Application to natural carbonates and water samples. Geochim. Cosmochim. Acta 2014, 140, 531–552. [Google Scholar] [CrossRef]
  44. Guillermic, M.; Misra, S.; Eagle, R.; Villa, A.; Chang, F.; Tripati, A. Seawater pH reconstruction using boron isotopes in multiple planktonic foraminifera species with different depth habitats and their potential to constrain pH and pCO2 gradients. Biogeosciences 2020, 17, 3487–3510. [Google Scholar] [CrossRef]
  45. Lloyd, N.S.; Sadekov, A.Y.; Misra, S. Application of 1013 ohm Faraday cup current amplifiers for boron isotopic analyses by solution mode and laser ablation multicollector inductively coupled plasma mass spectrometry. Rapid Commun. Mass Spectrom. 2017, 32, 9–18. [Google Scholar] [CrossRef]
  46. McCulloch, M.T.; Holcomb, M.; Rankenburg, K.; Trotter, J.A. Rapid, high-precision measurements of boron isotopic compositions in marine carbonates. Rapid Commun. Mass Spectrom. 2014, 28, 2704–2712. [Google Scholar] [CrossRef]
  47. Holcomb, M.; Venn, A.A.; Tambutté, E.; Allemand, D.; Trotter, J.; McCulloch, M.; Tambutte, S. Coral calcifying fluid pH dictates response to ocean acidification. Sci. Rep. 2014, 4, 5207. [Google Scholar] [CrossRef] [PubMed]
  48. Sutton, J.N.; Liu, Y.-W.; Ries, J.B.; Guillermic, M.; Ponzevera, E.; Eagle, R.A. δ11B as monitor of calcification site pH in divergent marine calcifying organisms. Biogeosciences 2018, 15, 1447–1467. [Google Scholar] [CrossRef]
  49. Gutjahr, M.; Bordier, L.; Douville, E.; Farmer, J.; Foster, G.L.; Hathorne, E.C.; Hönisch, B.; Lemarchand, D.; Louvat, P.; McCulloch, M.; et al. Sub-Permil Interlaboratory Consistency for Solution-Based Boron Isotope Analyses on Marine Carbonates. Geostand. Geoanal. Res. 2021, 45, 59–75. [Google Scholar] [CrossRef]
  50. Hemming, N.; Hanson, G. Boron isotopic composition and concentration in modern marine carbonates. Geochim. Cosmochim. Acta 1992, 56, 537–543. [Google Scholar] [CrossRef]
  51. Decarlo, T.M.; Comeau, S.; Cornwall, C.E.; McCulloch, M.T. Coral resistance to ocean acidification linked to increased calcium at the site of calcification. Proc. R. Soc. B Boil. Sci. 2018, 285, 20180564. [Google Scholar] [CrossRef]
  52. Foster, G.L.; von Strandmann, P.P.; Rae, J. Boron and magnesium isotopic composition of seawater. Geochem. Geophys. Geosyst. 2010, 11. [Google Scholar] [CrossRef]
  53. Dickson, A.G. Thermodynamics of the dissociation of boric acid in synthetic seawater from 273.15 to 318.15 K. Deep Sea Res. Part A Oceanogr. Res. Pap. 1990, 37, 755–766. [Google Scholar] [CrossRef]
  54. Lee, K.; Kim, T.-W.; Byrne, R.H.; Millero, F.J.; Feely, R.A.; Liu, Y.-M. The universal ratio of boron to chlorinity for the North Pacific and North Atlantic oceans. Geochim. Cosmochim. Acta 2010, 74, 1801–1811. [Google Scholar] [CrossRef]
  55. Upadhyay, D.; Lucarelli, J.; Arnold, A.; Flores, R.; Bricker, H.; Ulrich, R.N.; Jesmok, G.; Santi, L.; Defliese, W.; Eagle, R.A.; et al. Carbonate clumped isotope analysis (Δ47) of 21 carbonate standards determined via gas-source isotope-ratio mass spectrometry on four instrumental configurations using carbonate-based standardization and multiyear data sets. Rapid Commun. Mass Spectrom. 2021, 35, e9143. [Google Scholar] [CrossRef] [PubMed]
  56. Tukey, J. Exploratory Data Analysis; Addison-Wesley: Reading, MA, USA, 1977. [Google Scholar]
  57. Hönisch, B.; Hemming, N.; Grottoli, A.; Amat, A.; Hanson, G.; Bijma, J. Assessing scleractinian corals as recorders for paleo-pH: Empirical calibration and vital effects. Geochim. Cosmochim. Acta 2004, 68, 3675–3685. [Google Scholar] [CrossRef]
  58. Reynaud, S.; Hemming, N.G.; Juillet-Leclerc, A.; Gattuso, J.-P. Effect of pCO2 and temperature on the boron isotopic composition of the zooxanthellate coral Acropora sp. Coral Reefs 2004, 23, 539–546. [Google Scholar] [CrossRef]
  59. Trotter, J.; Montagna, P.; McCulloch, M.; Silenzi, S.; Reynaud, S.; Mortimer, G.; Martin, S.; Ferrier-Pagès, C.; Gattuso, J.-P.; Rodolfo-Metalpa, R. Quantifying the pH ‘vital effect’ in the temperate zooxanthellate coral Cladocora caespitosa: Validation of the boron seawater pH proxy. Earth Planet. Sci. Lett. 2011, 303, 163–173. [Google Scholar] [CrossRef]
  60. Rollion-Bard, C.; Blamart, D.; Trebosc, J.; Tricot, G.; Mussi, A.; Cuif, J.-P. Boron isotopes as pH proxy: A new look at boron speciation in deep-sea corals using 11B MAS NMR and EELS. Geochim. Cosmochim. Acta 2011, 75, 1003–1012. [Google Scholar] [CrossRef]
  61. Ries, J.B. A physicochemical framework for interpreting the biological calcification response to CO2-induced ocean acidification. Geochim. Cosmochim. Acta 2011, 75, 4053–4064. [Google Scholar] [CrossRef]
  62. Anagnostou, E.; Huang, K.-F.; You, C.-F.; Sikes, E.; Sherrell, R. Evaluation of boron isotope ratio as a pH proxy in the deep sea coral Desmophyllum dianthus: Evidence of physiological pH adjustment. Earth Planet. Sci. Lett. 2012, 349–350, 251–260. [Google Scholar] [CrossRef]
  63. McCulloch, M.; Falter, J.; Trotter, J.; Montagna, P. Coral resilience to ocean acidification and global warming through pH up-regulation. Nat. Clim. Chang. 2012, 2, 623–627. [Google Scholar] [CrossRef]
  64. Tanaka, K.; Holcomb, M.; Takahashi, A.; Kurihara, H.; Asami, R.; Shinjo, R.; Sowa, K.; Rankenburg, K.; Watanabe, T.; McCulloch, M. Response of Acropora digitifera to ocean acidification: Constraints from δ11B, Sr, Mg, and Ba compositions of aragonitic skeletons cultured under variable seawater pH. Coral Reefs 2015, 34, 1139–1149. [Google Scholar] [CrossRef]
  65. Georgiou, L.; Falter, J.; Trotter, J.; Kline, D.I.; Holcomb, M.; Dove, S.G.; Hoegh-Guldberg, O.; McCulloch, M. pH homeostasis during coral calcification in a free ocean CO 2 enrichment (FOCE) experiment, Heron Island reef flat, Great Barrier Reef. Proc. Natl. Acad. Sci. USA 2015, 112, 13219–13224. [Google Scholar] [CrossRef]
  66. Cai, W.J.; Ma, Y.; Hopkinson, B.M.; Grottoli, A.G.; Warner, M.E.; Ding, Q.; Hu, X.; Yuan, X.; Schoepf, V.; Xu, H.; et al. Microelectrode characterization of coral daytime interior pH and carbonate chemistry. Nat. Commun. 2016, 7, 11144. [Google Scholar] [CrossRef]
  67. Comeau, S.; Cornwall, C.E.; McCulloch, M. Decoupling between the response of coral calcifying fluid pH and calcification to ocean acidification. Sci. Rep. 2017, 7, 7573. [Google Scholar] [CrossRef]
  68. Comeau, S.; Tambutté, E.; Carpenter, R.C.; Edmunds, P.J.; Evensen, N.R.; Allemand, D.; Ferrier-Pagès, C.; Venn, A.A. Coral calcifying fluid pH is modulated by seawater carbonate chemistry not solely seawater pH. Proc. R. Soc. B Boil. Sci. 2017, 284, 20161669. [Google Scholar] [CrossRef] [PubMed]
  69. Liu, Y.-W.; Sutton, J.N.; Ries, J.B.; Eagle, R.A. Regulation of calcification site pH is a polyphyletic but not always governing response to ocean acidification. Sci. Adv. 2020, 6, eaax1314. [Google Scholar] [CrossRef]
  70. Allison, N.; Cole, C.; Hintz, C.; Hintz, K.; Rae, J.; Finch, A. Resolving the interactions of ocean acidification and temperature on coral calcification media pH. Coral Reefs 2021, 40, 1807–1818. [Google Scholar] [CrossRef]
  71. Allison, N.; Cohen, I.; Finch, A.A.; Erez, J. Controls on Sr/Ca and Mg/Ca in scleractinian corals: The effects of Ca-ATPase and transcellular Ca channels on skeletal chemistry. Geochim. Cosmochim. Acta 2011, 75, 6350–6360. [Google Scholar] [CrossRef]
  72. Pierrot, D.; Lewis, E.; Wallace, D.W.R. MS Excel Program Developed for CO2 System Calculations. In Carbon Dioxide Information Analysis Center, Oak Ridge National Laboratory; U.S. Department of Energy: Oak Ridge, TN, USA, 2006. [Google Scholar] [CrossRef]
  73. Al-Horani, F.A.; Almoghrabi, S.M.; De Beer, D. The mechanism of calcification and its relation to photosynthesis and respiration in the scleractinian coral Galaxea fascicularis. Mar. Biol. 2003, 142, 419–426. [Google Scholar] [CrossRef]
  74. McCulloch, M.T.; D’Olivo, J.P.; Falter, J.; Holcomb, M.; Trotter, J. Coral calcification in a changing World and the interactive dynamics of pH and DIC upregulation. Nat. Commun. 2017, 8, 15686. [Google Scholar] [CrossRef] [PubMed]
  75. Allison, N. Reconstructing coral calcification fluid dissolved inorganic carbon chemistry from skeletal boron: An exploration of potential controls on coral aragonite B/Ca. Heliyon 2017, 3, e00387. [Google Scholar] [CrossRef] [PubMed]
  76. Mavromatis, V.; Montouillout, V.; Noireaux, J.; Gaillardet, J.; Schott, J. Characterization of boron incorporation and speciation in calcite and aragonite from co-precipitation experiments under controlled pH, temperature and precipitation rate. Geochim. Cosmochim. Acta 2015, 150, 299–313. [Google Scholar] [CrossRef]
  77. Holcomb, M.; DeCarlo, T.; Gaetani, G.; McCulloch, M. Factors affecting B/Ca ratios in synthetic aragonite. Chem. Geol. 2016, 437, 67–76. [Google Scholar] [CrossRef]
  78. Mass, T.; Giuffre, A.J.; Sun, C.-Y.; Stifler, C.A.; Frazier, M.J.; Neder, M.; Tamura, N.; Stan, C.V.; Marcus, M.A.; Gilbert, P.U.P.A. Amorphous calcium carbonate particles form coral skeletons. Proc. Natl. Acad. Sci. USA 2017, 114, E7670–E7678. [Google Scholar] [CrossRef]
  79. Evans, D.; Gray, W.R.; Rae, J.; Greenop, R.; Webb, P.B.; Penkman, K.; Kröger, R.; Allison, N. Trace and major element incorporation into amorphous calcium carbonate (ACC) precipitated from seawater. Geochim. Cosmochim. Acta 2020, 290, 293–311. [Google Scholar] [CrossRef]
  80. Ulrich, R.N.; Guillermic, M.; Campbell, J.; Hakim, A.; Han, R.; Singh, S.; Stewart, J.D.; Román-Palacios, C.; Carroll, H.M.; De Corte, I.; et al. Patterns of Element Incorporation in Calcium Carbonate Biominerals Recapitulate Phylogeny for a Diverse Range of Marine Calcifiers. Front. Earth Sci. 2021, 9, 641760. [Google Scholar] [CrossRef]
  81. Giuffre, A.J.; Gagnon, A.C.; De Yoreo, J.J.; Dove, P.M. Isotopic tracer evidence for the amorphous calcium carbonate to calcite transformation by dissolution–reprecipitation. Geochim. Cosmochim. Acta 2015, 165, 407–417. [Google Scholar] [CrossRef]
  82. Von Euw, S.; Zhang, Q.; Manichev, V.; Murali, N.; Gross, J.; Feldman, L.C.; Gustafsson, T.; Flach, C.; Mendelsohn, R.; Falkowski, P.G. Biological control of aragonite formation in stony corals. Science 2017, 356, 933–938. [Google Scholar] [CrossRef]
  83. Swart, P.; Leder, J.; Szmant, A.; Dodge, R. The origin of variations in the isotopic record of scleractinian corals: II. Carbon. Geochim. Cosmochim. Acta 1996, 60, 2871–28856. [Google Scholar] [CrossRef]
  84. Grottoli, A.G. Effect of light and brine shrimp on skeletal δ13C in the Hawaiian coral Porites compressa: A tank experiment. Geochim. Cosmochim. Acta 2002, 66, 1955–1967. [Google Scholar] [CrossRef]
  85. Baker, A.C. Reef corals bleach to survive change. Nature 2001, 411, 765–766. [Google Scholar] [CrossRef] [PubMed]
  86. Baker, D.M.; Freeman, C.J.; Wong, J.C.; Fogel, M.L.; Knowlton, N. Climate change promotes parasitism in a coral symbiosis. ISME J. 2018, 12, 921–930. [Google Scholar] [CrossRef] [PubMed]
  87. Castillo, K.D.; Ries, J.B.; Bruno, J.F.; Westfield, I.T. The reef-building coral Siderastrea siderea exhibits parabolic responses to ocean acidification and warming. Proc. R. Soc. B Boil. Sci. 2014, 281, 20141856. [Google Scholar] [CrossRef] [PubMed]
  88. Okazaki, R.R.; Towle, E.K.; Hooidonk, R.; Mor, C.; Winter, R.N.; Piggot, A.M.; Cunning, R.; Baker, A.; Klaus, J.S.; Swart, P.K.; et al. Species-specific responses to climate change and community composition determine future calcification rates of Florida Keys reefs. Glob. Chang. Biol. 2016, 23, 1023–1035. [Google Scholar] [CrossRef]
  89. Bove, C.B.; Umbanhowar, J.; Castillo, K.D. Meta-Analysis Reveals Reduced Coral Calcification Under Projected Ocean Warming but Not Under Acidification Across the Caribbean Sea. Front. Mar. Sci. 2020, 7, 127. [Google Scholar] [CrossRef]
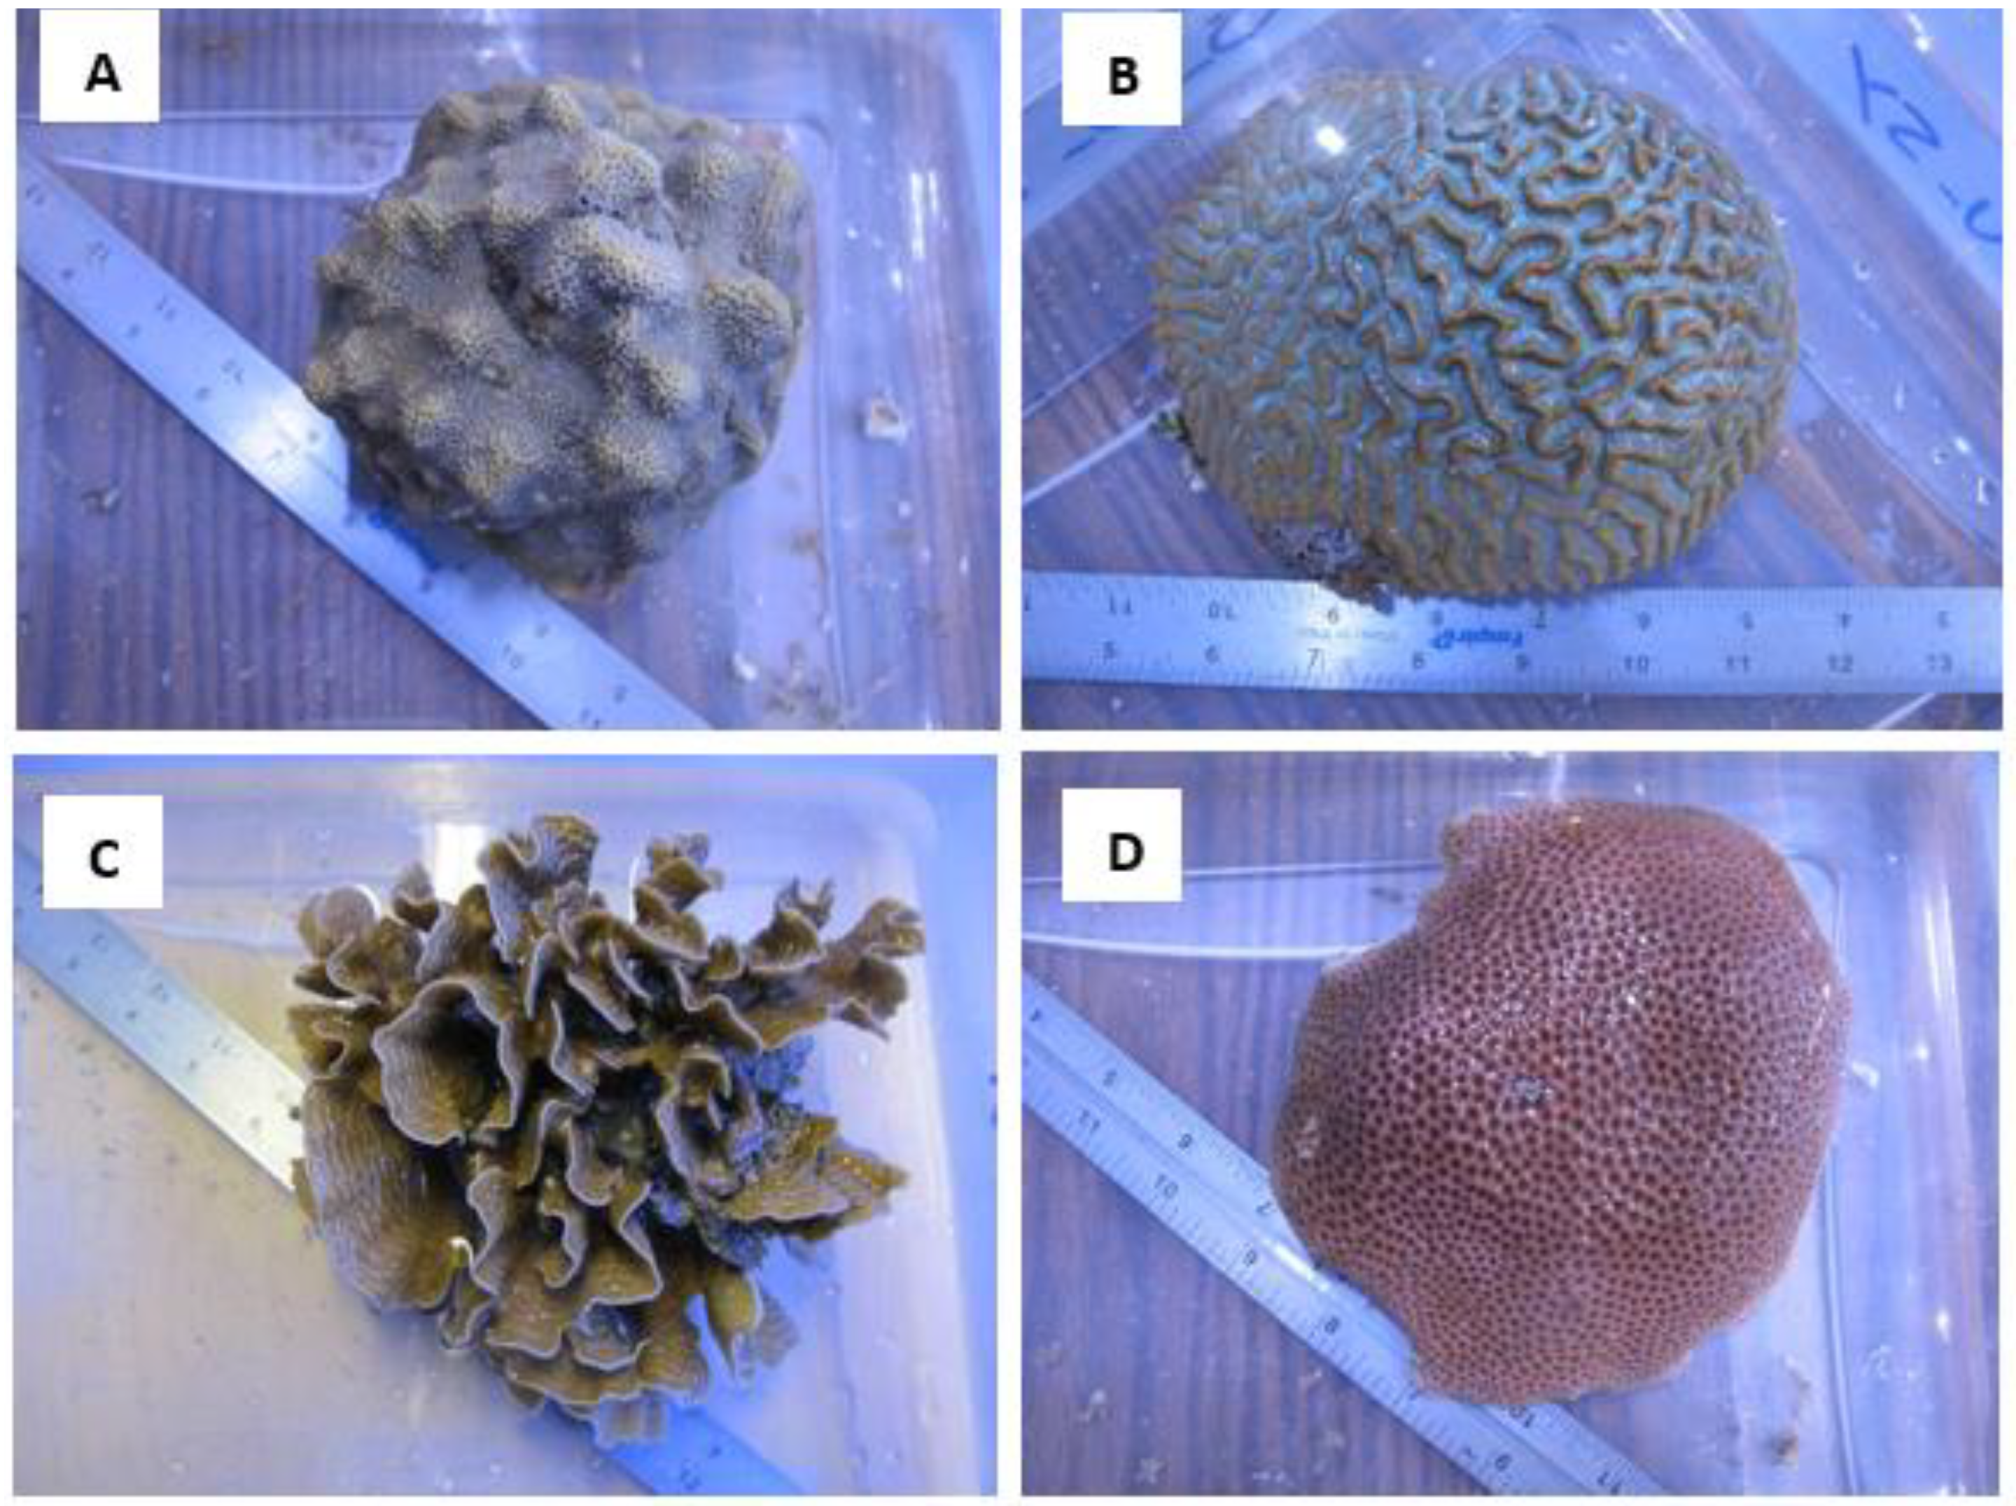
Figure 1. Sample photographs of the coral species cultured in the experiment of Bove et al. (2019) [38] and investigated here: (A) Porites astreoides, (B) Pseudodiploria strigosa, (C) Undaria tenuifolia, and (D) Siderastrea siderea.
Jmse 10 01075 g001
Figure 2. Measured δ11B (A), δ13C (B), and B/Ca (C) composition of coral aragonite following the 93-day culturing experiment. Large triangular symbols represent the mean value (±1SD) for each treatment condition. Blue symbols represent the control temperature (28 °C) treatment condition and red represents the high temperature (31 °C) treatment condition. Linear versus centered quadratic fit was determined using the Akaike’s Information Criteria test (Table S8), with shaded areas representing the 95% confidence interval. Dashed blue and red curves represent the expected δ11B composition of borate ion (B(OH)4−) in solution at 28 °C and 31 °C, respectively. * indicates a significant difference between 28 °C and 31 °C data for a given pCO2 treatment as demonstrated by a p-value < 0.05 in a Welch’s T test.
Jmse 10 01075 g002
Figure 3. (A) Measured net calcification rate (mg cm−2 d−1), replotted from Bove et al. [38]. (B) δ11B-derived pHCF. Triangle symbols represent the mean value (±1 SD) for each treatment condition, blue and red symbols represent the 28 °C and 31 °C treatments, respectively. Linear versus centered quadratic fit was determined using the Akaike’s Information Criteria test (Table S8), with shading representing the 95% confidence interval. * indicates a significant difference between 28 °C and 31 °C data for a given pCO2 treatment, as demonstrated by a p-value < 0.05 in a Welch’s T-test.
Jmse 10 01075 g003
Figure 4. (A) Measured net calcification rate (mg cm−2 d−1) replotted from Bove et al. [38] (B) B/Ca-derived carbonate ion concentration of the coral calcifying fluid ([CO32−]CF, μmol/mol), and (C) combined δ11B and B/Ca-derived dissolved inorganic carbon concentration of the coral calcifying fluid (DICCF, μmol/mol). Triangle symbols (±1 SD) represent the mean value for each treatment condition, blue and red symbols represent the 28 °C and 31 °C treatment conditions, respectively. Linear versus centered quadratic fit was determined using the Akaike Information Criteria test (Table S8), with shading representing the 95% confidence interval. * indicates a significant difference between 28 °C and 31 °C data for a given pCO2 treatment, as demonstrated by a p-value < 0.05 in a Welch’s-T test.
Jmse 10 01075 g004
Figure 5. Compilation of δ11B-derived calcification fluid pHCF data from shallow-water zooxanthellate coral culturing experiments. We include data from cold-water azooxanthellate corals as a point of reference, as well as ranges of pHCF data as determined by SNARF pH-sensitive dyes and pH microelectrode analyses. ‘RR’ label denotes corals treated with the Ca-ATPase inhibitor ruthenium red [32]. Previously published data used in the figure are available in Table S12 alongside citations for data sources.
Jmse 10 01075 g005
Figure 6. Compilation of combined δ11B and B/Ca-derived DICCF and [CO32−]CF measurements from available published data, as well as published microelectrode data. We include cultured shallow-water zooxanthellate corals, cold-water azooxanthellate corals, as well as a range of DICCF values as determined by SNARF-1 pH-sensitive dyes and pH microelectrode analyses. (A) DICCF as a function of pHSW (total scale), (B) DICCF as a function of DICSW, and (C) [CO32−]CF as a function of [CO32−]SW. ‘RR’ label denotes corals treated with the Ca-ATPase inhibitor ruthenium red [32]. Previously published data used in the figure are available in Table S12 alongside citations for data sources.
Jmse 10 01075 g006
Figure 7. Proton differentials maintained by the coral species between seawater and their calcifying fluid ([H+]SW − [H+]CF). Values are given for preindustrial, present day, mid-century, and extreme (~3300 ppm) pCO2 conditions, with precise pCO2 values given in Table S1. Calculated values are provided in Table S9.
Jmse 10 01075 g007
Figure 8. The sensitivity of pHCF to pHSW within the coral species studied here and reported in the literature. Y-Axis is the slope of the relationship between pHCF and pHSW, with a value of 1 showing that change in pHCF directly tracks the magnitude of the change in pHSW, and a value of 0 indicating perfect control over coral pHCF amidst variable pHSW. On X axis, numbers in parenthesis are the temperature of the experiment. Previously published data used in the figure are available in Table S12 alongside citations for data sources.
Jmse 10 01075 g008
Figure 9. Relationships between boron isotope derived ΩCF and net calcification rates. ΩCF is calculated assuming that [Ca2+] of seawater is equivalent to [Ca2+] of the calcifying fluid. Published data used in this figure is given in Table S12 with citations for data sources.
Jmse 10 01075 g009
Figure 10. Combined influence of temperature and pCO2 on the δ13C and [DIC] of the coral calcifying fluid. Data are expressed as ∆δ13C (δ13C 31°C − ∆δ13C 28°C) and ∆[DIC] ([DIC]31°C − [DIC]28°C) for each pCO2 treatment.
Jmse 10 01075 g010
Table 1. Average Geochemical Data per Experimental Condition.
SpeciesT (°C)CO2
(μatm)
δ11B
(‰) 1
Error (SD)N *B/Ca (μmol/mol)Error (SD)Nδ13C
(‰) 2
Error (SD)N
P. astreoides
2831123.20.96396546−2.30.54
2840523.60.96437316−2.60.94
2870222.71.45432534−5.21.54
28330922.10.8641046612.53.13
3128824.10.11389171−1.40.01
3144223.41.35424325−2.60.74
3167423.10.45443825−3.51.34
31328522.60.52568512−5.01.22
P. strigosa
2831224.20.66496436−2.20.65
2840624.51.55495704−1.11.53
2870223.30.76481356−4.00.64
28332022.21.3645541610.91.64
3128823.90.94527444−1.80.64
3144323.90.85495505−1.30.74
3167423.70.54528334−3.40.44
31328423.01.54530542−6.42.94
S. siderea
2831224.50.76450266−3.30.24
2840523.90.56436186−3.90.64
2870322.70.96424216−6.21.14
28331721.81.2641527612.51.73
3128824.20.45467115−2.60.23
3144923.40.76425226−2.61.44
3167322.10.75432104−5.51.43
31328521.31.4642821614.32.03
U. tenuifolia
2831224.590.684490514−2.20.44
2840424.250.564518324−2.60.34
2869823.541.254464764−3.81.04
28330322.531.944461624−7.22.84
* number of specimens analyzed; 1 NIST; 2 V-PDB.
Table 2. 2-way ANOVA output testing the influence of temperature and pCO2 on measured geochemical parameters.
Geochemical ParameterSpeciesExperimental VariableANOVA p-Value
δ11BP. astreoidesTemperature0.1171
CO20.0152
Temperature + CO20.6094
P. strigosaTemperature0.5521
CO20.00532
Temperature + CO20.59757
S. sidereaTemperature0.36
CO27.58 × 10−10
Temperature + CO20.441
U. tenuifoliaCO20.322
δ13CP. astreoidesTemperature0.152
CO24.12 × 10−5
Temperature + CO20.193
P. strigosaTemperature0.5521
CO20.00532
Temperature + CO20.59757
S. sidereaTemperature0.36
CO27.58 × 10−10
Temperature + CO20.441
U. tenuifoliaCO20.322
B/CaP. astreoidesTemperature0.22201
CO20.78951
Temperature + CO20.00939
P. strigosaTemperature0.00911
CO20.74462
Temperature + CO20.16759
S. sidereaTemperature0.17474
CO20.00103
Temperature + CO20.84438
U. tenuifoliaCO20.484
Table 3. Net calcification data and calculated calcifying fluid pH and carbonate system parameters.
SpeciesT (°C)CO2
(μatm)
Net Calcification
(mg cm−2 d−1)
Error (SD)N 1pHCFError (SD)DICCF
(mmol/mol)
Error (SD)[CO32−]CF
(mmol/mol)
Error (SD)CF 2Error (SD)N
P. astreoides
28311−0.080.26118.420.064983863113118120.93.46
284050.070.52128.450.06442135210538119.51.56
28702−0.170.4108.390.10456161895718017.83.34
283309−0.650.5128.350.05484151296910217.91.96
312880.50.568.45047770124202301
314420.040.2988.400.094434394105510719.525
31674−0.020.2498.380.024365703100413318.62.55
313285−0.540.2738.350.03335628673610613.622
P. strigosa
283120.921.28138.490.0438623629895918.31.16
2840611.1268.500.10388159010138518.71.64
287020.660.79148.430.0440253119334717.30.96
2833200.030.71168.360.0843394528766816.21.36
312880.410.398.430.06326998891216.40.22
31443−0.320.7468.430.05378239995913417.82.55
31674−0.230.5578.420.0334501098507815.71.43
313284−0.50.3988.370.10360942375935140.62
S. siderea
283121.300.57108.510.05421626111157620.61.46
284051.370.70128.470.03439119210876320.11.26
287031.080.45118.390.06459619499312918.42.46
2833170.130.52118.330.08476533392613317.12.56
312881.000.5488.460.03396911710333419.10.64
314491.160.70118.410.05440725210606219.61.16
316731.060.51118.320.0544491209094716.80.93
3132850.430.53128.260.10448028485111915.72.25
U. tenuifolia
283120.160.10118.520.04388644910378519.21.64
284040.240.1778.490.04367618895010217.61.94
286980.050.0848.440.0842307679969918.51.84
283303−0.230.0558.380.13428665790819816.83.74
1 Refers to number of specimens analyzed; 2CF values calculated using the assumption of [Ca]CF = [Ca]SW.
Table 4. 2-way ANOVA output testing the influence of temperature and pCO2 on calculated calcifying fluid carbonate system parameters and coral and symbiont physiological parameters.
Parameter/Species/Experimental Variable
p Value p Value
Symbiont cell density pHCF
P. astreoides P. astreoides
Temperature0.417Temperature0.676
CO20.11CO26.54 × 10−5
Temperature + CO20.466Temperature + CO20.286
P. strigosa P. strigosa
Temperature2.59 × 10−11Temperature0.42275
CO20.648CO20.00536
Temperature: CO20.15Temperature + CO20.62005
S. siderea S. siderea
Temperature9.09 × 10−5TemperatureNot Normal *
CO20.000251CO2Not Normal *
Temperature + CO20.858348Temperature + CO2Not Normal *
U. tenuifolia U. tenuifolia
CO20.727CO20.317
Chl a [CO32−]
P. astreoides P. astreoides
Temperature9.89 × 10−7Temperature0.41309
CO26.10 × 10−11CO20.00333
Temperature + CO22.80 × 10−9Temperature + CO20.22932
P. strigosa P. strigosa
Temperature6.15 × 10−8Temperature0.0988
CO20.000217CO20.0224
Temperature: CO20.070441Temperature: CO20.855
S. siderea S. siderea
Temperature0.00394Temperature0.679
CO21.37 × 10−7CO25.98 × 10−5
Temperature + CO20.25756Temperature + CO20.996
U. tenuifolia U. tenuifolia
CO20.033CO20.181
Total host energy [DIC]CF
P. astreoides P. astreoides
Temperature0.02755Temperature0.00163
CO20.00659CO20.69095
Temperature: CO20.06197Temperature + CO20.04313
P. strigosa P. strigosa
Temperature8.35 × 10−5Temperature0.00395
CO20.103CO20.26074
Temperature + CO20.857Temperature + CO20.3616
S. siderea S. siderea
Temperature0.000522Temperature0.00119
CO20.118746CO22.62 × 10−5
Temperature + CO20.710086Temperature + CO20.3765
U. tenuifolia U. tenuifolia
CO20.168CO20.463
Calcification rate
P. astreoides
Temperature0.0178
CO25.11 × 10−6
Temperature + CO20.1779
P. strigosa
Temperature0.000142
CO20.000364
Temperature + CO20.678234
S. siderea
Temperature0.52
CO23.27 × 10−8
Temperature + CO20.209
* Data did not reach normality even after transformation steps, so ANOVA test was not performed.
Publisher’s Note: MDPI stays neutral with regard to jurisdictional claims in published maps and institutional affiliations.