Abstract
Tidal bores are a natural phenomenon with high flow velocity and destructive potential. A spur dike is a widely used river regulation and embankment protection structure that minimizes erosion, promotes deposition, and protects riverbanks. However, the scouring mechanism around a spur dike under the action of a tidal bore is not fully understood, and accurately estimating the maximum scour depth has always been a challenge, limiting the construction and maintenance of spur dikes in estuarine and marine environments. This study analyzed the scouring characteristics around a spur dike induced by tidal bores via field observation and model experiments. The results show that the scours around a spur dike can be divided into dike head scour and upstream side scour. The scour depth is related to the geometric shape of the spur dike and its surrounding riverbed, hydrodynamic forces, and sediment characteristics. The least squares method obtained the fitting formulas for the depth of the scour at the dike head and upstream side. Overall, the present study indicates an agreement of the scouring characteristics around a spur dike between the field observations and laboratory experiment, and the fitting formulas can be effectively applied to engineering practices of a macro-tidal estuary.
1. Introduction
A tidal bore is the front of flood tide waves with rapidly rising tidal levels and changes in velocities [1]. It results from the nonlinear distortion of the tidal wave under specific conditions [2]. When the Qiantang River (QR) tidal bore arrives, the water level suddenly rises by approximately 2 m within seconds; the maximum is more than 3 m. The water flow rapidly changes from ebb tide to flood tide [3]. In the case of a sharp bend in the river or obstruction by buildings, the water column aroused will be more than 10 m. Within a few to tens of minutes after the tidal bore arrives, the velocity reaches its peak value, generally 6–8 m/s [4], and the on-site measured maximum speed is 12 m/s. Owing to the high flow velocity, its sediment carrying capacity is powerful, which corresponds to the water level and flow velocity. When the tidal bore arrives, the riverbed is intensively scoured. The vertical average suspended sediment concentration (SSC) can reach tens of kg/m3. SSC can reach hundreds of kg/m3 near the bottom, forming a large sediment concentration area. The enormous hydrodynamic force induced by the tidal bore impacts the seaward front of water-related infrastructure and threatens its stability and safety. From AD 766 to 2010, there were 394 tidal disasters in the QR estuary, with an average of once every 3 to 4 years [5], and recent climate change tends to accelerate marine disasters [6,7]. Seawalls, bridges, wharves, water intake, drainage structures, and other projects along the river are always destroyed by tidal bores, and shipping is also threatened by the tidal bore.
A spur dike (alternatively termed groyne or groin) is an artificial structure constructed at an angle to the mainstream direction to protect the riverbanks from erosion or to maintain a suitable channel for flood control and profitable navigability [8,9,10]. As the water flows around the spur dike, the flow pattern is modified because of the contraction of the channel width, and the flow structure and shear distribution around the spur dike are changed, which may lead to scouring until equilibrium is established between the horseshoe, wake vortices, and vertical component of down flow influencing the scouring action [11,12,13]. Numerous studies have been conducted on spur dikes using physical models and numerical simulations to identify the flow characteristics and the scour patterns around spur dike-like structures [14,15,16,17,18,19]. Previous studies show that the sedimentary environment and hydrodynamic forces dominate the deposition and scour patterns around the spur dikes [20,21]. The setting of spur dikes on riverbanks concentrates flows, increases the local velocities and riverbed shear stresses, induces three-dimensional flow turbulence, and generates horseshoe vortexes around the structure, resulting in the formation of scour holes [22]. There are considerable shear stress and pressure standard deviation values at the head of the spur dike and intensive horseshoe vortexes beneath the upstream side [23]. Moreover, it is noted that, while spur dikes have been successful in protecting the riverbank, they have also trimmed and reduced the cross-sectional area, average water depth, and tidal flat width, which possibly accelerates the degradation of channel morphology [24].
When a tidal bore moves upstream along the estuary, the infrastructure on both riverbanks, such as seawalls, bank slopes, apron slabs, spur dikes, pier foundations, and wharf facilities, is strongly affected by the tidal bore [25]. When a low spur dike blocks the tide bore, the water level facing the surface of the spur dike is sharply increased, resulting in a significant drop between the upstream and head of the dike, falling turbulent currents, and scour hole on the backside. As shown in Figure 1, spur dikes seriously collapse in severe cases caused by tidal bores. When encountering high spur dikes, the tide carrying the backwater of the tidal bore is higher, and even overtops the seawall. At the head of the spur dike, there are often scour holes caused by the concentration of water flow. Large blocks such as caissons and block stone reinforcement cages for dike head protection are washed away owing to the approach of scour holes, foundation instability, and strong tidal currents. On impervious revetments, such as aprons and the surface of spur dikes, the difference between the upper and lower pressures of the revetment under the action of a tidal bore constitutes the jacking force, which can sometimes overturn a large area of the concrete body as a whole (Figure 1c).
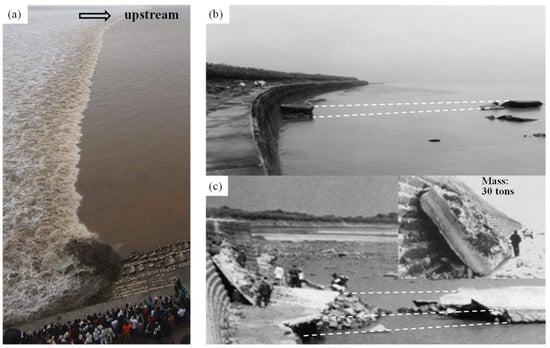
Figure 1.
Damages to a spur dike caused by tidal bores: (a) a tidal bore propagating upstream; (b) destroyed spur dike; and (c) overturned concrete armor (inset: concrete armor against the seawall moved by a tidal bore).
Following a review of the relevant literature, there is a lack of a comprehensive understanding of the scour around the spur dike triggered by a tidal bore in a macro-tidal estuaries, which results in restricting the safe construction and maintenance of related estuarine and marine projects. This research project covered this gap by investigating the flow structures and morphologic patterns near a spur dike at the action of a tidal bore via field observation and model experiments. Following Section 1, the field observation and model tests are presented in Section 2, detailed results and associated discussions are shown in Section 3, and closing remarks are offered in Section 4.
2. Materials and Methods
2.1. Study Site
As shown in Figure 2, the QR estuary is a funnel-shaped macro-tidal estuary with a celebrated tidal bore [26]. The width of the QR estuary at the mouth is 100 km, and the total length of the QR estuary is 300 km. The dam of the Fuchunjiang Hydropower Plant has controlled the upstream of the QR estuary since 1968, and the downstream is connected to the East China Sea. The construction of large-scale spur dike groups in the QR estuary began in the Yongzheng (1722–1735) period of the Qing Dynasty. The Tashan spur dike (Figure 2c) was completed in the fifth year of Qianlong (1740) and pioneered the construction of the QR rockfill spur dike. In 1928, a group of spur dikes was built on the banks from Xixing to Zheshan in the Hangzhou section of the QR; a concrete armor was used for the first time, which became the embryonic form of the modern spur dikes of the QR. According to incomplete statistics, from the confluence of the Puyang River to the Changshan sluice section, there are more than 180 spur dikes for riverbank protection.
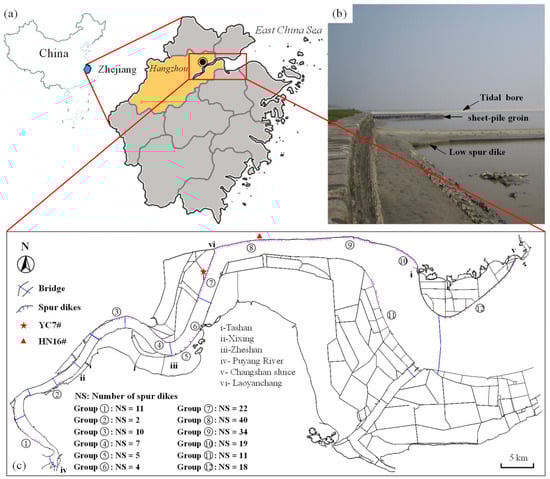
Figure 2.
Study area: (a) Zhejiang Province in China: (b) spur dikes in the Qiantang River (QR) estuary; and (c) distribution diagram of spur dikes in the QR (2014).
Spur dikes in the QR estuary are built to protect tidal flats along the riverbank to enhance the overall stability of seawalls. A low spur dike (Figure 2b) is constructed first by dumping stones, and then the covering masonry is laid and a caisson filled with rocks is placed at the head to prevent scouring. The length of a spur dike is approximately 100 m when used to protect the seawall toe in the river section with tidal bores in the QR estuary. The spacing between two spur dikes is three times the spur dike length. Impacts of strong tidal bores and turbulent flows around the head of the spur dike will carry away a large amount of sediment and rubble from the dike head, where deep scour holes are formed, leading to the collapse of the dike head, hollowing and fragmentation of the covering, and later damage to the whole groin. Numerous experiments have been carried out to investigate tidal-bore-induced failures of spur dikes. In 1999, the concept of a sheet-pile groin (Figure 2b) was proposed and later applied to engineering projects [27,28]. Figure 3 shows the plane layout of a sheet-pile groin.
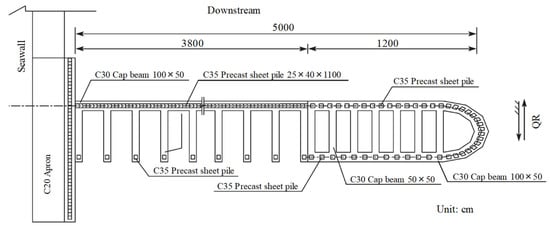
Figure 3.
The plane layout of a sheet-pile groin in the QR estuary.
2.2. Field Observation
The analysis of spur dike scour holes requires large-scale (larger map-to-ground ratio) topographic maps. Data scarcity is a universal issue that occurs in the analysis of scouring holes around spur dikes, owing to the high costs associated with bathymetric surveys. Because the bathymetric map must have enough fine resolution to characterize scouring shapes, maps with a scale of 1:2000 were selected. The QR is a typical tidal river, and the natural runoff is unevenly distributed throughout the year. The runoff during the plum rain season from April to June accounts for more than 50% of the annual total; typhoon-induced floods mostly occur in August and September, accompanied by larger tidal bores; the rest of the months are the dry season, and the riverbed is significantly silted. For a typical year (1995), two topographic maps of January and October were selected for the study. The topographic maps of the riverbed near the seawall with a large scale of 34 km from Laoyancang to Tashan (in Figure 2c) were measured. As shown in Figure 4, the survey range was within 200 m along the seawall on the north bank of the QR. In the case of spur dikes, it should be measured to 100 m outside the connecting line of the spur dike head, which should be measured according to the accuracy requirements of 1:2000 topographic maps. The two survey data represent the states of the spur dikes during low water and a weak tide (January) and after the spring tide bore (October). According to the survey results, the influencing factors of spur dike scour holes were counted, including the river regime, dike length and height, the included angle between the dike and the shoreline, dike structure, and riprap in the scour holes.
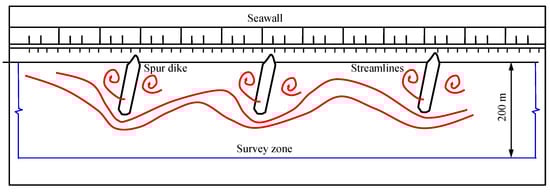
Figure 4.
Schematic diagram of the survey zone.
2.3. Experiment Description
The physical model experiment was conducted using the tide flume from the Zhejiang Institute of Hydraulics and Estuary (ZIHE, China). As shown in Figure 5, the flume is a reinforced concrete channel of 35 m long, 3.7 m wide, and 1.3 m deep, in which the movable bed section is 12 m long. The model adopted the advanced multi-pump frequency control system to generate a tide [29]. Currently, the sheet-pile groin is widely used in the tidal bore section of the QR because of its good stability and small maintenance workload during operation. Therefore, the spur dike selected in the model test was the sheet-pile groin.
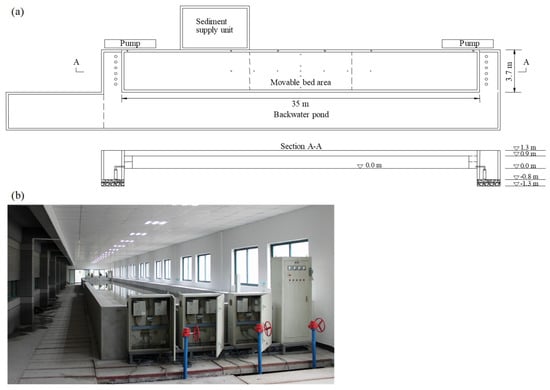
Figure 5.
Model layouts: (a) schematic diagram of the flume model test and (b) laboratory flume.
The primary tidal flow in estuarine and marine environments can be described by the unsteady two-dimensional shallow water equations, which are given in differential form as follows [29]:
where x and y are the longitudinal and transversal coordinates, respectively; u and v are the depth-averaged flow velocities in the x- and y-directions, respectively; h is the water depth; g is the gravitational acceleration; z is the water level; t is the time; R is the hydraulic radius; C is the Chezy coefficient, C = R1/6/n; and n is the Manning roughness coefficient.
The scale model relations can be derived using the similarity transformation of Equations (1)–(3). The scale of a quantity X is defined as follows [30]:
where the subscripts P and M refer to prototype and model, respectively.
Considering the characteristics of flow and sediment movement in the study area, the geometric scale of the flume model is 80. The flow meets gravity similarity and flows continuity similarity. The selection of model sand mainly considered the similarity of the sediment incipient and underwater repose angle. After comparison and choice, wood powder was selected as the model sand for the test. The median particle size was 0.05 mm and the incipient velocity was approximately 7 cm/s, which meets the similar incipient requirements. In the movable-bed test studies, considering the local scouring of spur dike under the action of tide bore, the similar conditions focus on the scale model relations on geometry, flow, and sediment movement between the prototype and model, as shown in Table 1.

Table 1.
Calculated and selected scale values of the model test.
3. Results and Discussions
3.1. Flow Structure around the Spur Dike
When a tidal bore arrives near the spur dike, it can be roughly divided into two parts: one is in the dike field (A) and another is in the main channel outside the dike field (B), as shown in Figure 6a. When there is no spur dike, the two parts are connected in a line. When crossing the dike, the situation changes dramatically. Part B moves upstream at the original speed and reaches the dike field in advance. Part A propagates in the dike field blocked by the spur dike, and the water level increases. Firstly, the reverse downward reflected bore (C) is formed; then, the overtopping flow (D) crosses the dike crest. The flow creates a descending flow on the dike surface, a hydraulic drop (E) at the dike head, and a hydraulic jump (F) at the upstream dike toe; finally, it continues to move upward in the form of a tidal bore. In every place between the two spur dikes, three parts pass through successively, i.e., oblique incidence part A outside the spur dikes, reflected part C in the upstream spur dikes, and overtopping part D across the spur dikes.
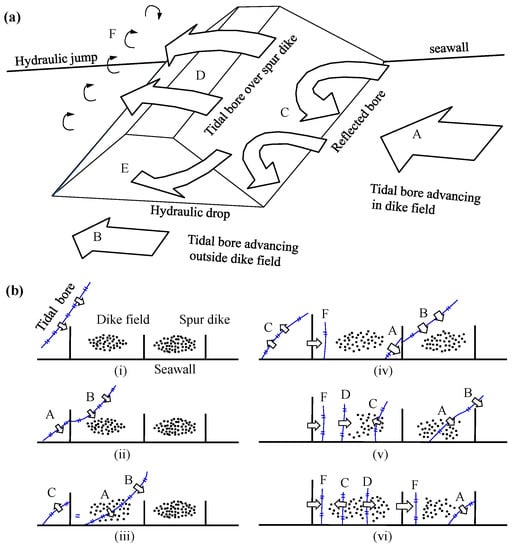
Figure 6.
Flow pattern near spur dike: (a) flow structures and (b) tidal bore advancing patterns.
3.2. Scour Holes around the Spur Dikes
As shown in Figure 7, the tidal bore overflows at the crest of the spur dike and generates a hydraulic jump, forming a scour hole parallel to the dike along the upstream slope toe. At the same time, the descending flow at the dike head erodes the foundation and creates a dike head scour hole. When the tide bores around the dike head, it will remove the underwater stones; thus, the slope of the scour hole around the dike head becomes steeper, resulting in the collapse of the dike head and shortening of the dike length.
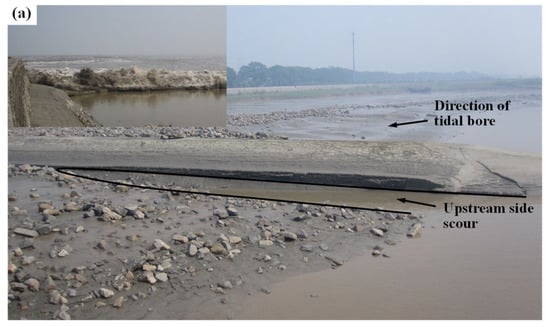
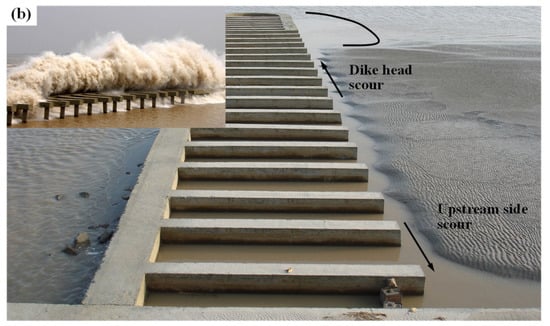
Figure 7.
Local scour around a spur dike: (a) a low spur dike and (b) a sheet-pile groin. Inset: an instance of tidal bore overtopping.
The typical topography of local scour holes around spur dikes obtained through field measurements is shown in Figure 8. It shows that the morphological patterns are similar around the two adjacent spur dikes in the dike field, indicating that they have consistency in flow structure and sediment transport process. Scour holes are mainly distributed at the head and upstream side of the spur dike. There is significant siltation in the dike field, up to 5 m different from the lowest elevation of the scour hole. The lowest point of the scour hole at the dike head is inclined to the downstream side, and the long diameter of the scour hole can reach one-quarter to one-third of the spur dike spacing. The patterns of scouring holes in January and October are similar, but the scouring amplitude of the latter is larger, which is mainly owing to the influence of spring tide in autumn. The scour hole at the dike head is most affected by the river regime. The depth of the scour hole of the dike head on the meander concave bank is more significant than that in the straight river section. The scour depth at the concave bank is 5–7 m and that in the straight river section is 3–5 m.
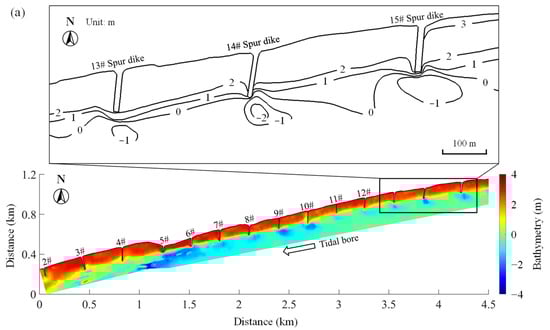
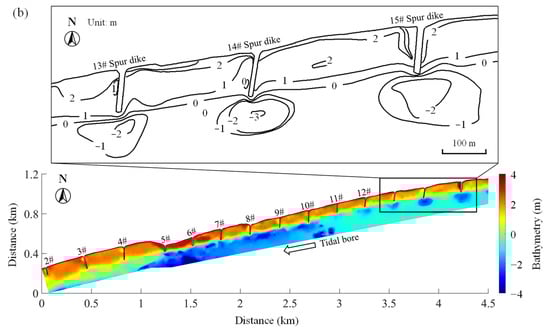
Figure 8.
Typical topography of local scour holes around spur dikes: (a) in January and (b) in October.
During the dry season (from November to February of the next year), the dike field is in a continuous siltation state. The scour hole on the upstream side of the spur dike has a small range, which is in a long strip shape and 1–2 m wide, so it is not obvious on the map with a scale of 1:2000. Because, if the map-to-ground ratio was 1:2000, the 2000 mm (2 m) in real observations is represented as only 1 mm on the map. Generally, after the spring tide, the riverbed elevation is the lowest in October. The upstream side of the spur dike is mostly lower than other areas of the dike field. As shown in Figure 8b, scour holes can be clearly caught on the 1:2000 survey map at the upstream side of 13# and 14# spur dikes.
3.3. Model Test Results
The flume used in the experiments and the patterns of local scour holes around a spur dike under the action of a tidal bore is shown in Figure 9. The scour hole at the head of the sheet-pile groin was more than 1 m smaller than the rock-filled spur dike, and the influence zone was significantly reduced. The latter was mainly based on scattered rubble, the foundation was shallow, and the permeability of the dike structure was limited; these caused a significant difference in water level between the upstream and downstream sections of the spur dike when the tidal bore was advancing.
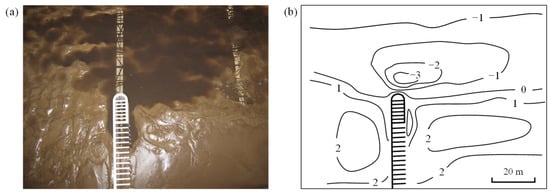
Figure 9.
Local scour holes around the sheet-pile groin: (a) test photo and (b) contour map (converted to prototype).
The difference between the water depth before and after the hydraulic jump was significant, and the scouring capacity of the hydraulic drop was intensified. The sheet-pile groin comprised vertical sheet piles with a deep foundation and low exposed surface; the dike head structure was suitable for the flow potential and close to the shape of the streamline. This can effectively weaken the carrying tide capability of the tidal bore and reduce the dike foundation scour.
The streamlined structure improves the overflow capacity near the dike head, thus significantly reducing the depth and scope of the dike head scour. In addition, when the tidal bore passes through the permeable sheet-pile groin, its scouring intensity is related to the permeability of the structure. If the permeability of the spur dike is greater than 50%, the water level difference between upstream and downstream decreases obviously, it is not easy to form a hydraulic drop, and the scouring around the spur dike decreases significantly. The experimental conditions and main results of the model test are shown in Table 2.
Table 2.
Model test results (converted to prototype).
3.4. Dimensional Analysis of the Scour Depth
The parameters affecting the evolution of the scour depth and range around a spur dike include their geometry, the properties of the riverbed surface sediments, flow properties, and the time required for the equilibrium scour depth [31,32]. They are summarized as follows:
- (1)
- The variables describing the spur dike and riverbed geometry are the distance (d) from the main channel to the seawall, the effective length (l) of the spur dike, and the spur dike angle (θ);
- (2)
- The variables describing water flow are the tidal bore height (H), velocity (U), and characteristic water depth (h), which can be selected by the water depth of the low tide level;
- (3)
- The variables describing the fluid are the gravitational acceleration (g), the volume weight of the water (γ), and the dynamic viscosity of the water (υ);
- (4)
- The variables describing sediment are the median particle size (D), bulk density difference in water (Δγs), and suspended sediment concentration (S).
The maximum scour depth near spur dikes (hs) can be written as follows:
There was a good correlation between the height and velocity of the tidal bore, and the height can roughly characterize the latter. The variables describing hydrodynamic viscosity and sediment particle size change were ignored, and Equation (5) can be written as follows:
Writing both sides of Equation (6) as dimensionless numbers,
In Equation (7), l/d represents the influence of a spur dike concentrate flow, l/h indicates the influence of spur dikes on water depth, H/h refers to the influence of the tidal bore height, and represents the influence of sediment inception Froude number. Here, Vc is the inception velocity of sediment; Dou Guoren’s formula for the inception velocity of sediment can be written as follows [33]:
where cm and cm3/s2; if mm, let mm, else .
It was assumed that the concentration effect of a spur dike on the water flow can be reflected by the influence of the spur dike on the water depth and tidal bore height. Taking an orthogonal spur dike as a reference, in this condition, the influence coefficient of the spur dike angle is 1.0, and a corresponding correction should be made in the case of an oblique spur dike. Assuming that spur dikes are orthogonal, Equation (7) can be written in exponential form:
where ai (i = 1, 2, 3, 4) are constants.
Combined with the model test data and field observation results, the coefficients ai of Equation (9) were regressed using the least squares method. The maximum scour depth (hsh) formula at the dike head in the section of the QR with a tidal bore was obtained as follows:
where kt is the correction coefficient, which is related to the permeability of the spur dike and is generally taken as kt = 1.0–2.0. Figure 10 shows the comparison between the predicted scour depth at the dike head using Equation (10) and the field-measured value. The results show that the predicted value is in good agreement with the field-measured value, and the relative error is basically within 30%. The coefficient of determination (R2), mean absolute error (MAE), and root mean squared error (RMSE) were found to be 0.89, 0.45 m, and 0.57 m, respectively.
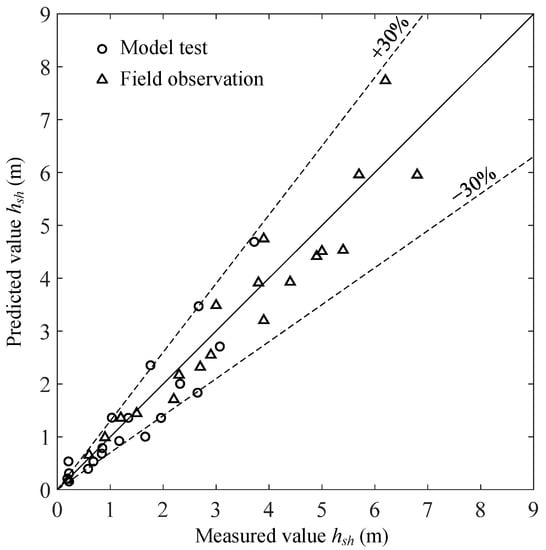
Figure 10.
Comparisons of measured and predicted scour depth at the dike head (hsh) using Equation (10).
A local scour hole on the upstream side of the spur dike is caused by the difference in water level between the upstream and downstream when a tide bore crosses the spur dike. The flows across the dike fall into the upstream water zone, which diffuses and dissipates the energy; if the energy dissipation is insufficient, there will be a large near bottom velocity to scour the riverbed and form a local scour hole. Similar to a scour hole at the dike head, combined with the model test data and field observation results, the maximum scour depth (hsu) formula at the upstream side of the spur dike in the section of the QR with a tidal bore was obtained as follows:
where ku is the correction coefficient, which is also related to the permeability of the spur dike and is generally taken as ku = 0.5–1.0. Figure 11 shows the comparison between the predicted scour depth at the upstream side of the spur dike using Equation (11) and the field measured value. The results show that the predicted value is in good agreement with the field measured value, and the relative error is within 20%. The coefficient of determination (R2), mean absolute error (MAE), and root mean squared error (RMSE) were found to be 0.92, 0.18 m, and 0.25 m, respectively.
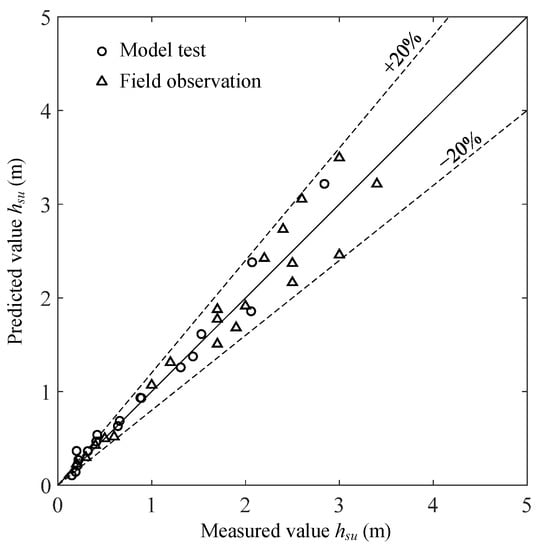
Figure 11.
Comparisons of measured and predicted scour depth at the upstream side of the spur dike (hsu) using Equation (11).
3.5. Fitting Formula Verification
The YC7# low spur dike is located in the spur dike group ➆, as shown in Figure 2. The dike length was 75 m and the dike crest width was 4 m. A survey map measured in October 2009 was used to verify the fitted scour formulas. Figure 12 presents the measured local scour holes around the spur dike. The location and shape of the scour holes are consistent with Figure 8.
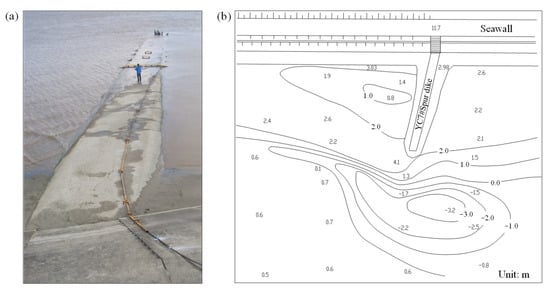
Figure 12.
Measured local scour holes around the YC7# spur dike: (a) a site photo of the spur dike and (b) a survey map. The position of the YC7# spur dike is marked by a red five-pointed star in Figure 2.
The HN16# low spur dike is located in spur dike group ➇, as shown in Figure 2. The dike length was 108 m and the dike crest width was 4 m. A survey map measured in July 2020 was used to verify the fitted scour formulas. Figure 13 presents the measured local scour holes around the spur dike. Affected by the flood on 20 June 2020, scouring holes also appeared at the downstream side of the spur dike, but the location and shape of the scouring holes at the upstream side of the spur dike and the dike head are basically consistent with Figure 8. Equations (10) and (11) were used to estimate the maximum scour depth at the spur dike head and upstream side, respectively, and then compared with the measured values. The results are shown in Table 3. The results show that the measured and estimated maximum scour depth were in good agreement.
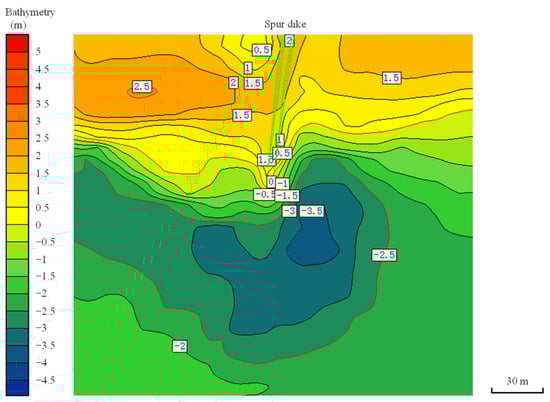
Figure 13.
Measured local scour holes around the HN16# spur dike. The position of the HN16# spur dike is marked by a red triangle in Figure 2.
Table 3.
Comparison between the measured and estimated maximum scour depth around spur dikes.
4. Conclusions
The scour location, pattern, and maximum depth around spur dikes caused by tidal bores were studied through field observation and model tests. The maximum scour depth calculation formulas at the dike head and upstream side of a spur dike were fitted with the least squares method. The dike head scour was caused by the tidal bore, which led to a rapid rise in the water level at the downstream side of the spur dike; the water flow around the dike head formed a local hydraulic drop and generated the descending flow. It cut and washed down along the slope of the dike head, forming a deep scour hole at its fore-end. The scour hole on the upstream side of the spur dike was formed by the hydraulic jump scour formed on the upstream riverbed after the tidal bore crossed the spur dike. The fitting formulas could estimate the maximum scour depth around the spur dike, which considered the influence of the spur dike geometry, hydrodynamic forces, and sedimentary environment.
The results of this study are substantially in favor of understanding the hydrodynamic response of spur dikes and their surrounding riverbed upon the action of tidal bores. This knowledge can guide the design and maintenance of spur dikes in estuarine and marine environments and alleviate the adverse effects of extreme hydrodynamic forces such as tidal bores. Further research will analyze the development process of scour holes via field observation and physical models and modify the fitting formulas.
Author Contributions
Conceptualization, writing—original draft preparation, funding acquisition and methodology, Y.L. and D.P.; validation and formal analysis, Y.L.; writing—review and editing, D.P. All authors have read and agreed to the published version of the manuscript.
Funding
This research was funded by the National Natural Science Foundation of China, grant numbers 41876095, 41906183, and 42176214; the Zhejiang Provincial Natural Science Foundation of China, grant numbers LZJWZ22E090002 and LZJWY22E090006; and the Key Program of the President of the Zhejiang Institute of Hydraulics and Estuaries, grant number ZIHE21Z001.
Institutional Review Board Statement
Not applicable.
Informed Consent Statement
Not applicable.
Data Availability Statement
Not applicable.
Conflicts of Interest
The authors declare no conflict of interest.
References
- Chanson, H. Tidal Bores, Aegir, Eagre, Mascaret, Pororoca Theory and Observations; World Scientific: Singapore, 2012. [Google Scholar]
- Filippini, A.G.; Arpaia, L.; Bonneton, P.; Ricchiuto, M. Modeling analysis of tidal bore formation in convergent estuaries. Eur. J. Mech. B Fluids 2019, 73, 55–68. [Google Scholar] [CrossRef]
- Li, Y.; Pan, D.; Cheng, W.; Pan, C. Tidal stream energy resource assessment in the Qiantang River Estuary, China. Int. J. Sustain. Energy 2018, 37, 704–717. [Google Scholar] [CrossRef]
- Li, Y.; Pan, D.; Chanson, H.; Pan, C. Real-time characteristics of tidal bore propagation in the Qiantang River Estuary, China, recorded by marine radar. Cont. Shelf Res. 2019, 180, 48–58. [Google Scholar] [CrossRef] [Green Version]
- Pan, D.; Li, Y.; Pan, C. Historical and projected future trends of tidal disasters at the Qiantang River Estuary, China. J. Coast. Res. 2020, 115(SI), 682–686. [Google Scholar] [CrossRef]
- Hung, N.T.; Duc, D.M.; Quynh, D.T.; Cuong, V.D. Nearshore topographical changes and coastal stability in Nam Dinh Province, Vietnam. J. Mar. Sci. Eng. 2020, 8, 755. [Google Scholar] [CrossRef]
- Formentin, S.M. Key performance indicators for the upgrade of existing coastal defense structures. J. Mar. Sci. Eng. 2021, 9, 994. [Google Scholar] [CrossRef]
- Yossef, M.F.M.; de Vriend, H.J. Sediment exchange between a river and its groyne fields: Mobile-bed experiment. J. Hydraul. Eng. 2010, 136, 610–625. [Google Scholar] [CrossRef]
- Xiang, K.; Yang, Z.; Wu, S.; Gao, W.; Li, D.; Li, Q. Flow hydrodynamics of the mixing layer in consecutive vegetated groyne fields. Phys. Fluids 2020, 32, 065110. [Google Scholar] [CrossRef]
- Alsawaf, M.; Ghazali, A.H.; Mohammad, T.A.; Ab Ghani, A.; Yusuf, B. Movable-bed experiments using spur dike to concentrate flow in one channel of multithreaded channel model. J. Hydraul. Eng. 2019, 145, 06019006. [Google Scholar] [CrossRef]
- Elawady, E.; Michiue, M.; Hinokidani, O. Movable bed scour around submerged spur-dikes. JSCE Annu. J. Hydraul. Eng. 2001, 45, 373–378. [Google Scholar] [CrossRef] [Green Version]
- Ezzeldin, R.M. Numerical and experimental investigation for the effect of permeability of spur dikes on local scour. J. Hydroinformatics 2019, 21, 335–342. [Google Scholar] [CrossRef]
- Ozyaman, C.; Yerdelen, C.; Eris, E.; Daneshfaraz, R. Experimental investigation of scouring around a single spur under clear water conditions. Water Supply 2022, 22, 3484–3497. [Google Scholar] [CrossRef]
- Choufu, L.; Abbasi, S.; Pourshahbaz, H.; Taghvaei, P.; Tfwala, S. Investigation of flow, erosion, and sedimentation pattern around varied groynes under different hydraulic and geometric conditions: A numerical study. Water 2019, 11, 235. [Google Scholar] [CrossRef] [Green Version]
- Bahrami-Yarahmadi, M.; Pagliara, S.; Yabarehpour, E.; Najafi, N. Study of scour and flow patterns around triangular-shaped spur dikes. KSCE J. Civ. Eng. 2020, 24, 3279–3288. [Google Scholar] [CrossRef]
- Vaghefi, M.; Radan, P.; Akbari, M. Flow pattern around attractive, vertical, and repelling T-shaped spur dikes in a mild bend using CFD modeling. Int. J. Civ. Eng. 2019, 17, 607–617. [Google Scholar] [CrossRef]
- Karami, H.; Basser, H.; Ardeshir, A.; Hosseini, S.H. Verification of numerical study of scour around spur dikes using experimental data. Water Environ. J. 2014, 28, 124–134. [Google Scholar] [CrossRef]
- Zhang, L.; Wang, P.; Yang, W.; Zuo, W.; Gu, X.; Yang, X. Geometric characteristics of spur dike scour under clear-water scour conditions. Water 2018, 10, 680. [Google Scholar] [CrossRef] [Green Version]
- Atarodi, A.; Karami, H.; Ardeshir, A.; Hosseini, K.; Lampert, D. Experimental investigation of scour reduction around spur dikes by collar using Taguchi method. IJST-T Civ. Eng. 2021, 45, 971–983. [Google Scholar] [CrossRef]
- Wu, T.; Qin, J. Influence of flow and sediment transport processes on sedimentation in groyne fields. J. Coast. Res. 2020, 95(SI), 304–308. [Google Scholar] [CrossRef]
- Pandey, M.; Ahmad, Z.; Sharma, P.K. Scour around impermeable spur dikes: A review. ISH J. Hydraul. Eng. 2018, 24, 25–44. [Google Scholar] [CrossRef]
- Bigham, K.A. Streambank stabilization design, research, and monitoring: The current state and future needs. Trans. ASABE 2020, 63, 351–387. [Google Scholar] [CrossRef]
- Koken, M.; Gogus, M. Effect of spur dike length on the horseshoe vortex system and the bed shear stress distribution. J. Hydraul. Res. 2015, 53, 196–206. [Google Scholar] [CrossRef]
- Malik, S.; Pal, S.C. Is the construction of groynes accelerating the degradation of channel morphology and paved the way for human encroachment in The Bengal Basin? Adv. Space Res. 2019, 64, 1549–1576. [Google Scholar] [CrossRef]
- Chanson, H. Undular tidal bores: Effect of channel constriction and bridge piers. Environ. Fluid Mech. 2011, 11, 385–404. [Google Scholar] [CrossRef]
- Li, Y.; Pan, D.; Chanson, H.; Pan, C. Tidal bore progressing on a small slope. Exp. Therm. Fluid Sci. 2017, 88, 513–518. [Google Scholar] [CrossRef] [Green Version]
- Xu, C.; Yin, M.; Pan, X. Field test and numerical simulation of tidal bore pressures on sheet-pile groin in Qiantang River. Mar. Georesources Geotechnol. 2016, 34, 303–312. [Google Scholar] [CrossRef]
- Cai, Y.; Cao, Z.; Wang, U.; Guo, Z.; Chen, R. Experimental and numerical study of the tidal bore impact on a newly developed sheet-pile groin in Qiantang river. Appl. Ocean Res. 2018, 81, 106–115. [Google Scholar] [CrossRef]
- Pan, D.; Li, Y.; Pan, C. Short-term morphological responses of adjacent intertidal flats to the construction of tidal gates in an estuarine tributary. J. Mar. Sci. Eng. 2022, 10, 882. [Google Scholar] [CrossRef]
- Kamphuis, J.W. Physical modeling of coastal processes. In Advance in Coastal and Ocean Engineering; Liu, P.L., Ed.; World Scientific: Singapore, 1996. [Google Scholar]
- Pandey, M.; Valyrakis, M.; Qi, M.; Sharma, A.; Lodhi, A.S. Experimental assessment and prediction of temporal scour depth around a spur dike. Int. J. Sediment Res. 2021, 36, 17–28. [Google Scholar] [CrossRef]
- Pandey, M.; Jamei, M.; Karbasi, M.; Ahmadianfar, I.; Chu, X. Prediction of maximum scour depth near spur dikes in uniform bed sediment using stacked generalization ensemble tree-based frameworks. J. Irrig. Drain. Eng. 2021, 147, 04021050. [Google Scholar] [CrossRef]
- Dou, G. Incipient motion of sediment under currents. China Ocean Eng. 2000, 14, 391–406. [Google Scholar]
Publisher’s Note: MDPI stays neutral with regard to jurisdictional claims in published maps and institutional affiliations. |
© 2022 by the authors. Licensee MDPI, Basel, Switzerland. This article is an open access article distributed under the terms and conditions of the Creative Commons Attribution (CC BY) license (https://creativecommons.org/licenses/by/4.0/).