
Optimized Design of Piled Embankment Using a Multi-Effect Coupling Model on a Coastal Highway


Abstract
:1. Introduction
2. Materials and Methods
2.1. Calculate the Settlement of GRPSE Based on Multi-Effect Coupling
- (1)
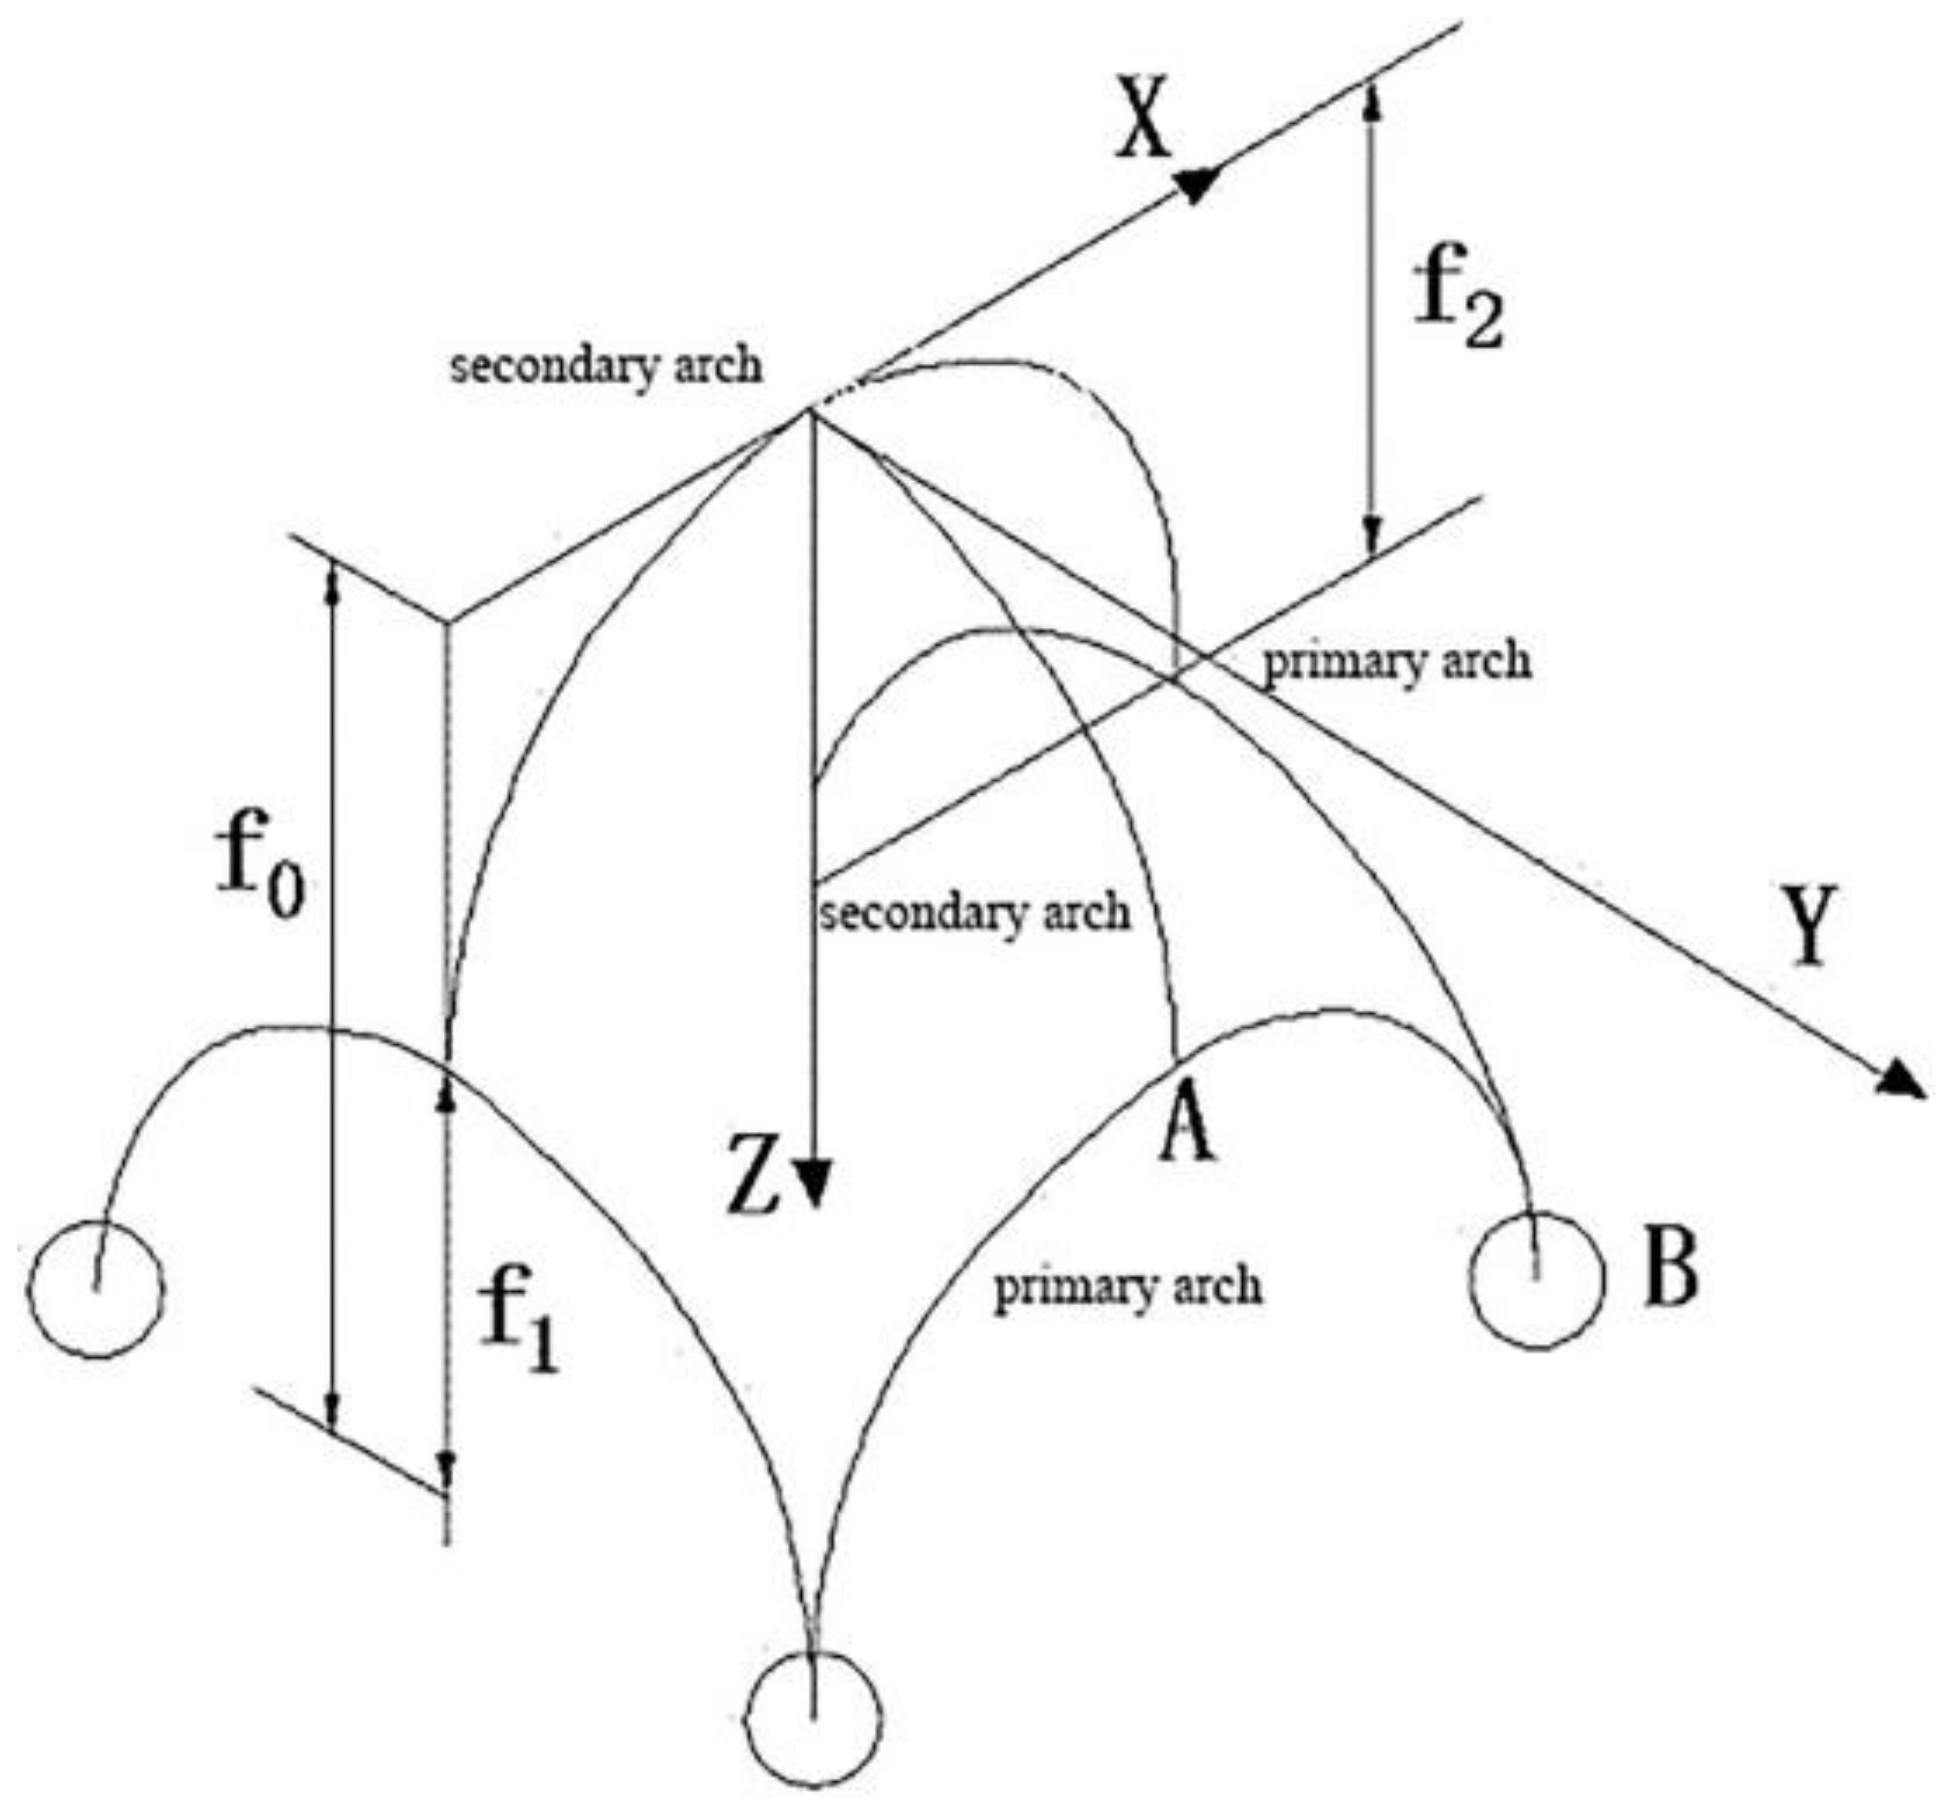
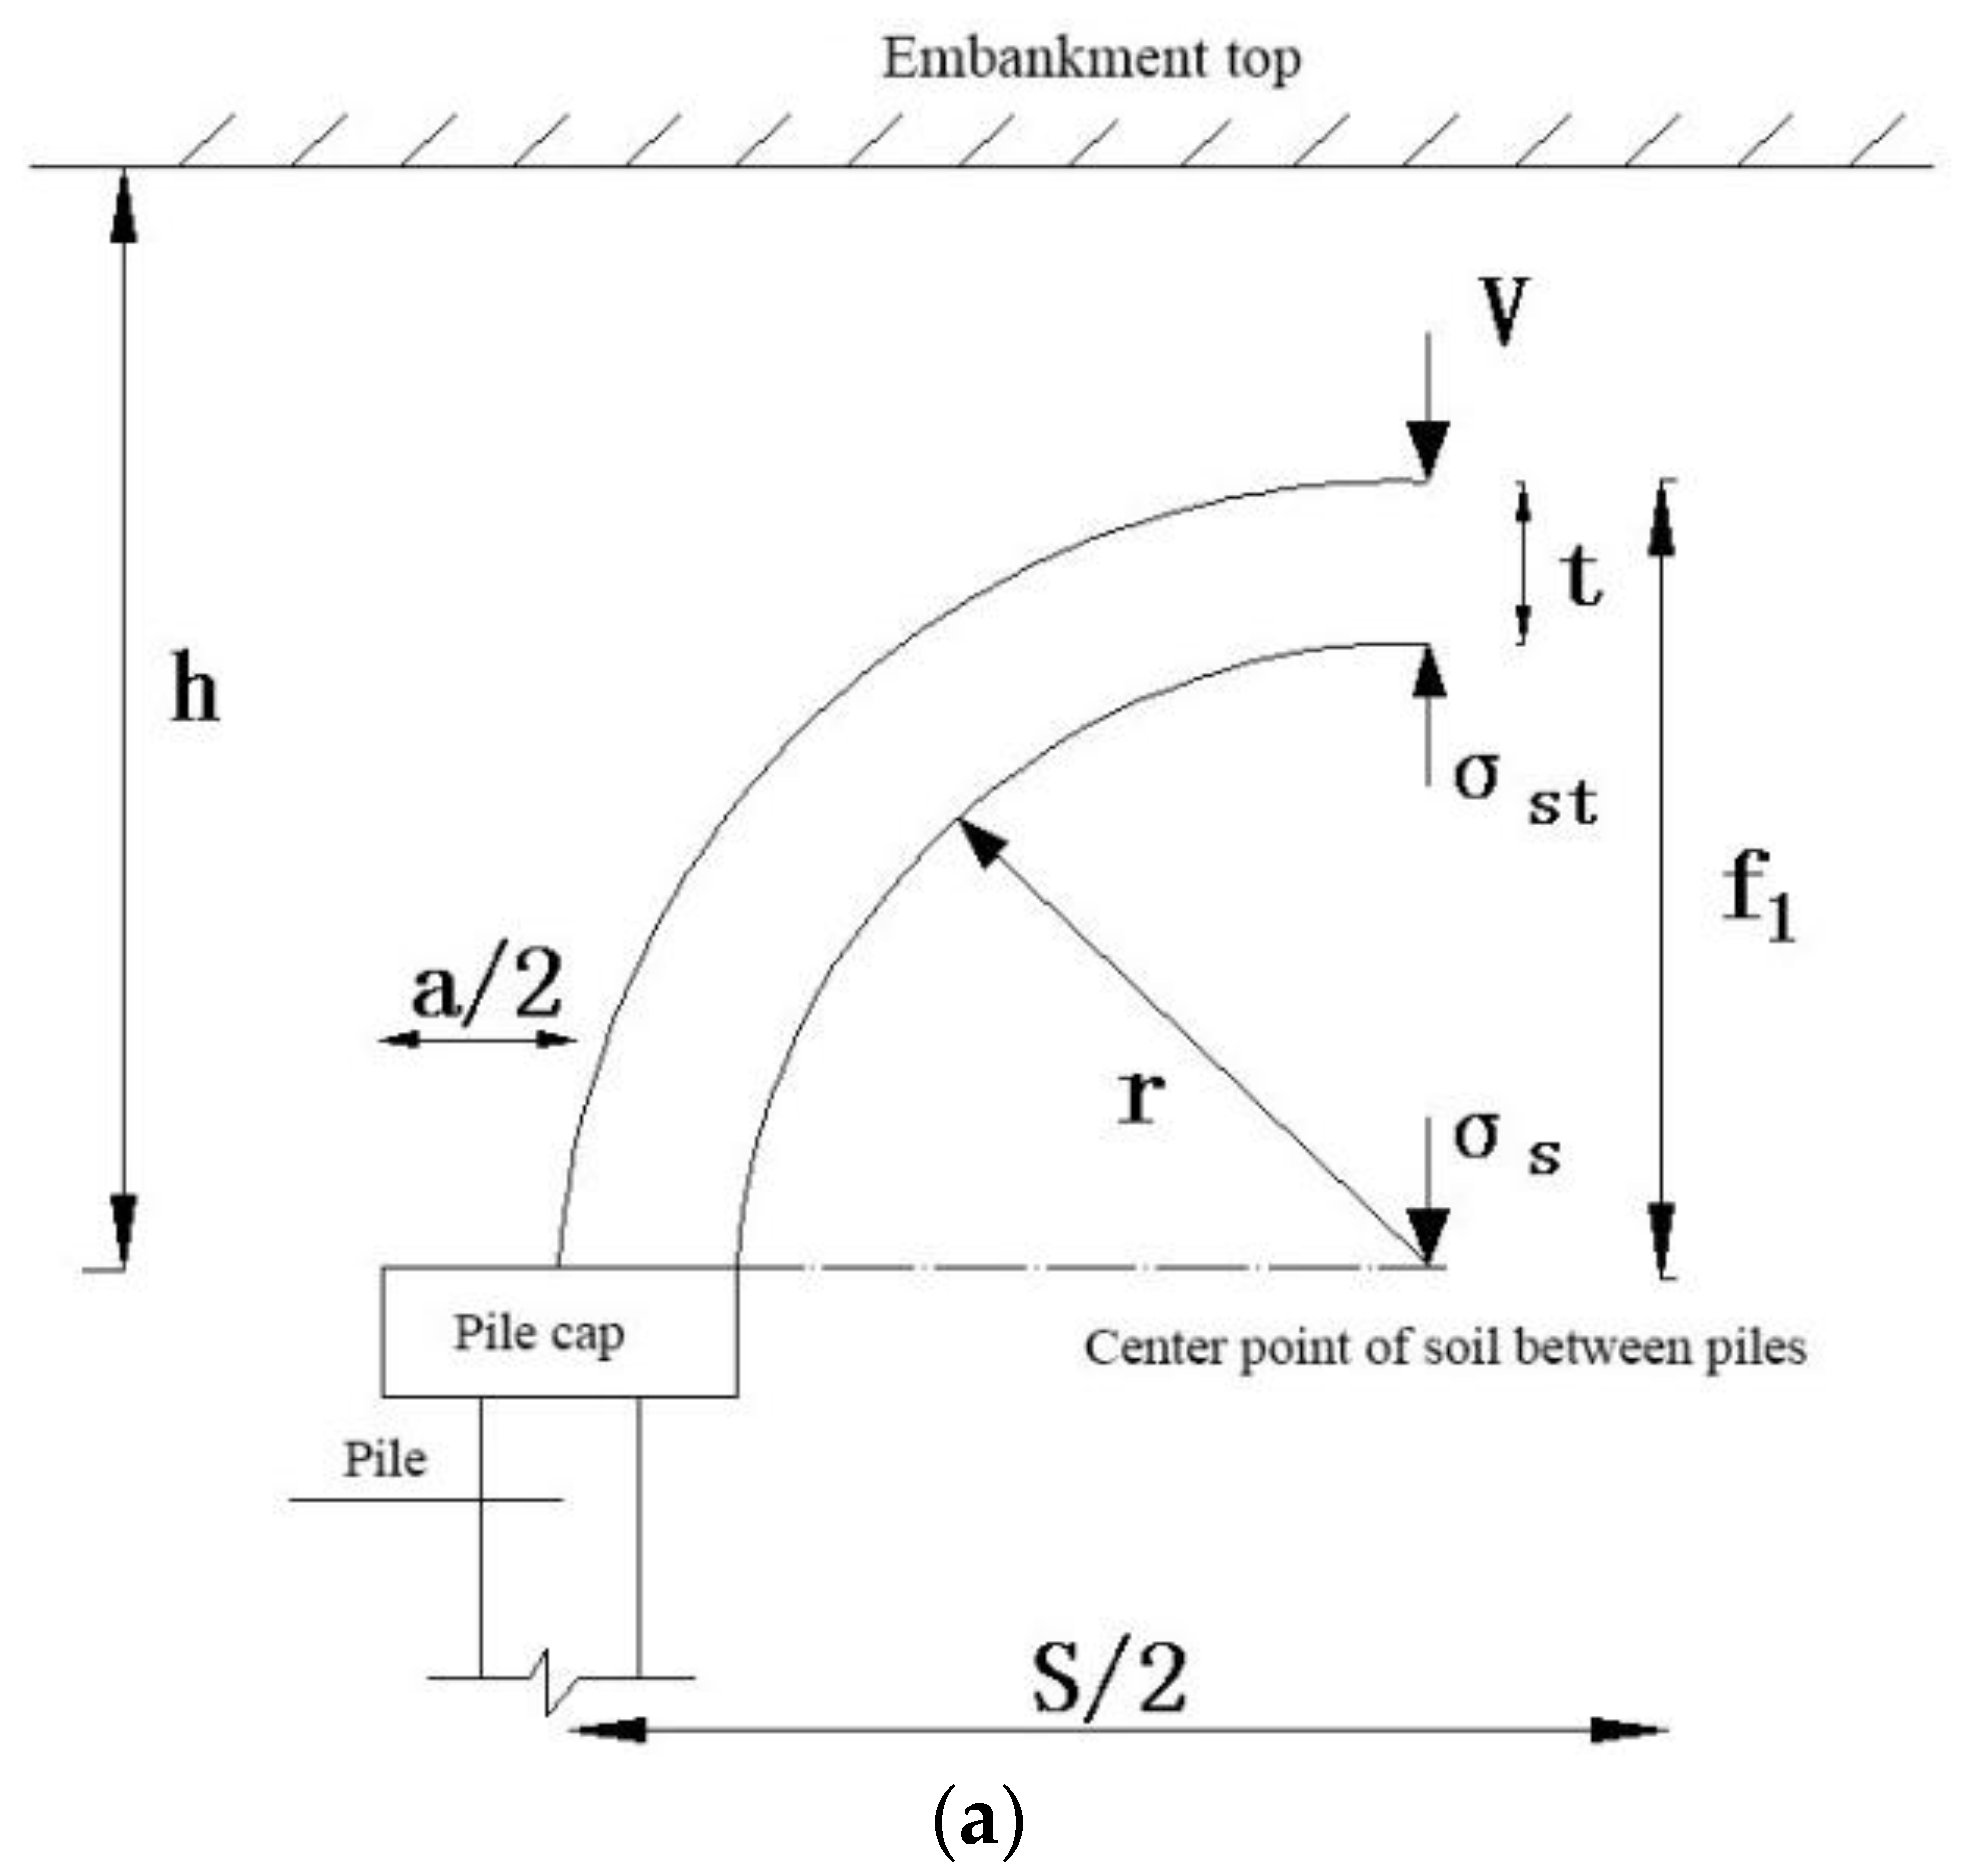
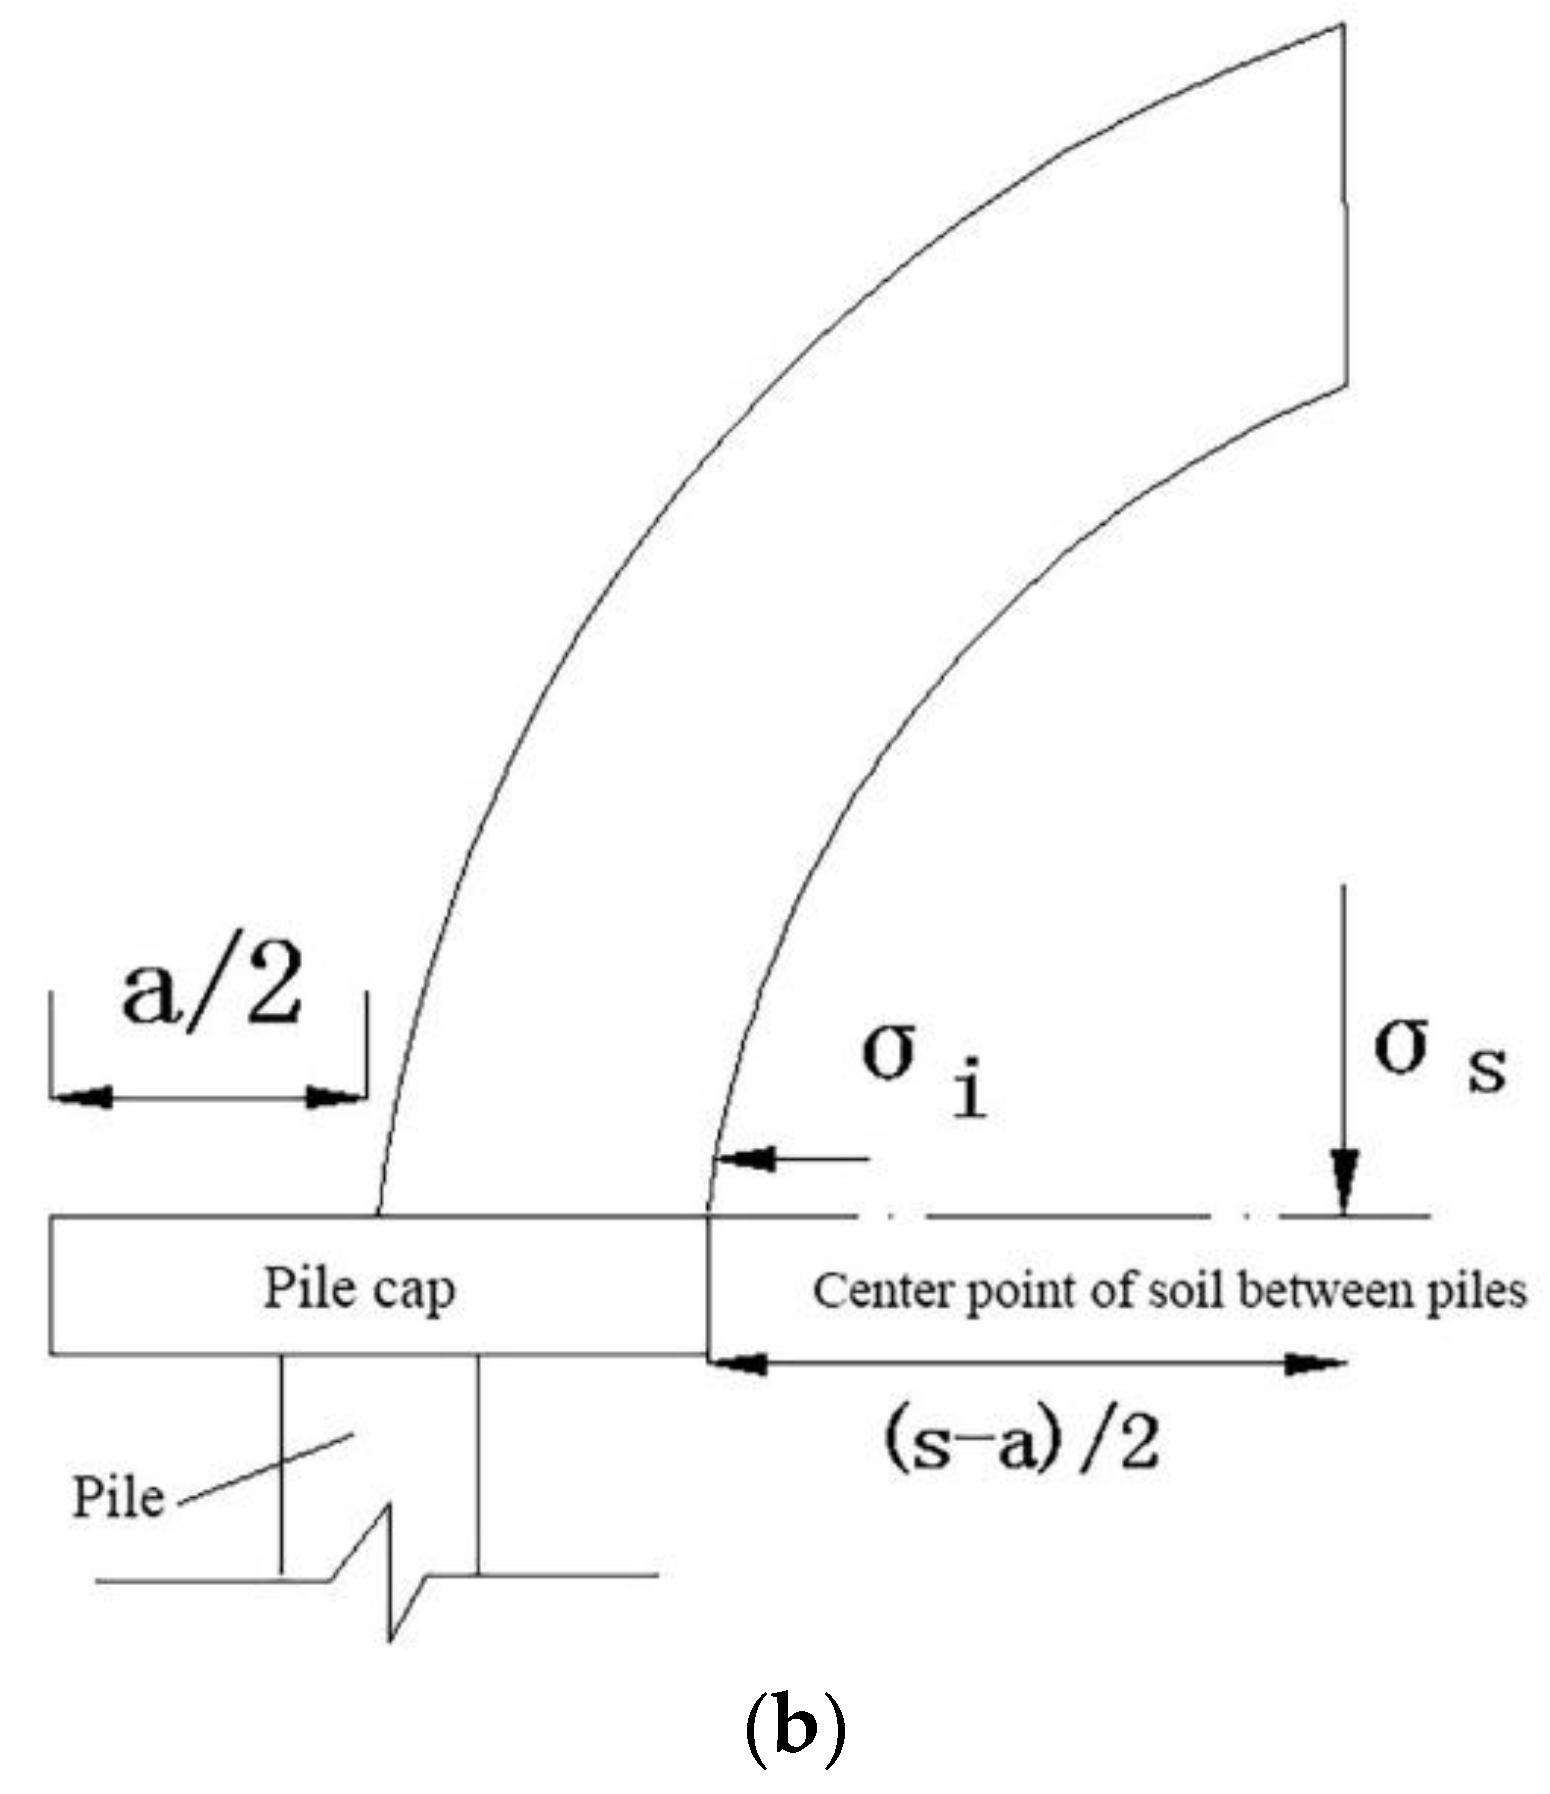
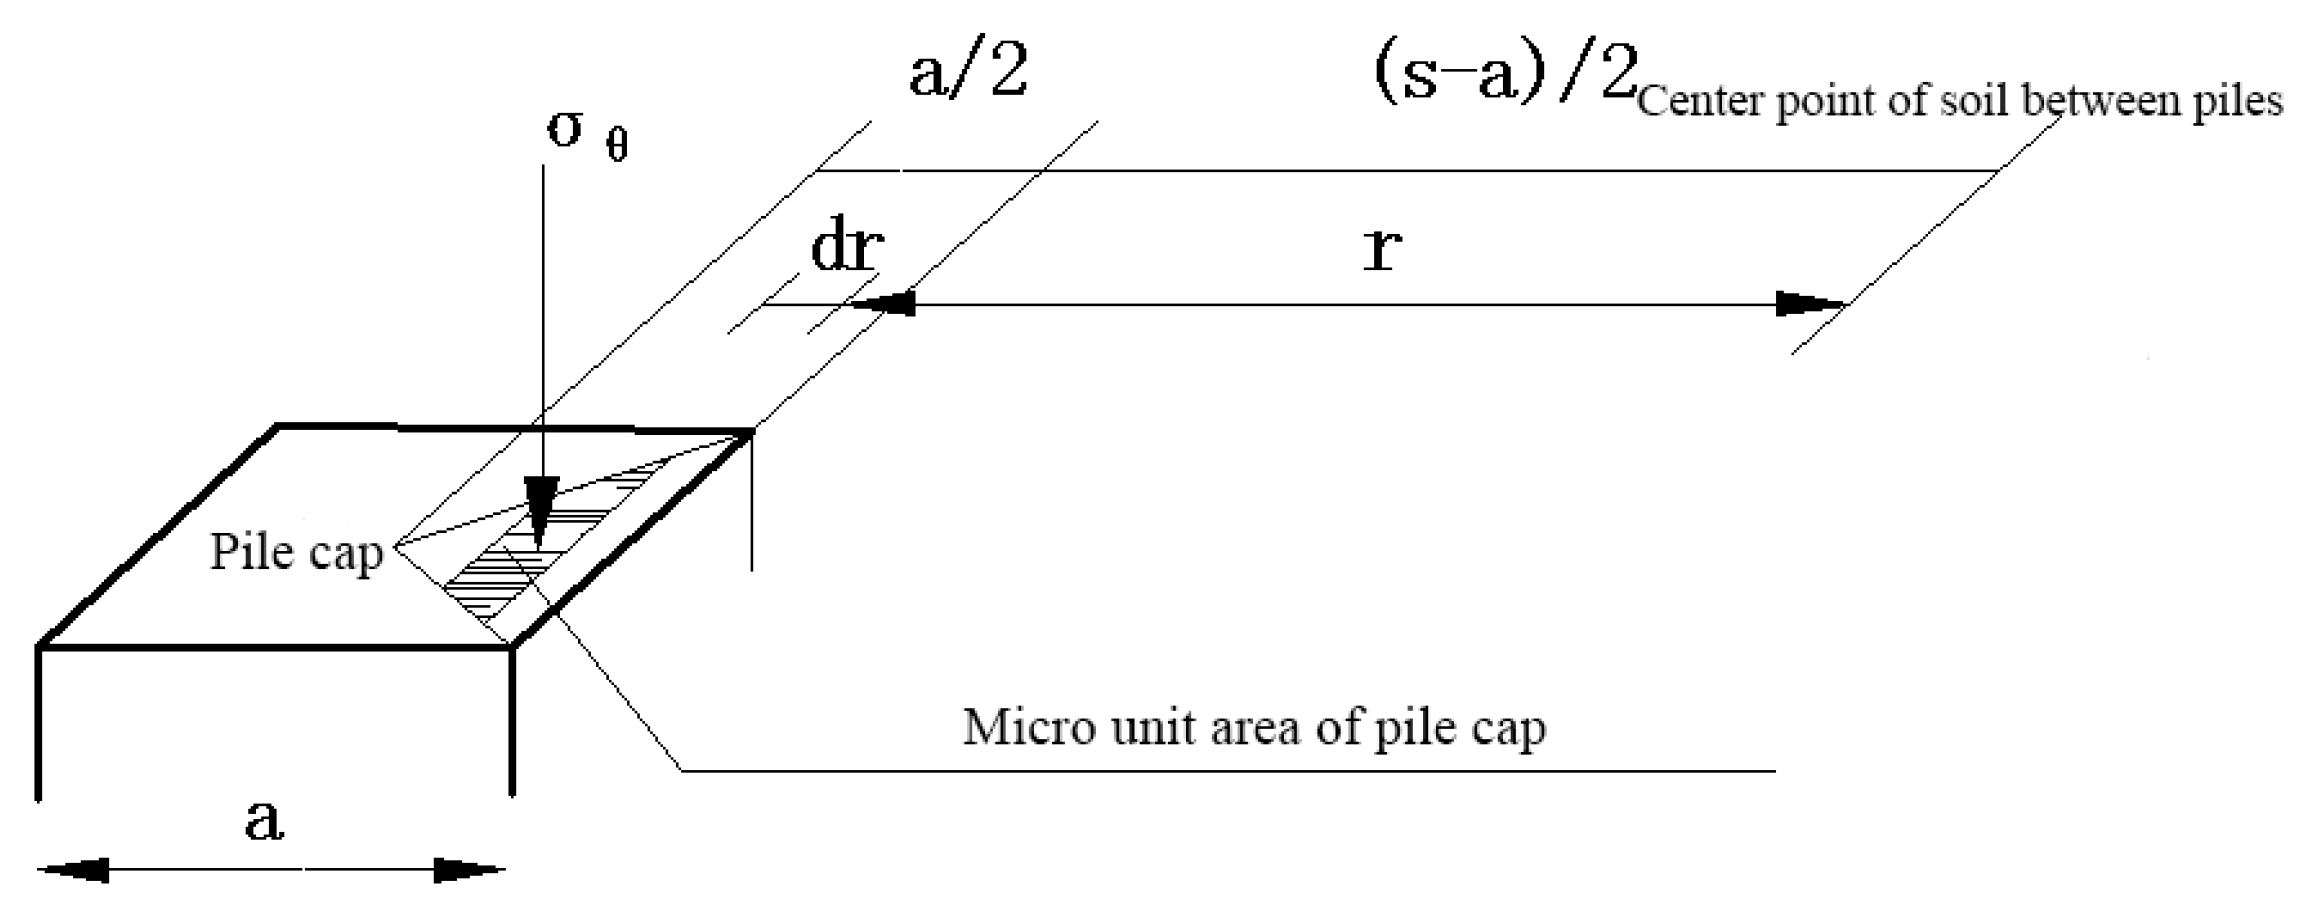
- Calculate the settlement of GRPSE based on the 3D arching effect
- (2)
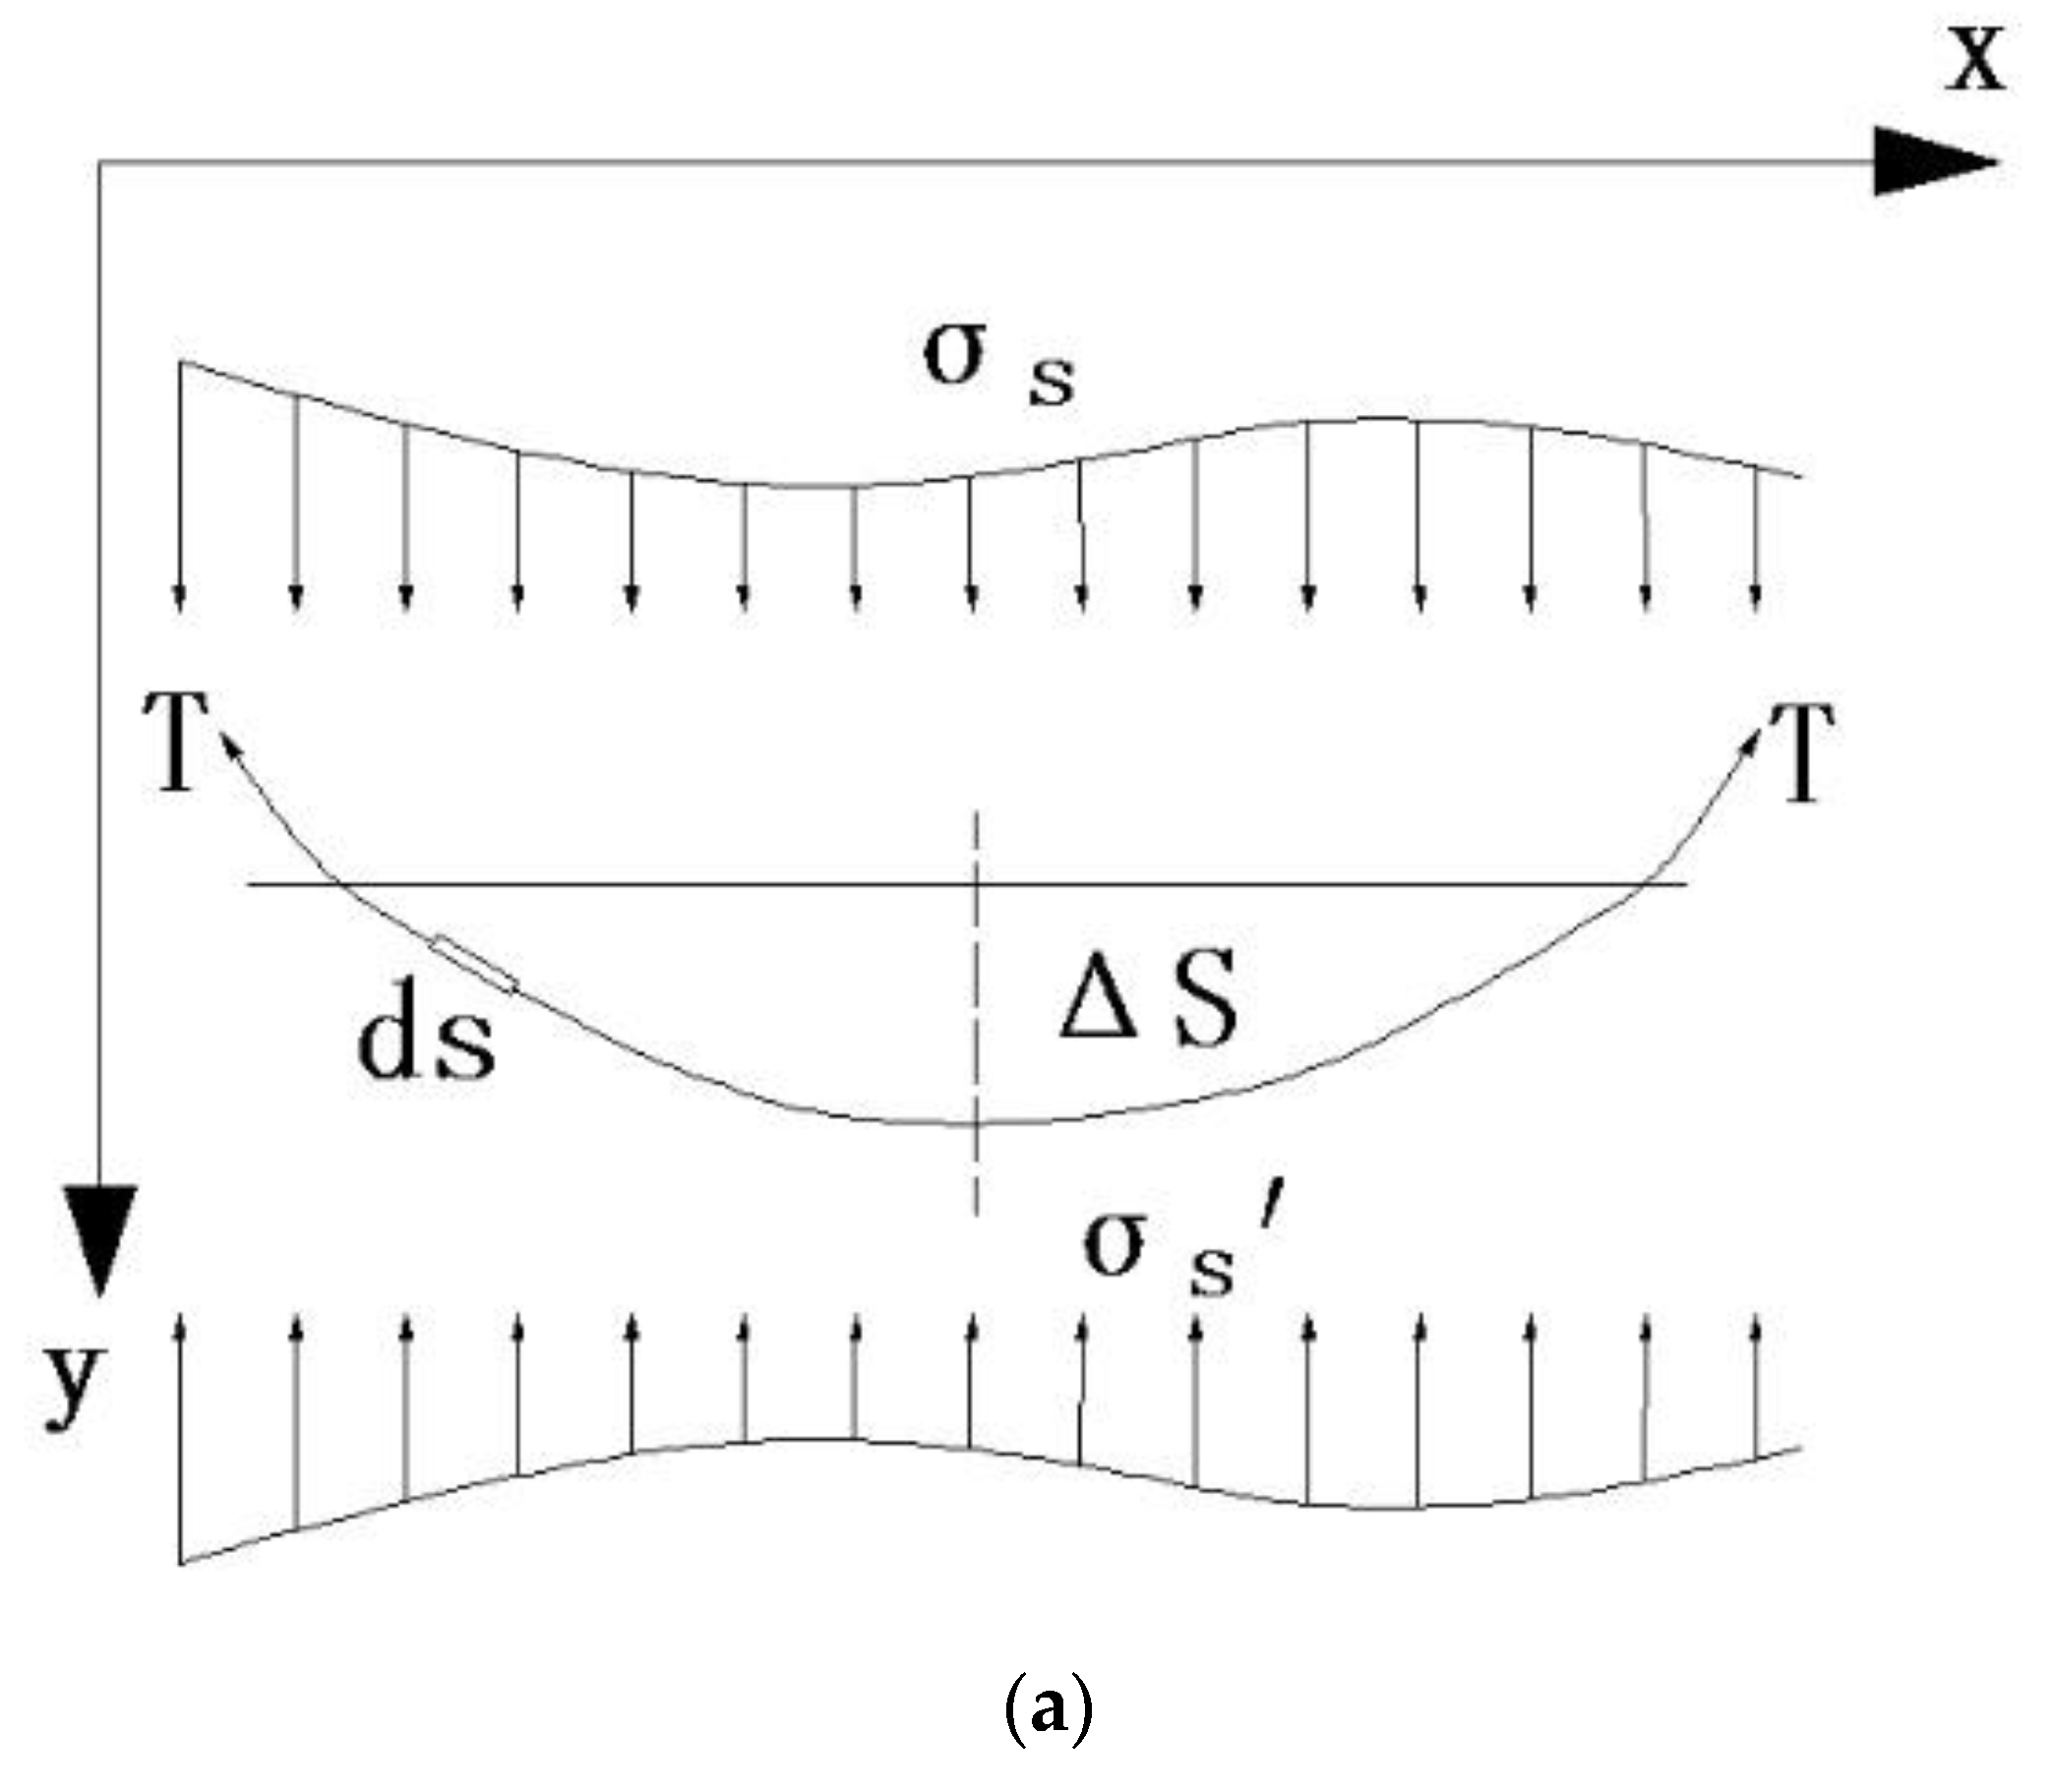
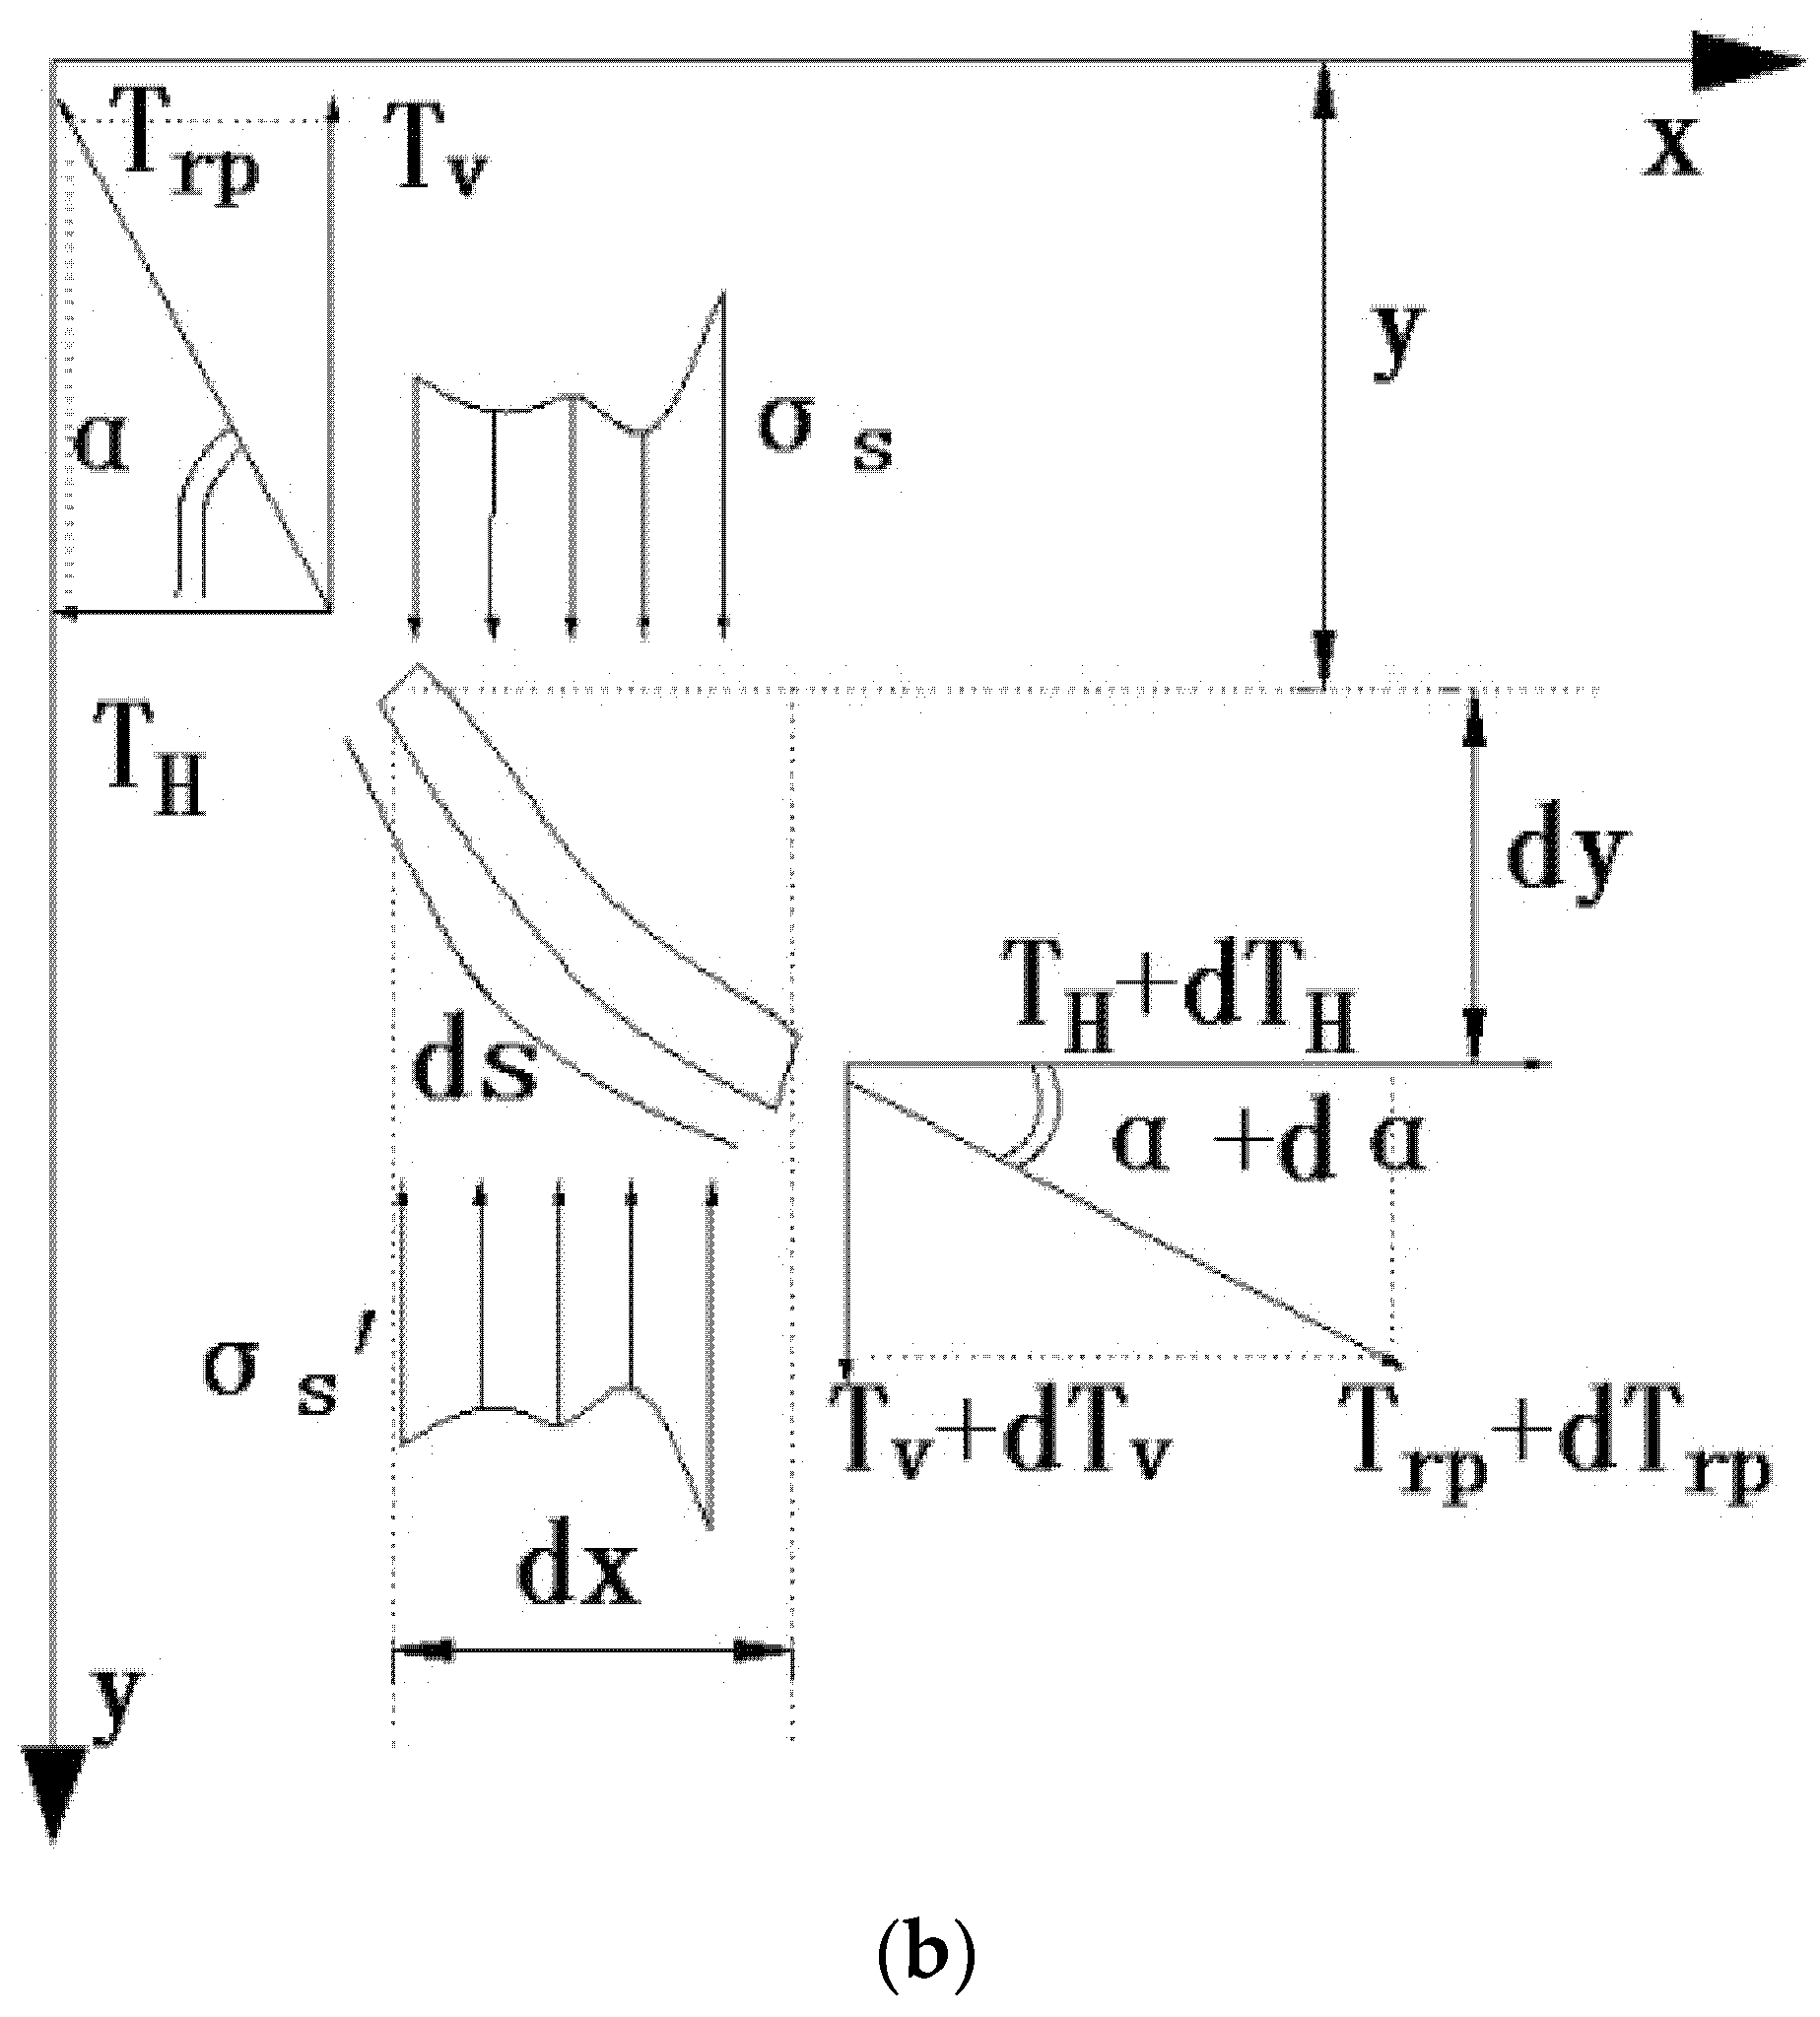
- Calculate the settlement of GRPSE based on the membrane effect of GR.
- (3)
- Calculate the settlement of GRPSE based on multi-effect coupling
- (a)
- Based on the 3D soil arch effect of the GRPSE, the thickness of the soil arch can be obtained based on Equation (18). Solving Equations (11), (17), and (19) obtains the height of the soil arch and the soil stress between the piles on top of the reinforced cushion.
- (b)
- To consider the membrane effect and pile–soil interaction effect of the GRPSE, is substituted into Equations (40) and (56), and the differential settlement of pile–soil and soil stress between piles under the reinforced cushion can be obtained.
- (c)
- Based on the force equilibrium condition of the embankment, Equation (57) can be used to solve the stress value of the pile cap under the reinforced cushion.
- (d)
- Based on the soil arching, membrane, and pile–soil interaction effects, the obtained pile–soil differential settlement , pile cap stress below the reinforced cushion, and soil stress between piles can be substituted into Equations (38), (58), and (59) to obtain the tensile force T of the GR, pile–soil stress ratio n, and load sharing ratio E of the pile.
2.2. Design of Optimized GRPSE Based on Multi-Effect Coupling
- (1)
- Design method for a GRPSE based on the multi-effect coupling settlement calculation model
- (2)
- GRPSE design optimization based on multi-effect
2.3. Field Experiment and Numerical Analysis
- (1)
- Project overview
- (2)
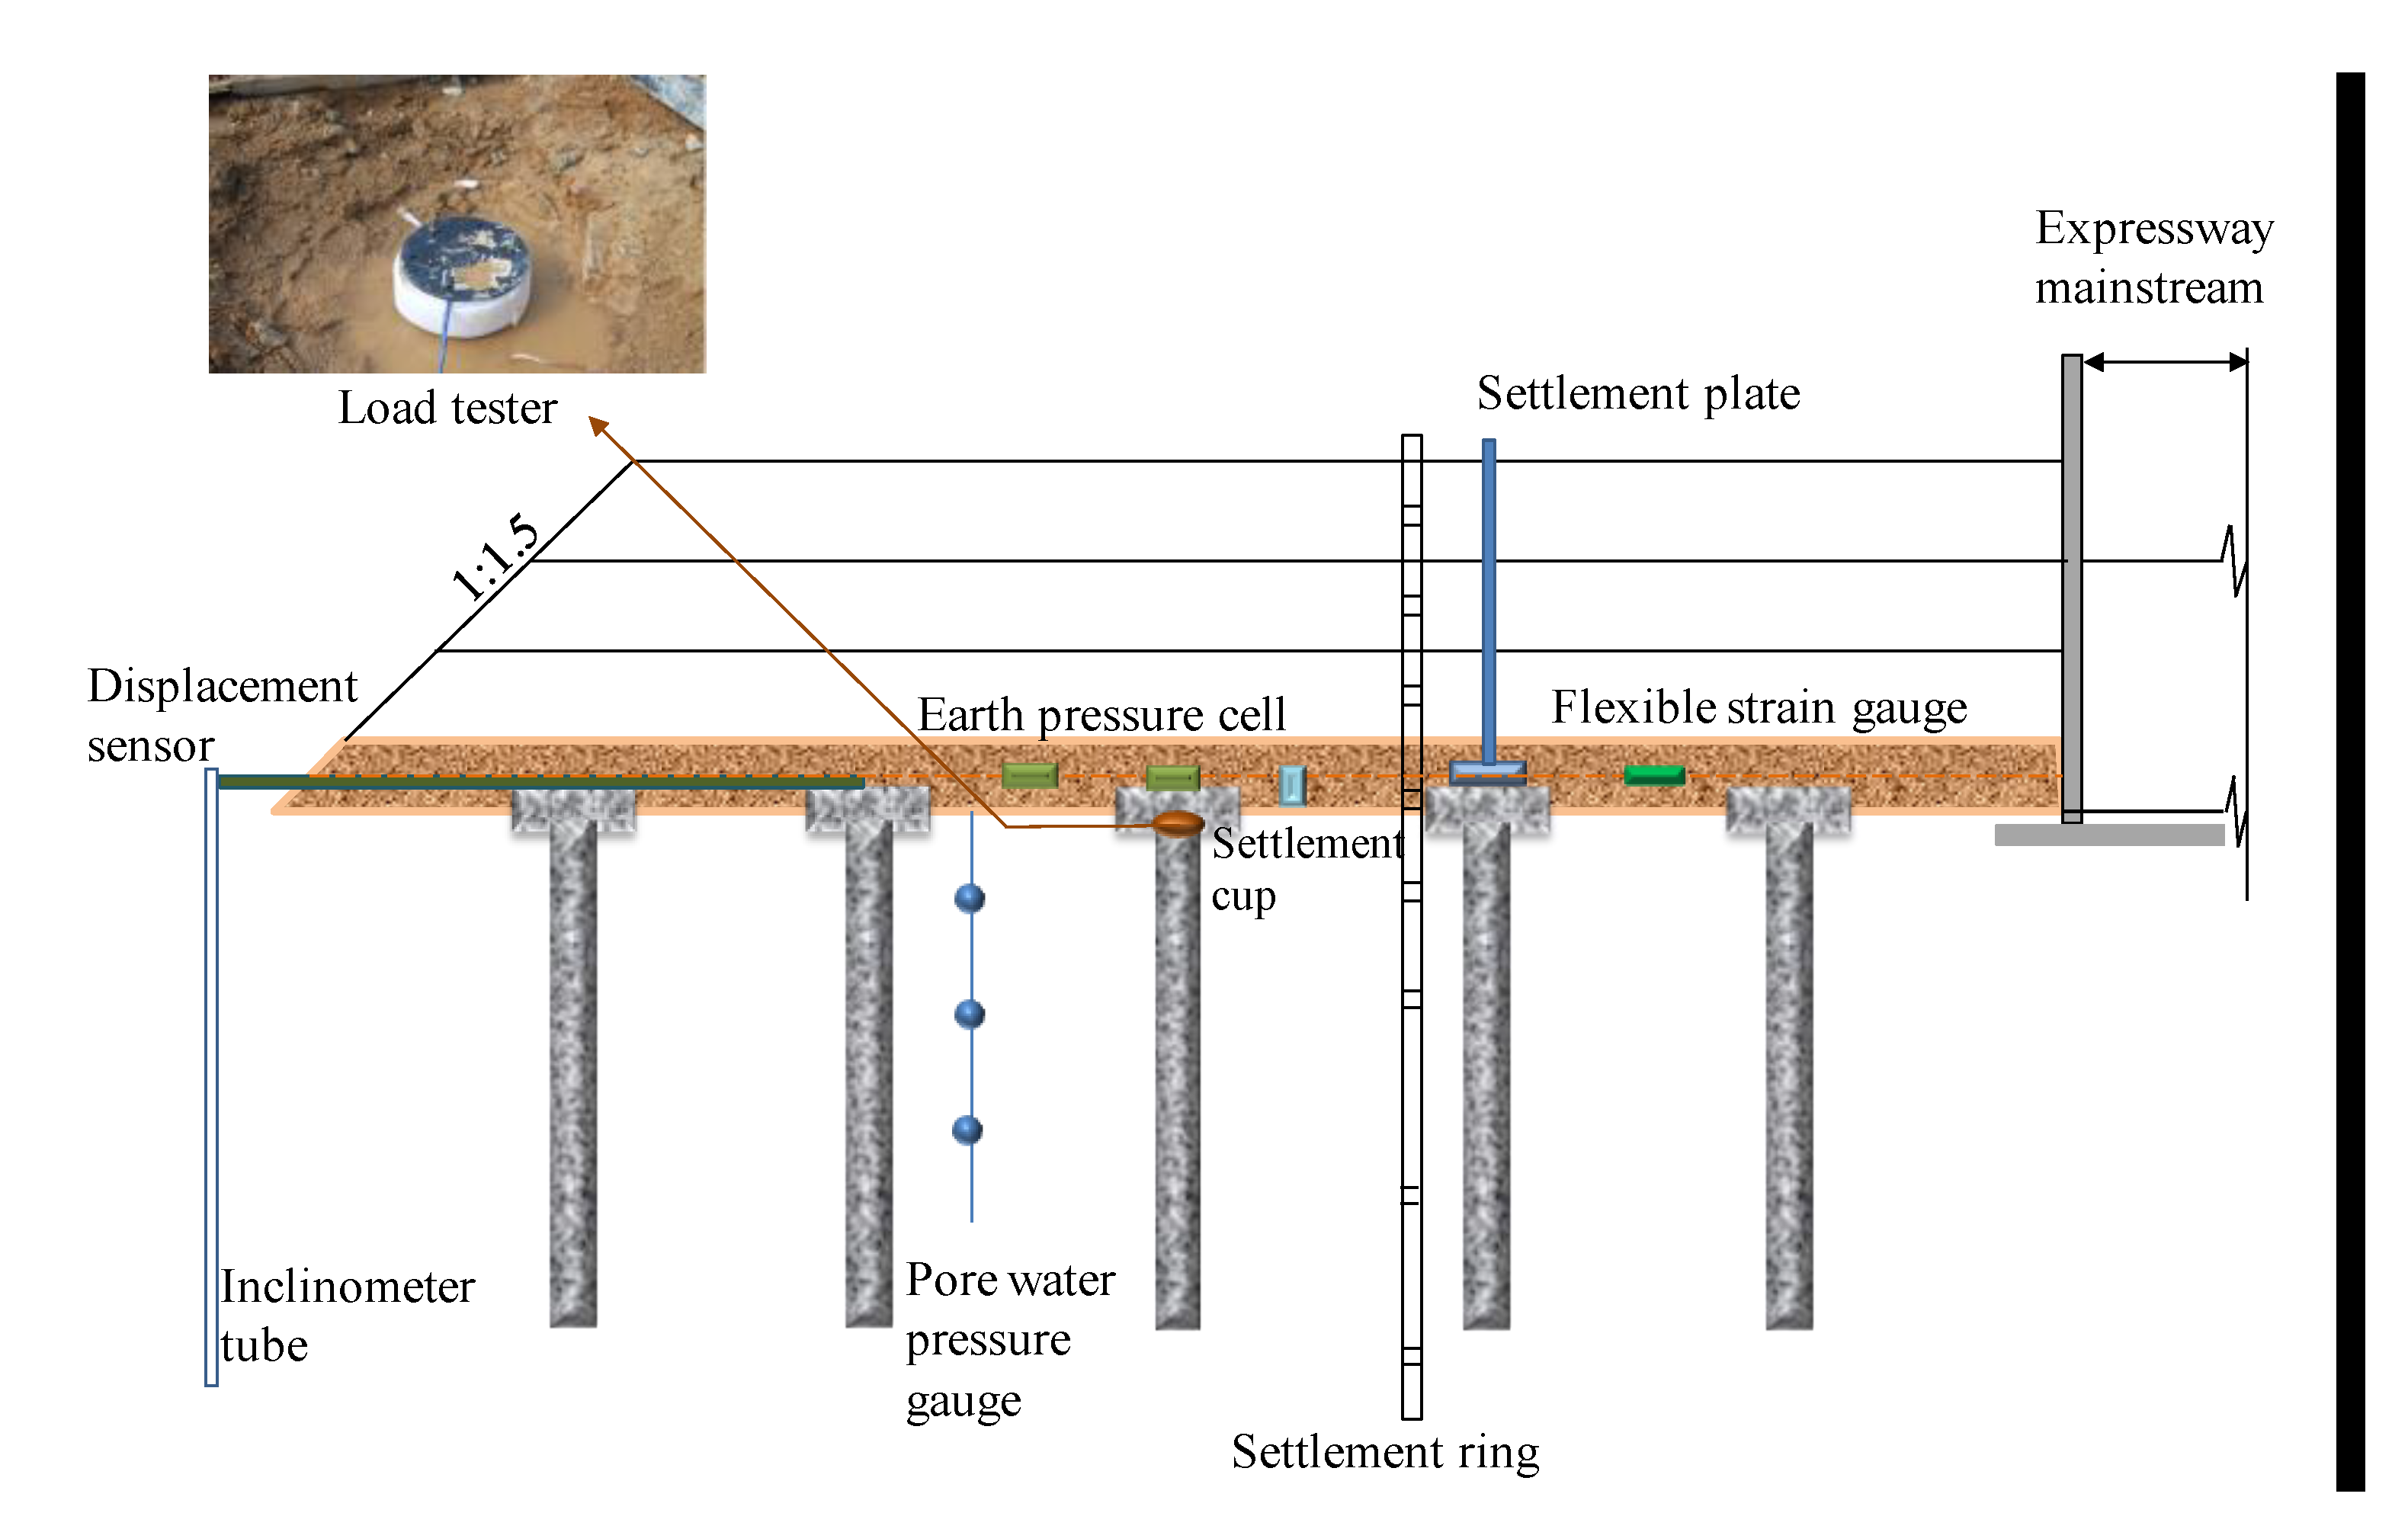
- Field test setup
- (3)
- Numerical analysis
3. Results and Discussion
3.1. Cost Influence Coefficient
3.2. Optimization Based on GRPSE Settlement
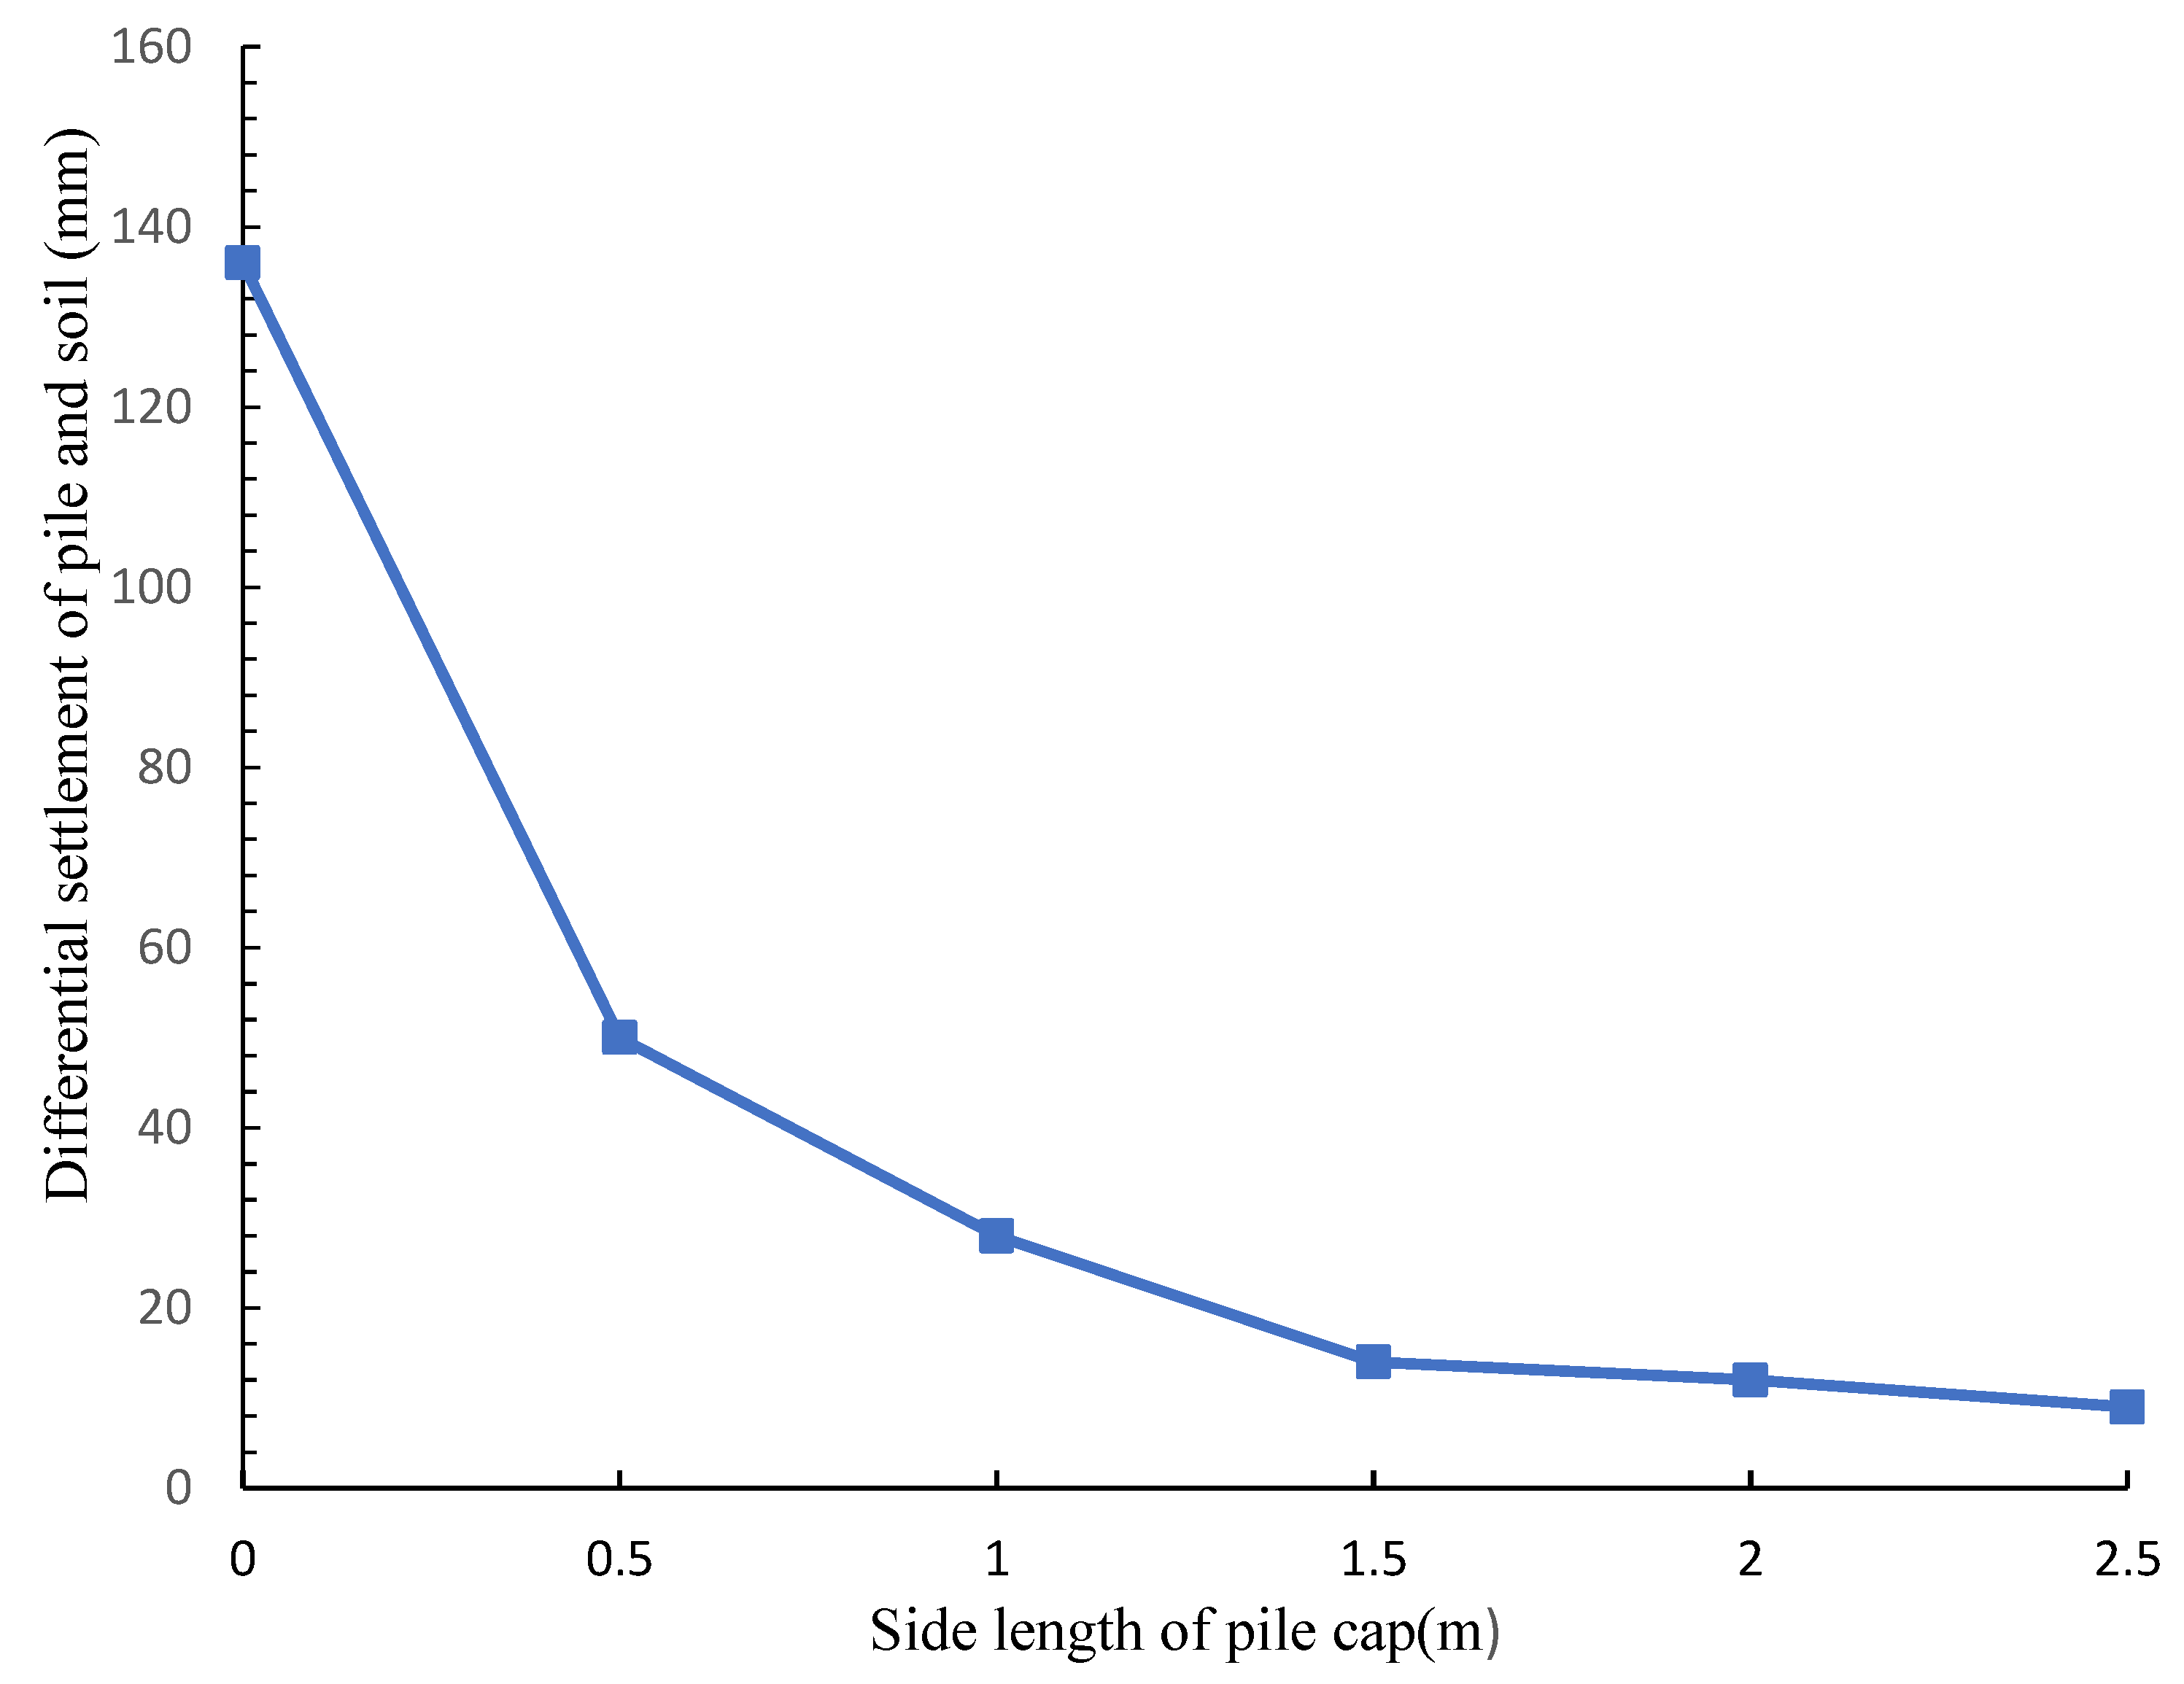
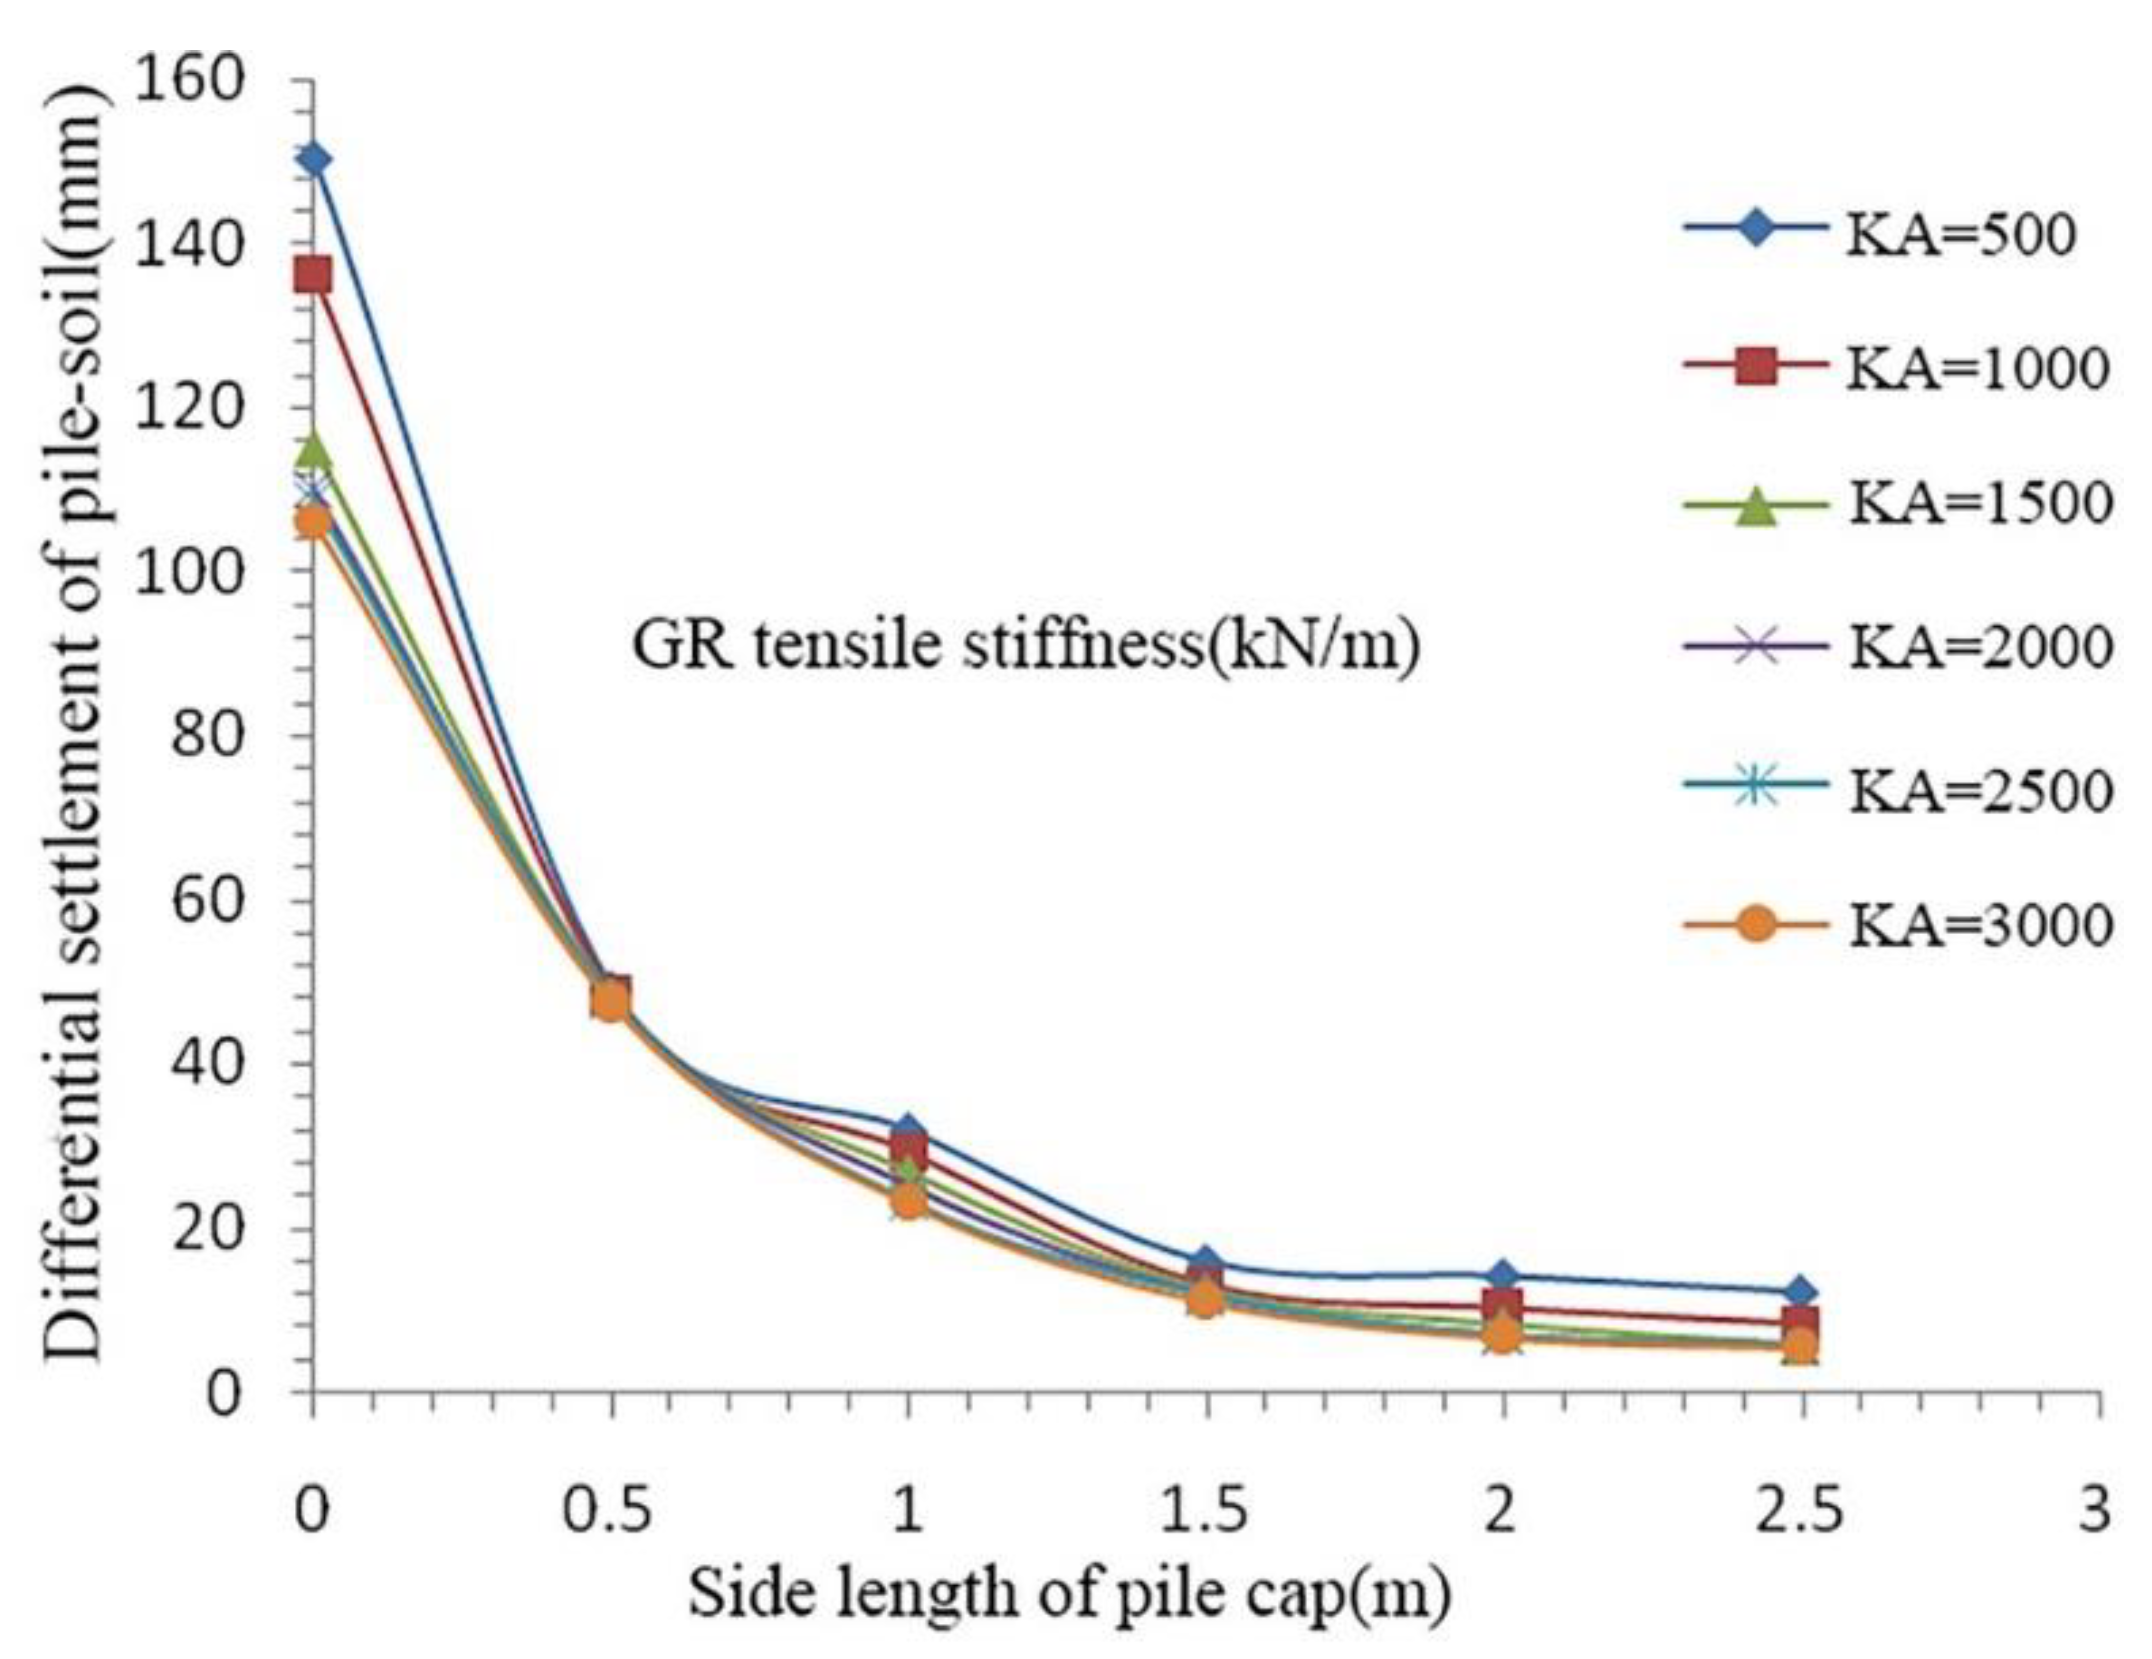
- (1)
- Optimization of pile cap size
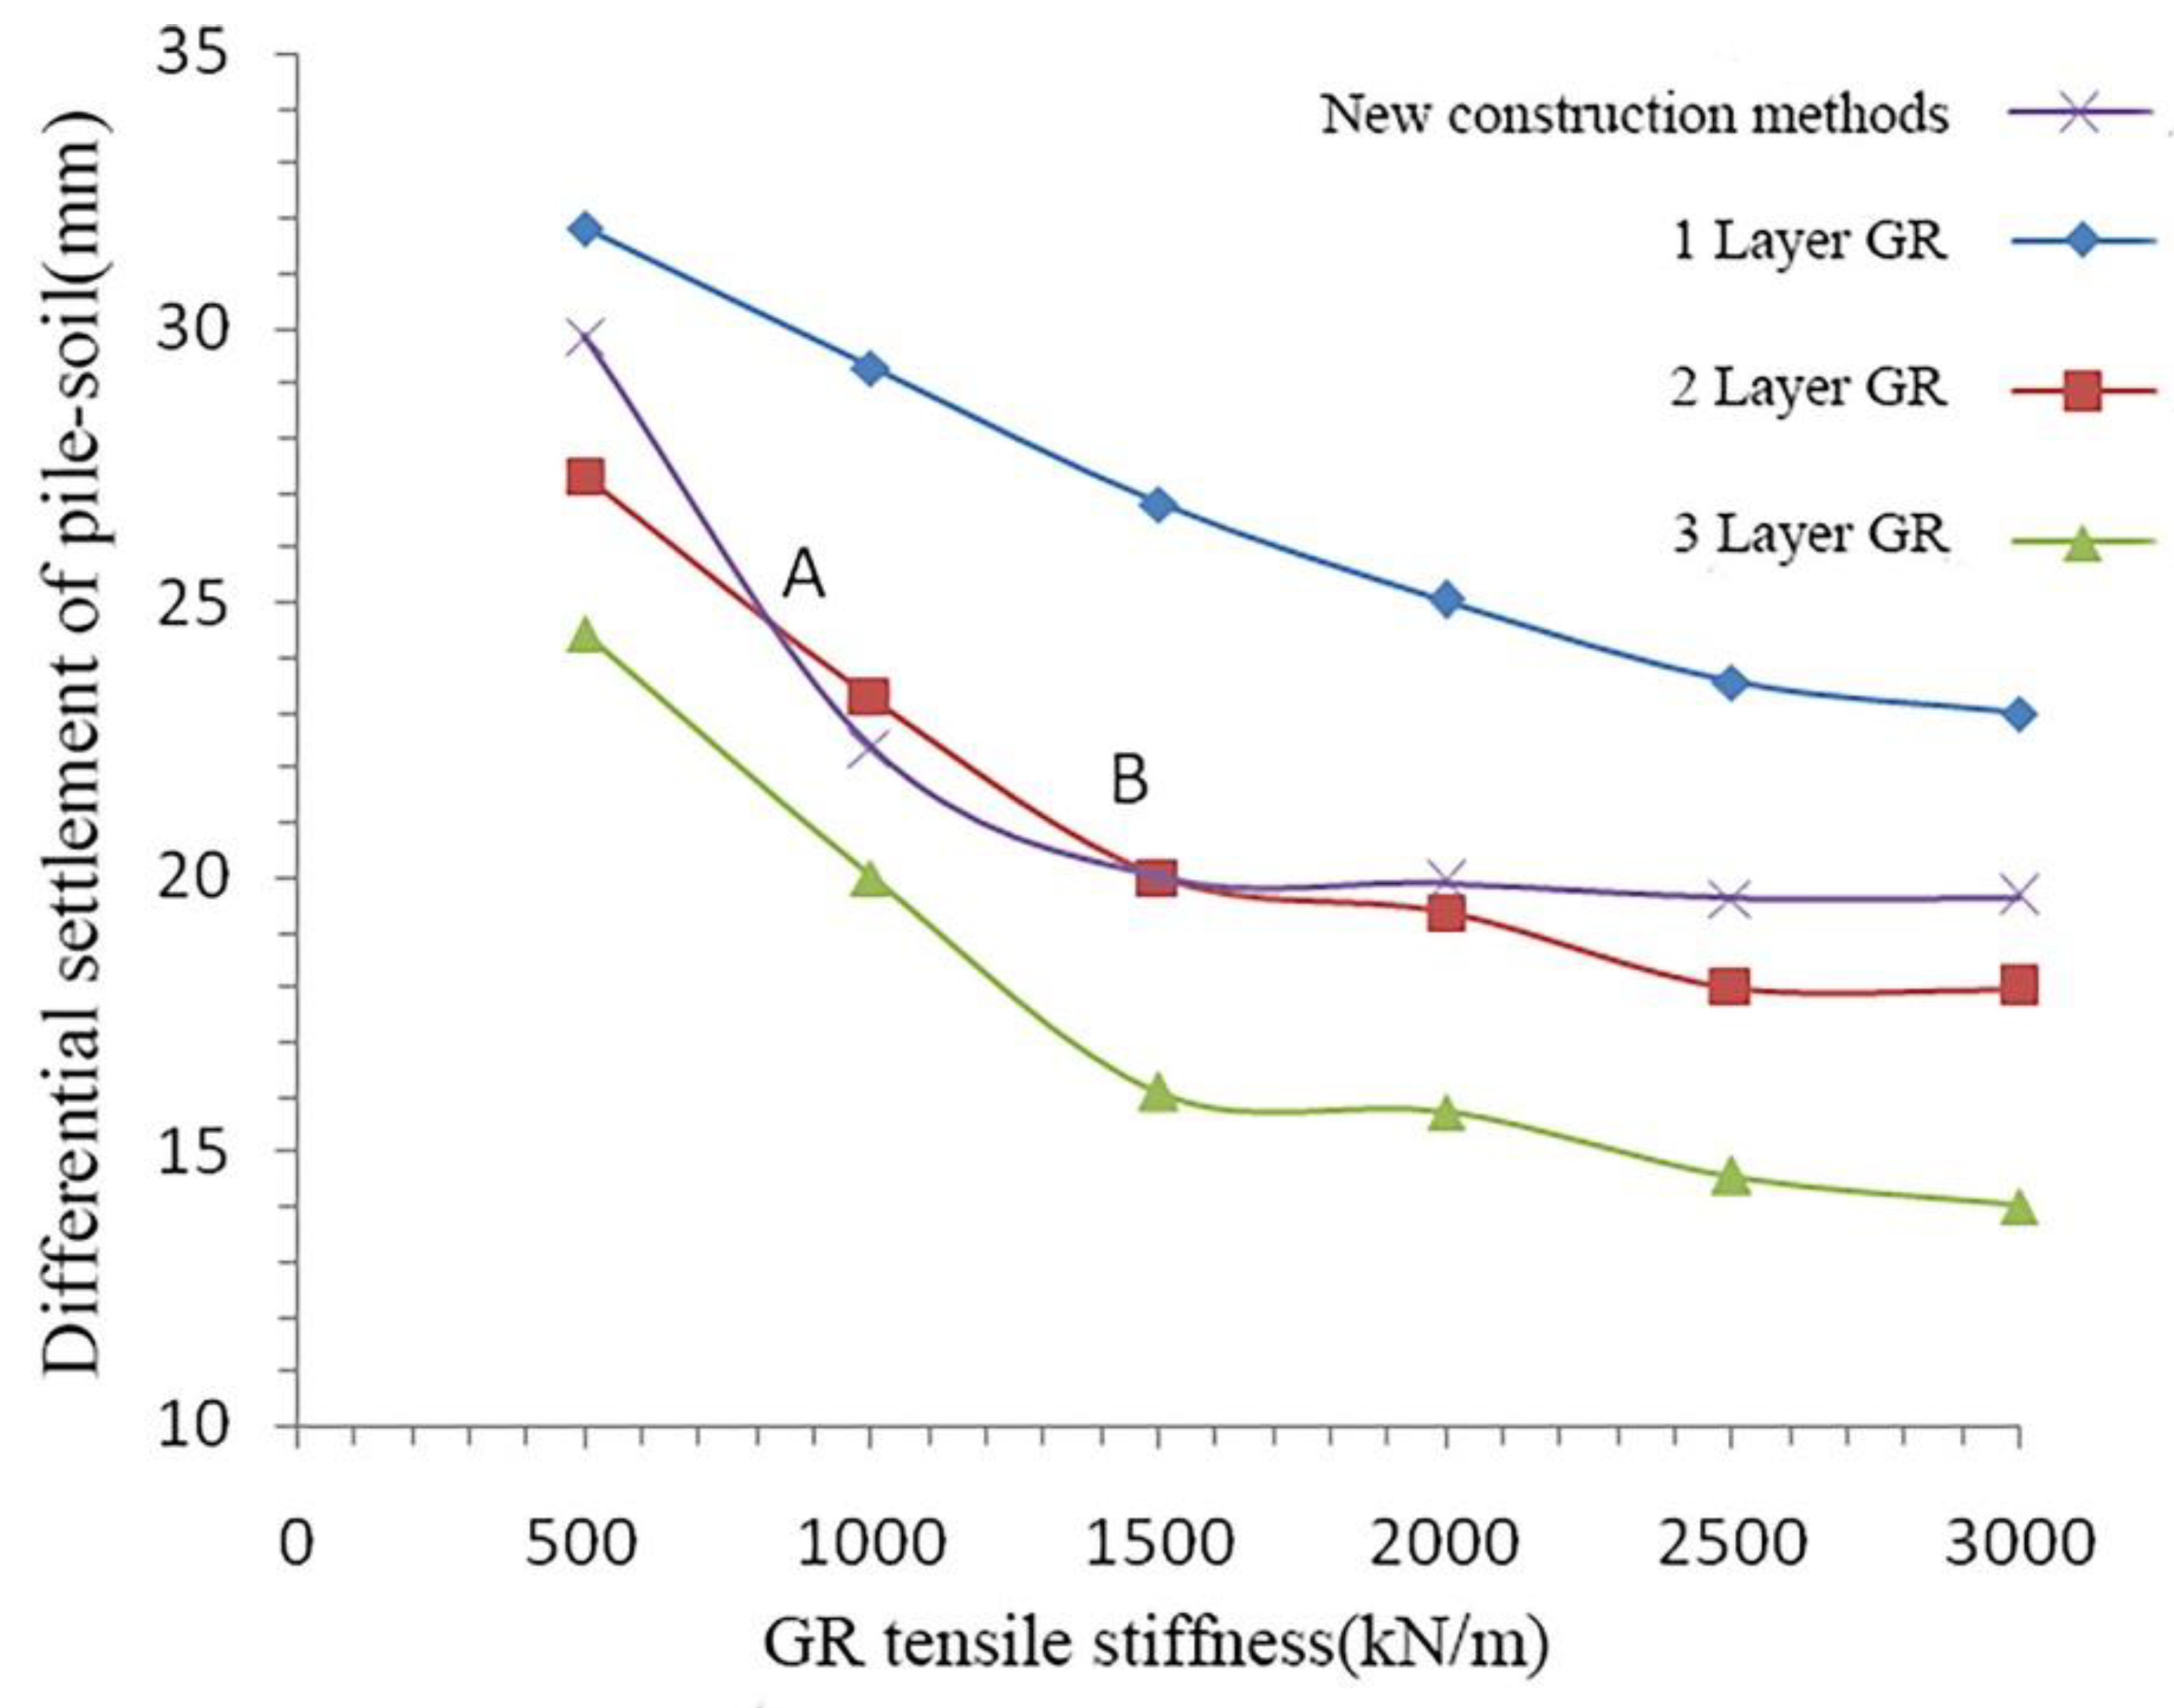
- (2)
- Optimization of GR
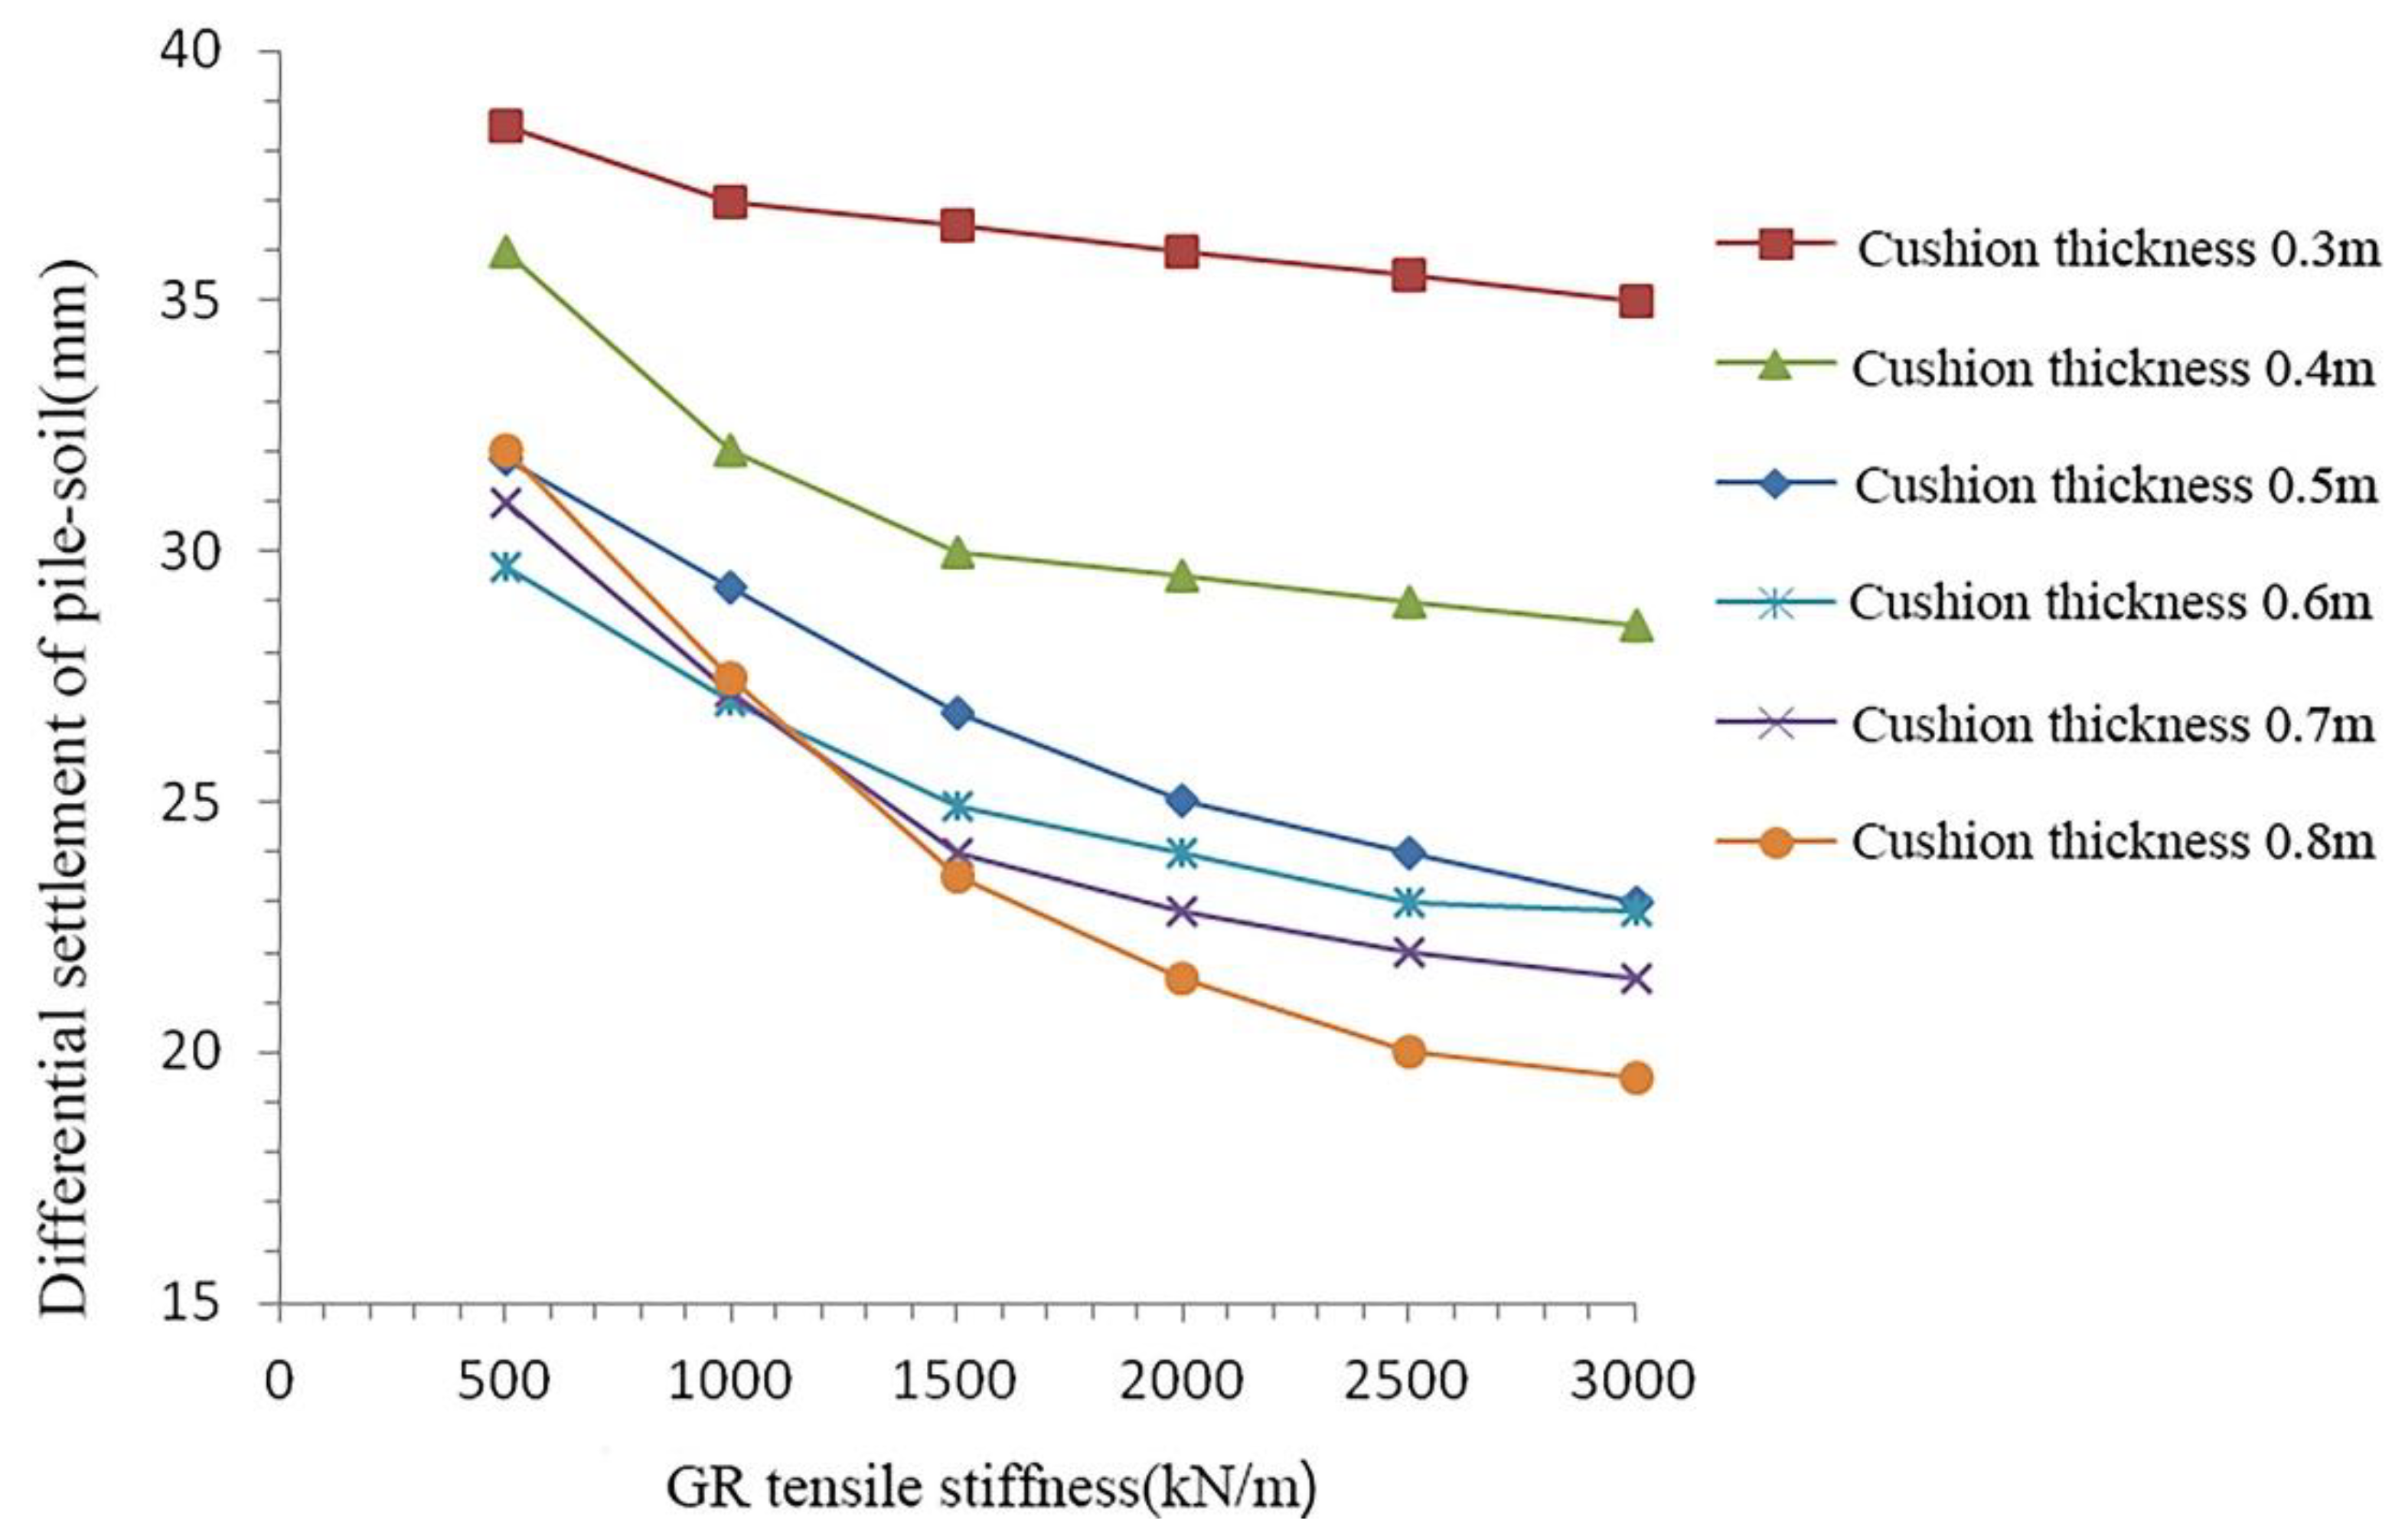
- (3)
- Optimization of cushion thickness
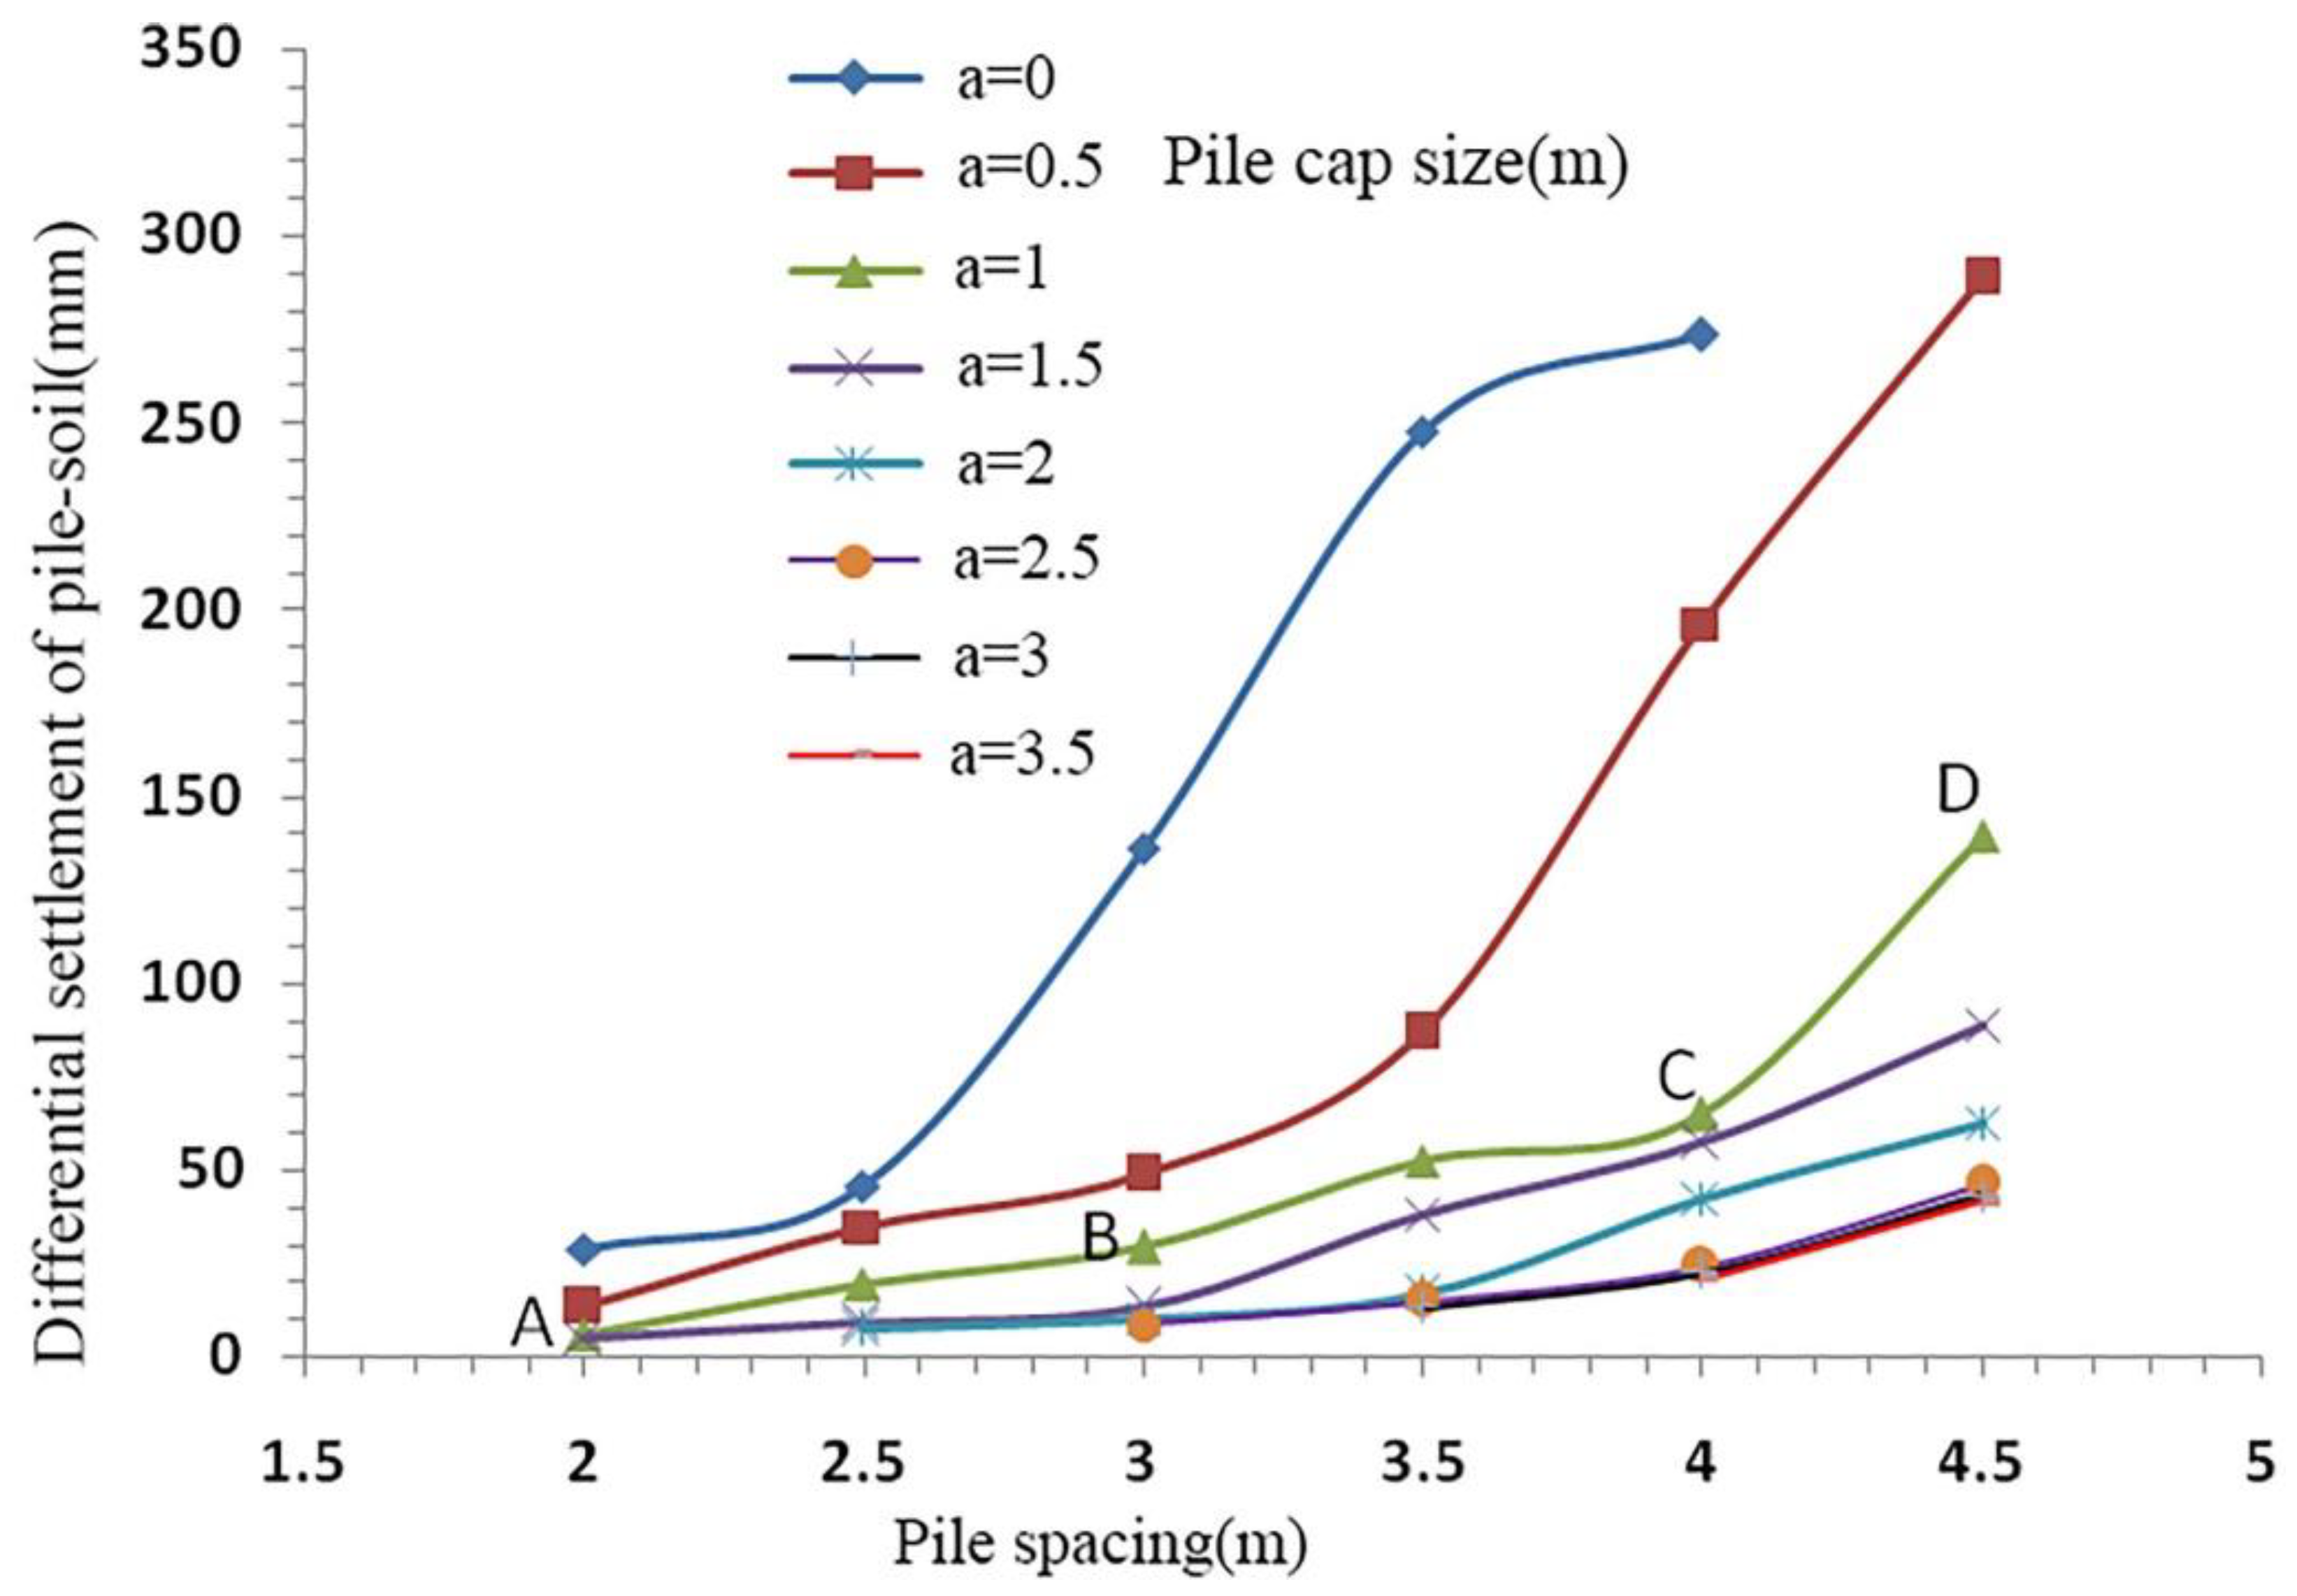
- (4)
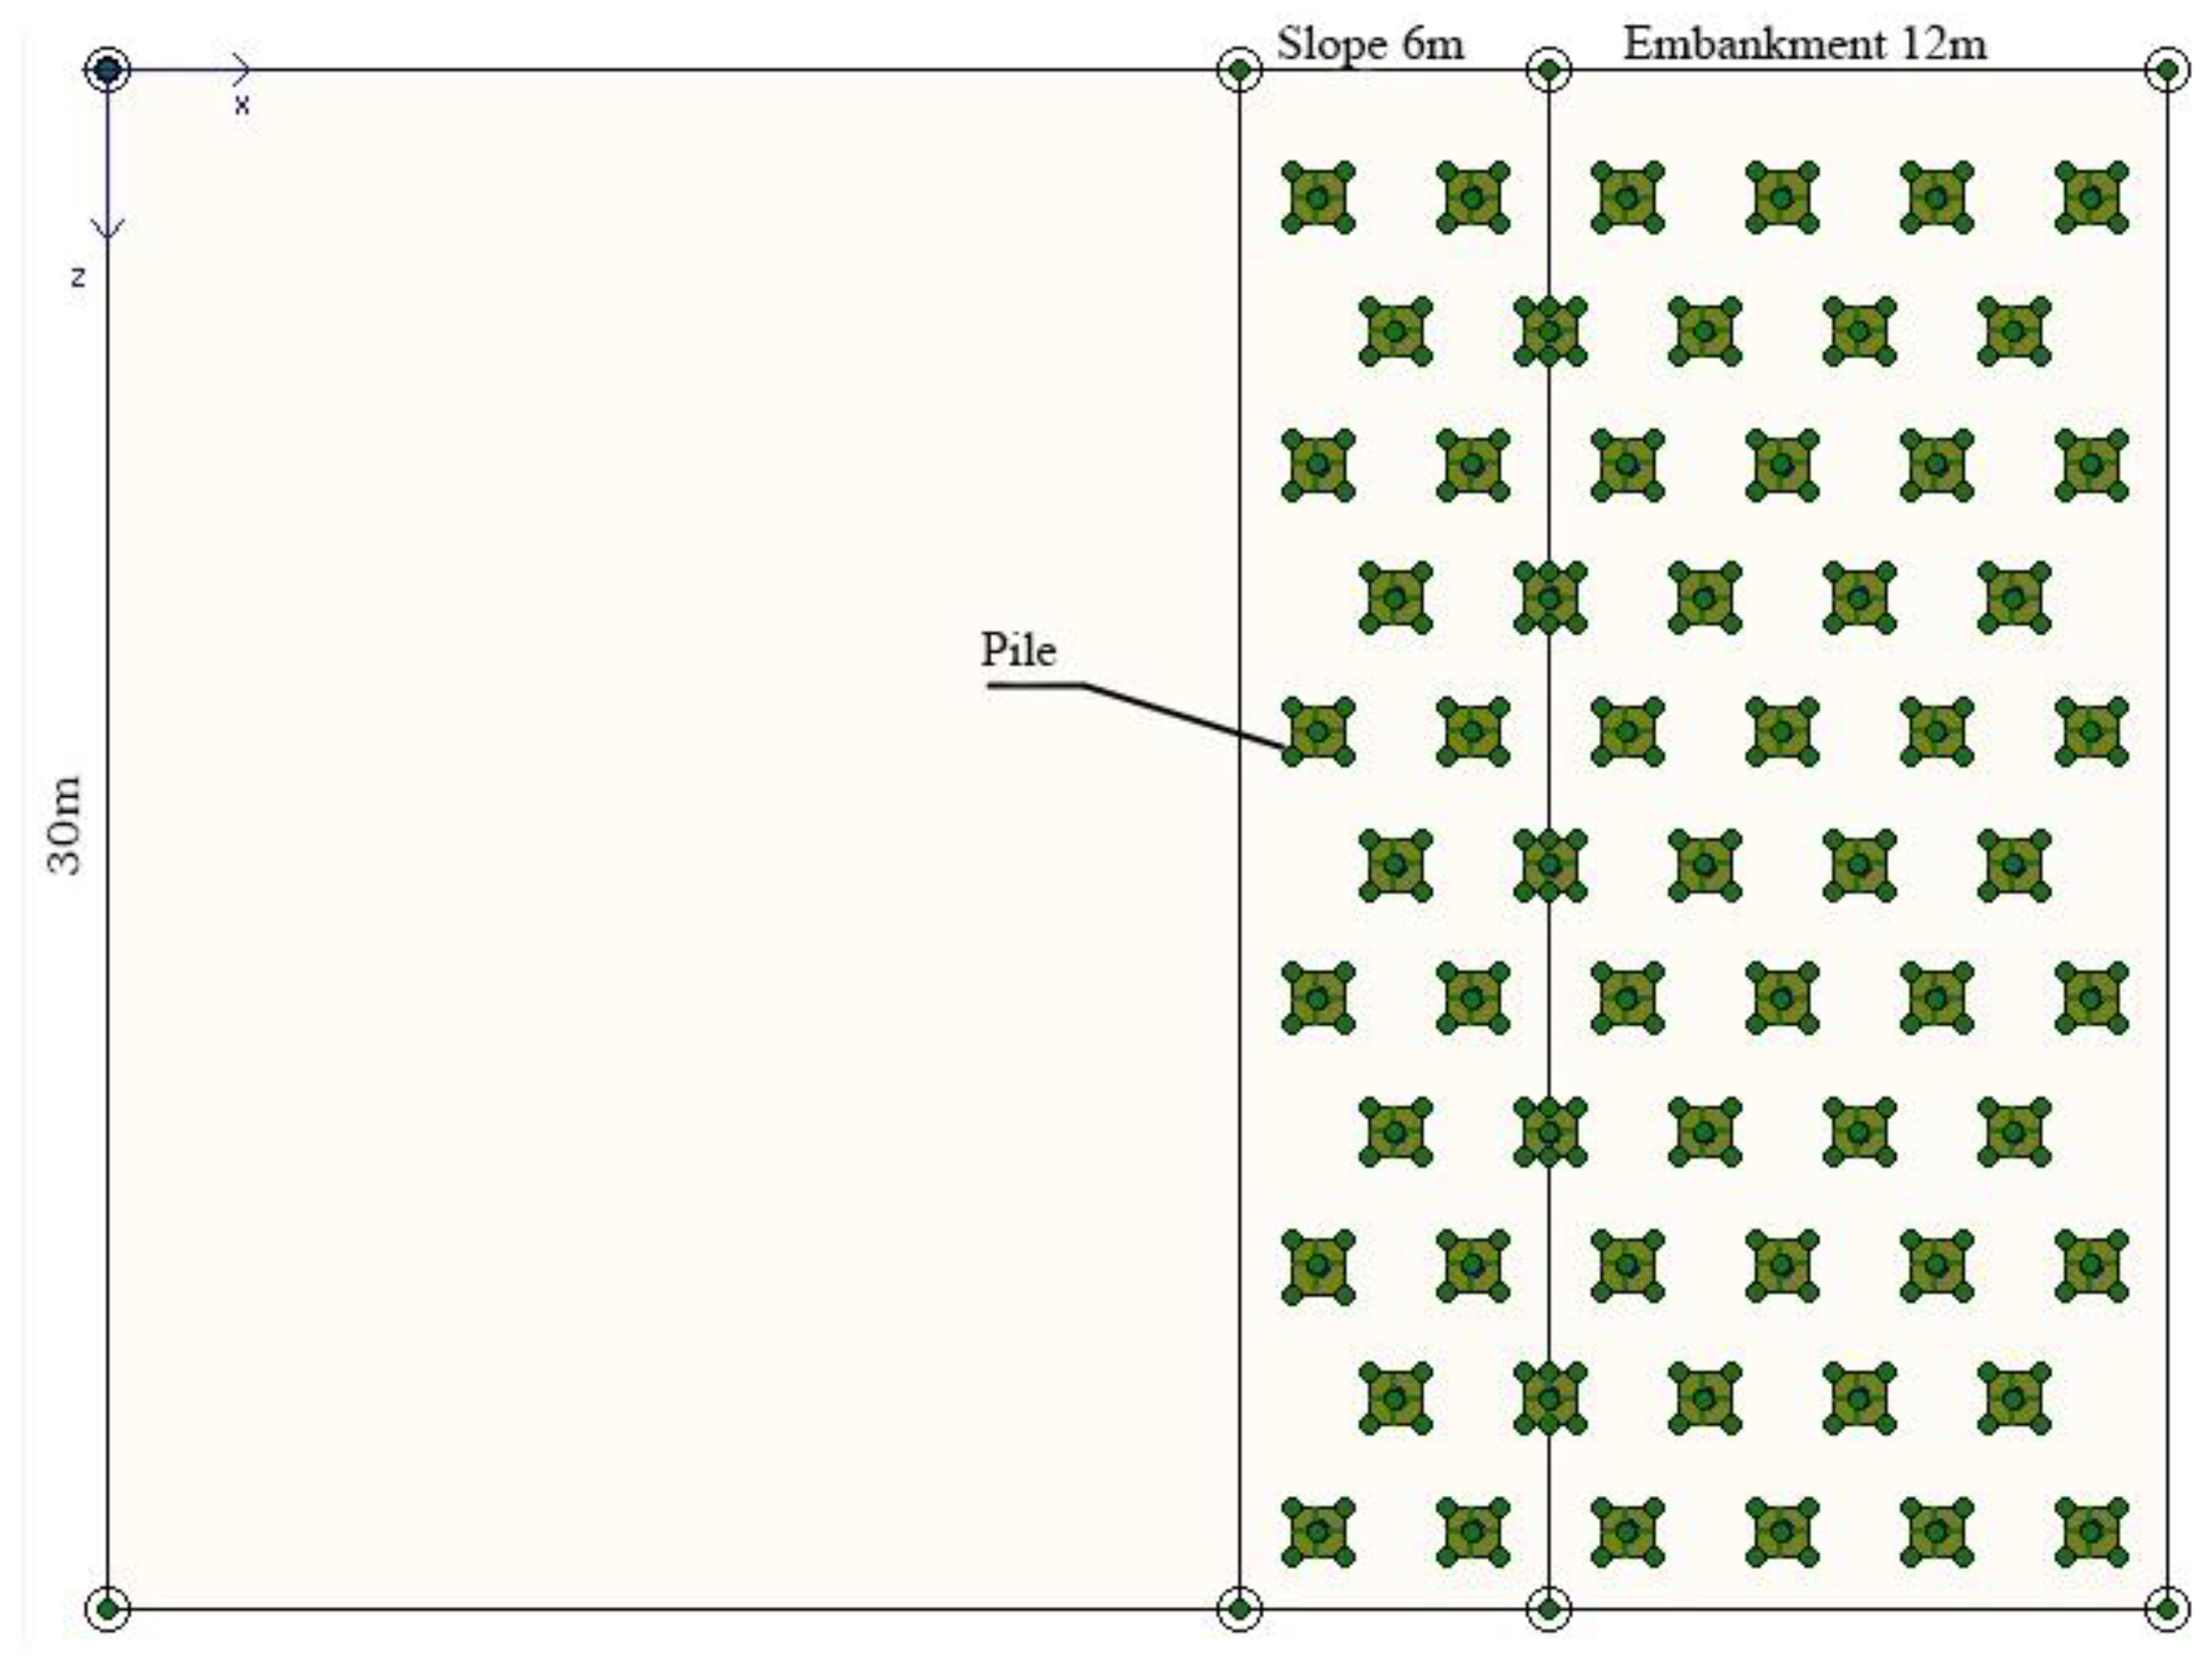
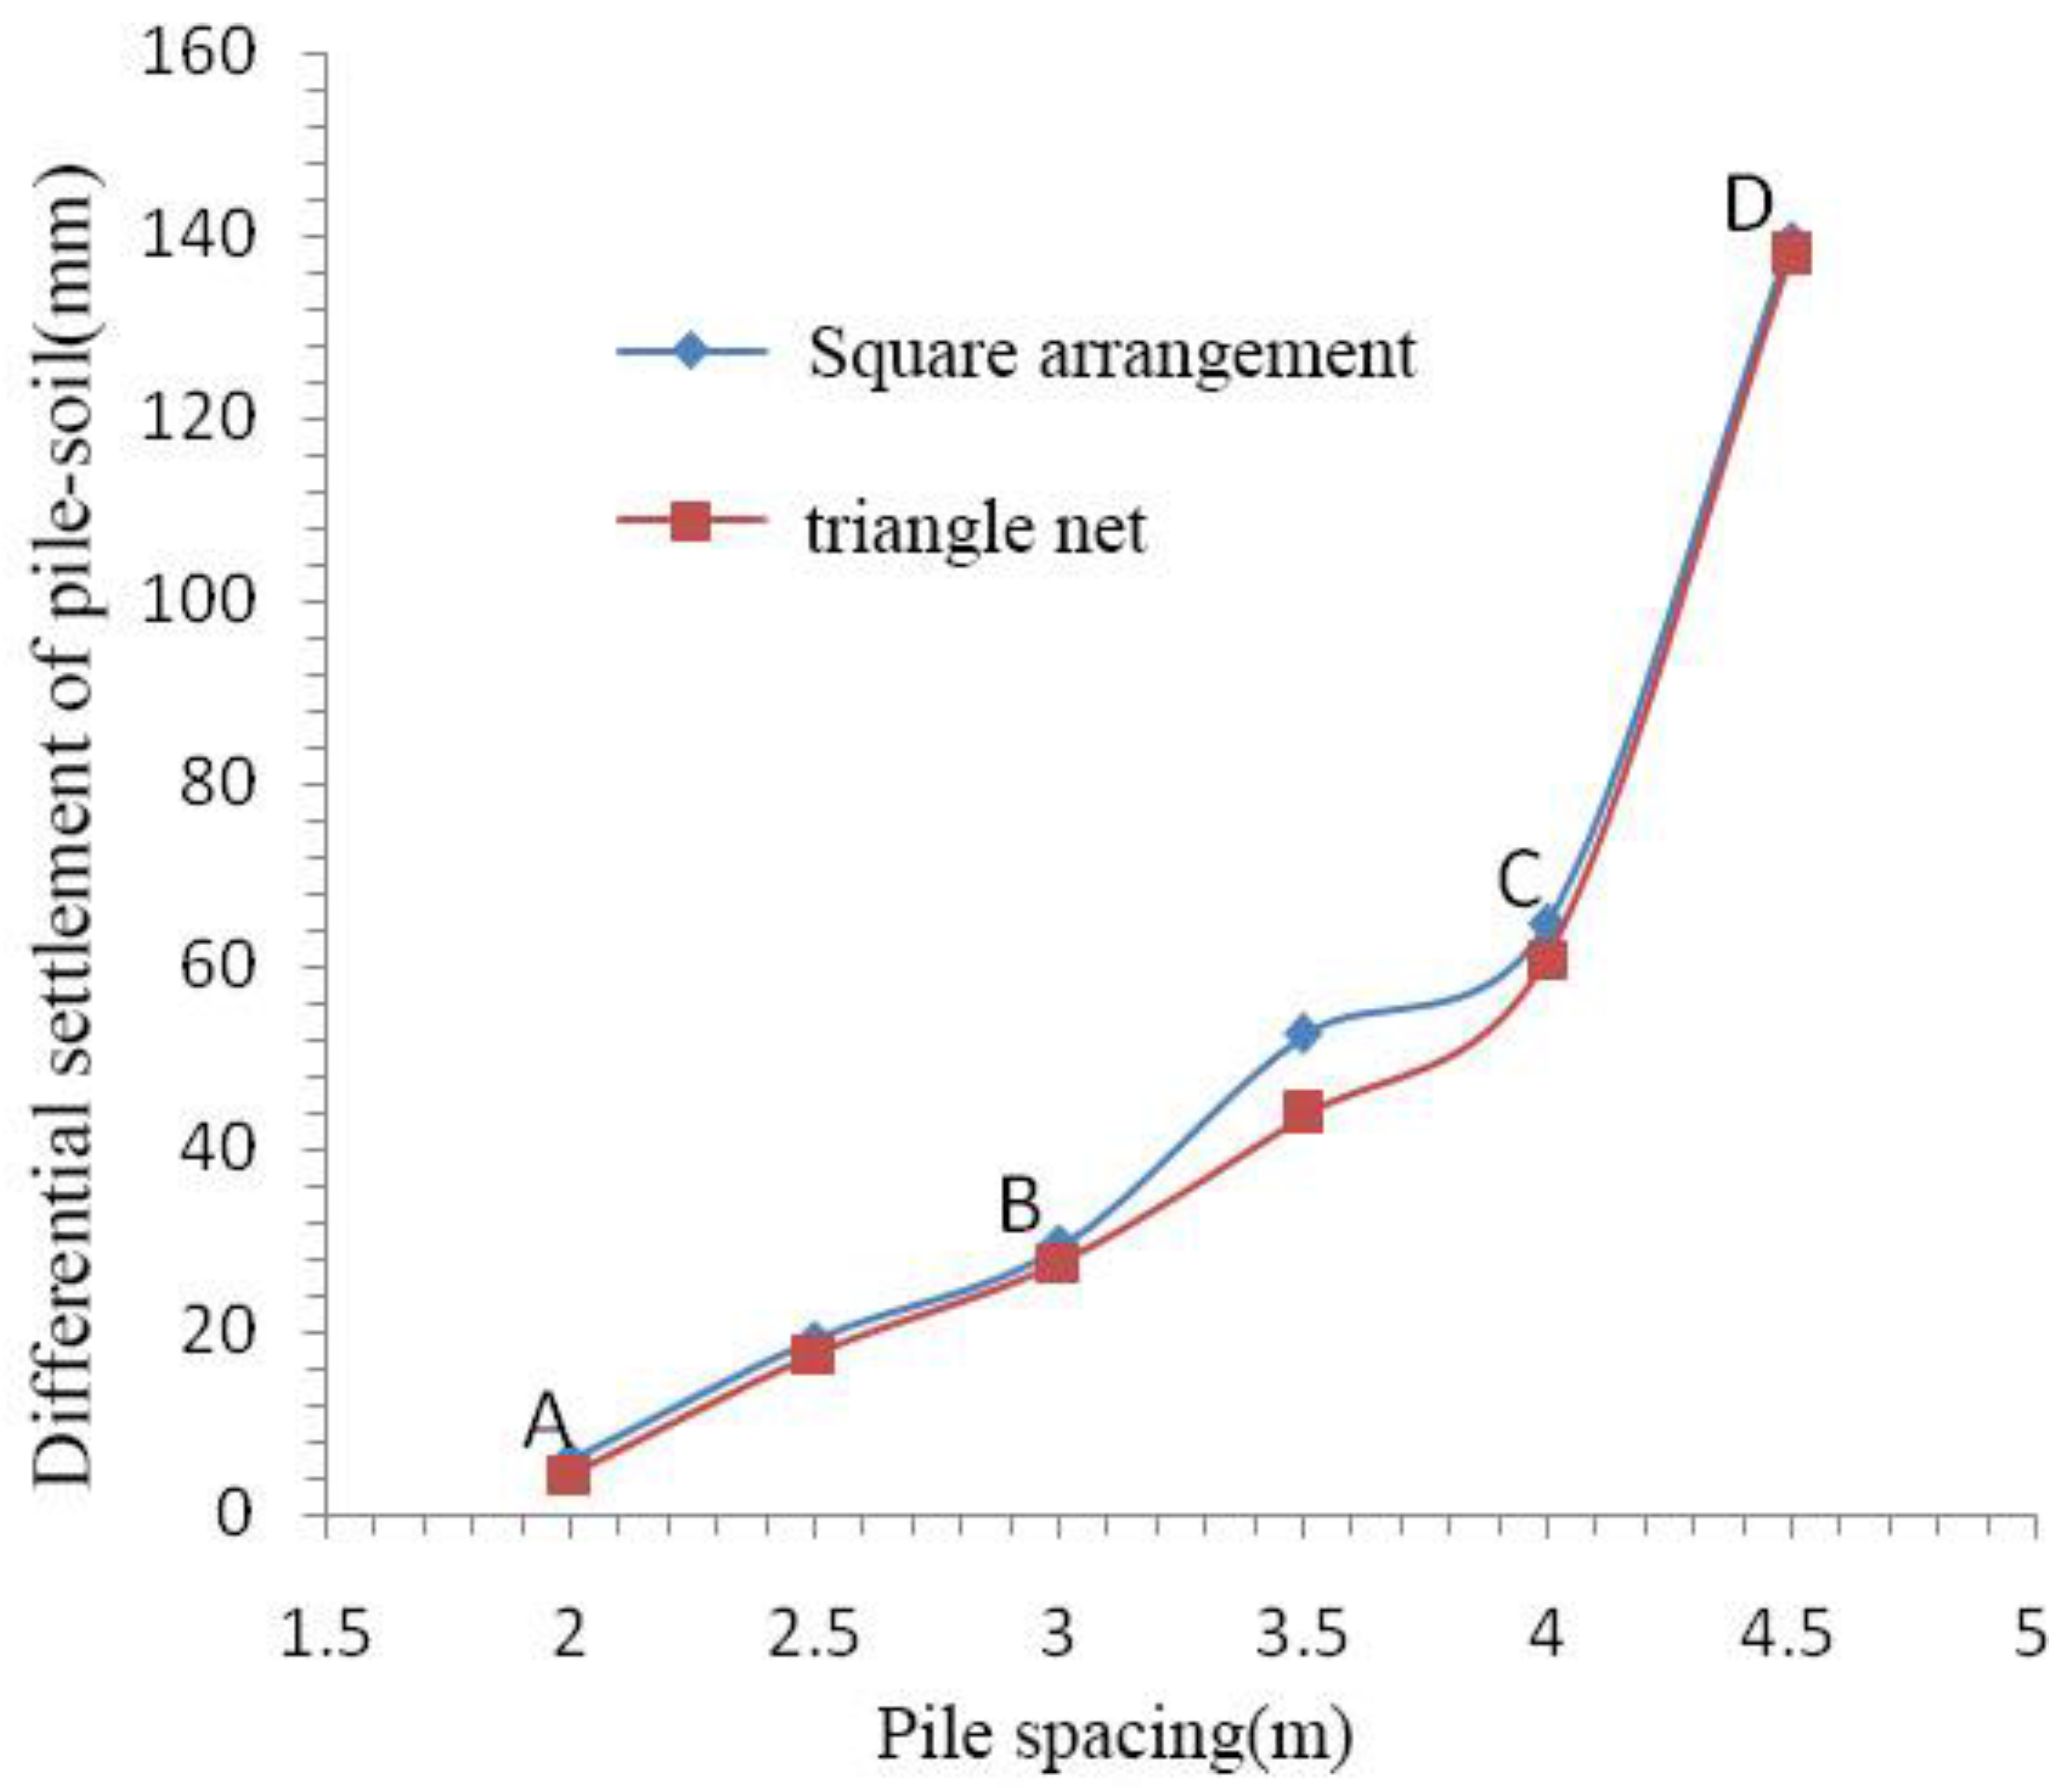
- Optimization of pile spacing
- (5)
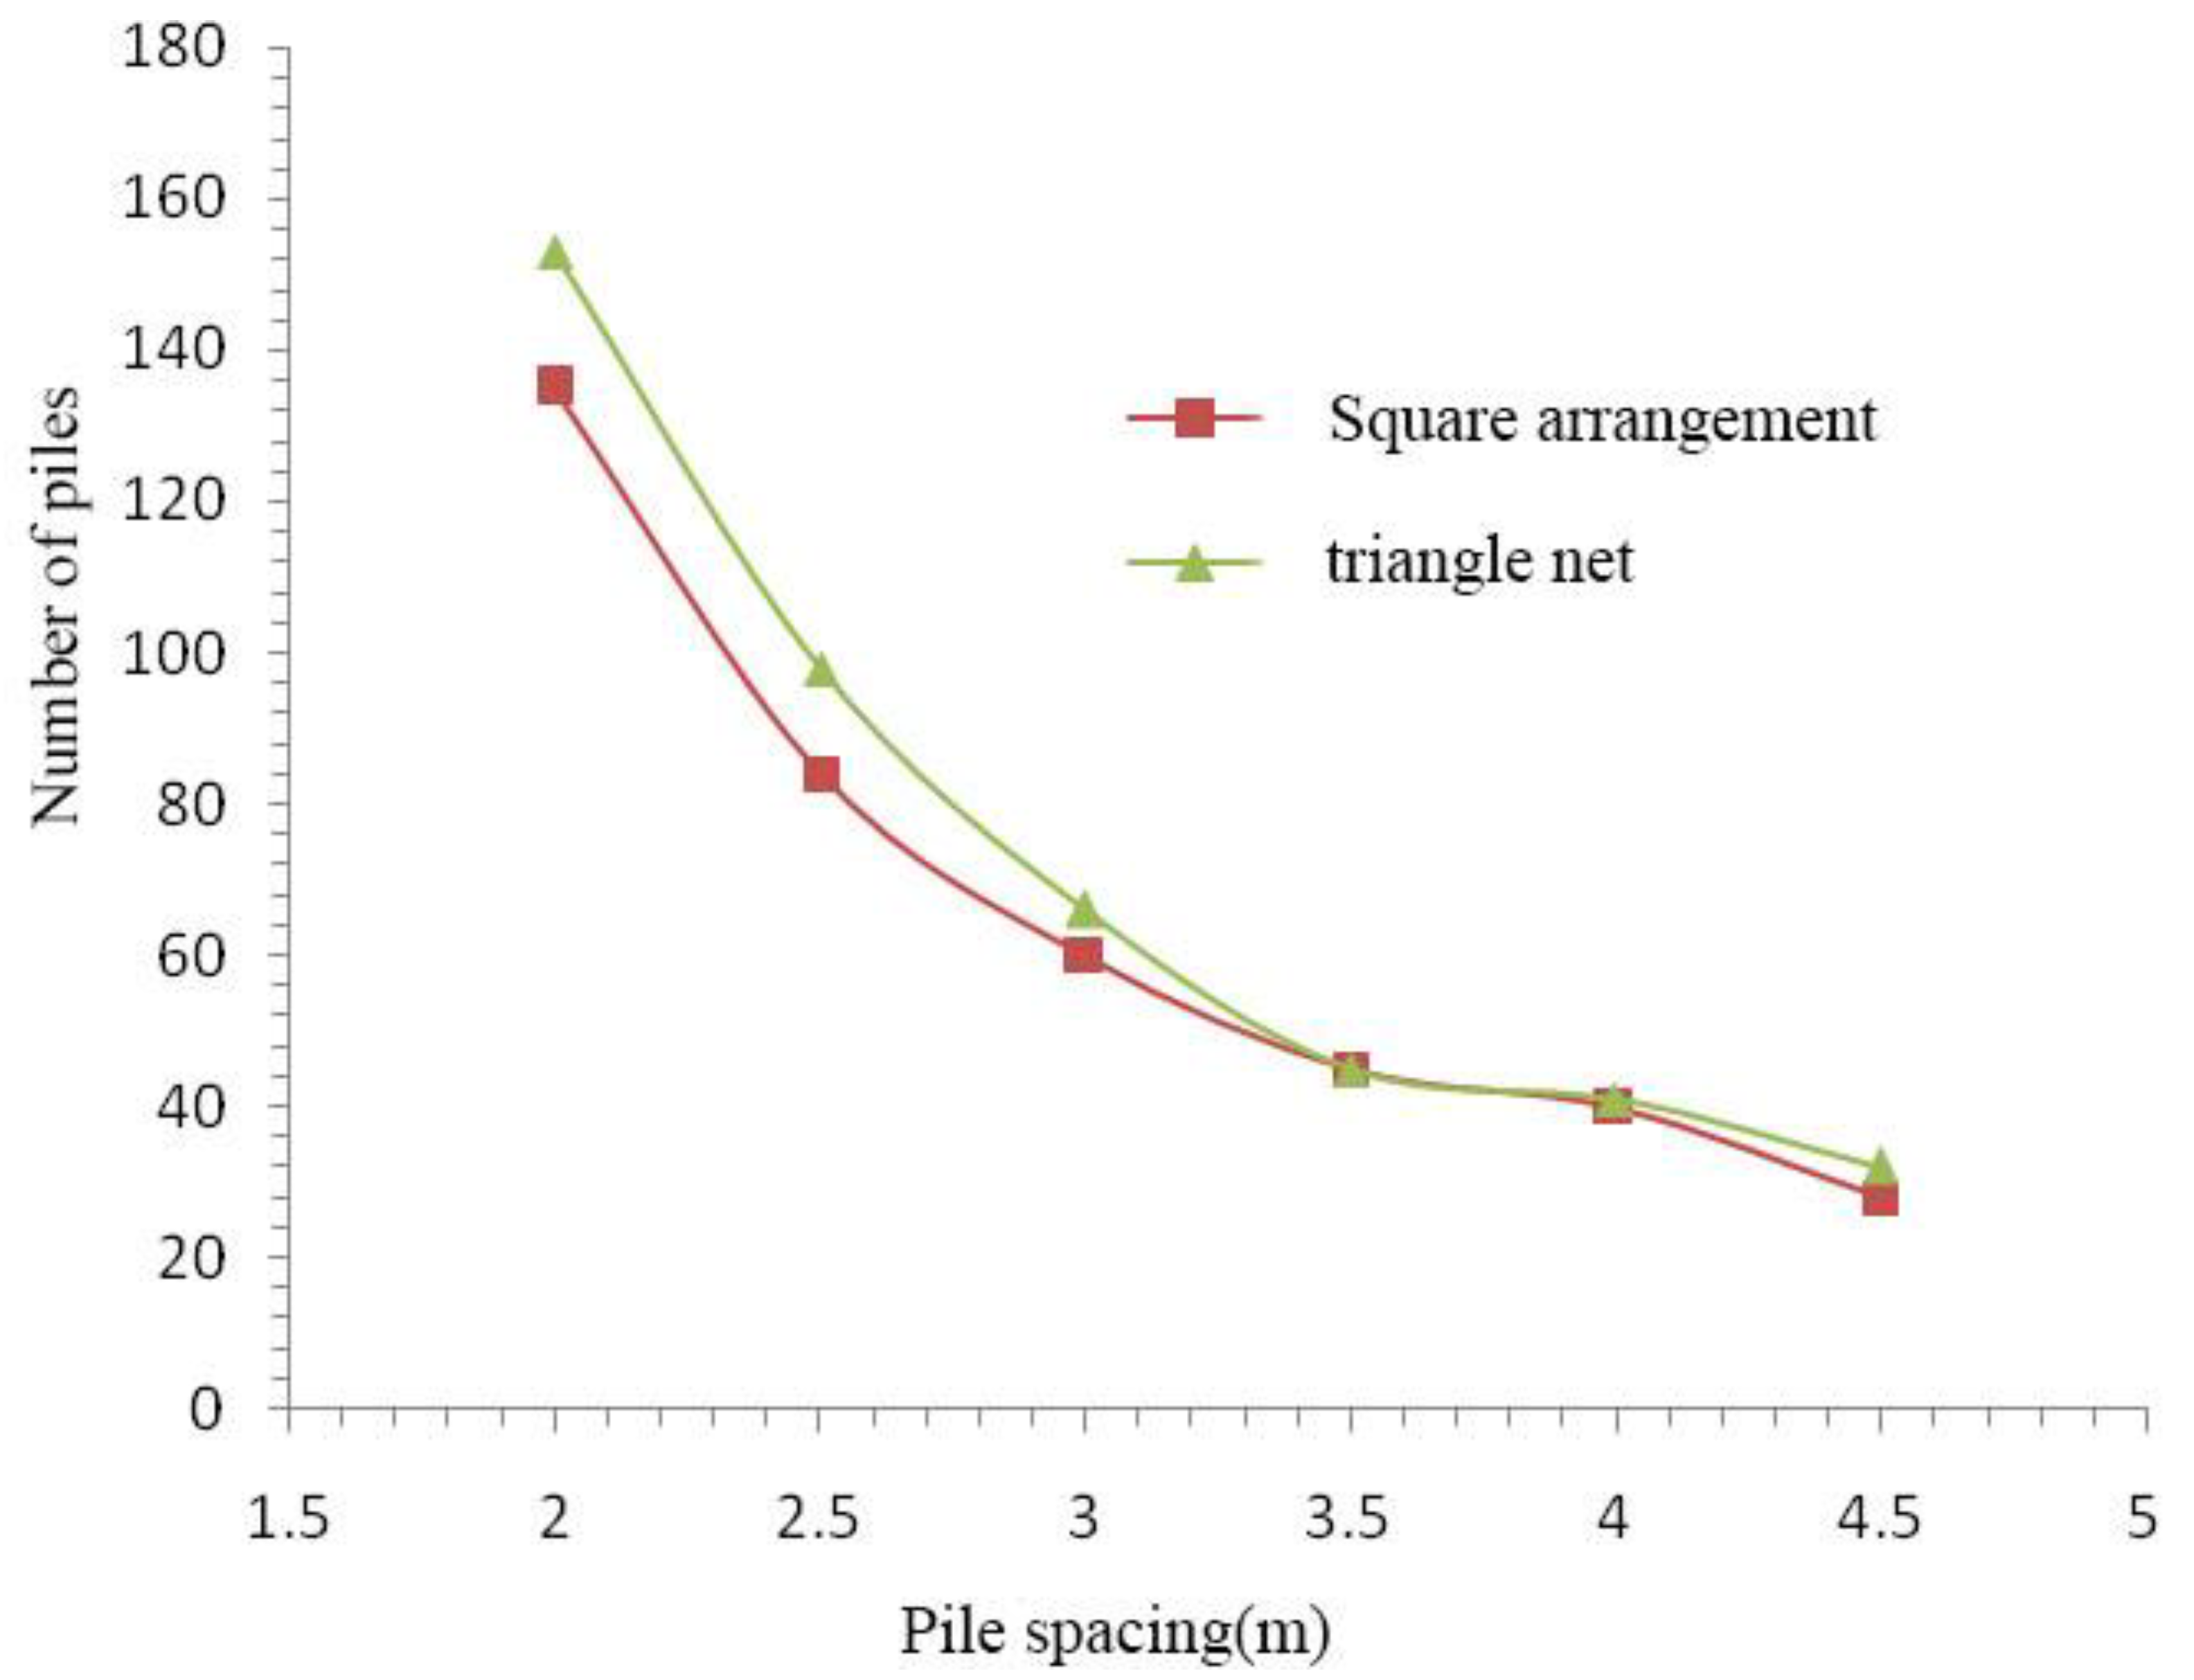
- Optimization of pile arrangement
- (6)
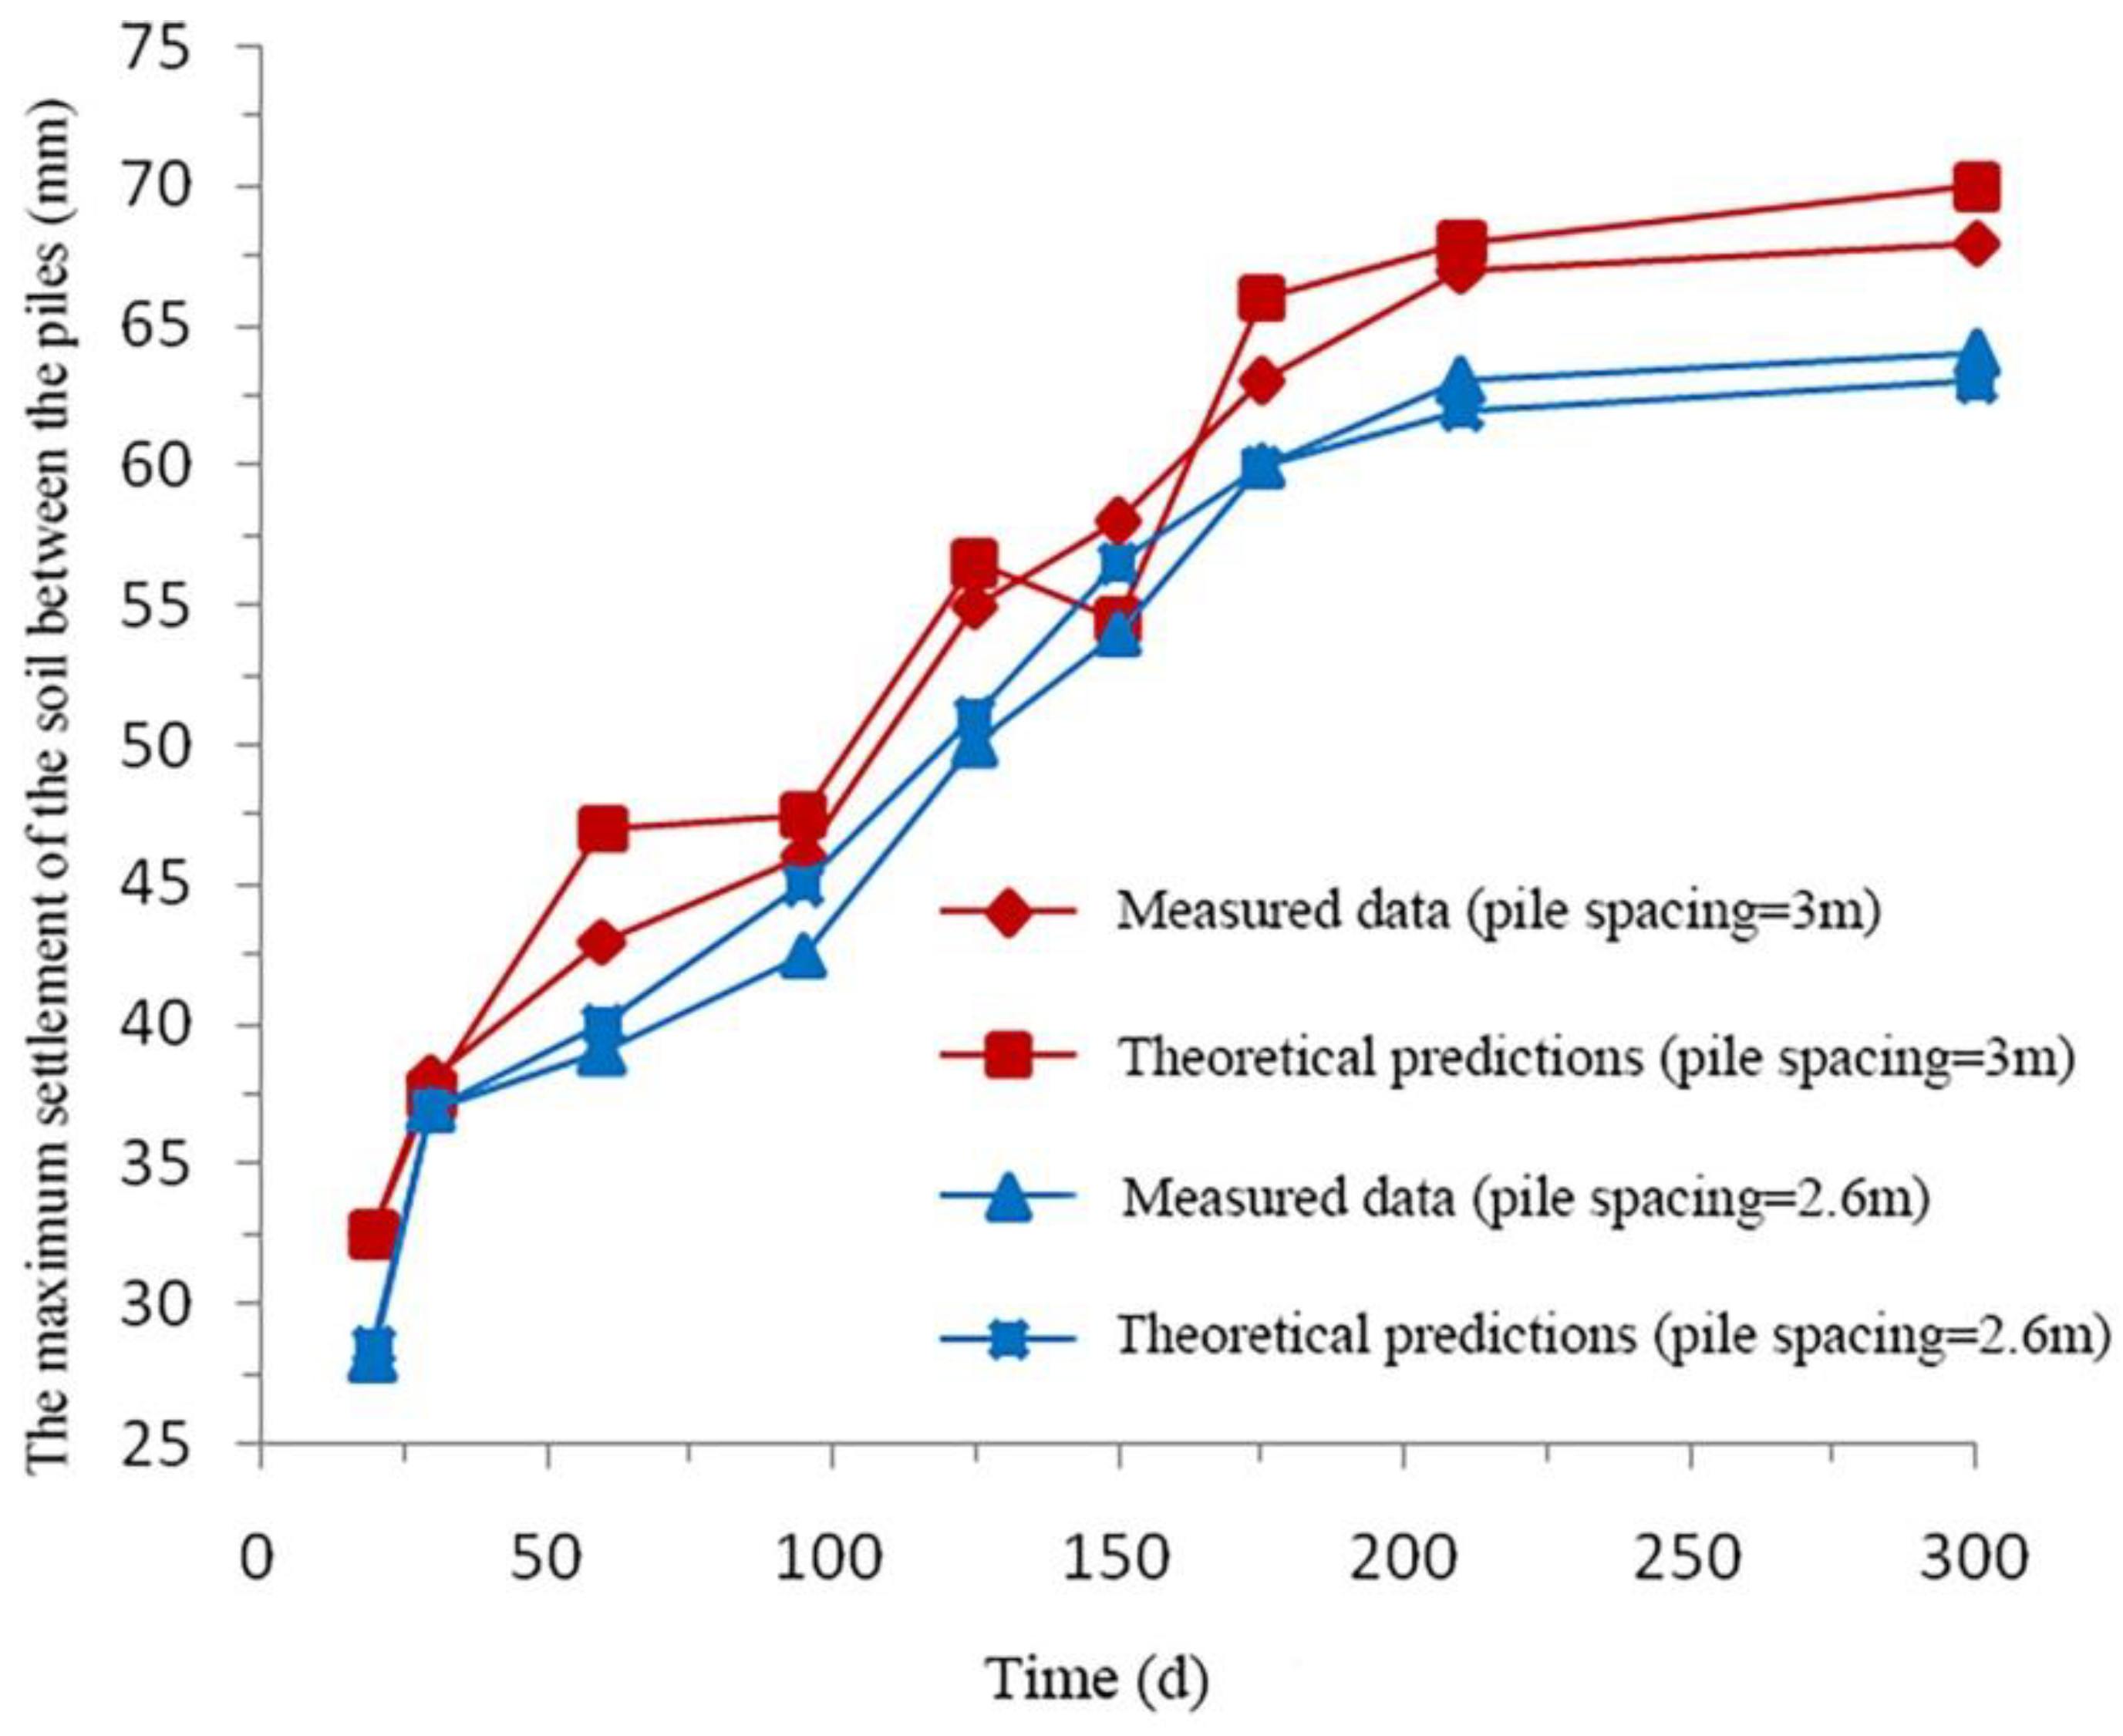
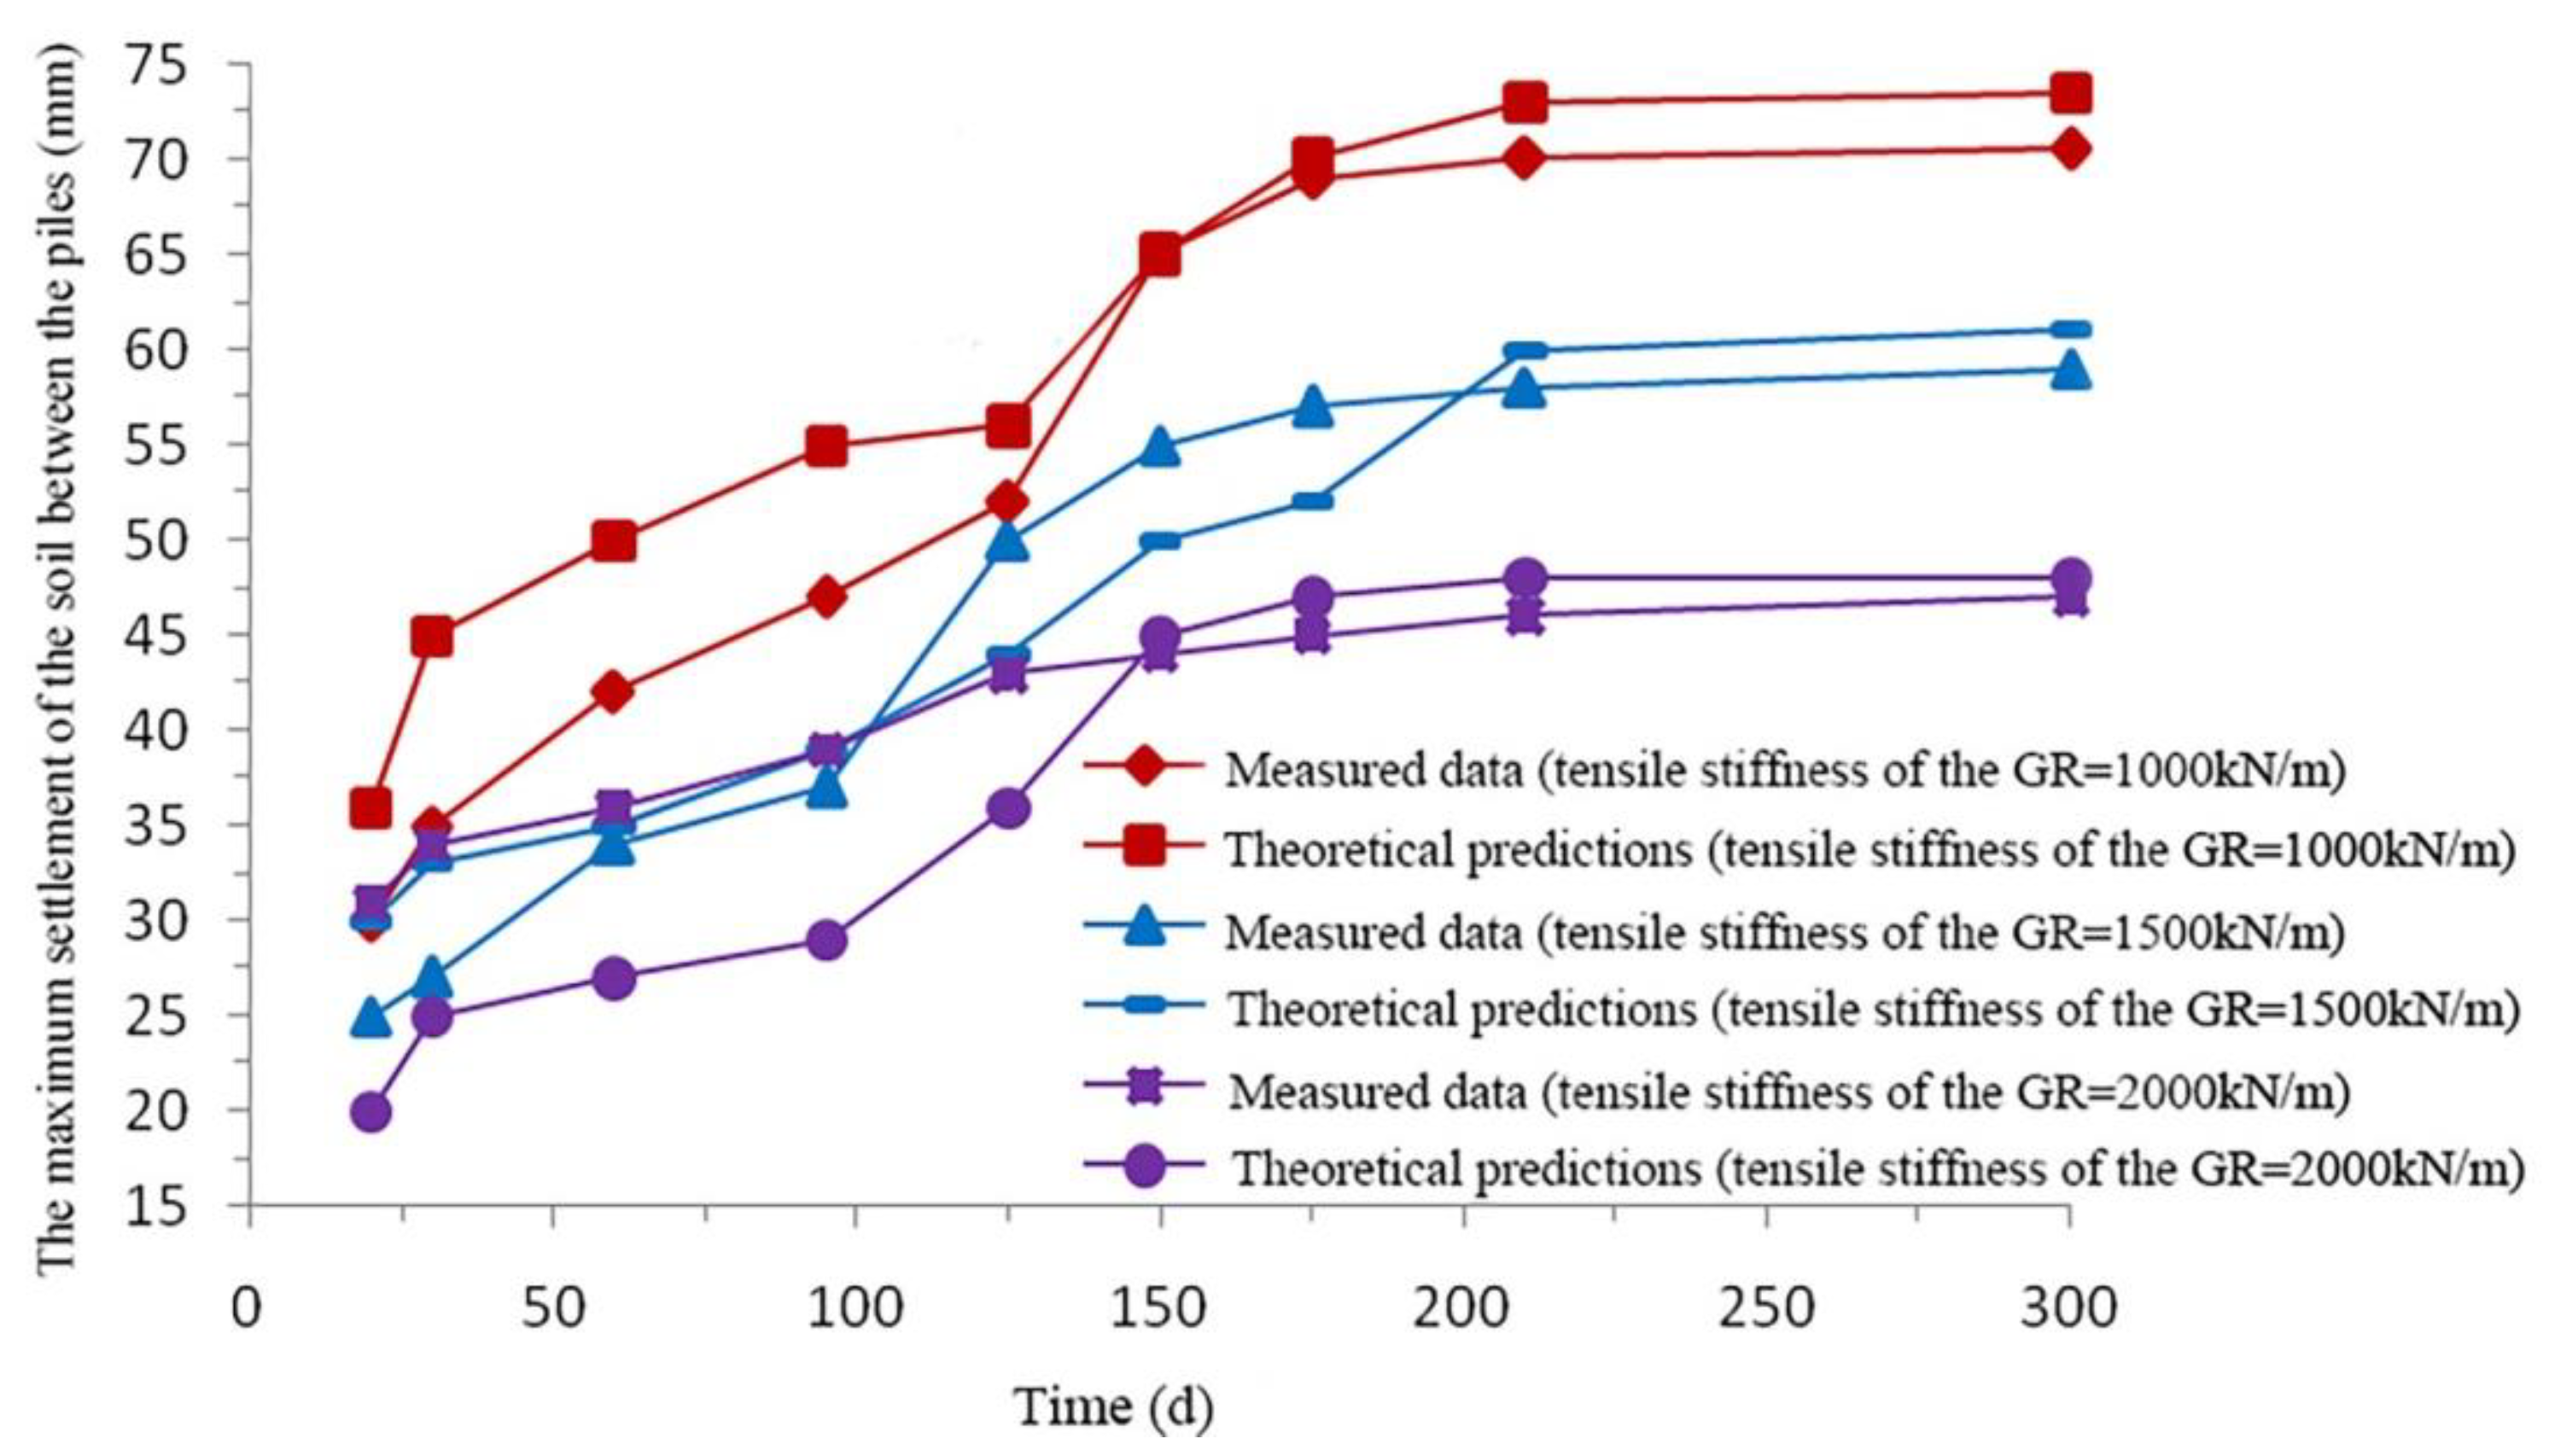
- Comparison of theoretical predictions with monitoring results
- (7)
- Analysis of optimization results
4. Conclusions
Author Contributions
Funding
Institutional Review Board Statement
Informed Consent Statement
Data Availability Statement
Acknowledgments
Conflicts of Interest
Abbreviations
| earth pressure under arch crown of primary arch (kPa) | |
| r | distance from the center point of soil between piles to soil arch (m); |
| soil stress on the upper part of the GR (kPa); | |
| pu | total load on pile cap (kPa); |
| h | distance from pile cap to the top of embankment (m); |
| soil stress in the lower part of the GR (kPa); | |
| settlement of the GR (m); | |
| strain of the GR (-); | |
| J | elastic modulus of the GR (MPa); |
| earth pressure between piles at the pile top plane (kPa); | |
| ES | elastic modulus of soil between piles (MPa); |
| K0 | coefficient of static lateral pressure (dimensionless); |
| l0 | position of the neutral point of the pile (m); |
| length of the pile (m); | |
| stress of the pile (kPa); | |
| soil stress between the piles (kPa); | |
| Ap | cross-sectional area of the pile (m2); |
| pressure at the bottom of the pile cap (kN/m2); | |
| Sp1 | compression of the piles above the equal settlement section (m); |
| m | replacement ratio of pile–soil area (%); |
| Sp2 | compression of the piles below the equal settlement section (m); |
| Sp | compression of the overall pile (m); |
| soil deformation when the pile just enters the soil (m); | |
| oil deformation when the pile completely enters the soil (m); | |
| k | coefficient of the subgrade soil between the piles of a GRPSE (-); |
| stress at the top of the pile cap under the reinforced cushion (kPa); | |
| T | tensile force of the GR (kN); |
| n | pile–soil stress ratio (%); |
| E | load sharing ratio of the pile (%); |
| hes | height of the equal settlement section (m); |
| ratio of the height of the equal settlement section to the net spacing of the pile cap (%); | |
| cost influence coefficient (dimensionless). |
References
- Wang, H.L.; Chen, R.P.; Liu, Q.W.; Kang, X. Investigation on geogrid reinforcement and pile efficacy in geosynthetic-reinforced pile-supported track-bed. Geotext. Geomembr. 2019, 47, 755–766. [Google Scholar] [CrossRef]
- Van Eekelen, S.J.M. The 2016-update of the dutch design guideline for basal reinforced piled embankments. Procedia Eng. 2016, 143, 582–589. [Google Scholar] [CrossRef] [Green Version]
- Zhang, C.; Jiang, G.; Liu, X.; Buzzi, O. Arching in geogrid-reinforced pile-supported embankments over silty clay of medium compressibility: Field data and analytical solution. Comput. Geotech. 2016, 77, 11–25. [Google Scholar] [CrossRef]
- Ye, G.B.; Wang, M.; Zhang, Z.; Han, J.; Xu, C. Geosynthetic-reinforced pile-supported embankments with caps in a triangular pattern over soft clay. Geotext. Geomembr. 2020, 48, 52–61. [Google Scholar] [CrossRef]
- Zhang, Z.; Wang, M.; Ye, G.B.; Han, J. Influence of number of geosynthetic layers on the performance of geosynthetic-reinforced pile-supported earth platforms on soft soil: Numerical study. In Proceedings of the 2017 International Conference on Transportation Infrastructure and Materials, Qingdao, China, 9–12 June 2017. [Google Scholar] [CrossRef] [Green Version]
- Briançon, L.; Simon, B. Performance of pile-supported embankment over soft soil: Full-scale experiment. J. Geotech. Geoenviron. Eng. 2012, 138, 551–561. [Google Scholar] [CrossRef]
- Briançon, L.; Simon, B. Pile-supported embankment over soft soil for a high-speed line. Geosynth. Int. 2017, 24, 293–305. [Google Scholar] [CrossRef]
- Lu, W.; Miao, L.; Wang, F.; Zhang, J.; Zhang, Y.; Wang, H. A case study on geogrid-reinforced and pile-supported widened highway embankment. Geosynth. Int. 2020, 27, 261–274. [Google Scholar] [CrossRef]
- Zhou, C.; Cui, G.; Liang, W.; Liu, Z.; Zhang, L. A coupled macroscopic and mesoscopic creep model of soft marine soil using a directional probability entropy approach. J. Mar. Sci. Eng. 2021, 9, 224. [Google Scholar] [CrossRef]
- Lin, C.; Xia, C.; Liu, Z.; Zhou, C. A Comprehensive Correlation Study of Structured Soils in Coastal Area of South China about Structural Characteristics. J. Mar. Sci. Eng. 2022, 10, 508. [Google Scholar] [CrossRef]
- Rui, R.; Ye, Y.Q.; Han, J.; Zhai, Y.X.; Wan, Y.; Chen, C.; Zhang, L. Two-dimensional soil arching evolution in geosynthetic-reinforced pile-supported embankments over voids. Geotext. Geomembr. 2022, 50, 82–98. [Google Scholar] [CrossRef]
- Zhang, L.; Zhao, M.; Hu, Y.; Zhao, H.; Chen, B. Semi-analytical solutions for geosynthetic-reinforced and pile-supported embankment. Comput. Geotech. 2012, 44, 167–175. [Google Scholar] [CrossRef]
- Wang, K.; Zhuang, Y.; Liu, H.; Xiao, H. Multilayered low-strength geogrid-reinforced piled embankment. Geotech. Res. 2018, 5, 231–246. [Google Scholar] [CrossRef] [Green Version]
- Chen, R.P.; Liu, Q.W.; Wang, H.L.; Liu, Y.; Ma, Q.L. Performance of geosynthetic-reinforced pile-supported embankment on soft marine deposit. Proc. Inst. Civ. Eng. Geotech. Eng. 2021, 174, 627–644. [Google Scholar] [CrossRef]
- Zhang, Z.; Wang, M.; Ye, G.B.; Han, J. A novel 2D-3D conversion method for calculating maximum strain of geosynthetic reinforcement in pile-supported embankments. Geotext. Geomembr. 2019, 47, 336–351. [Google Scholar] [CrossRef]
- Liu, Z.; Liu, P.; Zhou, C.; Li, Y.; Zhang, L. Modeling riverbank slope reinforcement using anti-slide piles with geocells. J. Mar. Sci. Eng. 2021, 9, 394. [Google Scholar] [CrossRef]
- Pham, T.A.; Tran, Q.A.; Villard, P.; Dias, D. Geosynthetic-reinforced pile-supported embankments− 3D discrete numerical analyses of the interaction and mobilization mechanisms. Eng. Struct. 2021, 242, 112337. [Google Scholar] [CrossRef]
- Ariyarathne, P.; Liyanapathirana, D.S. Review of existing design methods for geosynthetic-reinforced pile-supported embankments. Soils Found. 2015, 55, 17–34. [Google Scholar] [CrossRef] [Green Version]
- Pham, T.A. Analysis of geosynthetic-reinforced pile-supported embankment with soil-structure interaction models. Comput. Geotech. 2020, 121, 103438. [Google Scholar] [CrossRef]
- Zhou, L.X.; Wang, M.S.; Zhang, D.L.; Tong, H.W.; Tian, S.W. Study of the soil arching effect and the pile-soil stress ratio of composite ground. China Civ. Eng. J. 2011, 44, 93–99. [Google Scholar] [CrossRef]
- British Standard BS8006; Code of Practice for Strenthened. British Standard Institution: London, UK, 1995.
- Van Eekelen, S.V.; Bezuijen, A.; Van Tol, A.F. Analysis and modification of the British Standard BS8006 for the design of piled embankments. Geotext. Geomembr. 2011, 29, 345–359. [Google Scholar] [CrossRef]
- Bouma, A.L. Mechanica van constructies: Elasto-statica van slanke structuren. Delftse Uitgevers Maatschappij 1993, 90, 62–68. [Google Scholar]
- Qiang, X.J. Study on Load Transforming Mechanism of Mechanica van constructies: Elasto-statica van slanke structureneinforced Pile-Supported Embankment. Ph.D. Thesis, China Academy of Railway Sciences Corporation Limited, Beijing, China, 2009. [Google Scholar]
- Zhou, J.; Ye, Y.S.; Cai, D.G. Analysis of calculation method for foreign geosynthetic reinforced pile supported embankments. China Railw. Sci. 2007, 28, 1–6. [Google Scholar]
- MOHURD (Ministry of Housing and Urban-Rural Development of the People’s Republic of China). JGJ79-2012 Technical Code for Ground Treatment of Buildings; China Architecture & Building Press: Beijing, China, 2013. [Google Scholar]
- MOT (Ministry of Transport of the People’s Republic of China). JTG3830-2018 Highway Engineering Budget Quota; China Communications Press: Beijing, China, 2018. [Google Scholar]
- Tan, H.M. Numerical Analysis of Inf luence of Cushion on Pile-Soil Stress Adjustment in Pile-Supported Embankment. Highway 2008, 3, 1–7. [Google Scholar]
- Chen, F.Q.; Li, A.C. Improved design method of geosynthetic reinforced pile supported embankments on soft soil. Chin. J. Geotech. Eng. 2007, 12, 1804–1808. [Google Scholar]
- MOHURD (Ministry of Housing and Urban-Rural Development of the People’s Republic of China). JGJ94-2008 Technical Code for Building Pile Foundation; China Architecture & Building Press: Beijing, China, 2008. [Google Scholar]


| Geotechnical Type | Area Number of Soil Layer | Length (m) | Thickness (m) | Overburden Layer | Substratum |
|---|---|---|---|---|---|
| Silty clay | K58 + 942 – K59 + 201 | 259.6 | 15.0–16.3 | Plain fill thickness: 3.70–3.80 (m) | Silty clay |
| Strongly weathered granite and silty sand | K58 + 942 – K59 + 201 | 259.6 | 4.5–4.8 | Plain fill, silt, muddy silty clay, and silty clay 20.7–22.6 (m) | Fine sand, gravelly sand |
| Soil Layer | Thickness (m) | Saturated Bulk Density (kN/m3) | Compression Modulus (Mpa) | Poisson’s Ratio | Cohesion (kPa) | Internal Friction Angle (°) |
|---|---|---|---|---|---|---|
| Embankment soil | 3.5 | 18 | 18 | 0.2 | 15 | 20 |
| Muddy silty clay | 11 | 16.6 | 9.65 | 0.3 | 13 | 16.2 |
| Silt | 9 | 15.4 | 6.12 | 0.35 | 10 | 7 |
| Medium sand and silt | 10 | 22.5 | 20 | 0.15 | 39 | 22 |
| Material | Type and Shape | Diameter/Thickness (m) | Unit Weight (kN/m3) | Elastic Modulus (Gpa) | Compression Modulus (Mpa) | Poisson’s Ratio | Tensile Stiffness (kN/m) |
|---|---|---|---|---|---|---|---|
| Pile | Cylindrical | 0.3 | 24 | 50 | / | 0.1 | / |
| Pile cap | Square | 0.4 | 24 | 24 | / | 0.1 | / |
| GR | Geogrid/geocell | 0.5 | 19 | / | 20 | 0.2 | 1000 |
| No. | Location Number of Monitoring Area | Length (m) | Filling Height (m) | Pile and Pile Cap(m) | GR | |||
|---|---|---|---|---|---|---|---|---|
| Pile Spacing | Pile Cap | Clear Spacing | Type | Layers | ||||
| 1 | K58 + 940 – K58+970 | 30 | 4.0 | 3.0 | 1.0 | 2.0 | Geogrid | 3 |
| 2 | K58 + 970 – K59 + 100 | 30 | 4.0 | 3.0 | 1.2 | 1.8 | Geogrid | 2 |
| 3 | K59 + 000 – K59 + 030 | 30 | 4.0 | 3.0 | 1.2 | 1.6 | Geogrid | 2 |
| 4 | K59 + 030 – K59 + 060 | 30 | 3.0 | 3.0 | 1.6 | 1.4 | Geogrid | 1 |
| 5 | K59 + 060 – K59 + 080 | 20 | 3.0 | 3.0 | 1.6 | 1.4 | Geocell | 1 |
| 6 | K59 + 080 – K59 + 100 | 20 | 3.0 | 3.0 | 1.6 | 1.4 | Geocell | 1 |
| Cases | Pile Spacing (m) | Number of Piles | Pile Cap Size (m) | Cushion Thickness (m) | GR Tensile Stiffness (kN/m) |
|---|---|---|---|---|---|
| Control | 3 | 60 | 1 × 1 | 0.5 | 1000 |
| Scheme 1 | 2.5 | 84 | 0.5 × 0.5 | 0.4 | 500 |
| Scheme 2 | 3.5 | 45 | 1.5 × 1.5 | 0.6 | 1500 |
| Variable | Initial Cost (CNY) | Cost of Comparison Scheme (CNY) | Change in Cost (CNY) | Initial Displacement (mm) | Displacement of Comparison Scheme (mm) | Change in Displacement (mm) | Cost Influence Coefficient |
|---|---|---|---|---|---|---|---|
| Pile spacing (m) | 218,760 | 284,280 | 65,520 | 29.28 | 19.215 | −10.065 | 0.628 |
| Pile cap size (m) | 218,760 | 213,924 | −4836 | 29.28 | 48.555 | 19.275 | 0.024 |
| Cushion thickness (m) | 218,760 | 210,120 | −8640 | 29.28 | 32 | 2.72 | 0.307 |
| GR tensile stiffness (kN/m) | 218,760 | 217,680 | −1080 | 29.28 | 31.83 | 2.55 | 0.041 |
| Variable | Initial Cost (CNY) | Cost of Comparison Scheme (CNY) | Change in Cost (CNY) | Initial Displacement (mm) | Displacement of Comparison Scheme (mm) | Change in Displacement (mm) | Cost Influence Coefficient |
|---|---|---|---|---|---|---|---|
| Pile spacing (m) | 218,760 | 177,810 | −40,950 | 29.28 | 52.5 | 23.22 | 0.300 |
| Pile cap size (m) | 218,760 | 223,875 | 5115 | 29.28 | 13.08 | −16.2 | 0.050 |
| Cushion thickness (m) | 218,760 | 227,400 | 8640 | 29.28 | 27 | −2.28 | 0.601 |
| GR tensile stiffness (kN/m) | 218,760 | 219,840 | 1080 | 29.28 | 26.805 | −2.475 | 0.069 |
| Pile Spacing | 2 | 2.5 | 3 | 3.5 | 4 | 4.5 |
|---|---|---|---|---|---|---|
| Number of piles in triangle net arrangement | 135 | 84 | 60 | 45 | 40 | 28 |
| Number of piles in square arrangement | 153 | 98 | 66 | 45 | 41 | 32 |
| Pile Spacing (m) | Pile Cap Size (m) | GR Tensile Stiffness (kN/m) | Layers/Construction Method | Cushion Thickness (m) | Pile Arrangement | Cost (CNY) | |
|---|---|---|---|---|---|---|---|
| Before optimization | 3 | 1 | 1000 | 1-layer geogrid | 0.5 | Square | 218,760 |
| After optimization | 3.5 | 1.5 | 1000 | New method geocell | 0.4 | triangle net | 163,089 |
Publisher’s Note: MDPI stays neutral with regard to jurisdictional claims in published maps and institutional affiliations. |
© 2022 by the authors. Licensee MDPI, Basel, Switzerland. This article is an open access article distributed under the terms and conditions of the Creative Commons Attribution (CC BY) license (https://creativecommons.org/licenses/by/4.0/).
Share and Cite
Zhang, A.; Liao, J.; Liu, Z.; Zhou, C.; Zhang, L. Optimized Design of Piled Embankment Using a Multi-Effect Coupling Model on a Coastal Highway. J. Mar. Sci. Eng. 2022, 10, 1170. https://doi.org/10.3390/jmse10091170
Zhang A, Liao J, Liu Z, Zhou C, Zhang L. Optimized Design of Piled Embankment Using a Multi-Effect Coupling Model on a Coastal Highway. Journal of Marine Science and Engineering. 2022; 10(9):1170. https://doi.org/10.3390/jmse10091170
Chicago/Turabian StyleZhang, Aobo, Jin Liao, Zhen Liu, Cuiying Zhou, and Lihai Zhang. 2022. "Optimized Design of Piled Embankment Using a Multi-Effect Coupling Model on a Coastal Highway" Journal of Marine Science and Engineering 10, no. 9: 1170. https://doi.org/10.3390/jmse10091170