Abstract
The spatial extent of a dual-frequency echosounder and its potential impact on cetacean species were examined. Sound emissions of output frequencies of 83 kHz and 200 kHz were tested at a maximum distance of 400 m. This is the minimum vessel approach distance for killer whales (Orcinus orca) in southern British Columbia, which was introduced as a measure for limiting disturbance of southern resident killer whales (SRKWs). The experiment was conducted in shallow (34 m) and deep (220–235 m) water. Recordings were made at depths of 5 and 30 m for both locations, as well as at 100 and 200 m in the deeper water to examine the effect of the echosounder through the water column and at SRKW diving depths. The recordings showed that 200 kHz echosounder emissions were contained within a 250 m radius of the source, with most of the acoustic energy focused within 100 m in shallow waters. For the 83 kHz signal and for deeper water testing of the 200 kHz signal, the echosounder transmissions exceeded the 400 m threshold, intimating that whales could experience noise additions of 30 dB or more above the ambient level at the minimum vessel approach distance. Evaluating the noise additions to the ambient level from the echosounder in frequencies used by SRKWs for echolocation (15–100 kHz) further showed the potential impact on whales in close proximity to vessels (≤400 m) when using echosounders or fish-finders.
1. Introduction
The use of single- and multibeam echosounders is widespread. Their applications include navigation, hydrography, sea-floor mapping, commercial and recreational fishing, geophysical exploration, and scientific research [1,2,3,4,5]. These instruments employ frequencies from 10 kHz up to several hundred kHz or even 1 MHz [6], emitting pulses with lengths in the order of micro- to milliseconds. Short, intense pulses are typically focused vertically to locate and discern targets below the vessel. The reflected acoustic energy is processed as a function of time to produce high-resolution image outputs.
As the use of these systems has increased, so has the concern regarding their impact on marine mammals. Their high frequencies, short signal times, and narrow downward-transmitting lobes suggest that the impact could be minimal, but still present if whales are in the immediate vicinity or within a range of up to several hundred meters [7,8,9]. Typically, the area of impact is estimated based on spherical propagation models and linear absorption in seawater [6,10,11,12,13]. However, it is also dependent on the source power, frequency, signal duration, repetition rate, and transducer directionality.
Echosounder pulses have the potential to alter diving and acoustic behaviors and mask signals. Earlier research has focused on the use of mid-frequency (1–10 kHz) active sonar on odontocetes [14,15,16,17,18,19] after several mass stranding events followed naval exercises [20,21,22,23]. More recently, the influence of high-frequency (>10 kHz) and multi-beam echosounders on cetaceans has been examined [24,25,26,27,28]. Again, the focus has been on toothed whales, as the operational frequencies of the systems overlap with the frequency range in which their hearing is most sensitive (10–150 kHz; [28,29]). These studies focused on the systems used with research, commercial, or defense applications, whereas little work has been done to consider commercially available echosounders (‘depth sounders’ or ‘fish finders’) and their use on recreational or tourism vessels.
The potential for active acoustic systems to mask signals used for animal communication and foraging has led to the recommendation for vessels in the proximity of endangered southern resident killer whales (Orcinus orca; SRKWs) to turn off echosounders to limit disturbances [30]. Commercially available systems typically emit signals with high source levels, up to as much as 230 dB re 1 µPa m [25,29], and frequency ranges of 12–400 kHz. This range encompasses the frequency range over which SRKWs’ echolocation clicks are produced (15–100 kHz; [31,32]), as well as those of other coastal odontocete species [33,34,35]. In shallower coastal waters, where these systems are most commonly used, bathymetry and seabed characteristics can influence the propagation of the pulses due to reflections, scattering, and attenuation at the seabed/water interface [36]. These are also the areas in which SRKWs are most frequently observed while foraging [37,38,39].
Here, we experimentally measured the radiation characteristics of commercially available echosounders used by small recreational vessels. We quantified the acoustic footprint over which 83 and 200 kHz pulses add to ambient sound levels in both shallow and deep water. We then discuss the potential impacts that these signals could have on marine mammals, especially SRKWs, adding to what was reported by Holt et al. [40]. The ensonification levels at the minimum vessel approach distances to marine mammals in Canada [30] will be determined at a range of depths to replicate the levels that may be received by whales diving in proximity to a vessel.
2. Materials and Methods
2.1. Study Site
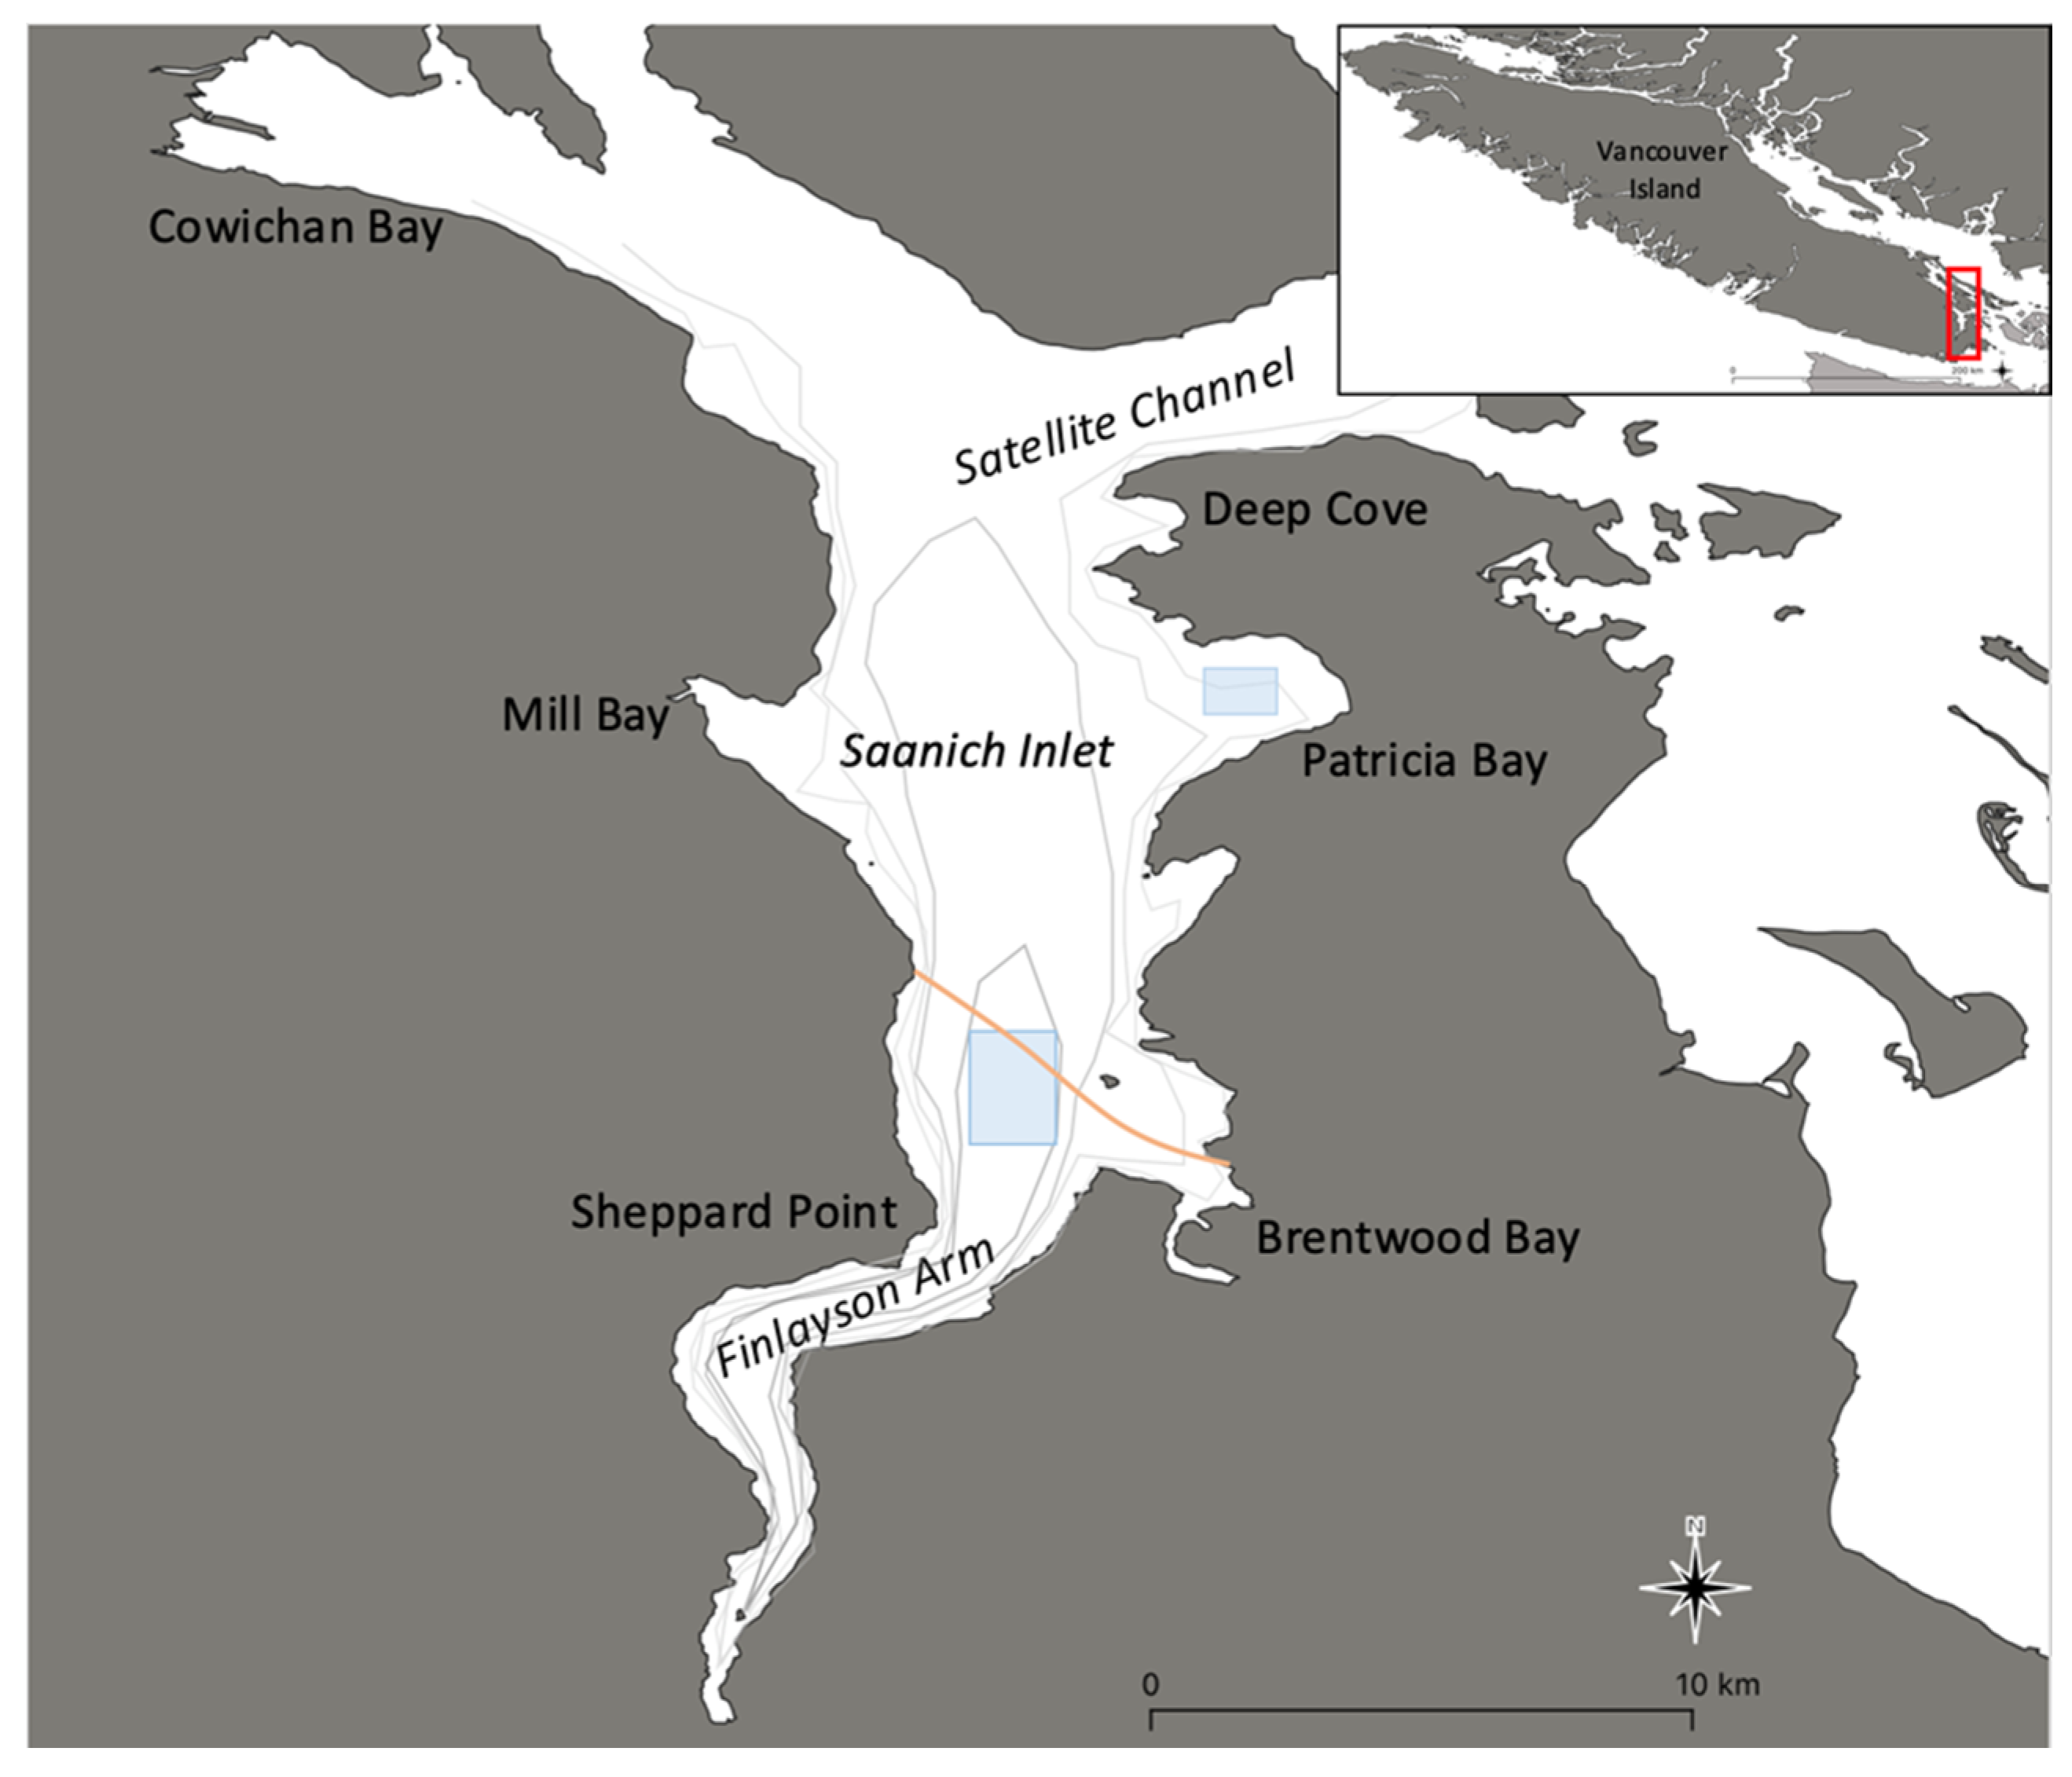
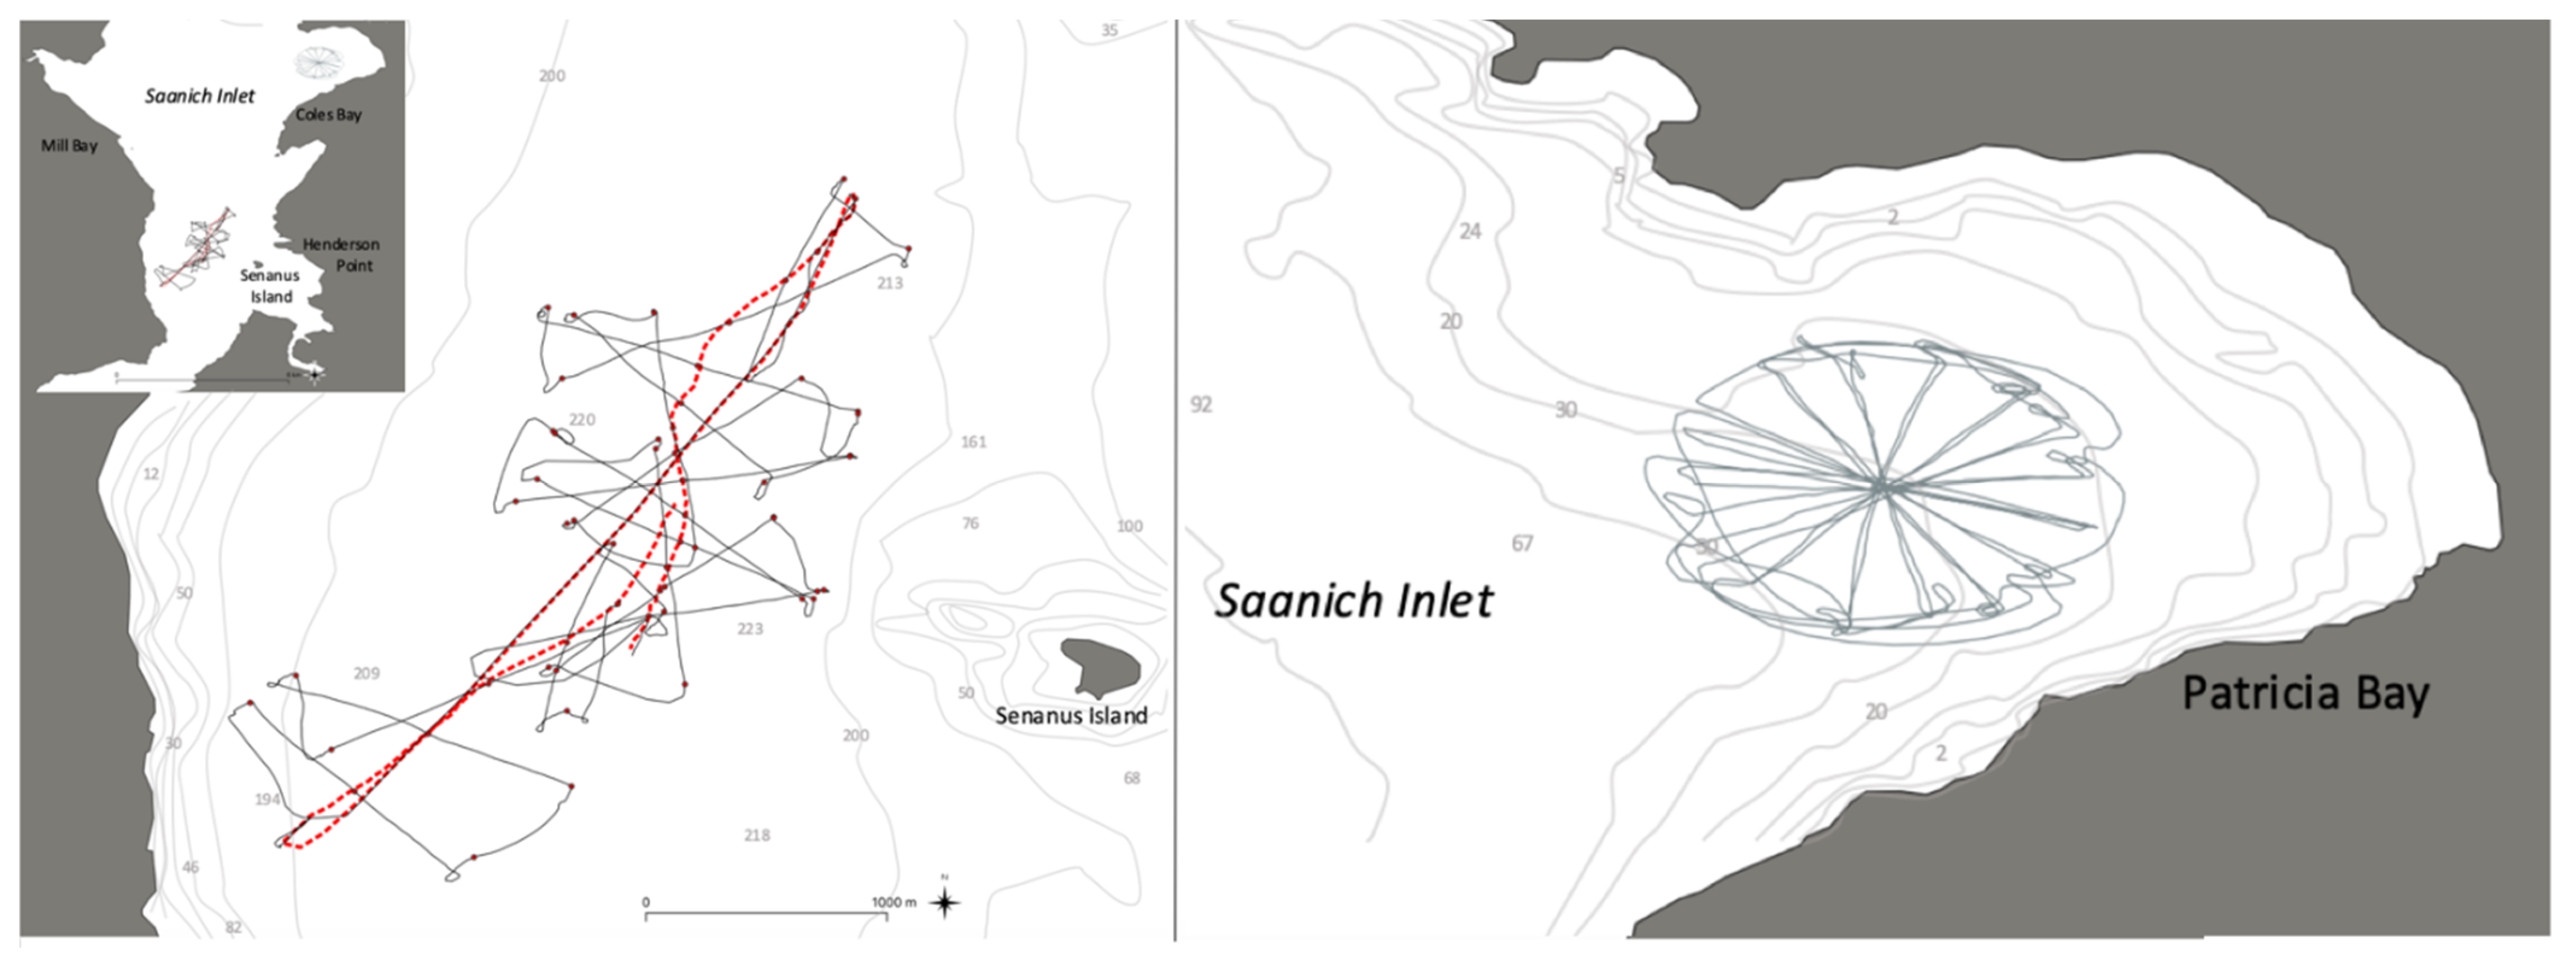
Saanich Inlet, south-east Vancouver Island, British Columbia (BC) is a 24 km glacially carved fjord between Brentwood Bay and Sheppard Point with a maximum depth of approximately 234 m. The inlet extends from Satellite Channel in the north to Finlayson Arm in the south (Figure 1). The bottom is predominantly composed of sand and mud. A shallow sill (~70 m) at the northern end of the inlet and at the eastern branch of Satellite Channel restricts the movement of deep water in and out of the inlet. Wind and tidal forces are weak in the inlet and are less evident at depth. Temperatures are nearly constant throughout the year below 150 m (7.9–9.1 °C [41]). Freshwater run-off into the inlet is negligible and only influential for the upper 10 m; this freshwater supply is greater outside the inlet mouth, creating an inverse estuary [41,42]. Locations in the main arm of the inlet and a side bay, Patricia Bay (maximum depth: 36 m, Figure 1), were used to replicate the coastal oceanic settings in and around the Salish Sea where SRKWs are observed. The location was chosen for the experimental work to be away from areas known for frequent occurrences of SRKWs and the potential confounding impacts of higher vessel traffic loads present in other regions in the Salish Sea.
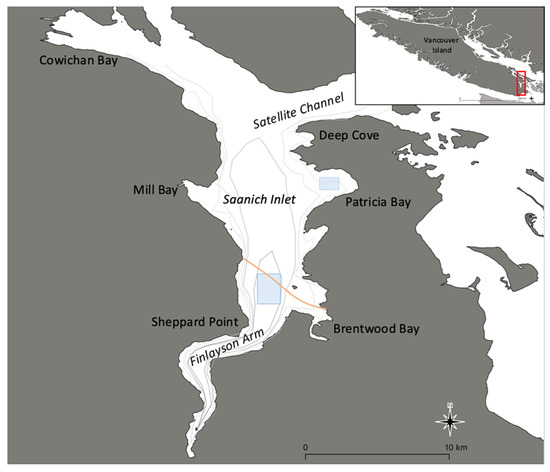
Figure 1.
Study area on Vancouver Island outlined in red on the inset map. The areas used for shallow-water transects completed in Patricia Bay, and the deep-water transects in Saanich Inlet, approximately between Sheppard Point and Senanus Island are shown (blue shaded areas). The Mill Bay–Brentwood Bay ferry route is marked in orange.
2.2. Active Acoustic Sound Source and Passive Acoustic Recordings
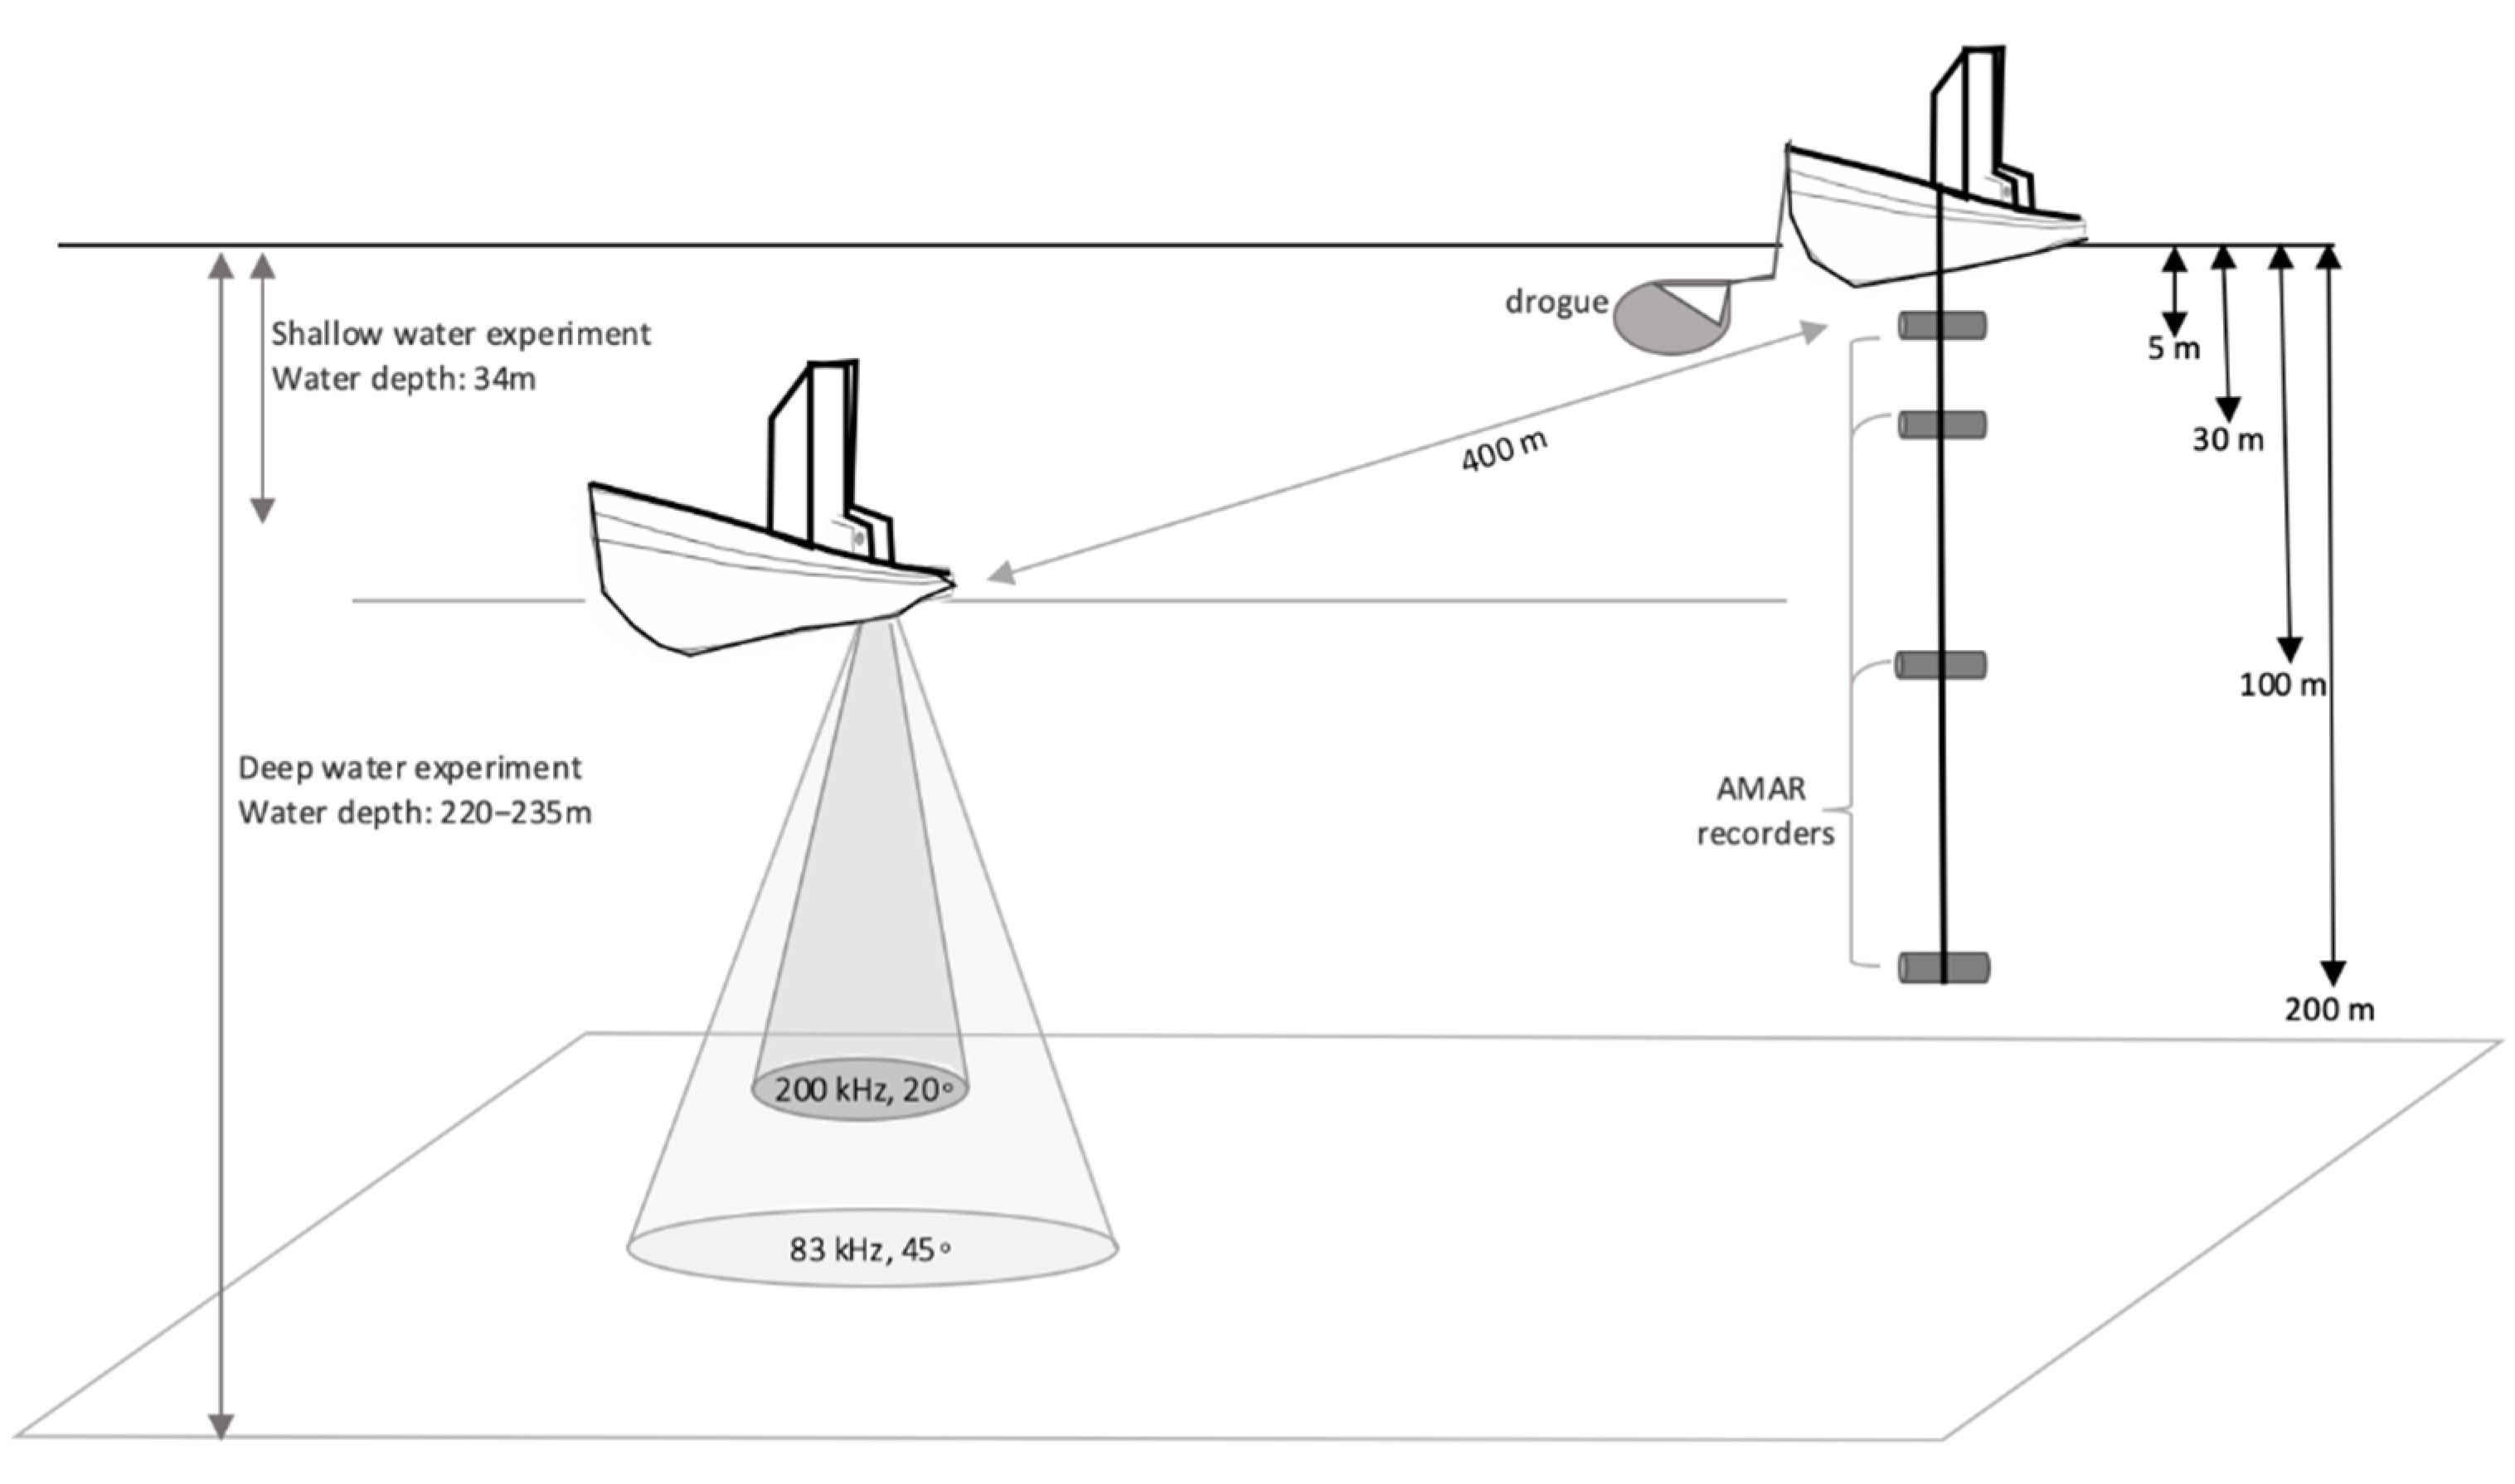
Two 6.7 m research vessels (a recording and a source vessel) were used to take measurements that aided the experimental derivation of the propagation of the echosounder pulses. The source vessel was a rigid-hull inflatable boat (RHIB) with a Lowrance dual-frequency echosounder mounted at a depth of 0.3 m at the stern. The manufacturer information stated that the echosounder delivered signals at 83 and 200 kHz with nominal beams of 45° and 20°, respectively (Lowrance 83/200 HDI Skimmer chirp sonar; Figure 2). Recordings were made using autonomous multichannel acoustic recorders (AMARs, JASCO Applied Sciences, G4, equipped with GeoSpectrum Technologies M36–100 hydrophones) suspended from the recording research vessel (Figure 2). The AMAR systems were calibrated by the manufacturer from 100 to 250 kHz, and then again at 250 Hz prior to use in the experiment. Recordings were made continuously at a sample rate of 512 kHz with 24-bit resolution and stored on internal SD memory cards as five-minute wav files.
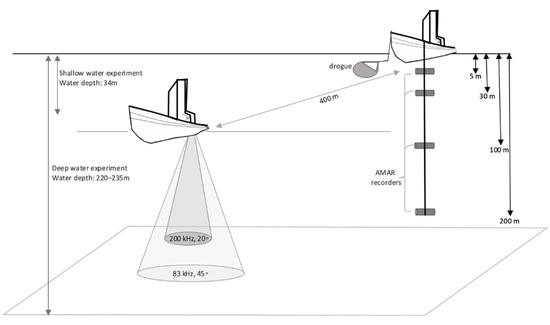
Figure 2.
Experimental set-up for the deep-water (220–235 m depth) surveys with four AMARs suspended from the recording vessel and with the source vessel completing transects with either the 200 or 83 kHz signal at a maximum distance of 400 m. In shallower water (34 m depth), the recording vessel was anchored instead of using the drogue shown in the figure.
2.3. Experimental Design and Implementation
Transect lines were run by the source vessel on cardinal headings approximately every 22.5° to a distance of at least 400 m from the recording vessel (Figure 2) with the recording vessel at the center of the compass rose. Distances between the two vessels were measured by the source vessel using automatic identification system (AIS) transmissions from the recording vessel relative to its own location. The closest points of approach were when the vessels were directly side by side or passing across the bow or stern. The 400 m distance between the source and recorder was chosen to represent the interim action implemented by Transport Canada under the Canadian Shipping Act, which sets this distance as the minimum distance of approach to killer whales in southern BC waters; this was implemented as a protection measure for southern resident killer whales [43]. The source vessel’s speed was maintained below 4 kmh−1 to reduce vessel-related noise, including noise from cavitation. It was assumed that the sonar pulses were made at a stable rate throughout (0.01 s pulse, 9 pulses/sec for 200 kHz, 0.02 s pulse, 6 pulses/sec for 83 kHz). The source vessel ended each of the 22.5° lines by remaining stationary, with the engines off, for two minutes to better isolate the echosounder inputs at the maximum distance between the source and receiver.
In the shallow-water setting in Patricia Bay, recordings of a 200 kHz echosounder were made by an AMAR deployed first at a depth of 5 m on 14 July 2021 and at 30 m on 16 July 2021. The experiment was repeated on 25 August 2021 when the source signal was 83 kHz, and both 5 and 30 m were measured simultaneously using two AMAR instruments. The recording vessel was anchored in 34 m of water. On 1 September 2021, four AMARs were suspended together on a single line from the recording vessel at 5, 30, 100, and 200 m in 220–235 m of water. The recording vessel was unanchored, with the drift being minimized by deploying a drogue (Figure 2). The locations of the recording and source vessels were recorded every 10 s using the vessels’ GPS receivers. The recording depths were selected to represent SRKWs’ swimming and diving depths; the upper water column recorders (5, 30 m) were at typical travel and prey-searching depths [44,45,46,47,48], with dives less than 30 m unlikely to involve prey pursuit [38]. The 100 m recorder represented the maximum depths that SRKWs will repeatedly dive to forage, and 200 m was used to reflect the deeper dive limits of SRKWs recorded using animal-borne biologging sensors [45,47,48].
2.4. Acoustic Analysis
The acoustic files were post-processed in Python using custom scripts that were modified from those described by Merchant et al. [49]. Power spectra (a signal for each 1-Hz frequency) were calculated every 1 s and averaged over 60 s using a 1 s Hanning window, a 50% overlap, and Welch’s averaging. Analyses focused on the sound levels at −6 dB bandwidths centered around the peak frequencies of the 83 and 200 kHz signals and the sound pressure levels (SPL, dB re 1 μPa) received in these bands. Additionally, a 1-kHz band centered around 50 kHz was also examined, as this frequency has been used to acoustically track recreational vessels in the Salish Sea [50,51]. To estimate the potential masking effect on SRKWs, echosounder emissions in the SRKW echolocation (15–100 kHz; [32]) frequency ranges were also examined.
Comparisons of sound levels between depths over the various distances and directions between the recording and source vessels were made to describe the vertical and horizontal aspects of each radial experimental set. The received SPL at each recorder was matched to the GPS location of the source vessel for every minute of recording to describe the spatial propagation pattern using the relative north–south and east–west distance between the vessels to examine the echosounder signal’s extent.
A received level of 80 dB re 1 μPa represents the approximate hearing threshold of killer whales at 80 kHz, as determined by Branstetter et al. ([52]; 72 ± 13 dB re 1 μPa). It was also experimentally determined to be the pure-tone hearing threshold for bottlenose dolphins (Tursiops truncatus, [53]) and is sufficient to be ‘clearly audible’ and elicit avoidance responses in harbor porpoises (Phocoena phocoena) for high-frequency signals [54,55]. In addition, odontocetes have shown acoustic sensitivity to sounds exceeding 110 dB re 1 μPa; sounds of this level are at the highest and lowest frequency extremes of killer whales’ hearing capabilities [52,56], and such sounds were determined to represent an exposure level between ‘clearly audible’ (80 dB re 1 μPa) and ‘severe discomfort’ (125 dB re 1 μPa) for harbor porpoises [55].
2.5. Water Properties and Environmental Conditions
Profiles of water conductivity and temperature as a function of depth (CTD) were collected to examine if variation in the spatial extent of the echosounder signals, if seen, was a result of variability in water properties. An RBR CTD logger was used to make casts at the end of each 22.5° transect in the shallow-water setting and at the end of every 45° line in deeper water. Hand casts were made, allowing the CTD to fall at an approximate rate of 0.5 ms−1 to the full depth of the water column (34 or 225 m), followed by retrieval. Wind speeds (average and gusting maximum) were recorded at the ends of each of the 22.5° transects using a hand-held anemometer (Kestrel 2000 Wind Meter). Experimental recordings were not made in sea states exceeding Beaufort 2. Local wind and weather stations were monitored throughout.
The presence and passage of other vessels were noted throughout the experiment. The distances and speeds of the vessels were quantified from the AIS onboard when possible and estimated with range-finding binoculars for smaller vessels not carrying AIS transceivers.
3. Results
3.1. Acoustic Analysis
The shallow-water transects were centered around the anchored recording vessel, whereas the deep-water transects were centered relative to the drifting recording vessel in water depths varying between 220 and 235 m (Figure 3).
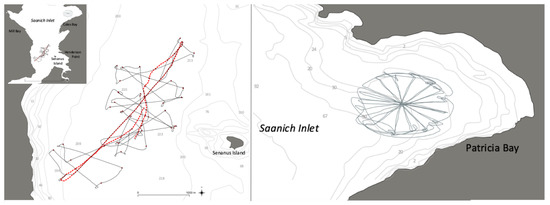
Figure 3.
(Left): Deep-water survey tracks of the source (black line) and recording vessels (dotted red line); (Right): transects of the source vessel in shallow water around the anchored recording vessel in the middle of the transect circle.
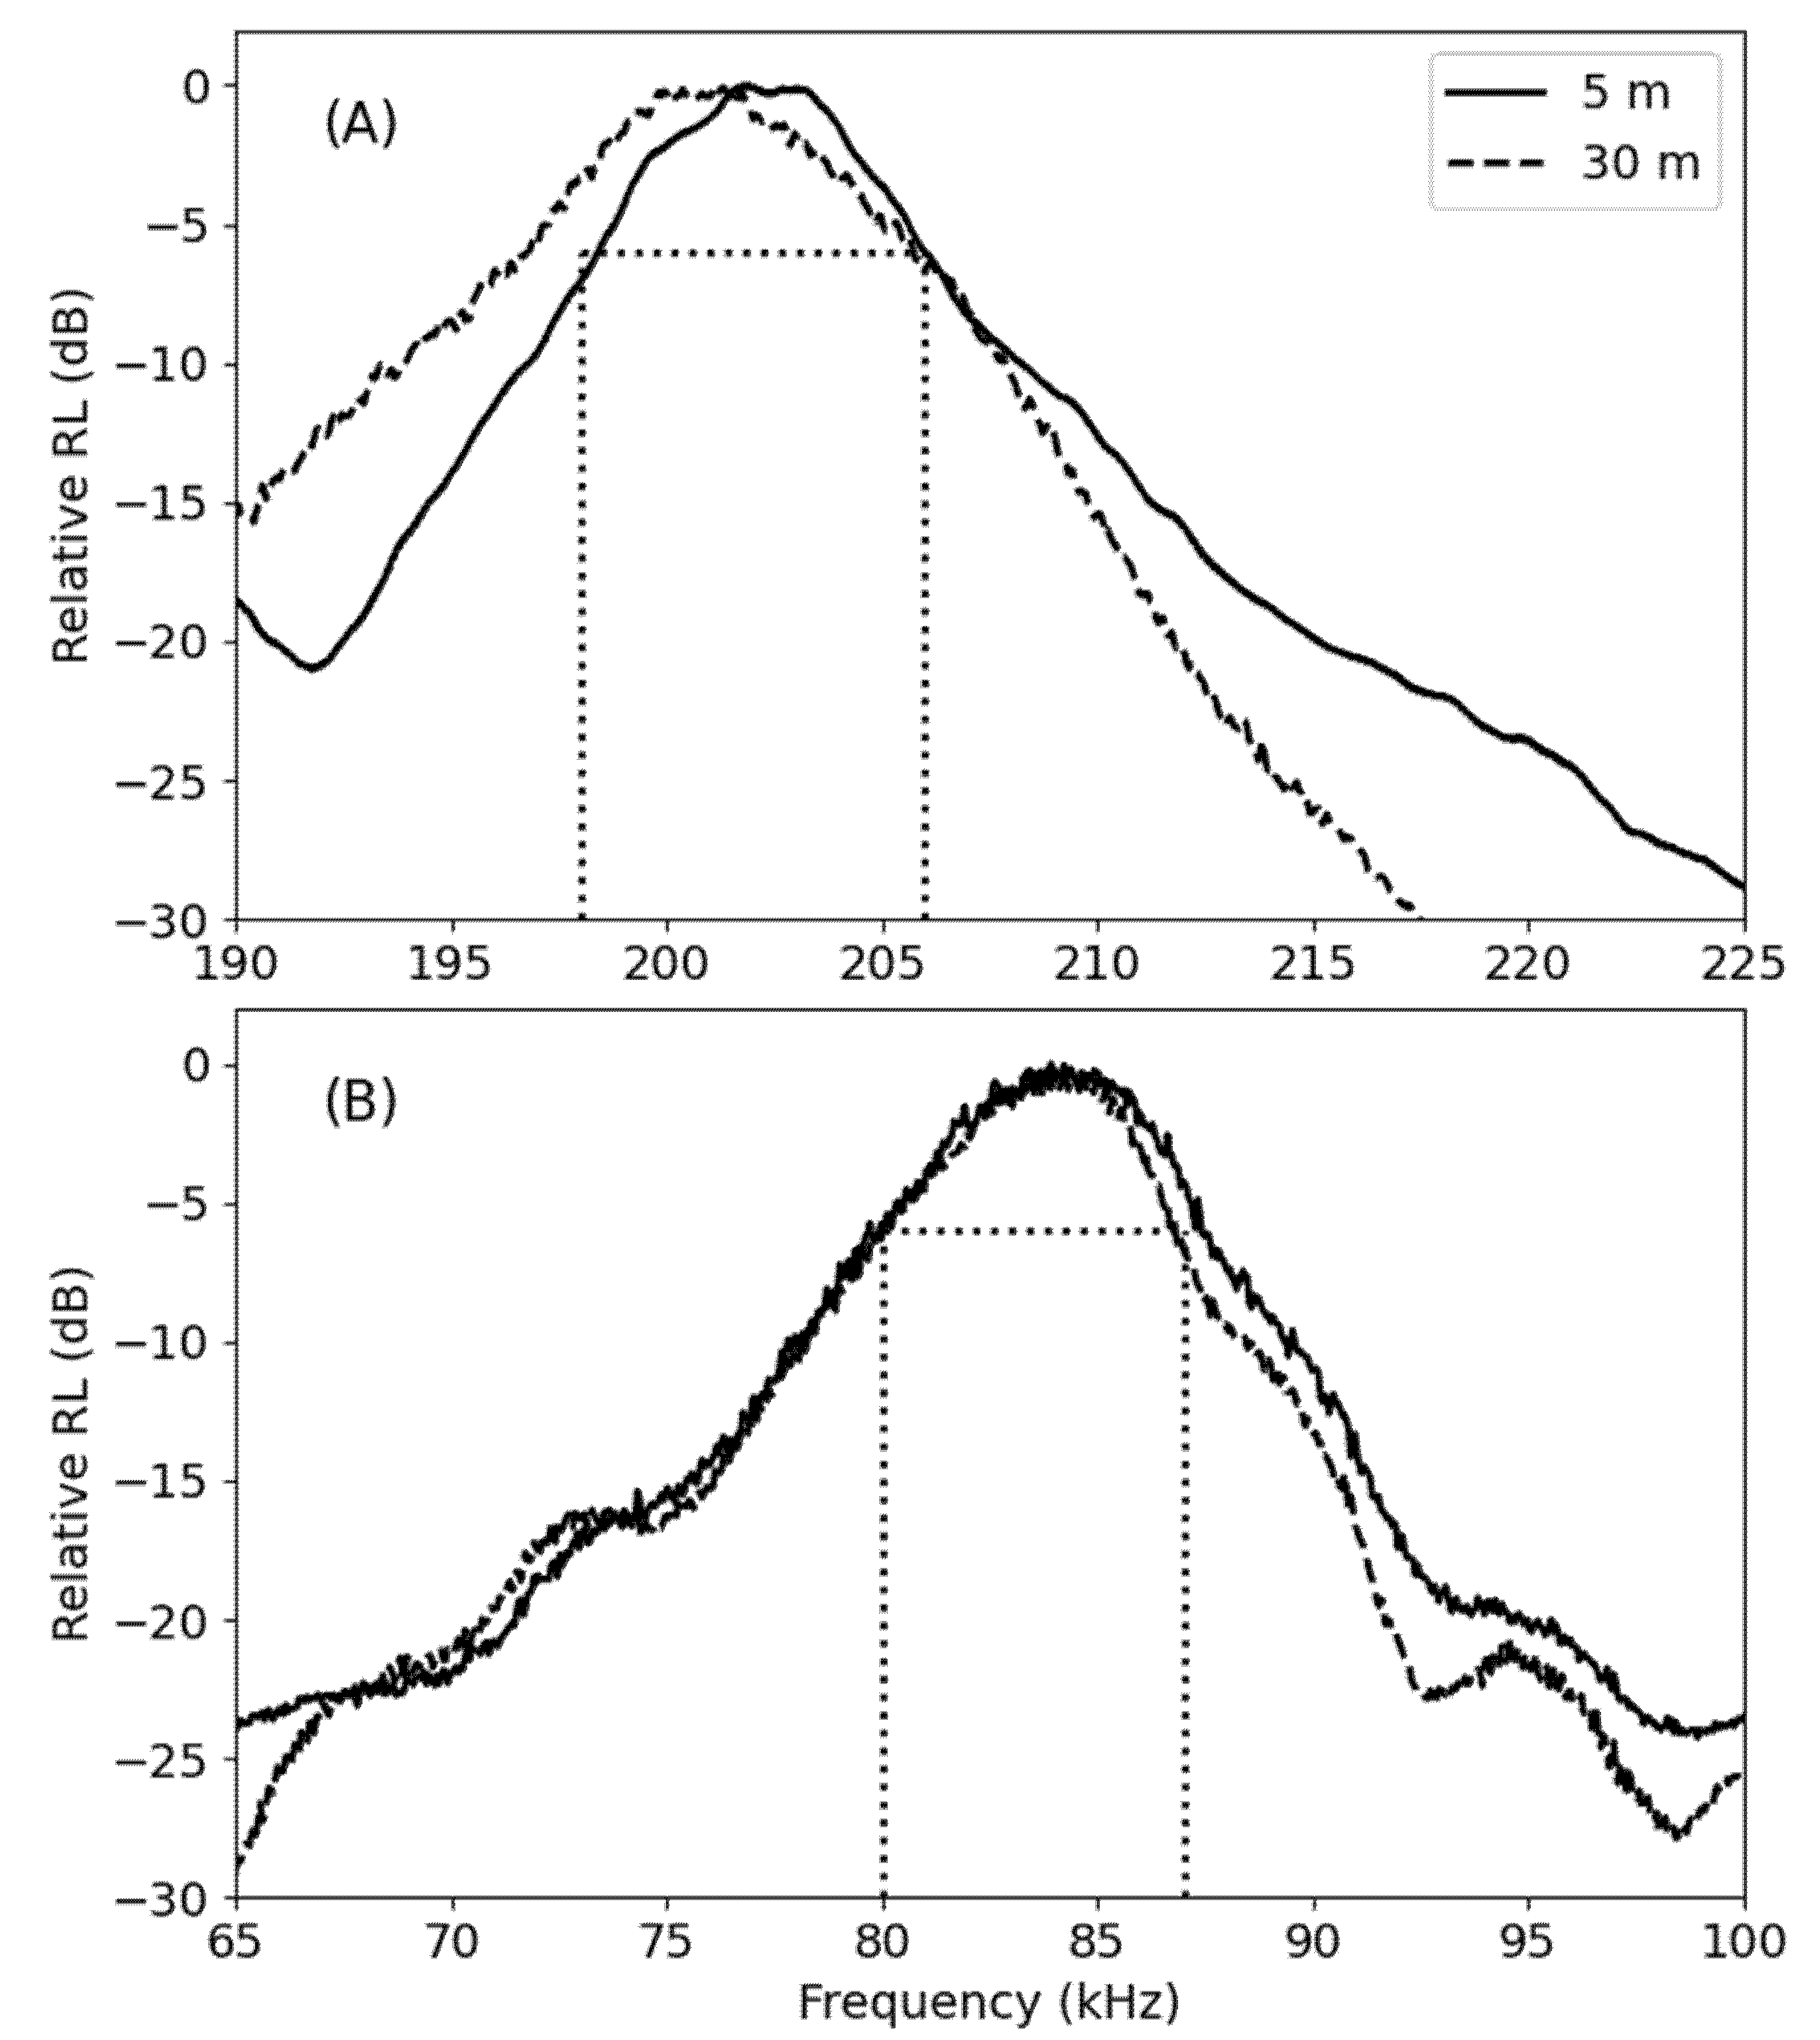
The power spectra of the echosounder pulses as received at depths of 5 and 30 m showed the peak frequencies of the signals to be 84 and 201.5 kHz, rather than the nominal peak power frequencies of 83 and 200 kHz reported by the manufacturer (Figure 4). The corresponding −6 dB bandwidths from the peak frequency were found to be 80–87 and 198–206 kHz for the two echosounder settings (Figure 4), which became the focus of the analysis; however, we will continue to refer to each signal by its nominal value.

Figure 4.
The relative received levels (RLs, in decibels (dB)) of the signals of the acoustic frequency bandwidth of the dual-frequency echosounder used in this study, as observed at two different depths. The dotted lines indicate the −6 dB acoustic bandwidths of 198–206 (A) and 80–87 kHz (B). The peak frequencies of the two channels were found to be 201.5 (A) and 84 kHz (B).
The measured maximum SPLs (maxSPLs) from the recordings at the closest point of approach were determined to be approximately 120 dB re 1 µPa m. This was measured when the vessels were directly side by side, with the distance between the recorders and the echosounder being less than 1 m; this range was considered to be 0 m in this analysis. A received level of −40 dB from the maxSPL of the echosounder (maxSPL −40 dB re 1 m = 80 dB re 1 μPa) was used to represent the hearing sensitivity of killer whales and other toothed whale species to the echosounder emissions. To show the range of potential impacts on odontocete species by the echosounder, a −10 dB level (120 dB re 1 μPa −10 dB re 1 m = 110 dB re 1 μPa) from the measured maxSPL was also considered throughout the analysis.
3.1.1. Shallow Water (34 m)
The recordings from the shallow-water experiments showed that the emissions from the 200 kHz signal did not exceed a 400 m radius. Indeed, the signal added little to the ambient levels beyond 200 m, with the received levels being more than 40 dB below the maximum SPL of the transducer (Figure 5AB). The recordings from the 30 m depth showed a more circular, directionally independent extent than those measured at 5 m. The shallower depth showed a more side-lobed propagation of the transducer. The received levels at 5 m tended to be greater as distances from the source increased and as the water depth gradually decreased towards shore (Figure 5A). The received levels of the 83 kHz signals were considerably greater as the distance from the source increased. The measured additions to the ambient levels from the echosounder signal exceeded the experimental radius of 400 m (Figure 5C,D). The −40 dB range (~80 dB re 1 μPa) varied between 200 and 400 m, with the ranges being greater when the source vessel was in shallower water closer to shore. This created a significant asymmetry in the observed pattern of the received levels at both 5 and 30 m (Figure 5C,D).
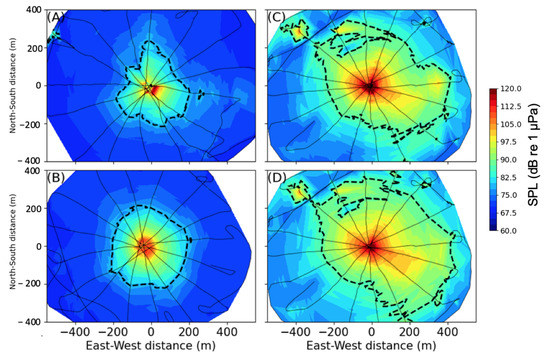
Figure 5.
Received sound pressure levels (SPLs) for the 200 kHz signal (198–206 kHz) at (A) 5 and (B) 30 m and for the 83 kHz signal (80–87 kHz) at (C) 5 and (D) 30 m water depths from the shallow-water transects (black lines). The black dashed lines show the contours at 40 dB below maximum SPL (maxSPL).
3.1.2. Deep Water (220–235 m)
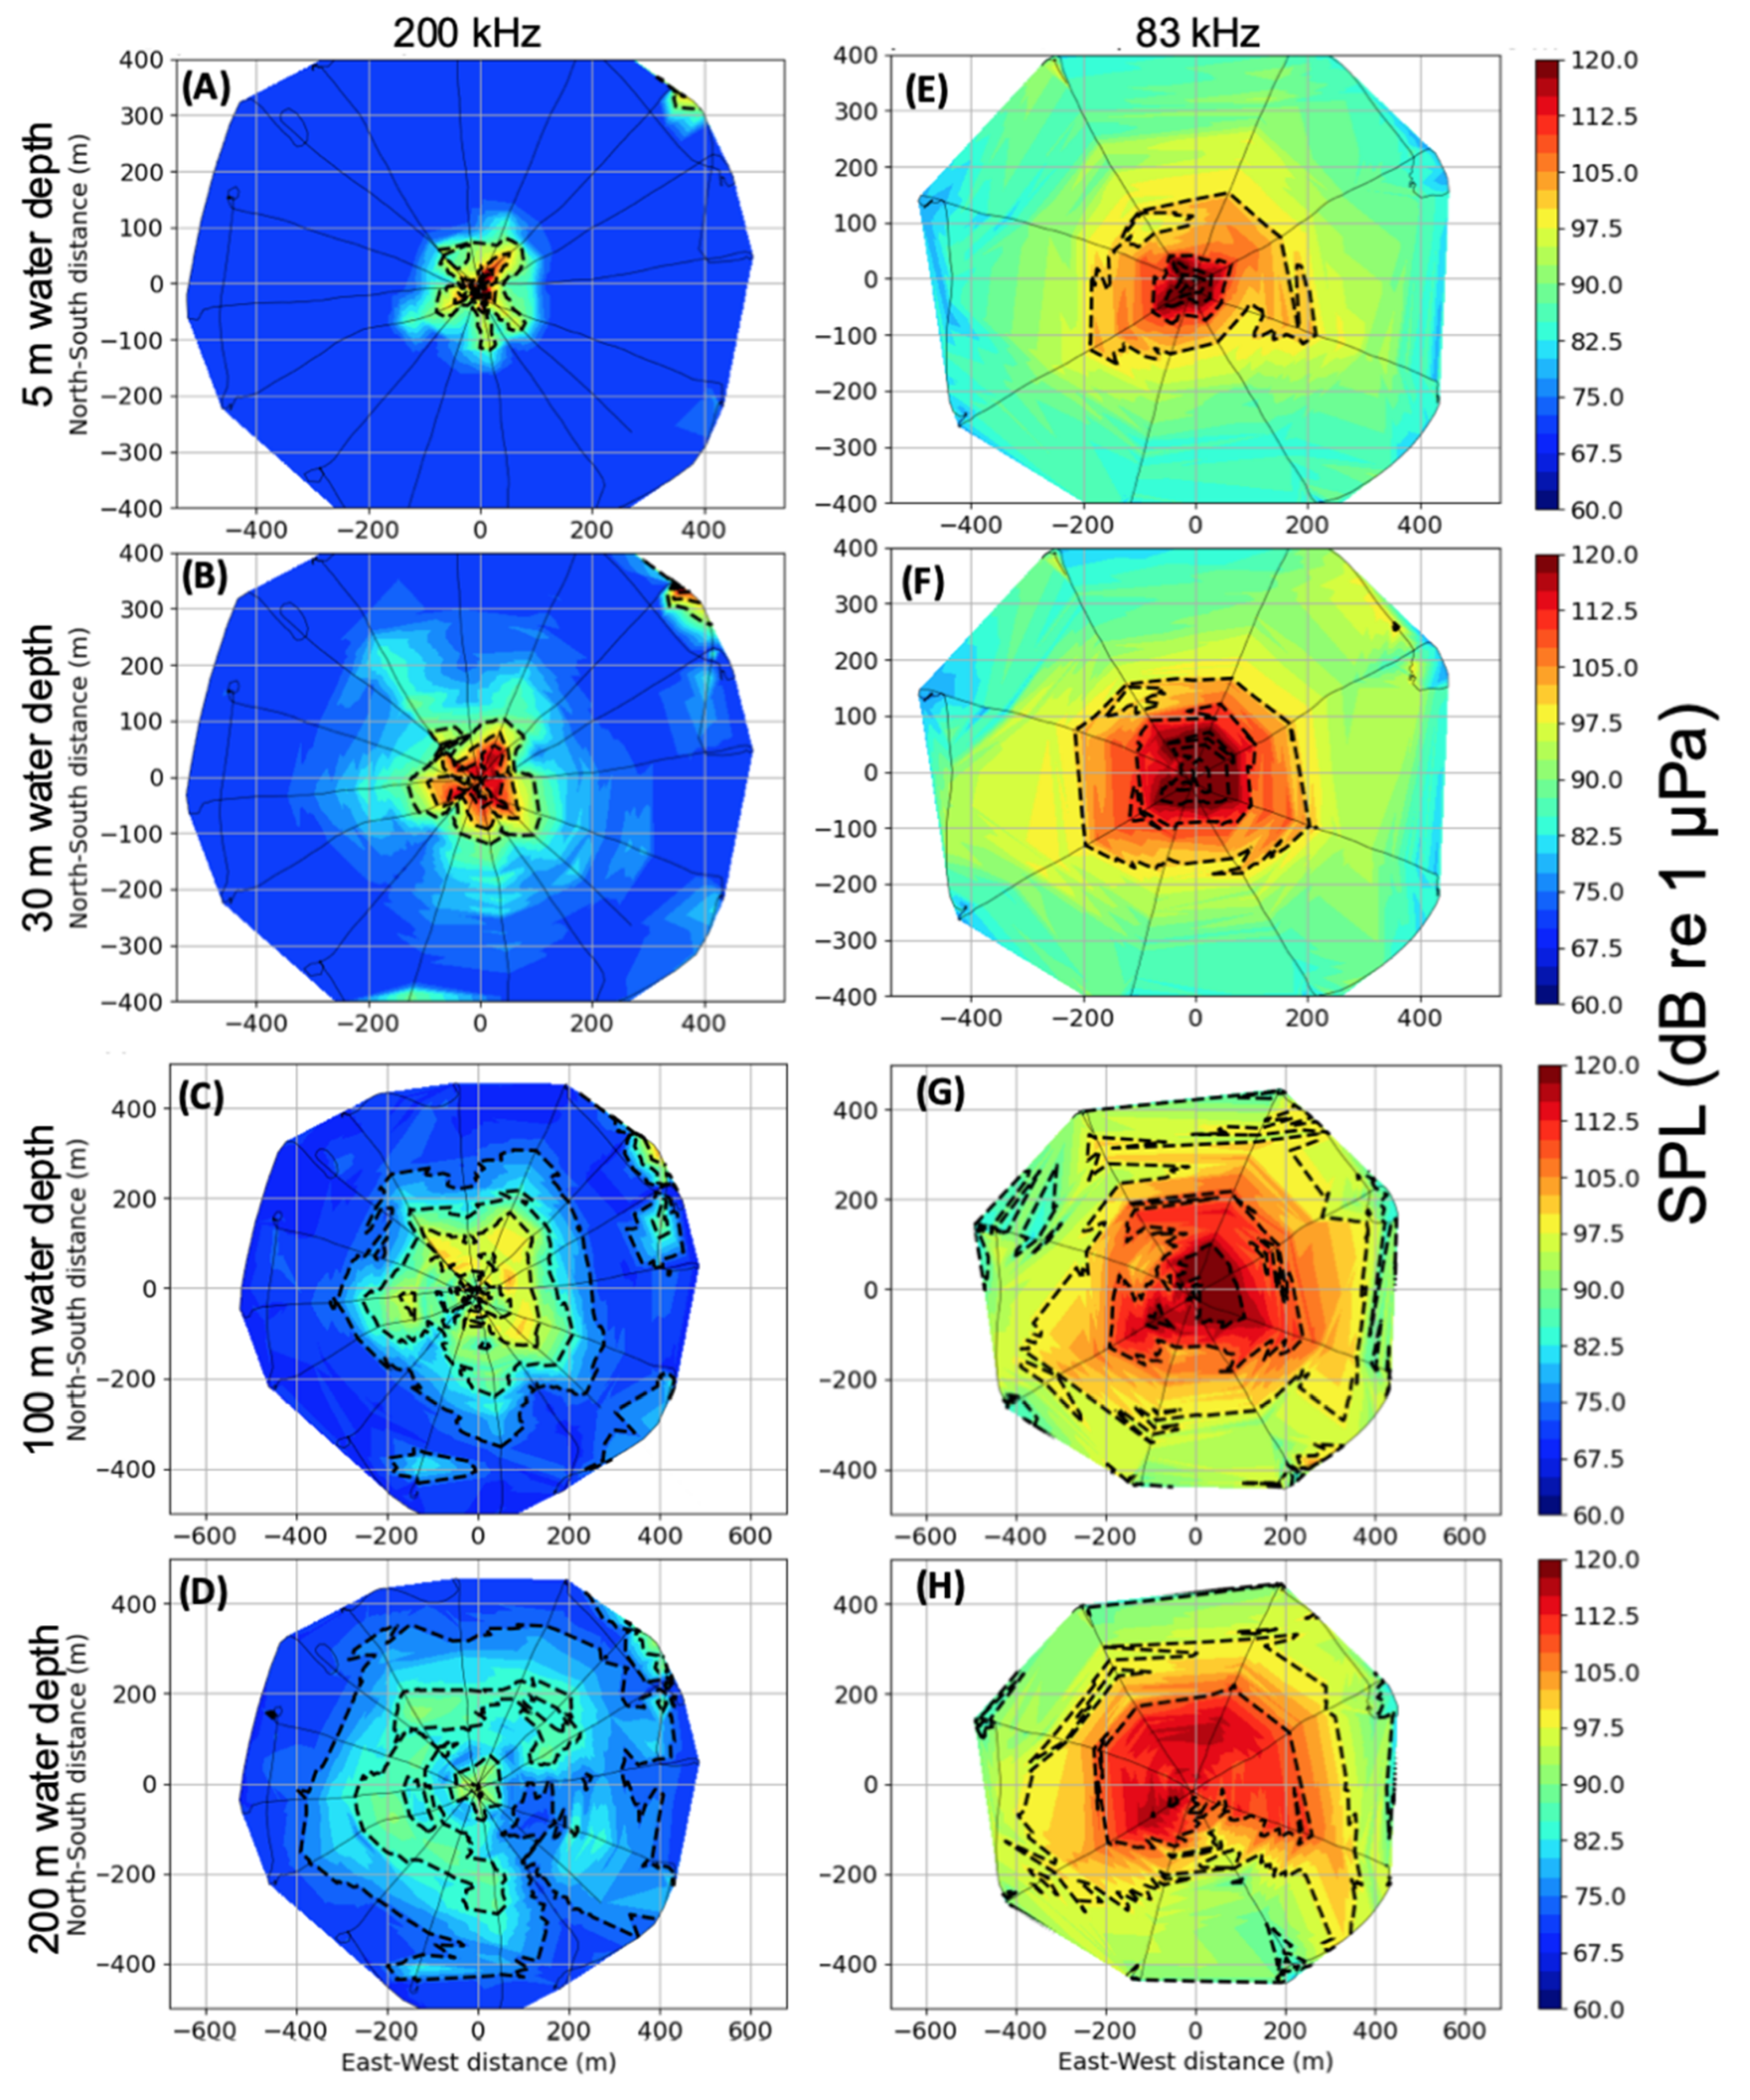
The elevated sound levels from the echosounder emissions were more spatially limited in the upper parts of the deep water than in the shallow-water experimental setting (Figure 6). At a depth of 5 m, there was no detectable signal beyond a source-to-receiver distance of approximately 150 m in the 200 kHz band (198–206 kHz) (Figure 6A). Similarly, the recordings at 30 m did not show any echosounder signals past approximately 350 m from the source (Figure 6B). However, in the 100 and 200 m depth recordings, there were marked azimuthal variations in the received levels (Figure 6C,D). This may have occurred as the recording vessel drifted into shallower waters during the transects. The drift of the recording vessel was, on average, 0.01 ms−1, but at times, it reached 0.5 ms−1, and it was predominantly in a south-westerly direction.
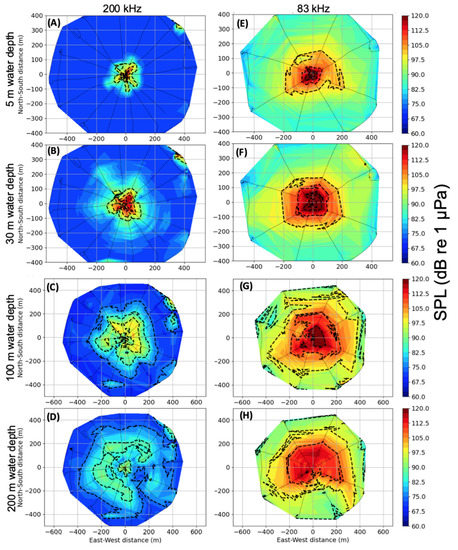
Figure 6.
Received sound pressure levels (SPLs) for the 200 kHz signal (198–206 kHz) at the recorder depths of (A) 5, (B) 30, (C) 100, and (D) 200 m and for the 83 kHz signal (80–87 kHz) at (E) 5, (F) 30, (G) 100, and (H) 200 m from the deep-water transects (black lines). The black dashed lines show the contours of −40 dB below the maximum SPL ((maxSPL) ~80 dB re 1 μPa).
The received levels within the 83 kHz (80–87 kHz) frequency range showed much less azimuthal variability at all four depths (Figure 6E–H). The horizontal detectable extent was also much larger than for the 200 kHz signal. The strongest signals were again seen as the full-water depth was reduced due to vessel drift, from approximately 235 to 220 m of water depth.
The conical shape of the echosounder beam was highlighted even more in the deeper-water transects. The extent of the echosounder signals was estimated as they were projected into the water column by comparing the SPLs received at each of the four recording depths, and that shape mirrored the closest point of approach (CPA), or a range of 0 m. This showed that the radiation patterns were captured by the maximum extent of the transects in the horizontal range (Figure 7). The 200 kHz signal was less attenuated as a function of horizontal range than the 83 kHz signal down to a depth of approximately 100 m, while at greater depths, the 83 kHz signal showed a greater horizontal extent (Figure 7). In both cases, the received levels of the echosounder signals still exceeded 80 dB re 1 μPa (maxSPL—40 dB re 1 m) at 100 m. Killer whales and harbor porpoises have shown acoustic sensitivity to sounds exceeding 110 dB re 1 μPa (−10 dB contour as the maxSPL of 120 dB re 1 µPa m—10 dB is 110 dB re 1 μPa; [52,55]), with emissions at this level being confined to the upper 75 m (Figure 7).
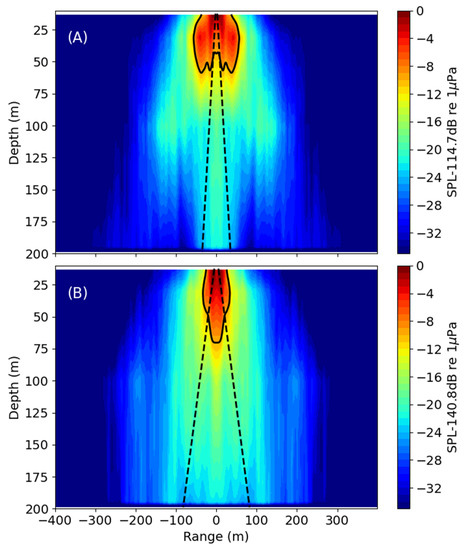
Figure 7.
Received sound pressure levels (SPLs) showing the echosounder signal’s extent over vertical and horizontal space from the nominal (A) 200 kHz (198–206 kHz) and (B) 83 kHz (80–87 kHz) signals in deep water. The dashed black lines indicate the 20° and 45° beam widths for the 200 and 83 kHz channels, respectively. The solid black lines indicate −10 dB from below the maximum measured SPL (maxSPL) (114.7 dB re 1 µPa m for 200 kHz and 140.8 dB re 1 µPa m for 83 kHz) contour, and the dashed lines indicate the −40 dB contour. Please note that the data shown are symmetrical for negative and positive ranges for clarity.
3.2. Water Properties and Environmental Conditions
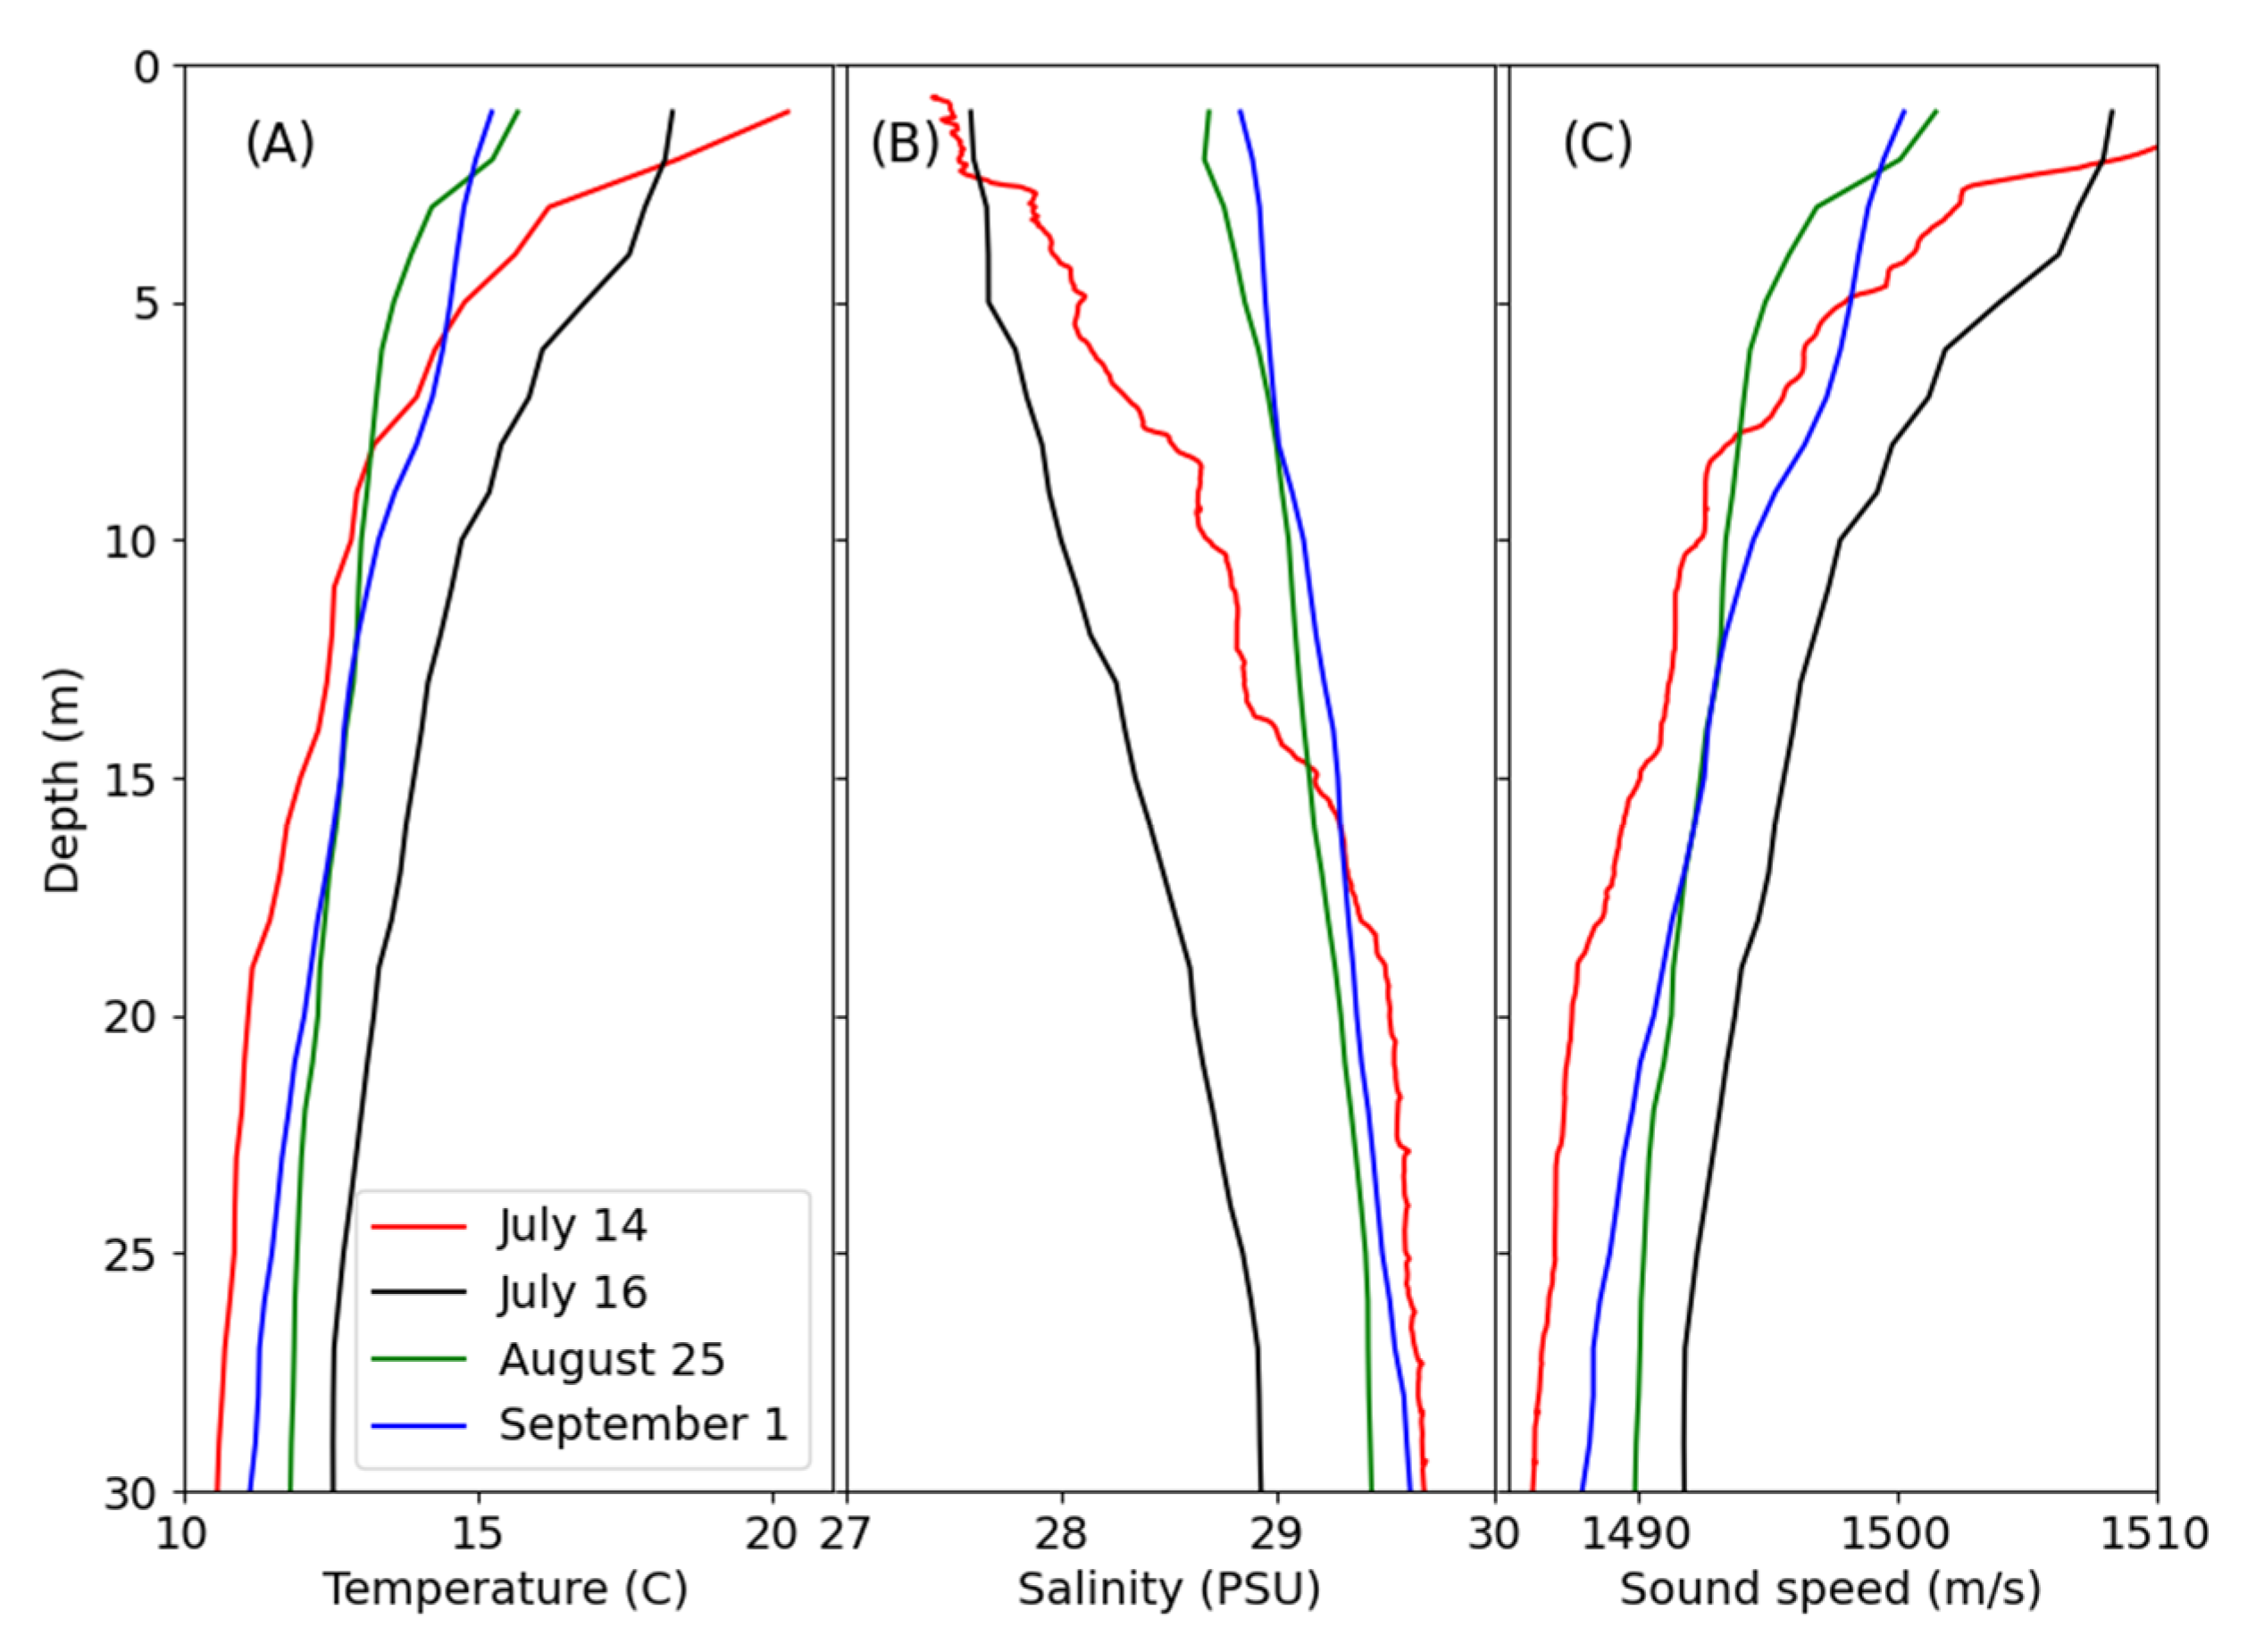
Comparisons of the temperature, salinity, and sound-speed profiles for the three testing days in shallow water (14 July, 16 and 25 August) and the upper water column of the deep-water casts (1 September) showed similarly shaped profiles. Sixteen CTD casts were made on 14 July, 25 August, and 1 September, and 32 were made on 16 July to measure temperature, salinity, and conductivity directly. Sound-speed profiles were calculated using the method of Leroy et al. [57]. A warmer, fresher water layer near the surface resulted in higher sound speeds, therefore generating downward refractive conditions for acoustic signals originating from this upper layer (Figure 8). Differences may have arisen from the different tidal conditions and settings, as the casts from 14 July were made around low slack, those on 16 July were made between the two high slacks of the day, those on 25 August were made on the ebb, and those on 1 September were made in a deep-water setting as the tide flooded (Figure 8).
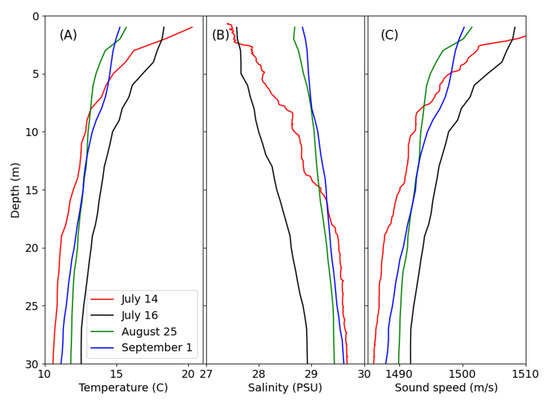
Figure 8.
Temperature (A) and salinity (B) profiles measured during the four experimental periods in 2021. The profiles from 14 July and 16 and 25 August were taken in a shallow-water setting, and that on 1 September was taken in the upper 30 m of the deep-water setting. Sound-speed profiles (C) were calculated using the method of Leroy et al. [57].
The full profiles of the deeper water site taken on 1 September showed that, in addition to the downward refractive conditions near the surface, there was a sound-speed minimum around 100 m, resulting in sound traveling below this depth being refracted upwards. This created conditions for a weak sound channel at this depth (Figure 9).
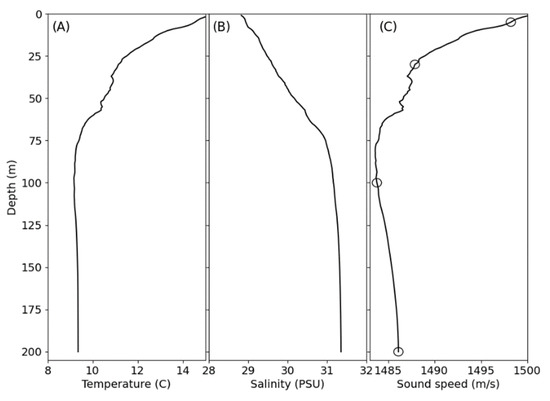
Figure 9.
Temperature (A), salinity (B), and corresponding sound-speed (C) profiles obtained during the study on 1 September 2021 in the middle of Saanich Inlet. The four circles in (C) indicate the depths of the four passive acoustic recorders.
The similarities between CTD profiles for each testing day gave us more confidence in comparing the sound levels and the results of the sound transmissions between days for the shallow-water setting. They also allowed us to center the observations made from the two drift lines in the deep-water setting to consider the relative north–south and east–west distances between the source and receiver and present them as observations in the cardinal directions from a center point, as we did for the shallow-water testing.
Wind speeds were below 5 ms−1 consistently for all testing days, and therefore, it was expected that any acoustic additions to the recordings due to wind or wave noise were negligible. The passage of smaller recreational vessel traffic during the experiments and the half-hourly passage of a ferry between Brentwood Bay and Mill Bay (Figure 1) during the deep-water testing did not influence the signal shape or extent. The time taken for these passages, at speeds at or exceeding 40 kmh−1, was short compared to the time taken for the source vessel to complete a transect—approximately 20 min at an average speed of 4 kmh−1. The higher-frequency component of their vessel noise was unlikely to be represented in the frequency ranges that we examined.
3.3. Impact on SRKWs
Acoustic additions to ambient conditions were seen during trials of both echosounder frequencies in the SRKW echolocation (15–100 kHz) frequency range in both shallow (Figure 10) and deep water (Figure 11).
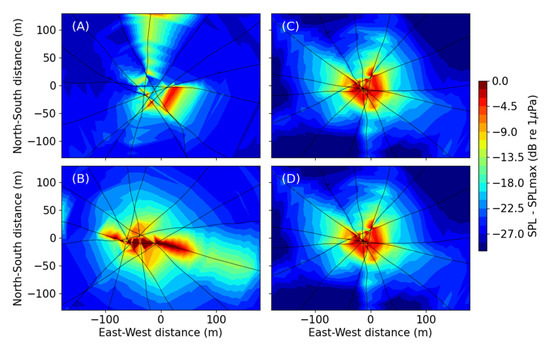
Figure 10.
Received sound pressure levels (SPLs) in the 15–100 kHz range for the 200 kHz signal (198–206 kHz) at depths of (A) 5 and (B) 30 m and for the 83 kHz signal (80–87 kHz) at depths of (C) 5 and (D) 30 m in the shallow water. The maximum SPL (maxSPL) for the 200 kHz signal was 114.7 dB re 1 µPa m, and that for 83 kHz was 128 dB re 1 µPa m.
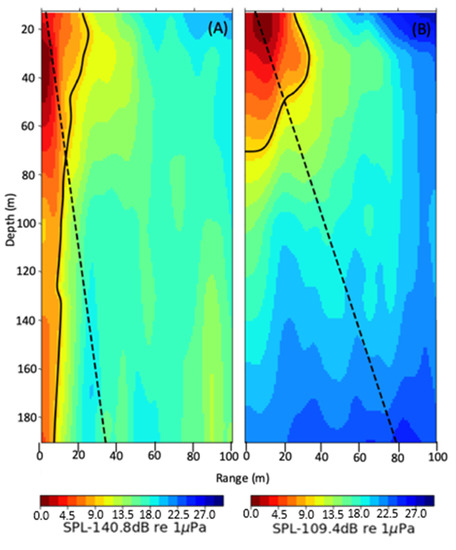
Figure 11.
Received sound pressure levels (SPLs) in the SRKW echolocation range (15–100 kHz) over depth and horizontal space from the (A) 200 and (B) 83 kHz echosounder signals in deep water. The dashed black lines indicate the 20° and 45° beam widths for the 83 and 200 kHz channels, respectively. The solid black lines indicate the contour of −10 dB re 1 m from below the maximum SPL of the frequency range (maxSPL) (measured to be 109.4 dB re 1 µPa m).
For the hearing range of killer whales (600 Hz to 114 kHz, [52]) the echosounder emissions at 83 kHz are most pertinent; the 200 kHz signal could be more influential for porpoises [34,35] or other delphinid species [33]. In the shallow-water setting the horizontal impacts of the 200 and 83 kHz signals in the echolocation range (15–100 kHz) were similar. The greatest additions were focused within 100 m from the source. The greatest differences in extent were seen for the 200 kHz signal between the 5 and 30 m recording depths, with the direction of the maximum horizontal range also differing between the two depths (Figure 10AB). In the deep-water setting, the received levels in the frequency range of SRKW echolocation were elevated considerably over a narrow horizontal range (≤40 m) below the source vessel to the sea floor when transmitting at 200 kHz. The greatest contribution of the 83 kHz channel was within the upper 80 m or so. The sound levels in SRKW echolocation range were greater in the shallow-water setting compared to the same recording depths in the deep-water setting; the greatest SPL was recorded in the SRKW echolocation frequency range at a recording depth of 5 m.
The received SPLs of the 83 and 200 kHz bands used in this analysis (80–87 and 198–206 kHz, respectively) showed a moderately strong correlation coefficient, with the 1 kHz frequency range being centered around 50 kHz (−Hz) (e.g., 83 kHz at the 30 m recorder depth, shallow water: rs = 0.565, p < 0.001, deep water: rs =0.524, p < 0.001; 200 kHz at the 30 m recorder depth, shallow water: rs =0.603, p < 0.001, deep water: rs = 0.604, p < 0.001). The frequency range centered around 50 kHz was previously used to represent small vessels [50,51,58], and so these correlation results indicate that this metric can be used as an indicator of smaller vessels with echosounders.
4. Discussion
Recreational boats use commercially available echosounders to determine water depth/topographical features and to locate fish. It is commonly assumed that, due to their high-frequency signals, their acoustic signature is spatially limited and defined by the frequency and the physical size of the transducer. The signal pulses rapidly attenuate, with detection ranges typically estimated by spherical spreading models. Here, we found that additions to ambient noise levels would occur in distances exceeding 400 m from the source, especially for the 83 kHz echosounder signal, with some anisotropic patterns (Figure 5C,D and Figure 6A–H).
Sound absorption is an important controlling factor for high-frequency noise in the sound field; thus, it defines the extent of the acoustic additions that the echosounder would add to the ambient sound levels. A sound signal’s wavelength, transmission pathways, transducer characteristics, and boundary conditions are determining factors. The spatial extent of the echosounder signals did not strictly follow the transducer beam characteristics that are commonly expected for the sizes of transducers used, as there was deviation from equal omnidirectional spreading (Figure 5, Figure 6, Figure 7, Figure 10 and Figure 11). In enclosed bays, similarly to the shallow-water setting, the acoustic signals may also interact with the sea floor and surface, determined by the local sound-speed characteristics, and result in unexpected signal strengths [59]. In the deep-water setting, we saw that local oceanographic conditions created variability in sound-speed profiles. Variations in temperature and salinity and the increase in pressure with depth altered the signal propagation. The observed sound-speed profiles suggested a weak local sound-speed minimum around 100 m and, therefore, the formation of a weak sound channel around that depth. This confinement of the signal may also distort it from a spherical to a more cylindrical spreading pattern. The results used to form the vertical profiles of the signals (Figure 7) suggest that the maximum extent of signal detection was at 100 m, with reduced ranges above and below this depth.
To estimate the potential effects on marine mammals in proximity to vessels using echosounders, we considered the 200 m minimum vessel approach distance suggested by the ‘Be Whale Wise’ guidelines for marine mammals [30] and the 400 m approach distance to killer whales in southern BC coastal waters [43]. We also considered the range from the signal source in which the received sound levels may elicit behavioral responses based on killer whale audiograms (~110 dB re 1 μPa at frequency range extremes, ~80 dB re 1 μPa at 83 kHz; [52,56]). In shallower waters or for whales swimming in the upper water column, the impact of the 200 kHz echosounder would not extend past the recommended approach distance (Figure 6, Figure 7 and Figure 10). The signal was focused in a downward beam, with the greatest impact from the echosounder being focused over a narrow extent. However, the additions from the echosounder source to the ambient sound levels formed a conical shape in the water column therefore, the area in which emissions were made increased with depth (Figure 7).
The results from this experiment show that whales could be subject to sound levels in excess of 80 dB re 1 μPa—or 20–30 dB relative to the ambient levels—as a result of vessels at the 400 m approach distance in water depths of 30 m or more (Figure 7 and Figure 10). The impact of the echosounder was altered by the source levels, frequencies, pulse lengths, and radiation patterns of the system. In addition, changes in water properties, including the depth dependence in sound attenuation and the known seasonal stratification in the waters of the Salish Sea [58], could also result in altered source–receiver distances and increase the potential impact at depth. However, the range of impact for a whale would also be dependent on the ambient noise levels, the whale’s hearing capacity, and its sensitivity to the signal. In-field measures have shown sonic additions to ambient sound levels in frequencies other than the intended target frequency [7], as noted here, and increases have been observed in the SRKW echolocation frequency range (15–100 kHz). Harmonics of signals were also introduced into the SRKW communication range, which has been described as ranging from 500 Hz to 15 kHz [32]. These introduce noise into the hearing ranges of whales that should be accounted for in models aimed at examining the effects of echosounders. The received levels found in the 80–87 kHz range may be sufficient to elicit a behavioral response [52] for SRKWs in shallow waters (Figure 5) or diving to depth (Figure 7B). The results for the 200 kHz signal indicate the potential impacts of higher-frequency signals’ addition of noise in the upper-frequency extent of the SRKW hearing range. Audiograms derived from behavioral response experiments suggest that 200 kHz could exceed the SRKW hearing range [52,56]. The use of this frequency may evoke a greater response in other coastal odontocete species, either directly or from sonic additions to ambient levels resulting from its signal harmonics.
In observations of odontocetes in the presence of echosounders, overt avoidance behaviors have been noted for beaked whales, including movements out of the detection range of the source and cessation of foraging [14,24,59]. However, this is not true for all cases [24,27]. Changes in heading variance have been seen for long- [60] and short-finned pilot whales [26], indicating increased vigilance. Changes in swimming direction and vocal behaviors have also been noted [40,61,62,63]. Experimental exposures have shown a similar response, including increased auditory vigilance [24,64,65]. Behavioral responses have been considered for SRKWs in the presence of vessels, but they have been studied less in terms of the potential impacts of echosounders. In the presence of vessels with echosounders, Holt et al. [40] documented SRKWs making longer dives and initiating those dives more slowly, a response that differed when vessel noise alone was higher or vessels were in close proximity.
Sonic additions to ambient levels of frequencies pertinent to SRKWs, especially echolocation (15–100 kHz), suggest that the adaptation of calls and more generally used signals may be a response on the part of whales that are close to vessels with echosounders to overcome potential masking. The received levels of the echosounder source exceeded the sound levels that were determined experimentally [52,56] and in natural settings [65,66] to illicit behavioral responses. This work adds to observations and data from tagged killer whales, which showed a behavioral response during foraging dives with longer dives and slower descent rates [42]. This response may be a result of increased attention being dedicated to the echosounder emissions [42], which predominantly add to frequencies around 50 kHz, which is the central frequency of SRKW echolocation clicks [31]. In this experiment, the sound levels in echolocation frequencies were greatest for the shallow-water tests. Killer whale foraging in the Salish Sea is seen in nearshore areas with shallow reefs, as well as when diving to depths of approximately 100 m to capture Chinook salmon (Oncorhynchus tshawytscha [35,44]). The results suggest that whales feeding in these shallower areas in the presence of vessels operating an echosounder could be subject to a greater influence. Noise from vessels and echosounders when whales are in or are adjacent to deep water may be heightened in the upper water layers, as the water properties form a sound channel and refract the signal (Figure 9 and Figure 10). Any changes in diving or acoustic behavior that may result could reduce foraging success, which could impact the survival of individuals and the broader population [40,66,67,68,69,70,71].
Concern regarding the potentially harmful effects of echosounders on marine mammals focuses on the potential impact on acoustic detection and behaviors, rather than direct injury or death [6,7]. The ‘Be Whale Wise’ guidelines [30] do suggest that vessel operators turn off their echosounders when in proximity to marine mammals that are acoustically sensitive to high frequencies; however, this is not mandated or enforced. If a vessel operator does not deem it safe to be without an echosounder, they could, perhaps, be encouraged to reduce the power output and increase the source frequency to limit the spatial extent of the acoustic additions as much as possible. It is not uncommon for many (>50) smaller vessels to be in the proximity of SRKWs in their foraging areas in the Salish Sea during the summer [72,73], which amplifies the potential cumulative exposure from both vessel and echosounder noise that these whales may be subjected to.
The use of recreational vessels is increasing globally; many of these are fitted with some form of echosounder or fish-finding device. This study adds to the understanding of the potential exposure of marine mammals to echosounder signals. In a broader sense, this will add to what is considered for the potential impact of anthropogenic sound on the acoustic environment and the consideration of the potential acoustic disturbances that may be created for marine mammals. There are, however, still gaps in knowledge about the non-lethal effects of increased noise levels on marine mammals, as well as the sound levels that they are willing to withstand to perform key life processes.
Author Contributions
Conceptualization, R.B. and S.V.; methodology, R.B. and S.V.; validation, R.B. and S.V.; formal analysis, R.B. and S.V.; investigation, R.B., S.V., P.V.B., and C.M.; data curation, R.B.; writing—original draft preparation, R.B.; writing—review and editing, R.B., S.V., P.V.B., and C.M.; visualization, R.B.; supervision, R.B. All authors have read and agreed to the published version of the manuscript.
Funding
This research was funded by the Government of Canada’s Ocean Protection Plan.
Informed Consent Statement
Not Applicable.
Data Availability Statement
The data presented in this study are available on request from the corresponding author. The data are not publicly available as they are part of ongoing work.
Acknowledgments
The authors would like to thank Caitlin O’Neill for her ongoing work on the equipment maintenance and set-up for this experiment. Comments from Patrick O’Hara and Michel Breton were helpful in the final stages of writing.
Conflicts of Interest
The authors declare no conflict of interest.
References
- Lurton, X. An Introduction to Underwater Acoustics: Principles and Applications; Springer: London, UK, 2002; pp. 172–180. [Google Scholar]
- Anderson, J.T.; Van Holliday, D.; Kloser, R.; Reid, D.G.; Simard, Y. Acoustic seabed classification: Current practice and future directions. ICES J. Mar. Sci. 2008, 65, 1004–1011. [Google Scholar] [CrossRef]
- Lurton, X.; DeRuiter, S. Sound radiation of seafloor-mapping echosounders in the water column, in relation to the risks posed to marine mammals. Int. Hydrogr. Rev. 2011, 6, 7–17. [Google Scholar]
- Calvert, J.; Strong, J.A.; McGonigle, C.; Quinn, R. An evaluation of supervised and unsupervised classification techniques for marine benthic habitat mapping using multibeam echosounder data. ICES J. Mar. Sci. 2014, 72, 1498–1513. [Google Scholar]
- Howe, J.A.; Anderton, R.; Arosio, R.; Dove, D.; Bradwell, T.; Crump, P.; Cooper, R.; Cocuccio, A. The seabed geomorphology and geological structure of the Firth of Lorn, western Scotland, UK, as revealed by multibeam echo-sounder survey. Earth Environ. Sci. Trans. R. Soc. Edinb. 2015, 105, 273–284. [Google Scholar] [CrossRef]
- Lurton, X. Modelling of the sound field radiated by multibeam echosounders for acoustical impact assessment. Appl. Acoust. 2016, 101, 201–221. [Google Scholar] [CrossRef]
- Deng, Z.D.; Southall, B.L.; Carlson, T.J.; Xu, J.; Martinez, J.J.; Weiland, M.A.; Ingraham, J.M. 200 kHz Commercial Sonar Systems Generate Lower Frequency Side Lobes Audible to Some Marine Mammals. PLoS ONE 2014, 9, e95315. [Google Scholar] [CrossRef]
- Finneran, J.J. Noise-induced hearing loss in marine mammals: A review of temporary threshold shift studies from 1996 to 2015. J. Acoust. Soc. Am. 2015, 138, 1702–1726. [Google Scholar] [CrossRef]
- Finneran, J.J. Auditory Weighting Functions and TTS/PTS Exposure Functions for Marine Mammals Exposed to Underwater Noise; SSC Pacific: San Diego, CA, USA, 2016. [Google Scholar]
- Southall, B.L.; Finneran, J.J.; Reichmuth, C.; Nachtigall, P.E.; Ketten, D.R.; Bowles, A.E.; Ellison, W.T.; Nowacek, D.P.; Tyack, P.L. Marine Mammal Noise Exposure Criteria: Updated Scientific Recommendations for Residual Hearing Effects. Aquat. Mamm. 2019, 45, 125–232. [Google Scholar] [CrossRef]
- De Robertis, A.; Higginbottom, I. A post-processing technique to estimate the signal-to-noise ratio and remover echosounder background noise. ICES J. Mar. Sci. 2007, 64, 1282–1291. [Google Scholar] [CrossRef]
- Knudsen, H. Long-term evaluation of scientific-echosounder performance. ICES J. Mar. Sci. 2009, 66, 1335–1340. [Google Scholar]
- Greenaway, S.F. Linearity Tests if a Multibeam Echosounder. Masters Thesis, University of New Hampshire, Durham, NH, USA, 2010; p. 71. [Google Scholar]
- McCarthy, E.; Moretti, D.; Thomas, L.; DiMarzio, N.; Morrissey, R.; Jarvis, S.; Ward, J.; Izzi, A.; Dilley, A. Changes in spatial and temporal distribution and vocal behavior of Blainville’s beaked whales (Mesoplodon densirostris) during multiship exercises with mid-frequency sonar. Mar. Mammal. Sci. 2011, 27, E206–E226. [Google Scholar] [CrossRef]
- DeRuiter, S.L.; Southall, B.L.; Calambokidis, J.; Zimmer, W.M.X.; Sadykova, D.; Falcone, E.A.; Friedlaender, A.S.; Joseph, J.E.; Moretti, D.; Schorr, G.S.; et al. First direct measurements of behavioural responses by Cuvier’s beaked whales to mid-frequency active sonar. Biol. Lett. 2013, 9, 20130223. [Google Scholar] [CrossRef] [PubMed]
- Jarvis, S.M.; Morrisey, R.P.; Moretti, D.J.; DiMarzio, N.A.; Shaffer, J.A. Marine mammal monitoring on navy ranges (M3R): A toolset for automated detection, localization, and monitoring of marine mammals in open ocean environments. Mar. Technol. Soc. J. 2014, 48, 5–20. [Google Scholar] [CrossRef]
- Manzano-Roth, R.; Henderson, E.; Martin, S.; Martin, C.; Matsuyama, B. Impacts of U.S. navy training events on Blainville’s beaked whale (Mesoplodon densirostris) foraging dives in Hawaiian waters. Aquat. Mamm. 2016, 42, 507–518. [Google Scholar] [CrossRef]
- Falcone, E.A.; Schorr, G.S.; Watwood, S.L.; DeRuiter, S.; Zerbini, A.; Andrews, R.D.; Morrissey, R.P.; Moretti, D.J. Diving behaviour of Cuvier’s beaked whales exposed to two types of military sonar. R. Soc. Open Sci. 2017, 4, 170629. [Google Scholar] [CrossRef] [PubMed]
- DiMarzio, N.; Watwood, S.; Fetherston, T.; Moretti, D. Marine Mammal Monitoring on Navy Ranges (M3R) on the Southern California Anti- Submarine Warfare Range (SOAR) and the Pacific Missile Range Facility (PMRF) 2018; Naval Undersea Warfare Center: Newport, RI, USA, 2019. [Google Scholar]
- Frantzis, A. Does acoustic testing strand whales? Nature 1998, 392, 29. [Google Scholar] [CrossRef]
- Evans, D.L.; England, G.R. Joint Interim Report Bahamas Marine Mammal Stranding Event of 15–16 March 2000, U.S.; Department of Commerce and Secretary of the Navy: Washington, DC, USA, 2001. [Google Scholar]
- D’Amico, A.; Gisiner, R.C.; Ketten, D.R.; Hammock, J.A.; Johnson, C.; Tyack, P.L.; Mead, J. Beaked whale strandings and naval exercises. Aquat. Mamm. 2009, 35, 452–472. [Google Scholar] [CrossRef]
- Fernandez, A.; Sierra, E.; Martin, V.; Mendez, M.; Sacchinnin, S.; Bernaldo de Quiros, Y.; Andrada Borzollino, M.A.; Bolaños Rivero, M.; Quesada Canales, I.Ó.; Tejedor, M.; et al. Last “atypical” beaked whales mass stranding in the Canary Islands (July, 2004). J. Mar. Sci. Res. Dev. 2012, 2, 107. [Google Scholar] [CrossRef]
- Vires, G. Echosounder Effects on Beaked Whales in the Tongue of the Ocean, Bahamas. Masters Thesis, Duke University, Durham, NH, USA, 2011; p. 40. [Google Scholar]
- Cholewiak, D.; DeAngelis, A.I.; Palka, D.; Corkeron, P.J.; Van Parijs, S.M. Beaked whales demonstrate a marked acoustic response to the use of shipboard echosounders. R. Soc. Open Sci. 2017, 4, 170940. [Google Scholar] [CrossRef]
- Quick, N.; Scott-Hayward, L.; Sadykova, D.; Nowacek, D.; Read, A. Effects of a scientific echo sounder on the behavior of short finned pilot whales (Globicephala macrorhynchus). Can. J. Fish. Aquat. Sci. 2017, 74, 716–726. [Google Scholar] [CrossRef]
- Varghese, H.K.; Miksis-Olds, J.; DiMarzio, N.; Lowell, K.; Linder, E.; Mayer, L.; Moretti, D. The Effect of two 12 kHz Multibeam mapping surveys on the foraging behavior of Cuvier’s beaked whales off of Southern California. J. Acoust. Soc. Am. 2020, 147, 3849–3858. [Google Scholar] [CrossRef]
- Ketten, D.R. Sonars and strandings: Are beaked whales the aquatic acoustic canary? Acoust. Today 2014, 10, 45–55. [Google Scholar]
- Olesiuk, P.F.; Lawson, J.W.; Trippel, E.A. Pathways of effects of noise associated with aquaculture on natural marine ecosystems in Canada. DFO Can. Sci. Advis. Sec. Res. Doc. 2012, 6, 64. [Google Scholar]
- Be Whale Wise. Marine Wildlife Guidelines. Available online: http://www.bewhalewise.org/marine-wildlife-guidelines/ (accessed on 27 February 2021).
- Au, W.W.L.; Ford, J.K.B.; Horne, J.K.; Allman, K.A.N. Echolocation signals of free-ranging killer whales (Orcinus orca) and modeling of foraging for chinook salmon (Oncorhynchus tshawytscha). J. Acoust. Soc. Am. 2004, 115, 901–909. [Google Scholar] [CrossRef]
- Heise, K.A.; Barrett-Lennard, L.G.; Chapman, N.R.; Dakin, D.T.; Erbe, C.; Hannay, D.E.; Merchant, N.D.; Pilkington, J.S.; Thornton, S.J.; Tollit, D.J.; et al. Proposed Metrics for the Management of Underwater Noise for Southern Resident Killer Whales; Coastal Ocean Report Series (2); Ocean Wise: Vancouver, BC, Canada, 2017; p. 30. [Google Scholar]
- Soldevilla, M.S.; Henderson, E.E.; Campbell, G.S.; Wiggins, S.M.; Hildebrand, J.A.; Roch, M.A. Classification of Risso’s and Pacific white-sided dolphins using spectral properties of echolocation clicks. J. Acoust. Soc. Am. 2008, 127, 124–132. [Google Scholar] [CrossRef] [PubMed]
- Basset, H.R.; Baumann, S.; Campbell, G.S.; Wiggins, S.M.; Hildebrand, J.A. Dall’s porpoise (Phocoenoides dalli) echolocation click spectral structure. J. Acoust. Soc. Am. 2009, 125, 2677. [Google Scholar] [CrossRef]
- Miller, L.A.; Wahlber, M. Echolocation by the harbour porpoise: Life in coastal waters. Front. Physiol. 2013, 4, 52. [Google Scholar] [CrossRef]
- Farcas, A.; Thompson, P.M.; Merchant, N.D. Underwater noise modelling for environmental impact assessment. Environ. Impact Assess. Rev. 2016, 57, 114–122. [Google Scholar] [CrossRef]
- Olson, J.K.; Wood, J.; Osborne, R.W.; Barrett-Lennard, L.; Larson, S. Sightings of southern resident killer whales in the Salish Sea 1976−2014: The importance of a long-term opportunistic dataset. Endang. Species Res. 2018, 37, 37,105–118. [Google Scholar] [CrossRef]
- Cominelli, S.; Devillers, R.; Yurk, H.; MacGillivray, A.; McWhinnie, L.; Canessa, R. Noise exposure from commercial shipping for the southern resident killer whale population. Mar. Poll. Bull. 2018, 136, 177–200. [Google Scholar] [CrossRef]
- Department of Fisheries and Oceans Canada, DFO. Identification of areas for mitigation of vessel-related threats to survival and recovery for Southern Resident Killer Whales. DFO Can. Advis. Sec. Sci. Advis. Re. 2021, 2021, 25. [Google Scholar]
- Holt, M.M.; Tennessen, J.B.; Ward, E.J.; Hanson, M.B.; Emmons, C.K.; Giles, D.A.; Hogan, J.T. Effects of vessel distance and sex on the behavior of endangered killer whales. Front. Mar. Sci. 2021, 7, 1211. [Google Scholar] [CrossRef]
- Herlinveaux, R.H. Oceanography of Saanich Inlet in Vancouver Island, British Columbia. J. Fish. Res. Board Canada 1962, 19, 1–37. [Google Scholar] [CrossRef]
- Gargett, A.E.; Stucchi, D.; Whitney, F. Physical processes associated with high primary production in Saanich Inlet, British Columbia. Estuarine Coast. Shelf Sci. 2003, 56, 1141–1156. [Google Scholar] [CrossRef]
- Transport Canada. Government of Canada Announces Second Year of Enhanced Measures to Protect Southern Resident Killer Whales. Available online: https://www.canada.ca/en/transport-canada/news/2020/05/government-of-canada-announces-second-year-of-enhanced-measures-to-protect-southern-resident-killer-whales.html (accessed on 27 February 2020).
- Baird, R.W.; Hanson, M.B.; Ashe, E.E.; Heithaus, M.R.; Marshall, G.J. Studies of foraging in ‘southern resident’ killer whales during July 2002: Dive depths, bursts in speed, and the use of a ‘crittercam’ system for examining sub-surface behaviour. In Report Prepared under Order Number AB 133F-02-SE-1744 for the National Marine Fisheries Service; National Marine Fisheries Service, National Marine Mammal Laboratory: Seattle, WA, USA, 2003. [Google Scholar]
- Baird, R.W.; Hanson, M.B.; Dill, L.M. Factors influencing the diving behaviour of fish eating killer whales: Sex differences and diel and interannual variation in diving rates. Can. J. Zool. 2005, 83, 257–267. [Google Scholar] [CrossRef]
- Wright, B.M.; Ford, J.K.B.; Ellis, G.M.; Deecke, V.B.; Shapiro, A.D.; Battaile, B.C.; Trites, A.W. Fine-scale foraging movements by fish-eating killer whales (Orcinus orca) relate to the vertical distributions and escape responses of salmonid prey (Oncorhynchus spp.). Move Ecol. 2017, 5, 3. [Google Scholar] [CrossRef] [Green Version]
- Tennessen, J.B.; Holt, M.M.; Hansen, M.B.; Emmons, C.K.; Giles, D.A.; Hogan, J.T. Kinematic signatures of prey capture from archival tags reveal sex differences in killer whale foraging activity. J. Exp. Bio. 2019, 222, jeb191874. [Google Scholar] [CrossRef]
- Tennessen, J.B.; Holt, M.M.; Ward, E.J.; Hansen, M.B.; Emmons, C.K.; Giles, D.A.; Hogan, J.T. Hidden Markov models reveal temporal patterns and sex difference in killer whale behaviour. Nature Sci. Rep. 2019, 9, 14951. [Google Scholar]
- Merchant, N.D.; Fristrup, K.M.; Johnson, M.P.; Tyack, P.L.; Witt, M.J.; Blondel, P.; Parks, S.E. Measuring acoustic habitats. Methods Ecol. Evol. 2015, 6, 257–265. [Google Scholar] [CrossRef]
- Wladichuk, J.L.; Hannay, D.E.; MacGillivray, A.O.; Li, Z.; Thornton, S. Systematic Source Level Measurements of Whale Watching and other small boats. J. Ocean Tech. 2018, 14, 108–126. [Google Scholar]
- Burnham, R.E.; Vagle, S.; O’Neill, C. Spatiotemporal patterns in the natural and anthropogenic additions to the soundscape in parts of the Salish Sea, British Columbia, 2018–2020. Mar. Poll. Bull. 2021, 170, 112647. [Google Scholar] [CrossRef]
- Branstetter, B.; St Leger, J.; Acton, D.; Stewart, J.; Houser, D.; Finneran, J.J.; Jenkins, K. Killer whale (Orcinus orca) behavioral audiograms. J. Acoust. Soc. Am. 2017, 141, 2387. [Google Scholar] [CrossRef]
- Nachtigall, P.E.; Pawloski, J.L.; Au, W.W.L. Temporary threshold shifts and recovery following noise exposure in the Atlantic bottlenosed dolphin (Tursiops truncatus). J. Acoust. Soc. Am. 2003, 113, 3425–3429. [Google Scholar] [CrossRef]
- Kastelein, R.A.; Nieuwstraten, S.H.; Staal, C.; van Ligtenberg, C.L.; Versteegh, D. Low- frequency aerial hearing of a harbour porpoise (Phocoena phocoena). In The Biology of the Harbour Porpoise; Read, A.J., Wiepkema, P.R., Nachtigall, P.E., Eds.; De Spil: Woerden, The Netherlands, 1997; pp. 295–312. [Google Scholar]
- Verboom, W.C.; Kastelein, R.A. Structure of harbour porpoise (Phocoena phocoena) acoustic signals with high repetition rates. In Echolocation in Bats and Dolphins; Thomas, J.A., Moss, C., Vater, M., Eds.; University of Chicago Press: Chicago, IL, USA, 2003; pp. 40–43. [Google Scholar]
- Szymanski, M.D.; Bain, D.E.; Kiehl, K.; Pennington, S.; Wong, S.; Henry, K.R. Killer whale (Orcinus orca) hearing: Auditory brainstem response and behavioral audiograms. J. Acoust. Soc. Am. 1999, 106, 1134–1141. [Google Scholar] [CrossRef] [PubMed]
- Leroy, C.C.; Robinson, S.P.; Goldsmith, M.J. A new equation for the accurate calculation of sound speed in all oceans. J. Acoust. Soc. Am. 2008, 124, 2774–2782. [Google Scholar] [CrossRef]
- Vagle, S.; Burnham, R.E.; O’Neill, C.; Yurk, H. Variability in anthropogenic underwater noise due to bathymetry and sound speed characteristics. J. Mar. Sci. Engin. 2021, 9, 1047. [Google Scholar] [CrossRef]
- Childerhouse, S.; Douglas, L. Review of multibeam echosounder surveys and marine mammals. In Report Prepared by Blue Planet Marine; BPM: Canberra, Australia, 2016; Document Reference Number: BPM-16-MDC. [Google Scholar]
- Stimpert, A.; DeRuiter, S.; Southall, B.; Moretti, D.; Falcone, E.; Goldbogen, J.; Friedlaender, A.; Schorr, G.; Calambokidis, J. Acoustic and foraging behavior of a Baird’s beaked whale, Berardius bairdii, exposed to simulated sonar. Sci. Rep. 2014, 4, 7031. [Google Scholar] [CrossRef]
- Miller, P.J.; Kvadsheim, P.H.; Lam, F.-P.A.; Wensveen, P.J.; Antunes, R.; Alves, A.C.; Visser, F.; Kleivane, L.; Tyack, P.L.; Silve, L.D. The severity of behavioural changes observed during experimental exposures of killer (Orcinus orca), Long-Finned Pilot (Globicephala melas) and Sperm (Physeter macrocephalus) Whles to Naval Sonar. Aquat. Mamm. 2012, 38, 362–401. [Google Scholar] [CrossRef]
- Rendell, L.; Gordon, J. Vocal response of long-finned pilot whales (Globicephala melas) to military sonar in the Ligurian Sea. Mar. Mamm. Sci. 1999, 15, 198–204. [Google Scholar] [CrossRef]
- Alves, A.; Antunes, R.; Bird, A.; Tyack, P.; Miller, P.; Lam, F.; Kvadsheim, P. Vocal matching of naval sonar signals by long-finned pilot whales (Globicephala melas). Mar. Mamm. Sci. 2014, 30, 1248–1257. [Google Scholar] [CrossRef]
- Ridgway, S.H.; Carder, D.; Finneran, J.; Keough, M.; Kamolnick, T.; Todd, M.; Goldblatt, A. Dolphin continuous auditory vigilance for five days. J. Exp. Biol. 2006, 209, 3621–3628. [Google Scholar] [CrossRef] [PubMed]
- Hill, H.M.; Carder, D.A.; Ridgway, S.H. Vigilance in female bottlenose dolphins (Tursiops sp.) before and after calving. J. Comp. Psychol. 2008, 21, 35–57. [Google Scholar]
- Williams, R.; Erbe, C.; Ashe, E.; Beerman, A.; Smith, J. Severity of killer whale behavioral responses to ship noise: A dose-response study. Mar. Poll. Bull. 2014, 79, 254–260. [Google Scholar] [CrossRef] [PubMed]
- Joy, R.; Tollit, D.; Wood, J.; MacGillivray, A.; Li, Z.; Trounce, K.; Robinson, O. Potential benefits of vessel slowdowns on endangered southern resident killer whales. Front. Mar. Sci. 2019, 6, 344. [Google Scholar] [CrossRef]
- Lusseau, D.; Bain, D.E.; Williams, R.; Smith, J.C. Vessel traffic disrupts the foraging behavior of southern resident killer whales Orcinus orca. Endang. Species Res. 2009, 6, 211–221. [Google Scholar] [CrossRef]
- Friedlaender, A.S.; Hazen, E.L.; Golbogen, J.A.; Stimpert, A.K.; Calambokidis, J.; Southall, B. Prey-mediated behavioral responses of feeding blue whales in controlled sound exposure experiments. Ecol. App. 2016, 26, 1075–1085. [Google Scholar] [CrossRef]
- Isojunno, S.; Curé, C.; Kvadsheim, P.H.; Lam, F.-P.A.; Tyack, P.; Wensveen, P.J.; Miller, P.J.O. Sperm whales reduce foraging effort during exposure to 1–2 kHz sonar and killer whale sounds. Ecol. Appl. 2016, 26, 77–93. [Google Scholar] [CrossRef]
- Wisniewska, D.M.; Johnson, M.; Teilmann JSiebert, U.; Galatius, A.; Dietz, R.; Madsen, P.T. High rates of vessel noise disrupt foraging in wild harbour porpoises (Phocoena phocoena). Proc. R. Soc. B 2018, 285, 20172314. [Google Scholar] [CrossRef]
- Koski, K.; Osborne, R.; Tallmon, R. Soundwatch Public Outreach/Boater Education Project 2004–2005 Final Program Report, NMFS Contract No. AB133F-04-SE-0835 (Report No. NFFP 5000-4-00026); The Whale Museum: Friday Harbor, WA, USA, 2006; p. 25. [Google Scholar]
- Holt, M.M.; Noren, D.P.; Veirs, V.; Emmons, C.K.; Veirs, S. Speaking up: Killer whales (Orcinus orca) increase their call amplitude in response to vessel noise. J. Acoust. Soc. Am. 2009, 125, EL27–EL32. [Google Scholar] [CrossRef] [Green Version]


Publisher’s Note: MDPI stays neutral with regard to jurisdictional claims in published maps and institutional affiliations. |
© 2022 by the authors. Licensee MDPI, Basel, Switzerland. This article is an open access article distributed under the terms and conditions of the Creative Commons Attribution (CC BY) license (https://creativecommons.org/licenses/by/4.0/).