Article

Molecular Characterization and Expression Analysis of Novel Interleukin-1 Family Member (nIL-1Fm) Gene in Nile Tilapia (Oreochromis niloticus)

by
Eakapol Wangkahart
1,*,
Sukanda Jumpalueang
1,
Supanniga Ardprachan
1,
Janjira Phudkliang
1,
Phitcharat Sunthamala
2,
Sirinya Pholchamat
2 and
Zhitao Qi
3
1
Laboratory of Fish Immunology and Nutrigenomics, Applied Animal and Aquatic Sciences Research Unit, Division of Fisheries, Faculty of Technology, Mahasarakham University, Maha Sarakham 44150, Thailand
2
Department of Biotechnology, Faculty of Technology, Mahasarakham University, Maha Sarakham 44150, Thailand
3
Jiangsu Key Laboratory of Biochemistry and Biotechnology of Marine Wetland, Yancheng Institute of Technology, Yancheng 224051, China
*
Author to whom correspondence should be addressed.
J. Mar. Sci. Eng. 2022, 10(9), 1272; https://doi.org/10.3390/jmse10091272
Submission received: 30 July 2022 / Revised: 4 September 2022 / Accepted: 6 September 2022 / Published: 8 September 2022
(This article belongs to the Special Issue Nutrition and Immunity for Sustainable Marine Aquaculture Development)

Abstract

:
In this study, a novel interleukin-1-family member (nIL-1Fm) was studied from the Nile tilapia (Oreochromis niloticus), a widely cultured fish species in brackish water and freshwater in Thailand and worldwide. The complete sequence of the Nile tilapia nIL-1Fm comprised 2474 bp, encoding 350 amino acids. The genome organization of nIL-1Fm had seven exons and six introns, which were conserved in teleost fish. During tissue distribution analysis, the nIL-1Fm was extremely increased in the head kidney, tailfin and trunk kidney, which had the highest levels, followed by the spleen. Additionally, nIL-1Fm was significantly up-regulated under PAMP stimulation, whereas the stimulation of LPS, PHA and poly I:C could significantly induce nIL-1Fm expression in vitro. Moreover, nIL-1Fm transcription was significantly induced when infected with Streptococcus agalactiae in the spleen, liver and intestine. Taking together, our results indicated that nIL-1Fm can expand our knowledge of the IL-1 cytokine family in fish immune response.

1. Introduction

The interleukin-1 (IL-1) family is one of the proinflammatory cytokines, which is essential for controlling the innate immune response, inflammatory processes and immune homeostasis [1]. It performs a variety of functions, including inflammatory responses, inflammasome activation and partly in adaptive immunity. In 1985, the two IL-1 molecules IL-1α and IL-1β were initially reported in humans [2,3]. Recently, in mammals, IL-1 family members could be divided into three subfamilies: IL-1, IL-18, and IL-36 [4]. These IL-1 family members have been identified as having antagonistic functions. There have been reports of two IL-1 subfamilies in fish, including the IL-1 and IL-18 subfamilies [5,6].
The structure of the IL-1 family mainly shares a core structure with 12 β-sheets, 6 of which are organized in a β-trefoil core, which serves as the common secondary structure [7]. It is commonly known that of the mammalian IL-1 family members, IL-1β is the cytokine that has been best characterized and investigated [6]. It is a potent proinflammatory cytokine released by a number of cells, including innate immune system cells such as monocytes and macrophages [8]. In fish, IL-1β was first reported in rainbow trout (Oncorhynchus mykiss) [9], and has been studied in numerous fish species to date, including common carp (Cyprinus carpio) [10]; gilthead seabream (Sparus aurata) [11]; Japanese flounder (Paralichthys olivaceus) [12]; channel catfish (Ictalurus punctatus) [13]; Nile tilapia (O. niloticus) [14], haddock (Melanogrammus aeglefinus) [15]; orange-spotted grouper (Epinephelus coioides) [16]; Atlantic cod (Gadus morhua) [17]; southern blue fin tuna (Thunnus maccoyii) [18]; and grass carp (Ctenopharyngodon idella) [19], as well as a cartilaginous fish, the small spotted catshark (Scyliorhinus canicular) [20].
In the rainbow trout, a novel IL-1 family member (nIL-1Fm) was initially discovered that could counteract the effects of recombinant trout IL-1β [21]. The IL-1 family signature and a β-trefoil structure are also present in nIL-1F [22]. In some fish species, including the three-spined stickleback (Gasterosteus aculeatus) [23]; Japanese flounder (P. olivaceus) [24]; and grass carp (C. idella) [19], the nIL-1Fm genes have so far been described. There is evidence showing that nIL-1Fm is lacking in pufferfish [23]. Moreover, according to fish genome research, a prominent caspase-1 cleavage site is absent from the fish IL-1 gene, which is clearly different from the situation in humans [25,26]. Taken together, there are numerous unique characteristics of nIL-1F, and further research is needed to understand how it is regulated at the gene level as well as how it functions biologically.
Nile tilapia (O. niloticus) is considered an economically major farmed fish species in Thailand and worldwide [27], resistant to different environments including culture on brackish water. However, numerous pathogenic bacteria that negatively impact fish output have restricted tilapia production [28]. S. agalactiae is a significant bacterium among these bacteria that has a high mortality rate and generates significant economic losses on a massive level [28,29]. Understanding the immune system is essential to improving fish health and lowering the risk of disease outbreaks in tilapia against infections. However, it is still largely unknown how the nIL-1Fm mediates the immune response in fish. In this research, nIL-1Fm was first cloned in Nile tilapia. We further identified the expression of the tilapia nIL-1Fm in normal fish and in fish post S. agalactiae infection. In vitro studies were also conducted in PBLs after stimulation with PAMPs to reveal the function of nIL-1Fm. To the best of our knowledge, this research may offer new insight into how the nIL-1Fm gene affects teleost immune system.

2. Materials and Methods

2.1. The Experimental Fish

Nile tilapia were obtained from a commercial farm in Mahasarakham Province and acclimated to lab conditions at Mahasarakham University for 2 weeks. Spleen and liver were swabbed from at least 5 fish, and they were then grown in tryptic soy broth (Sigma, Hereford, UK) agar plates to check for any potential bacterial infections. The presence of microorganisms was absent [27]. Before the experiment, fish were manually fed commercial fish pellets twice daily that contained 32% protein and 4% fat (CP, Bangkok, Thailand). Mahasarakham University ethics committee gave its approval for the research’s fish handling and experimentation procedures.

2.2. Identification and Cloning of nIL-1Fm

In order to discover the nIL-1Fm gene of Nile tilapia, the rainbow trout nIL-1Fm sequence (accession no. AJ555869) was used as bait for a TBLASTN search for Nile tilapia (http://blast.ncbi.nlm.nih.gov/Blast.cgi) (accessed on 1 May 2022) [30]. This returned Nile tilapia-expressed sequence tags (EST) (accession no. XP_003445852) with high homology to the Nile tilapia nIL-1Fm gene. The full sequence of Nile tilapia nIL-1Fm was obtained by a set of primers as designed based on the nIL-1Fm putative sequence of Nile tilapia (Table 1). The sequence shared significant homology with nIL-1Fm molecules from other species. A total of 25 μL of a solution containing 12.5 μL MyTaq Red Mix 2 × (Bioline, London, UK), 1 μL of the primers (10 μM each), 1 μL of cDNA template and 9.5 μL of dH2O with DNase/RNase-Free (Thermo Fisher Scientific, Oxford, UK). The amplification program was as follows: 95 °C for 1 min, followed by 30 cycles at 95 °C for 15 s, 56 °C for 30 s, and 72 °C for 1.5 min, and a final extension at 72 °C for 10 min. The PCR product was cloned into the pGEM-T Easy Vector (Promega, Madison, WI, USA) and transformed into Escherichia coli-competent cells (DH5α; TIANGEN). The plasmid of positive clones were selected and sequenced by Macrogen Inc. (Seoul, Korea).

2.3. Bioinformatics Analysis of nIL-1Fm

Identification and characterization of the nIL-1Fm were performed by different in silico analysis tools. The homology of the sequence of the nIL-1Fm was conducted using the basic local alignment search tool (https://www.ncbi.nlm.nih.gov/orffinder/) (accessed on 1 May 2022). The ProtParam tool—Expasy server (https://web.expasy.org/protparam/) (accessed on 1 May 2022). was used to predict the amino acid sequence. Signal peptides was determined using SignalP (http://www.cbs.dtu.dk/services/SignalP/) (accessed on 1 May 2022). Theoretical molecular weight (MW) and isoelectric point (pI) were computed by analysis tools on the ExPASy Server (https://web.expasy.org/compute_pi/) (accessed on 10 May 2022). The conserved domain was elucidated using NCBI (https://www.ncbi.nlm.nih.gov/Structure/cdd/wrpsb.cgi) (accessed on 10 May 2022). The multiple sequence alignment was used by Clustal Omega software (https://www.ebi.ac.uk/Tools/msa/clustalo/) (accessed on 10 May 2022). The gene organization and synteny of the Nile tilapia nIL-1Fm of loci were summarized by making use of the recent release of the Nile tilapia whole genome, using Genomicus version 100.01 [31]. The amino acid sequence of the nIL-1Fm protein was employed to generate a phylogenetic tree using MEGA 10 software and the neighbor joining method (NJ) [32].

2.4. Tissue Distribution of nIL-1Fm by Quantitative Real-Time PCR (qRT-PCR)

Tissue distribution of nIL-1Fm transcription was studied by using qRT-PCR as described previously [33], 11 different tissues from 3 healthy fish (~100 g) were sacrificed, and collected including the spleen, gills, head kidney, intestine, liver, skin, muscle, trunk kidney, heart, tail fin and gonads. The primer sets for qRT-PCR were designed with at least one primer crossing an intron to ensure that the genomic DNA could not be amplified under the PCR conditions used [34]. These primer sets are shown in Table 1. The expression of a housekeeping gene β-actin was used as an internal control. Each sample’s relative expression level was standardized against the level of β-actin expression [35].

2.5. Modulation of the Expression of Nile Tilapia nIL-1Fm In Vivo by Bacterial S. agalactiae Infection

The S. agalactiae was inoculated into BHI broth and incubated with gentle shaking for 14–18 h and the bacterial cells were removed by high-speed centrifugation (10,000× g for 10 min at 4 °C). The bacterial pellet was resuspended, washed twice in phosphate-buffered saline (PBS), and diluted to the desired concentration in sterile PBS, as described previously [27]. Then, bacteria (1 × 10⁷ CFU/fish in 100 μL PBS) were injected intraperitoneally (i.p.) into fish, with PBS serving as the control. At 6, 24, 48, and 72 h after injection, four fish were killed, spleen, liver, and intestine were collected to perform the gene expression by qRT-PCR.

2.6. Modulation of nIL-1Fm Expression in PBL by PAMPs

The peripheral blood leukocytes (PBLs) of Nile tilapia were prepared by hypotonic lysis of erythrocytes [36]. Briefly, blood samples from 3 Nile tilapia fish were drawn from the caudal vein (~500–800 g/fish) using blood collection tubes (Becton, Franklin Lakes, NJ, USA). Blood and ice-cold water were mixed at the ratio of 1:9 for 20 s, the red blood cells were then lysed. The resulting PBLs were stored on ice for 5 min to allow the cell debris by adding 4 mL of cooled 10× PBS solution. The PBLs were then passed through a 70 µm EASYstrainer (Greiner Bio-One, Stonehouse, UK) and centrifuged at 200× g for 5 min. The PBLs were rinsed in Leibovitz-15 (L-15) media (Invitrogen, Cambridge, UK), which was supplemented with 1% fetal calf serum (FCS), penicillin (100 U/mL), and streptomycin (100 g/mL) (Sigma, UK). The resultant PBLs were resuspended in L-15 cell culture medium (as above except 10% FCS) at 2 × 10⁶ PBL/mL for culture or stimulation. Freshly prepared PBLs were stimulated with or without 100 μg/mL of lipopolysaccharide (LPS, Sigma–Aldrich, UK), phytohemagglutinin (PHA, Sigma–Aldrich, UK) and polyinosinic-polycytidylic acid (poly(I:C), Sigma–Aldrich, UK) for 4 h. The cells were also treated with LPS at different doses (1–100 μg/mL) for 4 h. The control treatment was applied using an equal volume of L-15 media. The stimulation was terminated by adding TRI reagent (Sigma, UK). Total RNA from each sample was extracted using TRIzol Reagent, and subjected to cDNA synthesis. qRT-PCR analysis was performed as described above.

2.7. Statistical Analysis

The results of gene expression from the qRT-PCR were displayed as means + standard error of mean (SEM). For statistical analyses, one-way analysis of variance (ANOVA) was used to statistically compared the fold changes of treatment and control groups. The data were analyzed using Student’s t-test with IBM SPSS statistics software version 23 (SPSS Inc., Chicago, IL, USA), and differences at p < 0.05 were considered significant.

3. Results

3.1. Sequence Analysis of the nIL-1Fm Gene

The cDNA sequence of Nile tilapia nIL-1Fm (accession no. ON568309) consisted of 2474 bp, containing a 1026 bp open reading frame (ORF) with a 116 bp 5′ untranslated region (UTR) and an 822 bp 3′ UTR (Figure 1). The putative peptide had 350 amino acids and a theoretical isoelectric point (pI) of 4.97. It had a molecular mass of 39.12 kDa. There was no signal peptide or transmembrane domain in the predicted protein. The PDZ domain, also called DHR (Dlg homologous region), was found at the position of 43–78. There was a thrombin cut site (RGR) at the position of 165–167, and only one potential N-glycosylation site (NXT) at the position of 257–259 (Figure 1). Additionally, IL-1 signature [FC]-x-S-[ASLV]-x(2)-P-x(2)-[FYLIV]-[LI]-[SCA]-T-x(7)-[LIVM] was also discovered between the position of 313 and 329.
The amino acid sequences of Nile tilapia nIL-1Fm shared more identity (32.6–61.3%) and similarity (47.8–76.1%) with its teleost homologs than mammalian or bird IL-1Ra (Table 2). Among the teleost group, Nile tilapia nIL-1Fm showed a close relationship with yellow croaker, with 76.1% similarity and 61.3% identity (Table 2).

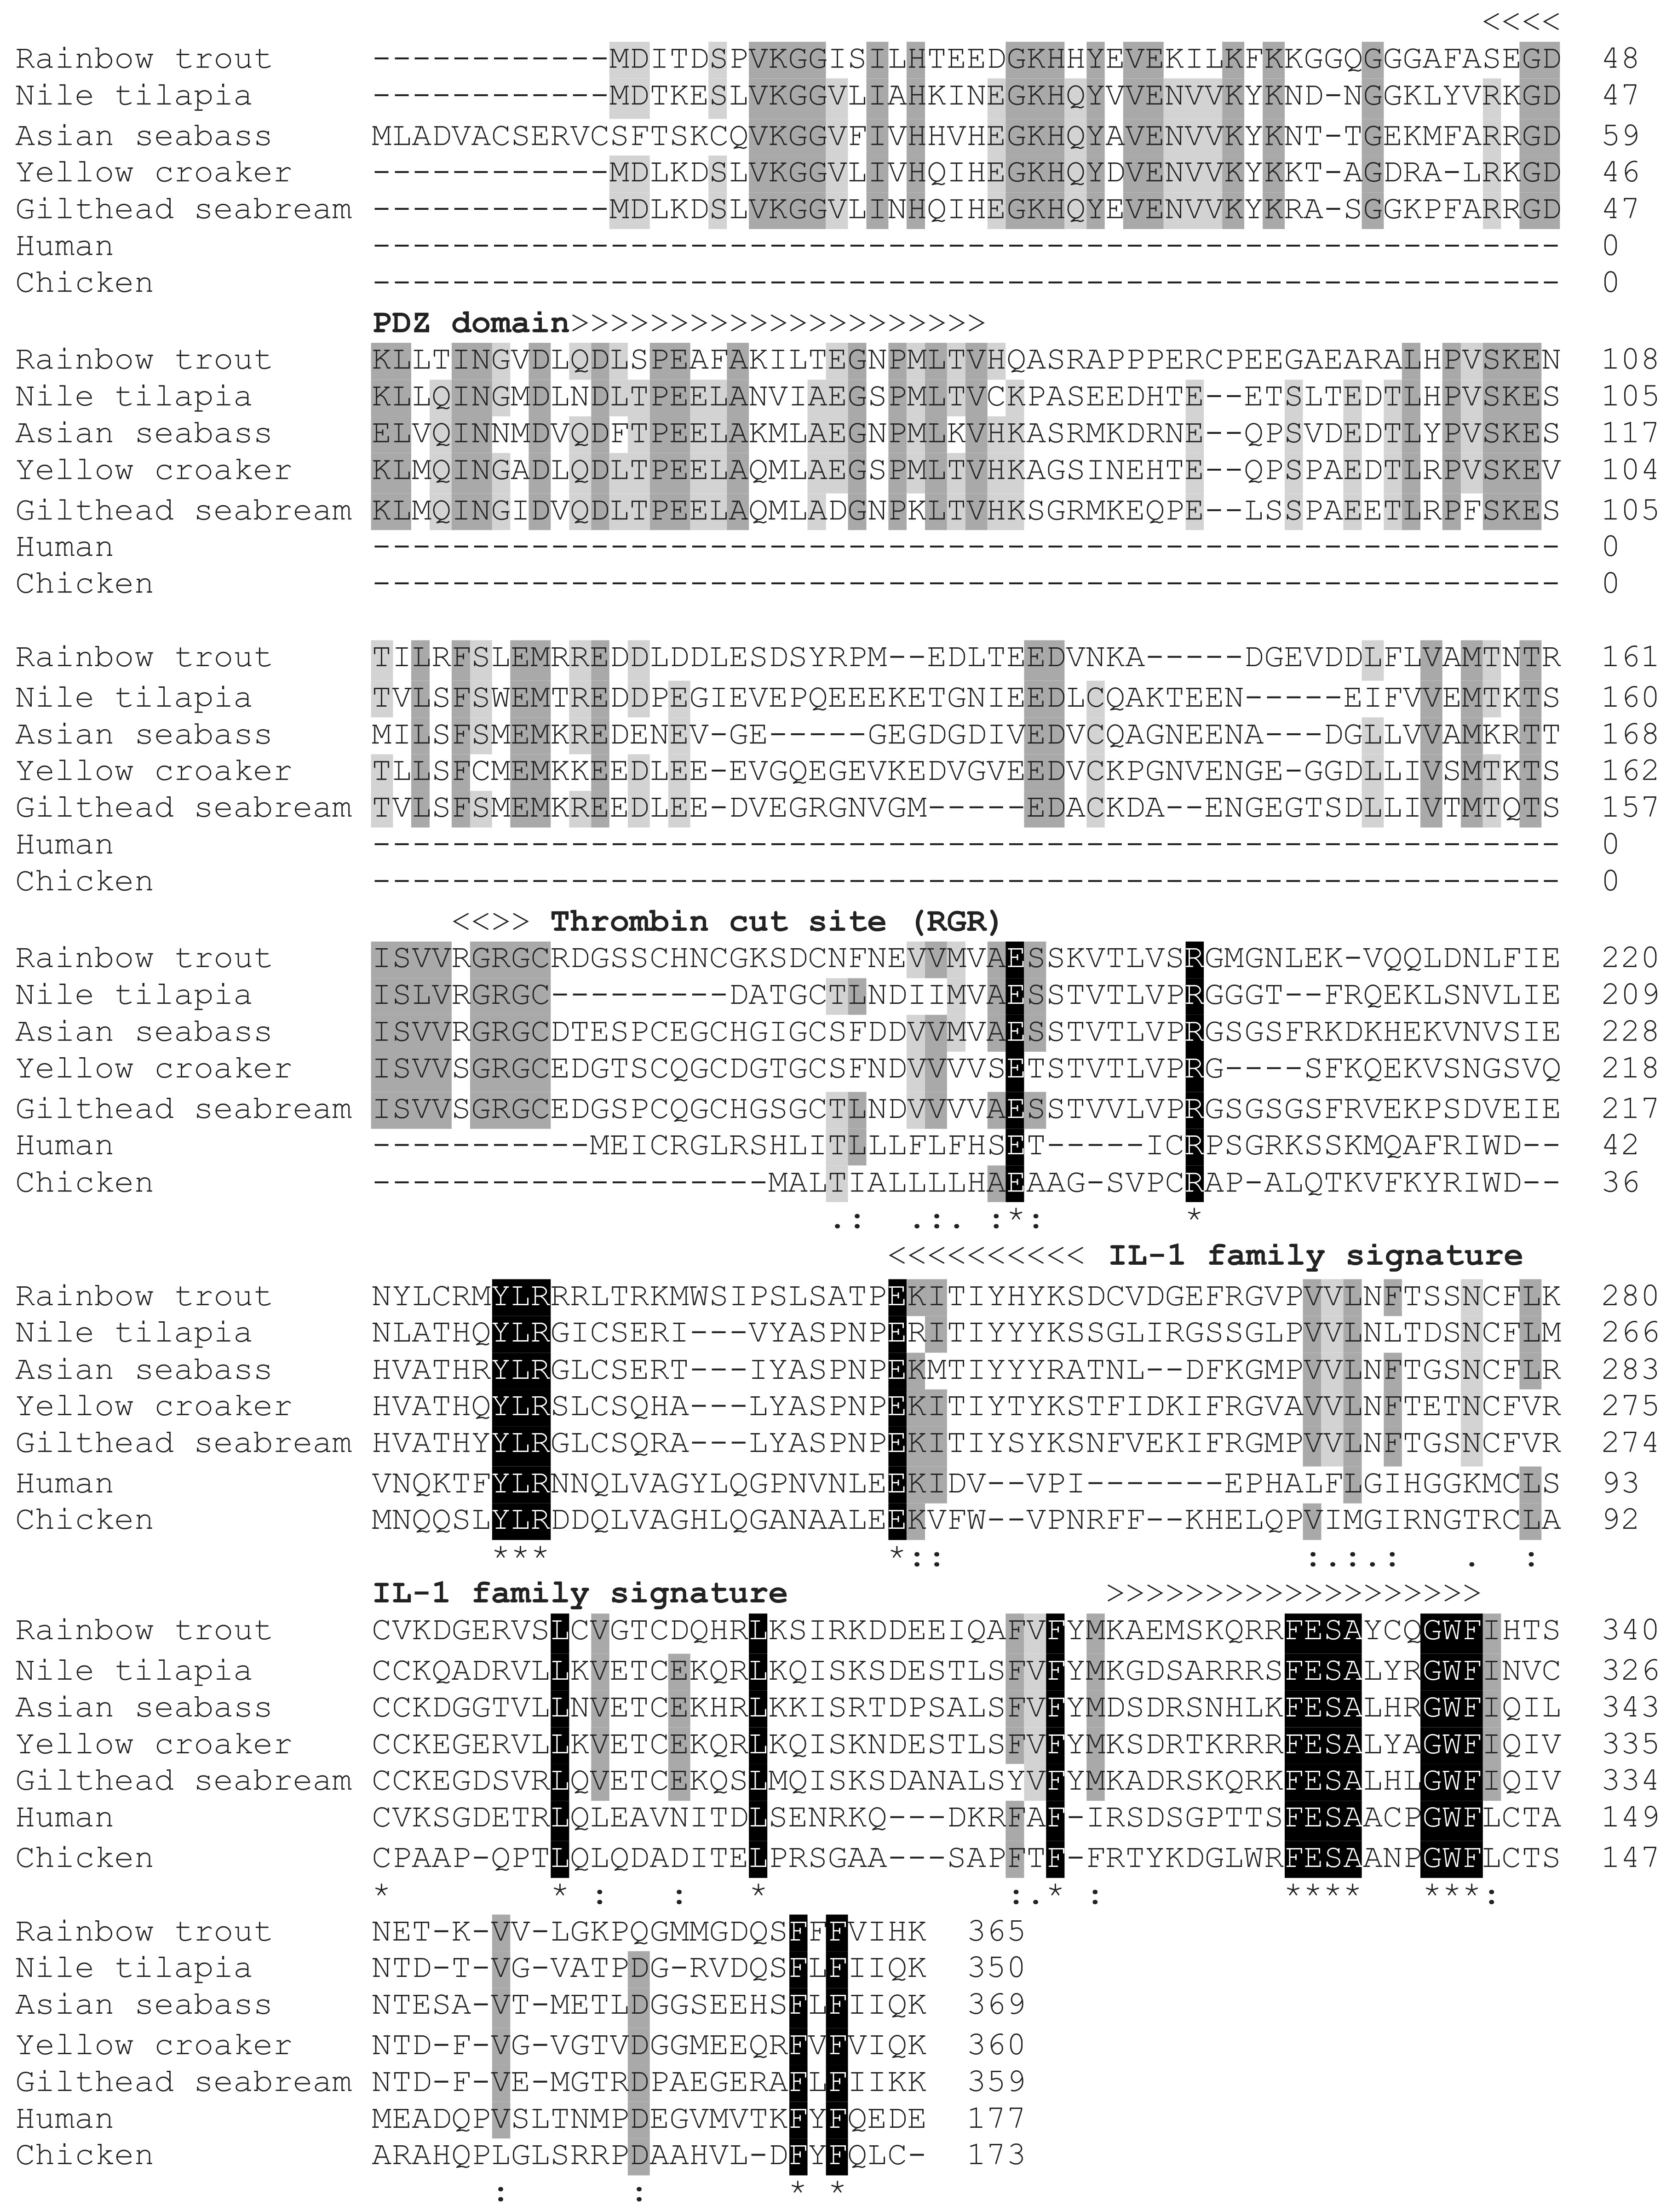
3.2. Multiple Sequence Alignment and Synteny Analysis

To better understand the conservation of nIL-1Fm, multiple alignments of nIL-1Fm from Nile tilapia and other vertebrates, including rainbow trout, Asian seabass, large yellow croaker, gilthead seabream, human and chicken, revealed that nIL-1Fm was conserved among vertebrates (Figure 2). The PDZ domain, the thrombin cut site (RGR), and IL-1 family signature consensus pattern [FC]-x-S-[ASLV]-x(2)-P-x(2)-[FYLIV]-[LI]-[SCA]-T-x(7)-[LIVM], nIL-1Fm was conserved across species. We performed a synteny analysis on the nIL-1Fm gene locus using the most advanced genomes accessible to further validate the conclusions described above (Figure 3). Yellow croaker (Chr 8), gilthead seabream (Chr 4), Asian seabass (Chr CYIF01000097) and rainbow trout (Chr 21) shared a considerable syntenic relationship and it was found that the nIL-1Fm gene was present in all fish species examined and there was relatively high conservation of genes adjacent to nIL-1Fm.

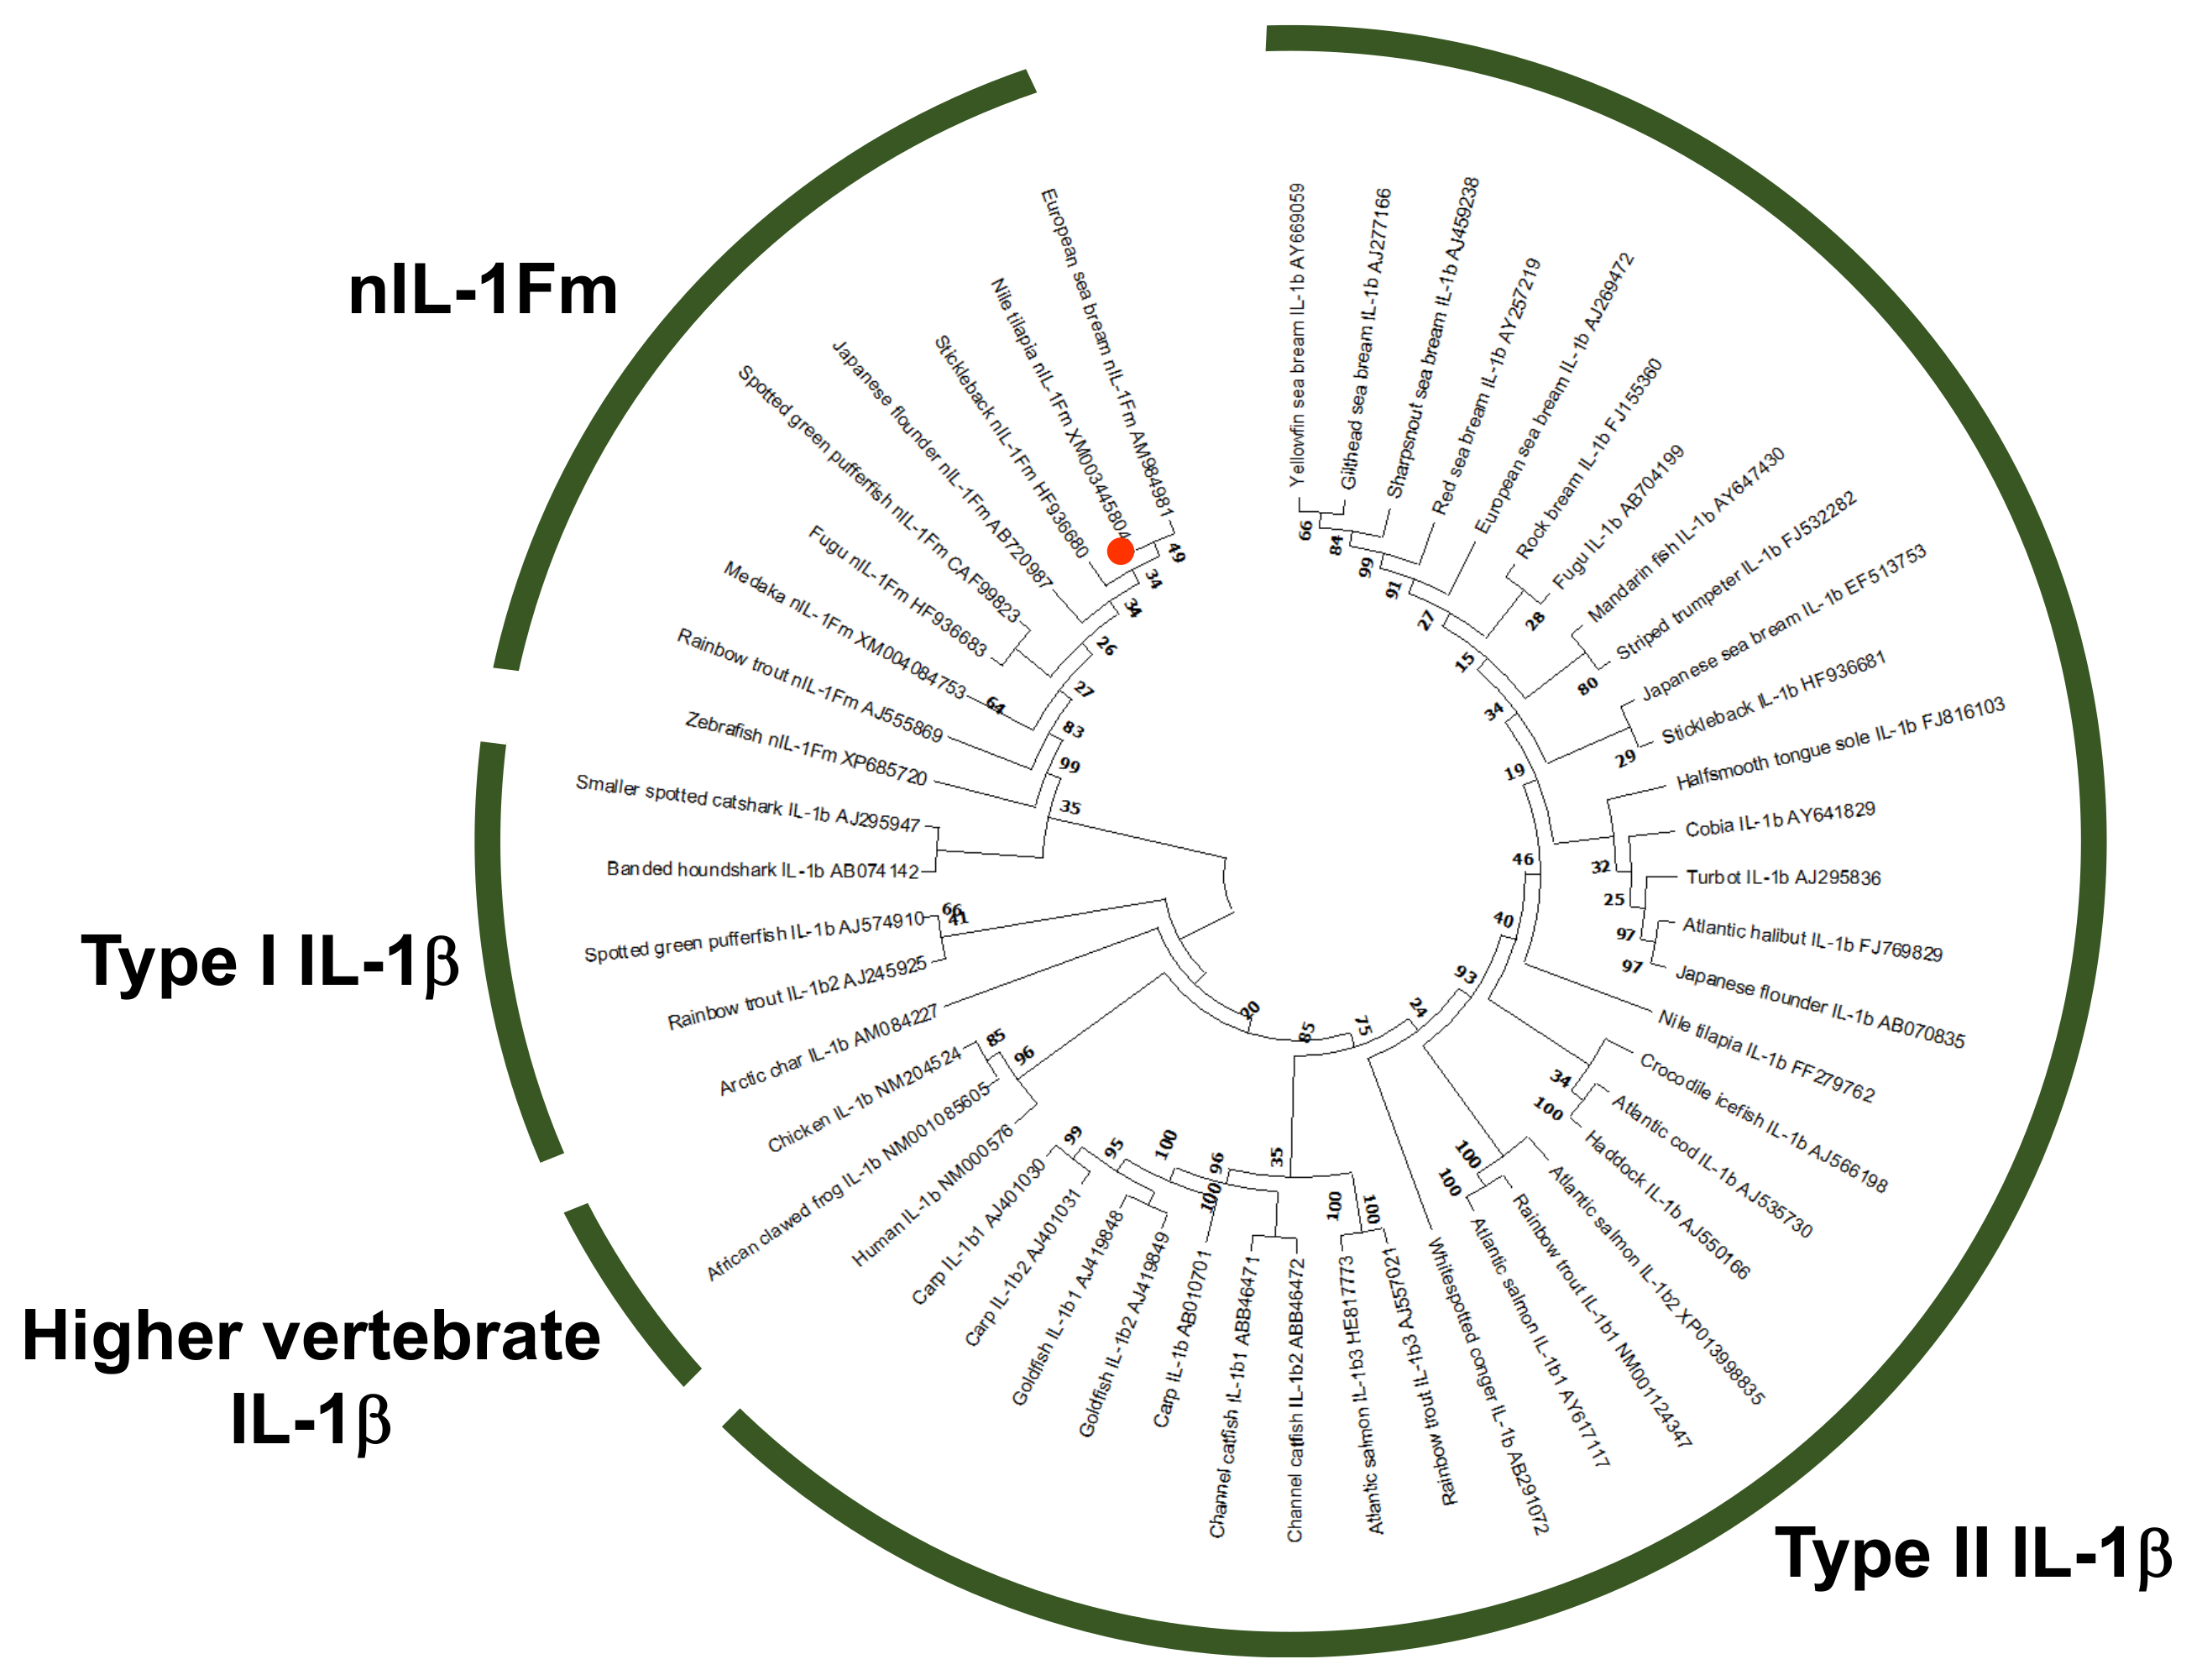
3.3. Phylogenetic Analysis of nIL-1Fm

Using the amino acid sequences of selected teleost nIL-1Fm molecules, a phylogenetic tree was constructed to study the evolutionary relationship between Nile tilapia nIL-1Fm and other teleost fish (Figure 4). The result showed that the nIL-1Fm proteins of Perciformes fish were clustered into a branch, and those of other fish gathered together in other branches, respectively.

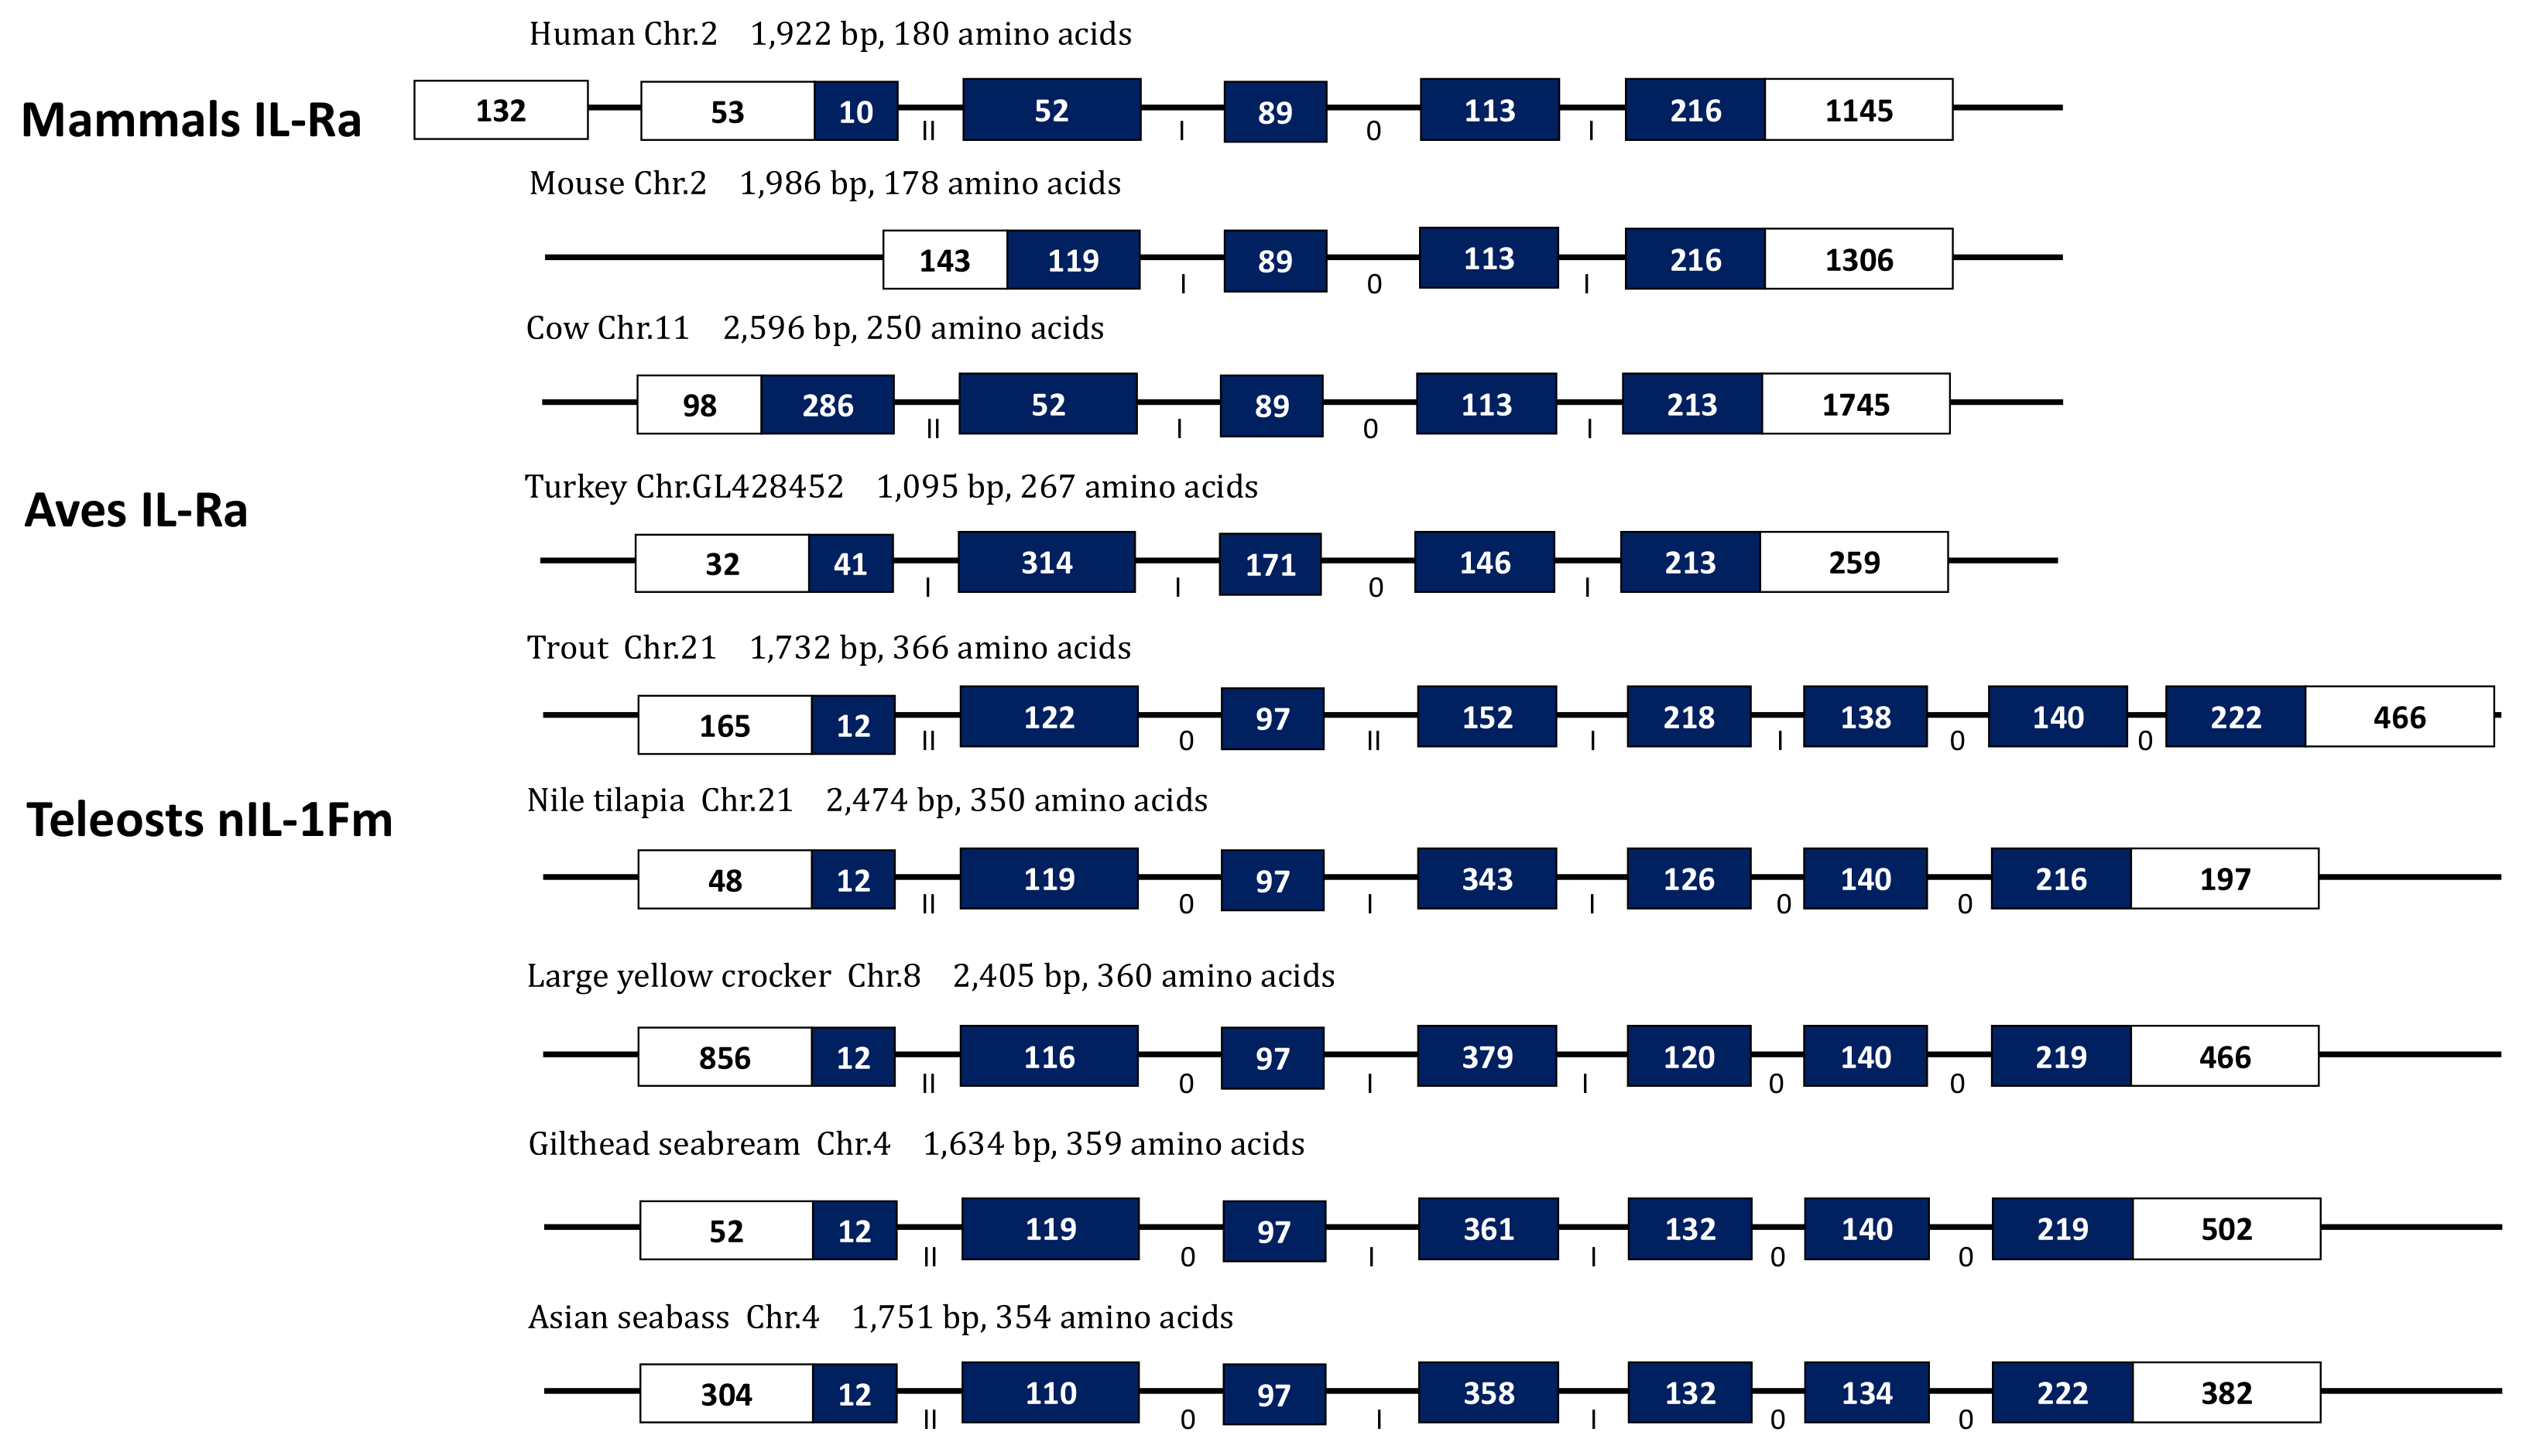
3.4. Gene Organization of Nile Tilapia nIL-1Fm

The nIL-1Fm gene in Nile tilapia has a seven exon/six intron organization, which is unique of the nIL-1Fm genes of other fish species (Figure 5). The nIL-1Fm/IL-1Ra genes had a range of 1095 bp to 2596 bp in length from teleosts to mammals, with the shortest identified in turkey and the longest in cow, respectively. Different exon sizes exist in this gene depending on the cellular lineage. Exon 4 of the teleost nIL-1Fm genes contains a large coding region. The Nile tilapia nIL-1Fm gene had a relatively smaller exon 3 (97 bp) but a larger exon 4 (343 bp). In general, Nile tilapia nIL-1Fm had greater similarity with nIL-1Fm from other fish species.

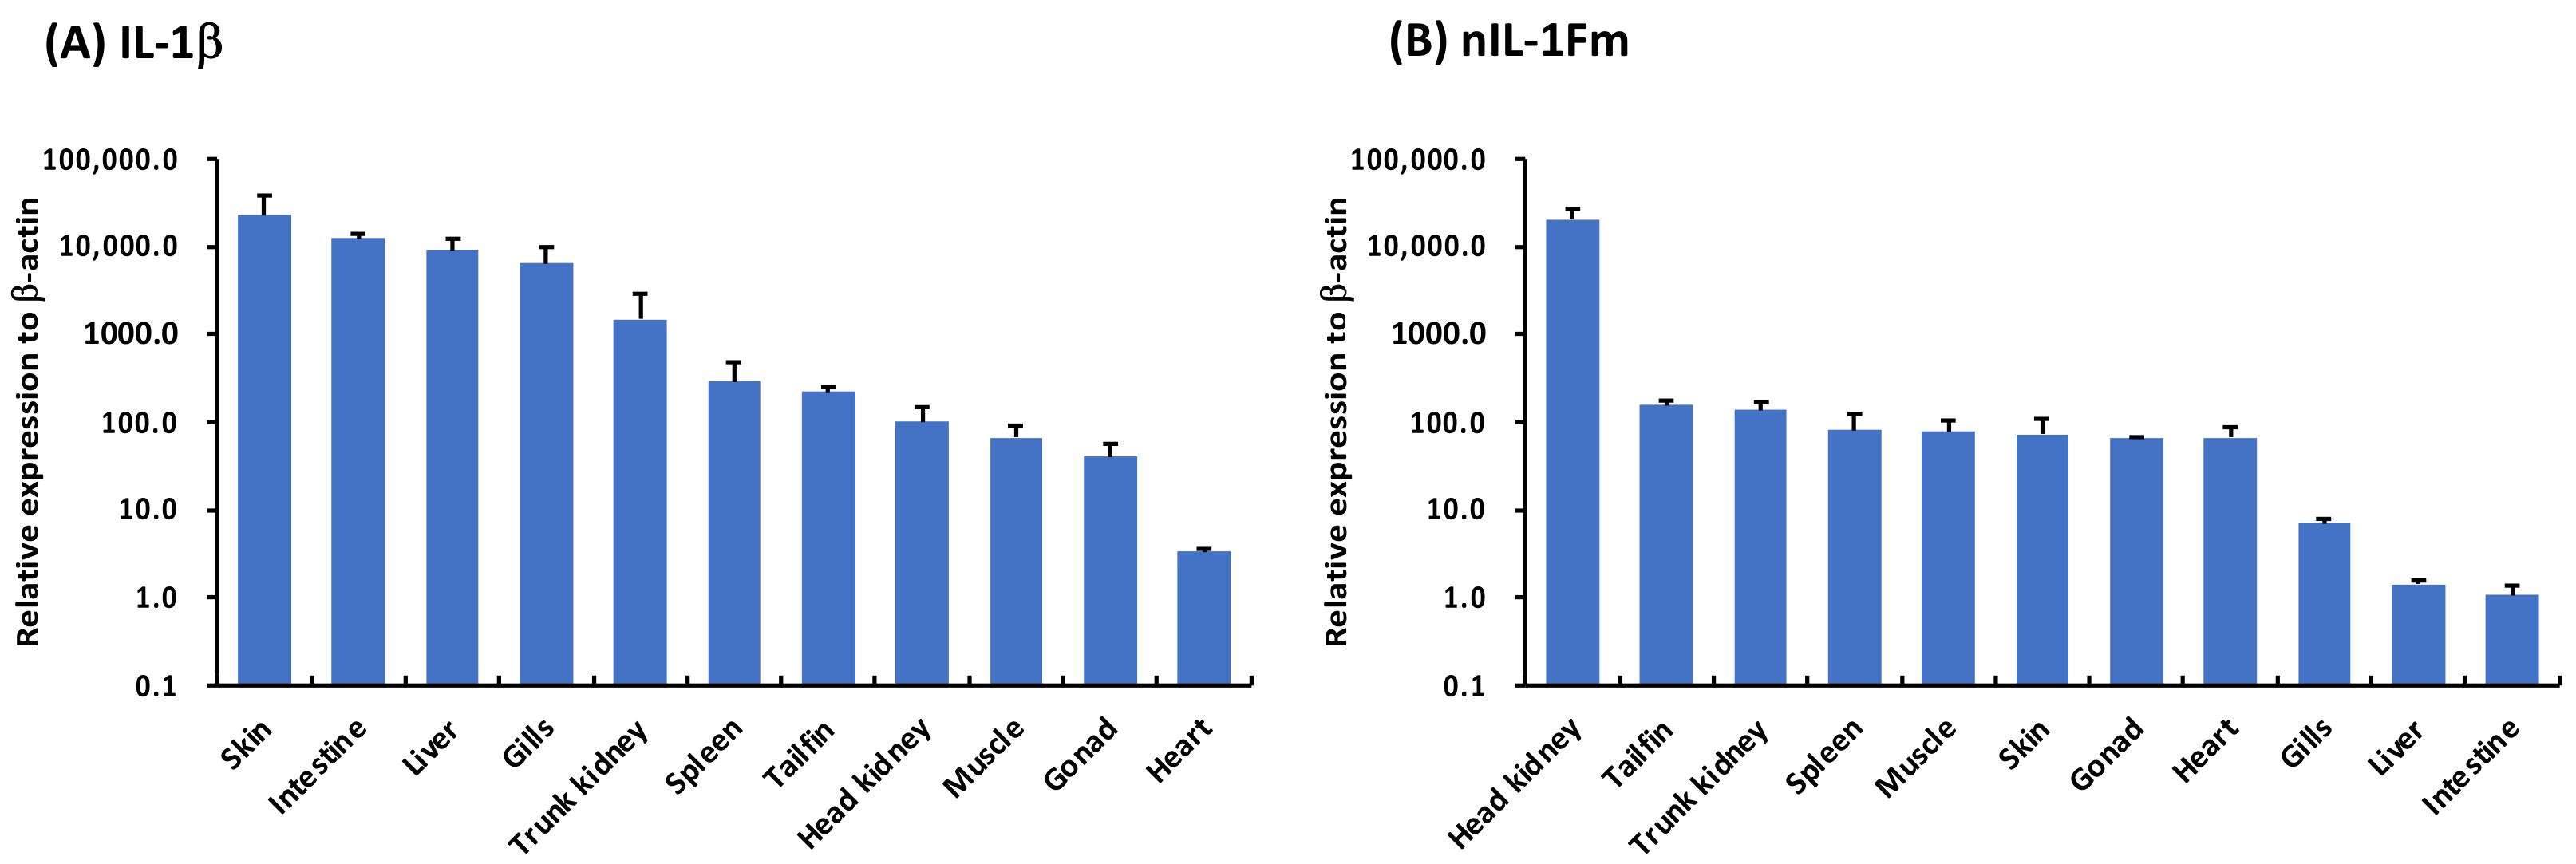
3.5. Tissue Distribution

It is known that IL-1β has been cloned in Nile tilapia [14]. Its expression in various fish tissues has not, however, been reported in healthy fish. The relative mRNA expression levels of the Nile tilapia genes IL-1β and nIL-1Fm were evaluated using qRT-PCR analysis to provide further details regarding the gene expression of both genes (Figure 6). In the current investigation, nIL-1Fm expression could be found in all tissues examined. In comparison to the expression of the IL-1β, nIL-1F expression level was noticeably higher in the head kidney, tailfin and trunk kidney, followed by the spleen. In the meantime, IL-1β expression was also found in all tissues investigated, with skin exhibiting the highest and heart exhibiting the lowest levels.

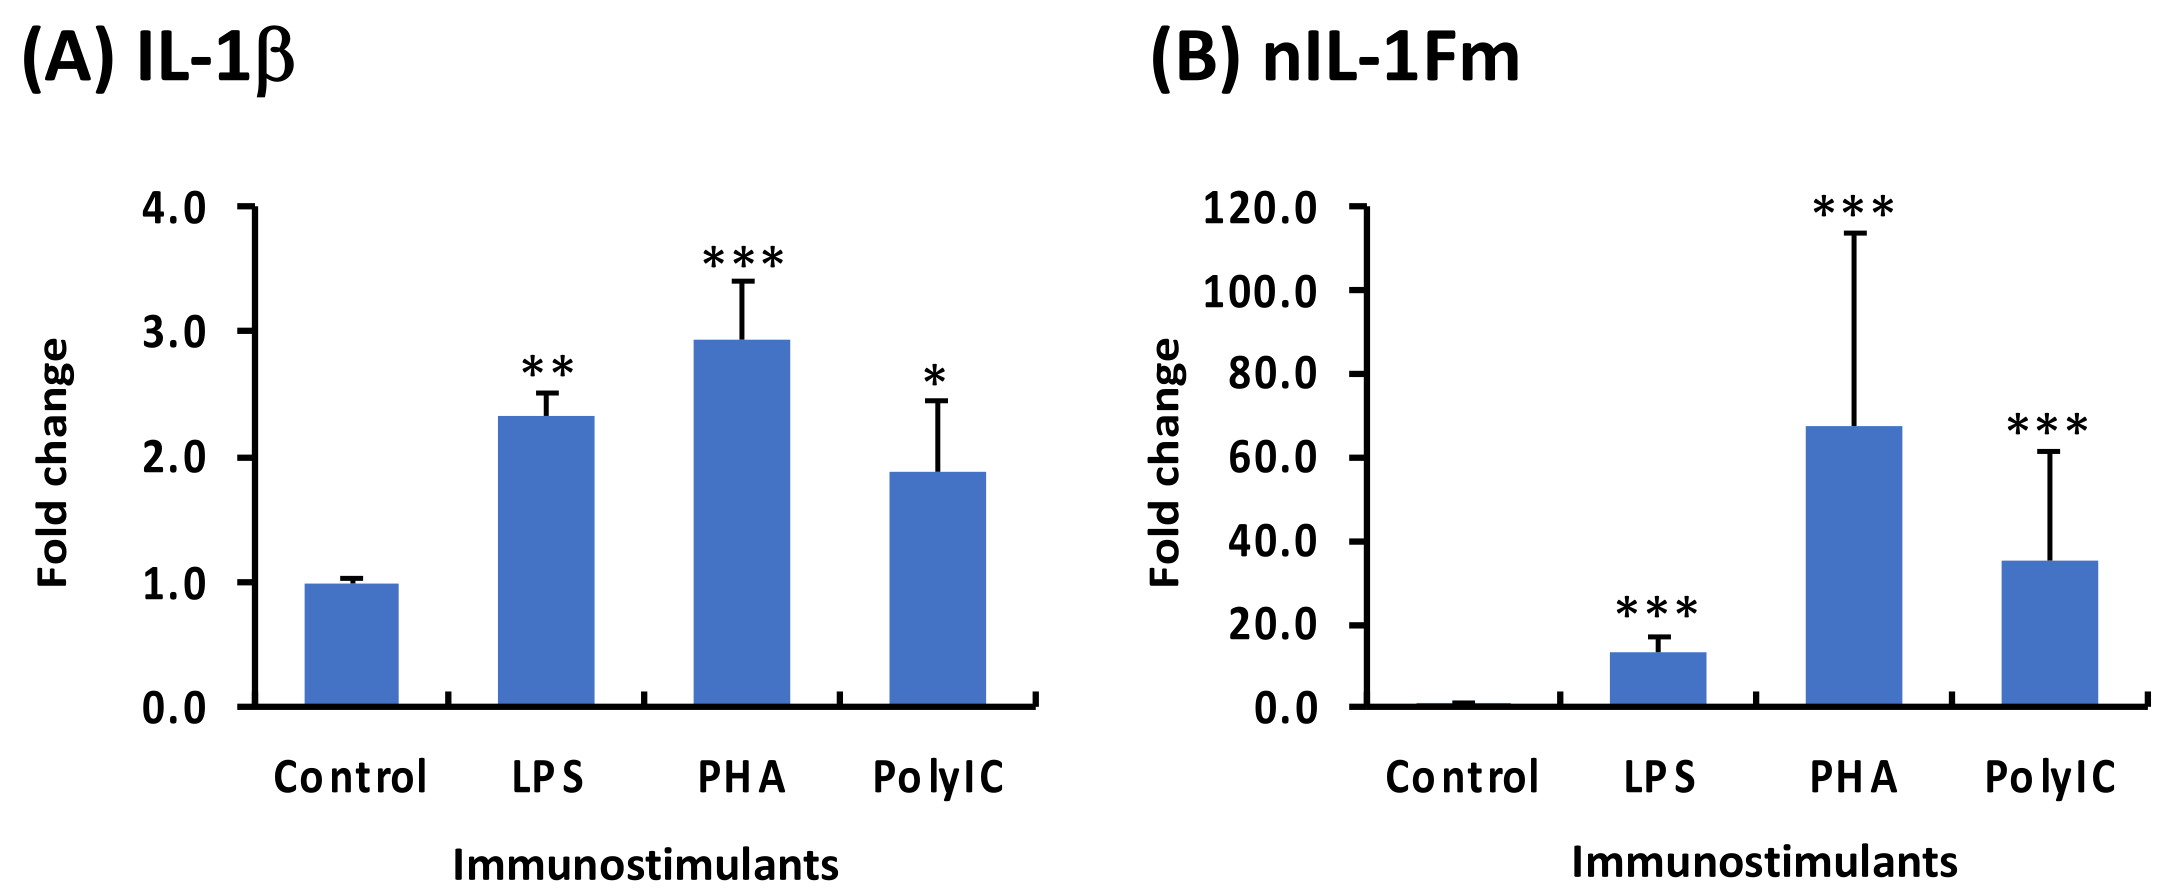
3.6. Modulation of IL-1β and nIL-1Fm Expression to PAMPs in PBLs

LPS, PHA, and poly (I:C) were applied to freshly prepared PBLs for 4 h in order to assess the expression levels mediated by these different immunostimulants (Figure 7). Both Nile tilapia IL-1β and nIL-1Fm were highly increased by LPS, PHA, and poly (I:C) following stimulation (p < 0.05).

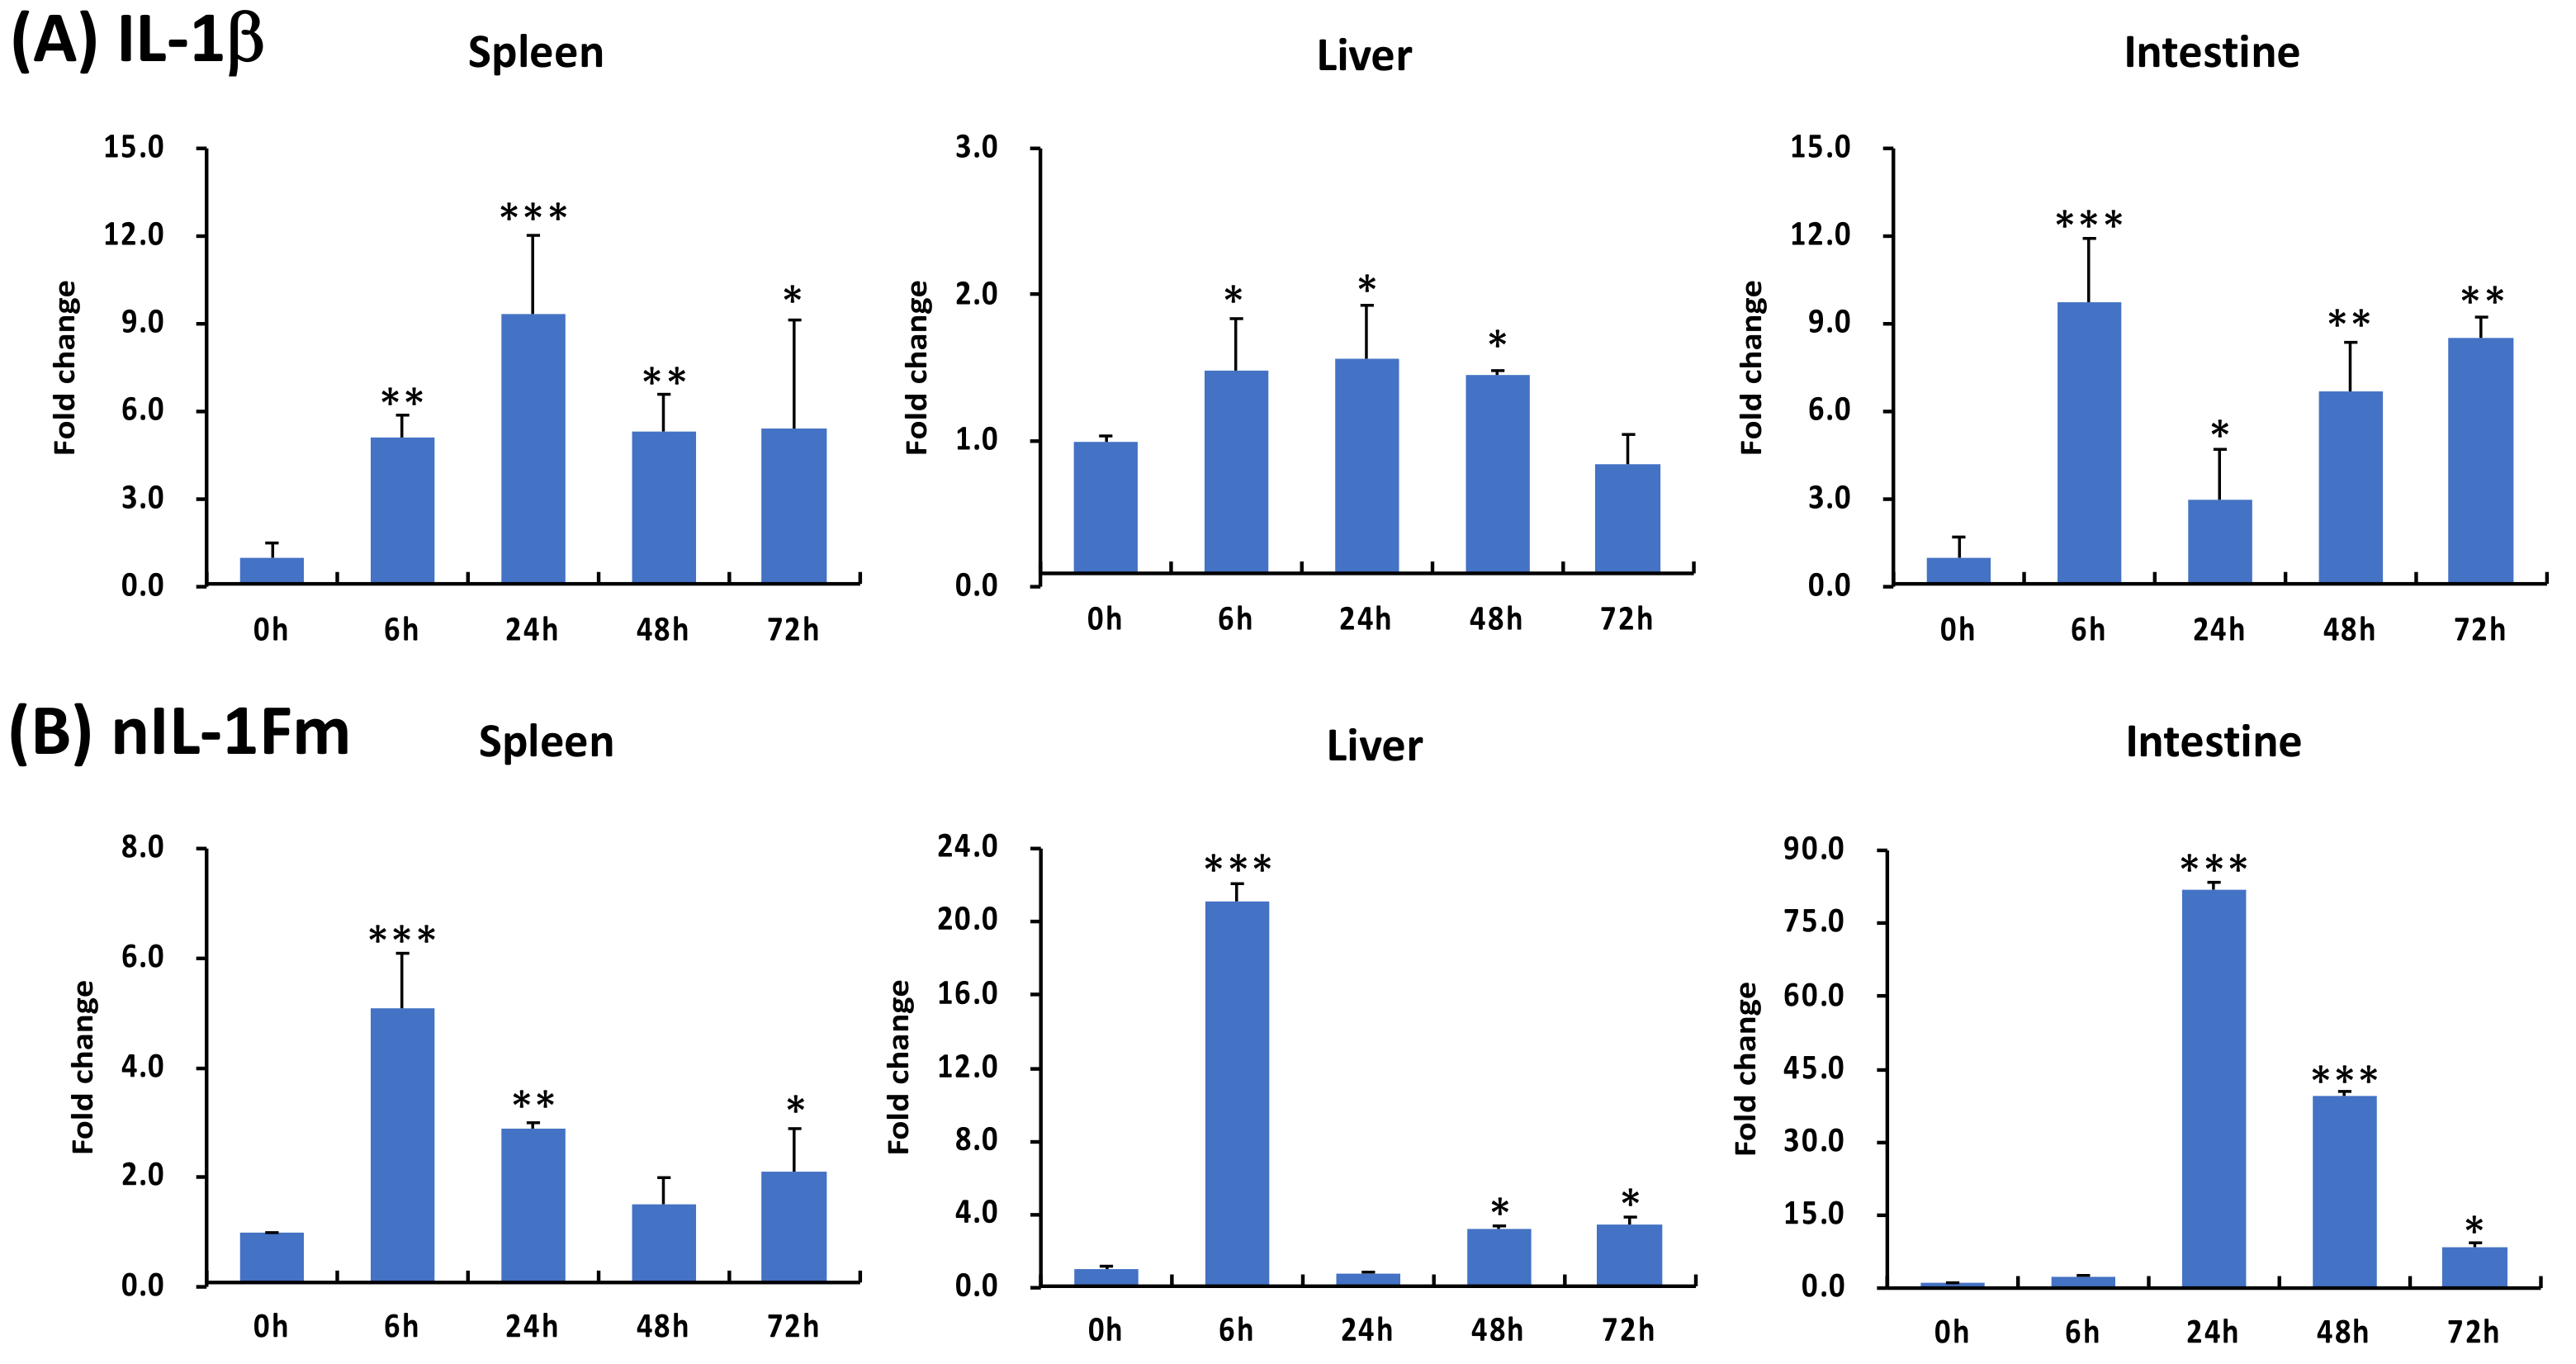
3.7. Expression Profiles of IL-1β and nIL-1Fm in Response to LPS

The modulation of the expression of Nile tilapia IL-1β and nIL-1Fm transcripts was assessed in PBLs stimulated with LPS (Figure 8). The LPS treatment affected the expression of both the IL-1β and nIL-1Fm transcripts. At a dose of 1 μg/mL LPS, the expression of IL-1β was up-regulated and showed the highest fold increase (p < 0.001); it also decreased at increasing concentrations but remained significantly higher than the control. Interestingly, LPS treatment also induced nIL-1Fm transcript expression in PBL cells, after stimulations. From 1 to 100 g/mL LPS, the expression of Nile tilapia nIL-1Fm was up-regulated in a dose-dependent manner, with the maximum fold induction observed at 100 μg/mL LPS (p < 0.001).

3.8. Expression of IL-1β and nIL-1Fm under S. agalactiae Challenge

To further investigate the temporal changes in IL-1β and nIL-1Fm levels in response to S. agalactiae infection, spleen, liver and intestine were determined by qRT-PCR. S. agalactiae infection significantly increased the expression of IL-1β in the spleen at 6–72 h, peaking at 24 h (p < 0.001) (Figure 9A). In the gills, it was lowly expressed constitutively in the liver at 6–48 h (p < 0.05), but was not modulated at 72 h after infection. In the intestine, the expression level of the IL-1β increased from 6 to 72 h after infection and peaked at 6 h (p < 0.001).
In comparison to the IL-1β, the expression of nIL-1Fm was up-regulated during S. agalactiae infection (Figure 9B). The current study demonstrated that the level of nIL-1Fm in the spleen significantly increased during 6 and 24 h after injection and peaked at 6 h (p < 0.001). The expression in the liver was significantly up-regulated, with a peak at 6 h (p < 0.001). The expression in the intestine was up-regulated at 24–72 h, with a peak at 24 h (p < 0.001).

4. Discussion

Immunoglobulin and Toll/IL-1 receptor domains are the receptors for the IL-1 cytokine family members, which are essential parts of the innate immune response and play an essential role in controlling inflammatory responses [37]. It is generally accepted that IL-1β is produced by attaching to its receptor (IL-1R) on the cell surface of the target cell, which triggers the synthesis of novel genes or the alteration of proteins [38]. In mammals, nIL-1Fm is an antagonist of IL-1Ra and possesses two receptors, IL-1R1 and IL-1R2 [39]. In fish, the first nIL-1Fm gene was identified from rainbow trout (O. mykiss) by suppression subtraction hybridization and sequence analysis [21]. Thus far, according to the published data, nIL-1Fm has been identified in many fish species [19,23,24]. Our study reports the sequence analysis of the nIL-1Fm gene, which is found in species that belong to the most evolutionary group of vertebrates., as well as its tissue distribution and its immune response in vivo and in vitro, to shed light on the complexity of this cytokine family.
In this paper, we first characterized the nIL-1Fm gene of Nile tilapia, with an ORF of 2474 bp, which encodes a putative protein of 350 amino acids. Similar to other fish species, this predicted protein lacked a signal peptide [19,21], demonstrating that nIL-1Fm is not secreted via the classical pathway. The PDZ domain, which is a binding site for the interacting proteins via a short peptide at the C-terminus [40], was found in the nIL-1Fm structure. A thrombin cleavage site (RGR), which is necessary for cleavage into a functional protein, was also present in Nile tilapia and other listed teleosts’ nIL-1Fm genes. The structure of nIL-1F exhibits the distinctive IL-1 signature as well [FC]-x-S-[ASLV]-x(2)-P-x(2)-[FYLIV]-[LI]-[SCA]-T-x(7)-[LIVM], indicating that nIL-1Fm may use the same immune regulatory mechanism. Seven exons and six introns were found to be present in the gene structure of nIL-1F, which is similar to that of the majority of fish species (Figure 5). High sequence identity within and among species was found in the nIL-1Fm genes, indicating that local gene duplication events resulted to these genes.
According to several alignments, the deduced Nile tilapia nIL-1Fm was well conserved with the known nIL-1F/IL-1Ra sequences in other vertebrates. In agreement with the multiple alignment analysis, the phylogenetic tree revealed that Nile tilapia first clustered with European seabass, stickleback, Japanese flounder and the teleost in a large cluster, supporting the traditional taxonomy [41]. The remarkable similarity of the amino acid sequences of the teleost by sequence alignment demonstrates that the IL-1 family signature domain is highly conserved throughout all selected fish species [42]. The synteny analysis of the nIL-1Fm loci in teleost fish provided more definitive evidence due to the observed gene conservation in several of these loci.
The nIL-1Fm acts as an IL-1 receptor antagonist, playing a significant part in the regulatory mechanisms behind the inhibition of IL-1 signaling observed in mammals [43]. nIL-1Fm was constitutively expressed in all examined tissues in healthy fish, suggesting that it may be involved in different biological functions. The highest levels of gene expression were found in the head kidney, followed by the tailfin, trunk kidney, spleen, muscle, skin, gonads, heart, gills, liver and intestine. The fish spleen is the greatest immune organ reacting to harmful microorganisms and is a significant systemic lymphoid tissue [44]. In teleosts, there are variations in the expression of nIL-1Fm. A previous study in rainbow trout showed that nIL-1Fm is significantly expressed in the liver, spleen, head kidney, intestine, and brain [21], while grass carp showed high expression of nIL-1Fm in the head kidney, trunk kidney, spleen and intestine [19]. This is in consistent with the reported expression profile in the current investigation, which showed that nIL-1Fm was comprehensively expressed in a range of tissues and that it serves a vital role in the immune response as well as many biological roles in a number of teleost species [27,45]. nIL-1Fm is an early proinflammatory cytokine of teleosts in response to vaccination [46,47]. In this report, the expression of nIL-1Fm was significantly increased after intraperitoneal injection with S. agalactiae, revealing its crucial role in the response to bacterial pathogens. nIL-1Fm transcription was significantly induced by Yersinia ruckeri in rainbow trout [21], and grass carp nIL-1Fm expression was also up-regulated when samples were exposed to Aeromonas hydrophila [19]. Therefore, fish nIL-1Fm may be involved in the host innate immune response, especially in host antibacterial signaling.
In PBLs stimulated with PAMPs, which are frequently used to simulate Gram-negative and Gram-positive bacteria, we also evaluated at the dynamic variations in nIL-1Fm expression. Our investigation found that LPS activated leukocytes to express nIL-1Fm, which is consistent with observations from earlier studies using this synthetic analog to stimulate other fish species either in vivo or in vitro. The LPS is the main component of Gram-negative bacteria, which can activate the NF-κB pathway and cause proinflammatory cytokines to engage in immune defense processes [48]. The results obtained previously by other researchers also showed the induction of nIL-1F to increase in RTS-11 cells by LPS and recombinant IL-1β stimulation [21]. In contrast, no influence of nIL-1Fm was demonstrated by poly I:C in the PBLs of Japanese flounder [24]. These results strongly suggest that a complex network mediates the impact of nIL-1Fm on the responses of various fish species to bacterial infection. Taken together, our results showed that nIL-1Fm was induced upon PAMPs stimulation with different expression patterns, implying that nIl-1Fm may be involved in the host immune response to infection. Therefore, the data here indicate that perhaps a functional homolog of an IL-1 receptor antagonist exists in fish. However, further study is needed to study the functions of nIL-1Fm during pathogen infection.

5. Conclusions

The results of this study showed that the nIL-1Fm gene from Nile tilapia had a typical IL-1 family signature. It plays an essential role in the innate immunity of fish to pathogens. In healthy fish, it is broadly expressed in a variety of tissues, with particularly high levels in the intestine, gills, liver, skin, and spleen. All immune organs examined showed a significant increase in nIL-1Fm following S. agalactiae infection. The expression of nIL-1Fm increased significantly after PAMP stimulation, indicating that this gene may play a significant role in the immune response. Our findings provide information for further studies into the immunological functions of this gene in Nile tilapia. To better understand the mechanism of disease resistance in fish, it is necessary to further explore the mechanism and functional roles of the immunological regulation of nIL-1Fm in the immune process.

Author Contributions

Conceptualization, E.W.; validation, E.W.; formal analysis, E.W., S.J., S.A., J.P., P.S., S.P. and Z.Q.; investigation, E.W., S.J., S.A., J.P., P.S. and S.P.; writing—original draft preparation, E.W.; writing—review and editing, E.W., S.J., S.A., J.P., P.S. and S.P.; investigation, E.W., S.J., S.A., J.P., P.S. and S.P.; funding acquisition, E.W. All authors have read and agreed to the published version of the manuscript.

Funding

This research project was financially supported by Thailand Science Research and Innovation (TSRI) and Mahasarakham University (Grant No. 6506032/2565).

Informed Consent Statement

Not applicable.

Data Availability Statement

The data presented in this study are available upon request from the corresponding author.

Acknowledgments

We thank the Division of Fisheries, Department of Agricultural Technology, Faculty of Technology, Mahasarakham University for providing all equipment during the experiment.

Conflicts of Interest

The authors declare that they have no conflict of interest in this work.

References

  1. Boersma, B.; Jiskoot, W.; Lowe, P.; Bourquin, C. The interleukin-1 cytokine family members: Role in cancer pathogenesis and potential therapeutic applications in cancer immunotherapy. Cytokine Growth Factor Rev. 2021, 62, 1–14. [Google Scholar] [PubMed]
  2. Dinarello, C.A. The history of fever, leukocytic pyrogen and interleukin-1. Temperature 2015, 2, 8–16. [Google Scholar]
  3. March, C.J.; Mosley, B.; Larsen, A.; Cerretti, D.P.; Braedt, G.; Price, V.; Gillis, S.; Henney, C.S.; Kronheim, S.R.; Grabstein, K.; et al. Cloning, sequence and expression of two distinct human interleukin-1 complementary DNAs. Nature 1985, 315, 641–647. [Google Scholar] [PubMed]
  4. Lin, H.; Ho, A.S.; Haley-Vicente, D.; Zhang, J.; Bernal-Fussell, J.; Pace, A.M.; Hansen, D.; Schweighofer, K.; Mize, N.K.; Ford, J.E. Cloning and characterization of IL-1HY2, a novel interleukin-1 family member. J. Biol. Chem. 2001, 276, 20597–20602. [Google Scholar]
  5. Secombes, C.J.; Wang, T.; Hong, S.; Peddie, S.; Crampe, M.; Laing, K.J.; Cunningham, C.; Zou, J. Cytokines and innate immunity of fish. Dev. Comp. Immunol. 2001, 25, 713–723. [Google Scholar]
  6. Secombes, C.J.; Wang, T.; Bird, S. The interleukins of fish. Dev. Comp. Immunol. 2011, 35, 1336–1345. [Google Scholar]
  7. Bird, S.; Zou, J.; Wang, T.; Munday, B.; Cunningham, C.; Secombes, C.J. Evolution of interleukin-1b. Cytokine Growth Factor Rev. 2002, 13, 483–502. [Google Scholar]
  8. Zou, J.; Secombes, C.J. The function of fish cytokines. Biology 2016, 5, 23. [Google Scholar]
  9. Secombes, C.; Zou, J.; Daniels, G.; Cunningham, C.; Koussounadis, A.; Kemp, G. Rainbow trout cytokine and cytokine receptor genes. Immunol. Rev. 1998, 166, 333–340. [Google Scholar]
  10. Fujiki, K.; Shin, D.H.; Nakao, M.; Yano, T. Molecular cloning and expression analysis of carp (Cyprinus carpio) interleukin-1β, high affinity immunoglobulin E Fc receptor γ subunit and serum amyloid A. Fish Shellfish Immunol. 2000, 10, 229–242. [Google Scholar]
  11. Pelegrín, P.; García-Castillo, J.; Mulero, V.; Meseguer, J. Interleukin-1β isolated from a marine fish reveals up-regulated expression in macrophages following activation with lipopolysaccharide and lymphokines. Cytokine 2001, 16, 67–72. [Google Scholar] [CrossRef]
  12. Emmadi, D.; Iwahori, A.; Hirono, I.; Aoki, T. cDNA microarray analysis of interleukin-1β-induced Japanese flounder Paralichthys olivaceus kidney cells. Fish Sci. 2005, 71, 519–530. [Google Scholar]
  13. Wang, Y.; Wang, Q.; Baoprasertkul, P.; Peatman, E.; Liu, Z. Genomic organization, gene duplication, and expression analysis of interleukin-1β in channel catfish (Ictalurus punctatus). Mol. Immunol. 2006, 43, 1653–1664. [Google Scholar] [PubMed]
  14. Lee, D.S.; Hong, S.H.; Lee, H.J.; Jun, L.J.; Chung, J.K.; Kim, K.H.; Do Jeong, H. Molecular cDNA cloning and analysis of the organization and expression of the IL-1β gene in the Nile tilapia, Oreochromis niloticus. Comp. Biochem. Physiol. Part A Mol. Integr. 2006, 143, 307–314. [Google Scholar]
  15. Corripio-Miyar, Y.; Bird, S.; Tsamopoulos, K.; Secombes, C.J. Cloning and expression analysis of two pro-inflammatory cytokines, IL-1β and IL-8, in haddock (Melanogrammus aeglefinus). Mol. Immunol. 2007, 44, 1361–1373. [Google Scholar] [PubMed]
  16. Lu, D.Q.; Bei, J.X.; Feng, L.N.; Zhang, Y.; Liu, X.C.; Wang, L.; Chen, J.L.; Lin, H.R. Interleukin-1β gene in orange-spotted grouper, Epinephelus coioides: Molecular cloning, expression, biological activities and signal transduction. Mol. Immunol. 2008, 45, 857–867. [Google Scholar]
  17. Seppola, M.; Larsen, A.N.; Steiro, K.; Robertsen, B.; Jensen, I. Characterisation and expression analysis of the interleukin genes, IL-1β, IL-8 and IL-10, in Atlantic cod (Gadus morhua L.). Mol. Immunol. 2008, 45, 887–897. [Google Scholar]
  18. Polinski, M.; Bridle, A.; Nowak, B. Temperature-induced transcription of inflammatory mediators and the influence of Hsp70 following LPS stimulation of southern bluefin tuna peripheral blood leukocytes and kidney homogenates. Fish Shellfish Immunol. 2013, 34, 1147–1157. [Google Scholar]
  19. Yao, F.; Yang, X.; Wang, X.; Wei, H.; Zhang, A.; Zhou, H. Molecular and functional characterization of an IL-1β receptor antagonist in grass carp (Ctenopharyngodon idella). Dev. Comp. Immunol. 2015, 49, 207–216. [Google Scholar]
  20. Bird, S.; Wang, T.; Zou, J.; Cunningham, C.; Secombes, C.J. The first cytokine sequence within cartilaginous fish: IL-1b in the small spotted catshark (Scyliorhinus canicula). J. Immunol. 2002, 168, 3329–3340. [Google Scholar] [PubMed]
  21. Wang, T.; Bird, S.; Koussounadis, A.; Holland, J.W.; Carrington, A.; Zou, J.; Secombes, C.J. Identification of a novel IL-1 cytokine family member in teleost fish. J. Immunol. 2009, 183, 962–974. [Google Scholar] [PubMed]
  22. Van de Veerdonk, F.L.; Netea, M.G. New insights in the immunobiology of IL-1 family members. Front. Immunol. 2013, 4, 167. [Google Scholar] [CrossRef] [PubMed]
  23. Angosto, D.; Montero, J.; Lopez-Munoz, A.; Alcaraz-Perez, F.; Bird, S.; Sarropoulou, E.; Abellán, E.; Meseguer, J.; Sepulcre, M.P.; Mulero, V. Identification and functional characterization of a new IL-1 family member, IL-1Fm2, in most evolutionarily advanced fish. Innate Immun. 2014, 20, 487–500. [Google Scholar] [PubMed]
  24. Taechavasonyoo, A.; Kondo, H.; Nozaki, R.; Suzuki, Y.; Hirono, I. Identification of novel interleukin 1 beta family genes in Japanese flounder Paralichthys olivaceus. Fish Shellfish Immunol. 2013, 34, 393–396. [Google Scholar] [PubMed]
  25. Pleguezuelos, O.; Zou, J.; Cunningham, C.; Secombes, C.J. Cloning, sequencing, and analysis of expression of a second IL-1 β gene in rainbow trout (Oncorhynchus mykiss). Immunogenetics 2000, 51, 1002–1011. [Google Scholar]
  26. Scapigliati, G.; Buonocore, F.; Bird, S.; Zou, J.; Pelegrin, P.; Falasca, C.; Prugnoli, D.; Secombes, C.J. Phylogeny of cytokines: Molecular cloning and expression analysis of sea bass Dicentrarchus labrax interleukin-1β. Fish Shellfish Immunol. 2001, 11, 711–726. [Google Scholar]
  27. Wangkaghart, E.; Deville, S.; Wang, B.; Srisapoome, P.; Wang, T.; Secombes, C.J. Immune response and protective efficacy of two new adjuvants, Montanide™ ISA 763B VG and Montanide™ GEL02, administered with a Streptococcus agalactiae ghost vaccine in Nile tilapia (Oreochromis niloticus). Fish Shellfish Immunol. 2021, 116, 19–29. [Google Scholar]
  28. Wangkahart, E.; Bruneel, B.; Wisetsri, T.; Nontasan, S.; Martin, S.A.; Chantiratikul, A. Interactive effects of dietary lipid and nutritional emulsifier supplementation on growth, chemical composition, immune response and lipid metabolism of juvenile Nile tilapia (Oreochromis niloticus). Aquaculture 2022, 546, 737341. [Google Scholar]
  29. Wangkahart, E.; Wachiraamonloed, S.; Lee, P.T.; Subramani, P.A.; Qi, Z.; Wang, B. Impacts of Aegle marmelos fruit extract as a medicinal herb on growth performance, antioxidant and immune responses, digestive enzymes, and disease resistance against Streptococcus agalactiae in Nile tilapia (Oreochromis niloticus). Fish Shellfish Immunol. 2022, 120, 402–410. [Google Scholar]
  30. Wang, B.; Wangkahart, E.; Secombes, C.J.; Wang, T. Insights into the evolution of the suppressors of cytokine signaling (SOCS) gene family in vertebrates. Mol. Biol. Evol. 2019, 36, 393–411. [Google Scholar]
  31. Louis, A.; Muffato, M.; Roest Crollius, H. Genomicus: Five genome browsers for comparative genomics in eukaryota. Nucleic Acids Res. 2012, 41, 700–705. [Google Scholar] [CrossRef] [PubMed]
  32. Kumar, S.; Nei, M.; Dudley, J.; Tamura, K. MEGA: A biologist-centric software for evolutionary analysis of DNA and protein sequences. Brief. Bioinform. 2008, 9, 299–306. [Google Scholar] [CrossRef]
  33. Xu, Q.; Jiang, Y.; Wangkahart, E.; Zou, J.; Chang, M.; Yang, D.; Secombes, C.J.; Nie, P.; Wang, T. Sequence and expression analysis of interferon regulatory factor 10 (IRF10) in three diverse teleost fish reveals its role in antiviral defense. PLoS ONE 2016, 11, e0147181. [Google Scholar] [CrossRef]
  34. Wangkahart, E.; Scott, C.; Secombes, C.J.; Wang, T. Re-examination of the rainbow trout (Oncorhynchus mykiss) immune response to flagellin: Yersinia ruckeri flagellin is a potent activator of acute phase proteins, anti-microbial peptides and pro-inflammatory cytokines in vitro. Dev. Comp. Immunol. 2016, 57, 75–87. [Google Scholar] [CrossRef] [PubMed]
  35. Benedicenti, O.; Wang, T.; Wangkahart, E.; Milne, D.J.; Holland, J.W.; Collins, C.; Secombes, C.J. Characterisation of arginase paralogues in salmonids and their modulation by immune stimulation/infection. Fish Shellfish Immunol. 2017, 61, 138–151. [Google Scholar] [CrossRef]
  36. Hu, Y.; Maisey, K.; Subramani, P.A.; Liu, F.; Flores-Kossack, C.; Imarai, M.; Secombes, C.J.; Wang, T. Characterisation of rainbow trout peripheral blood leucocytes prepared by hypotonic lysis of erythrocytes, and analysis of their phagocytic activity, proliferation and response to PAMPs and proinflammatory cytokines. Dev. Comp. Immunol. 2018, 88, 104–113. [Google Scholar] [CrossRef]
  37. Subramaniam, S.; Stansberg, C.; Cunningham, C. The interleukin 1 receptor family. Dev. Comp. Immunol. 2004, 28, 415–428. [Google Scholar] [CrossRef] [PubMed]
  38. Boraschi, D.; Tagliabue, A. The interleukin-1 receptor family. In Seminars in Immunology; Academic Press: Cambridge, MA, USA, 2013; Volume 25, pp. 394–407. [Google Scholar]
  39. Dinarello, C.A.; Thompson, R.C. Blocking IL-1: Interleukin 1 receptor antagonist in vivo and in vitro. Immunol. Today 1991, 12, 404–410. [Google Scholar] [CrossRef]
  40. Fanning, A.S.; Anderson, J.M. Protein–protein interactions: PDZ domain networks. Curr. Biol. 1996, 6, 1385–1388. [Google Scholar] [CrossRef]
  41. Eisenberg, S.P.; Brewer, M.T.; Verderber, E.; Heimdal, P.; Brandhuber, B.J.; Thompson, R.C. Interleukin 1 receptor antagonist is a member of the interleukin 1 gene family: Evolution of a cytokine control mechanism. Proc. Natl. Acad. Sci. USA 1991, 88, 5232–5236. [Google Scholar] [CrossRef] [Green Version]
  42. Rivers-Auty, J.; Daniels, M.J.; Colliver, I.; Robertson, D.L.; Brough, D. Redefining the ancestral origins of the interleukin-1 superfamily. Nat. Commun. 2018, 9, 1156. [Google Scholar] [CrossRef]
  43. Hurme, M.; Santtila, S. IL-1 receptor antagonist (IL-1Ra) plasma levels are co-ordinately regulated by both IL-1Ra and IL-1β genes. Eur. J. Immunol. 1998, 28, 2598–2602. [Google Scholar] [CrossRef]
  44. Martin, S.A.; Dehler, C.E.; Król, E. Transcriptomic responses in the fish intestine. Dev. Comp. Immunol. 2016, 64, 103–117. [Google Scholar] [CrossRef]
  45. Yamaguchi, T.; Chang, C.J.; Karger, A.; Keller, M.; Pfaff, F.; Wangkahart, E.; Wang, T.; Secombes, C.J.; Kimoto, A.; Furihata, M.; et al. Ancient cytokine interleukin 15-like (IL-15L) induces a type 2 immune response. Front. Immunol. 2020, 5, 2384. [Google Scholar] [CrossRef]
  46. Wangkahart, E.; Secombes, C.J.; Wang, T. Dissecting the immune pathways stimulated following injection vaccination of rainbow trout (Oncorhynchus mykiss) against enteric redmouth disease (ERM). Fish Shellfish Immunol. 2019, 85, 18–30. [Google Scholar] [CrossRef] [PubMed]
  47. Wangkahart, E.; Secombes, C.J.; Wang, T. Studies on the use of flagellin as an immunostimulant and vaccine adjuvant in fish aquaculture. Front. Immunol. 2019, 9, 3054. [Google Scholar] [CrossRef]
  48. Bryant, C.E.; Spring, D.R.; Gangloff, M.; Gay, N.J. The molecular basis of the host response to lipopolysaccharide. Nat. Rev. Microbiol. 2010, 8, 8–14. [Google Scholar] [CrossRef]
Figure 1. The structure of Nile tilapia nIL-1F. Under the nucleotide sequence, the amino acid sequence is displayed with one-letter codes. The start codon (ATG) and stop codon (TGA) are bold and asterisk (*) also represents the stop codons. The PDZ domain is shaded in green and interleukin-1 homologs is shaded in grey. The thrombin cut site (RGR) is shown in bold and underlined. The potential N-glycosylation sites (NXT) are in bold and boxed.
Jmse 10 01272 g001
Figure 2. Multiple alignments between the known nIL-1Fm sequences in various vertebrates and the deduced Nile tilapia nIL-1F gene. Asterisks (*) indicate amino acid residues that are identical to those in the Nile tilapia. Dot (.) and colon (:) indicate positions of similar amino acid residues that are similar sequence. Dashes (-) indicate gaps introduced for maximal alignment.
Jmse 10 01272 g002
Figure 3. Comparison of the gene organization of Nile tilapia nIL-1Fm gene with nIL-1Fm genes of other fish and mammals.
Jmse 10 01272 g003
Figure 4. Phylogenetic tree of nIL-1F, type I, and type II IL-1β and other known homologues derived from GenBank. The Nile tilapia nIL-1Fm was indicated by red circle.
Jmse 10 01272 g004
Figure 5. Comparison of the gene organization of Nile tilapia nIL-1Fm gene with nIL-1Fm genes of other fish or higher vertebrate IL-1Ra.
Jmse 10 01272 g005
Figure 6. Tissue distribution of (A) IL-1β and (B) nIL-1Fm transcripts in healthy Nile tilapia. qRT-PCR was used to determine the expression level of IL-1β and nIL-1F in 11 organs from four fish. The relative expression level was normalized to the level of β-actin. The results are the mean + SEM of four fish.
Jmse 10 01272 g006
Figure 7. Modulation of IL-1β (A) and nIL-1Fm (B) gene expression in the PBLs by LPS, PHA and poly (I:C). The cells were stimulated with different immunostimulants, and culture medium as a control. The expression was conducted by qRT-PCR. The fold change in comparison to the control was presented as the expression levels were normalized by β-actin. The results are presented as mean  +  SEM. One-way analysis of variance was used to statistically compare the observed mRNA levels (* p < 0.05, ** p < 0.01, *** p < 0.001).
Jmse 10 01272 g007
Figure 8. Modulation of IL-1β (A) and nIL-1Fm (B) gene expression in PBLs by LPS. The cells were stimulated with different immunostimulants, and medium as a control. The expression was conducted by qRT-PCR. The fold change in comparison to the control was presented as the expression levels were normalized by β-actin. The results are presented as mean  +  SEM. One-way analysis of variance was used to statistically compare the observed mRNA levels (* p < 0.05, *** p < 0.001).
Jmse 10 01272 g008
Figure 9. Comparative expression of IL-1 (A) and nIL-1F (B) in the liver, gut, and spleen of bacterial-infected with S. agalactiae in Nile tilapia. Samples from four fish were collected at 6, 24, 48, and 72 h post bacterial infection. The fold change in comparison to the control was presented as the expression levels were normalized by β-actin (which was set to 1). The results are presented as mean  +  SEM. One-way analysis of variance (ANOVA) was used to compare the gene expression levels (* p < 0.05, ** p < 0.01, *** p < 0.001).
Jmse 10 01272 g009
Table 1. Set of primers used in this study.
Gene NamePrimer NamePrimer Sequence (5′–3′)Application
nIL-1FmFull IL-1X FATGGACACGAAGGAGTCTCTGGTCloning
Full IL-1X RTCACTTTTGAATGATGAAGAGGAACloning
IL-1X FGGAGGATGACCCGGAGGGAAqRT-PCR
IL-1X RATCACAGCCCCTGCCTCTCAqRT-PCR
IL-1βIL-1B FAAGATGAATTGTGGAGCTGTGTTqRT-PCR
IL-1B RAAAAGCATCGACAGTATGTGAAATqRT-PCR
β-actinβ-actin FACAGGATGCAGAAGGAGATCACAGqRT-PCR
β-actin RGTACTCCTGCTTGCTGATCCACATqRT-PCR
Table 2. The species name, the GenBank ID, the length and mature peptides and their identity with Nile tilapia nIL-1Fm.
Species NameGenBank IDLength (bp)ORF (AA)Mw (kDa)/pISimilarity (%)Identity (%)
Mammalian IL-1Ra
HumanCAA36262174017720.05/5.8217.711.7
Rhesus monkeyXP_001091833172317719.89/6.8919.612.9
Bird IL-1Ra
ChickenCCD8311955417319.37/8.6819.79.3
DuckXP_03206006751516218.17/7.7422.111.6
Fish nIL-1Fm
Nile tilapiaON568309247435039.12/4.97--
Common carpXM_042734003176635340.40/5.2247.832.6
Fathead minnowXP_039529760201634739.07/5.1349.133.4
Grass carp KM066966126034739.48/4.9649.133.4
ZebrafishNP_001277347107135639.55/5.1749.632.6
Channel catfishXP_017314635203435439.35/5.4551.735.7
Rainbow troutAJ555869173636541.18/5.6760.045.4
Medaka XM004084753138034839.57/7.5365.147.4
FuguHF936683112237342.27/5.2167.850.7
Flounder AB720987108335439.83/5.1568.850.4
Asian seabassXP_018539191216135439.77/5.5969.855.4
Gilthead seabreamXP_030271237187935939.82/5.6373.157.3
Yellow croakerXP_010730145178536039.97/5.3076.161.3
Publisher’s Note: MDPI stays neutral with regard to jurisdictional claims in published maps and institutional affiliations.

