Article

A Comparative Centrifuge Test Study on the Influence of Overlying Seawater on Seismic Response Spectrum

1
Key Laboratory of Earthquake Engineering and Engineering Vibration, Institute of Engineering Mechanics, China Earthquake Administration, Key Laboratory of Earthquake Disaster Mitigation, Ministry of Emergency Management, Harbin 150080, China
2
College of Civil Engineering and Architecture, Guilin University of Technology, Guilin 541004, China
3
Guangxi Key Laboratory of Geomechanics and Geotechnical Engineering, Guilin University of Technology, Guilin 541004, China
*
Author to whom correspondence should be addressed.
J. Mar. Sci. Eng. 2023, 11(1), 167; https://doi.org/10.3390/jmse11010167
Submission received: 26 December 2022 / Revised: 5 January 2023 / Accepted: 6 January 2023 / Published: 10 January 2023
(This article belongs to the Section Marine Hazards)

Abstract

:
In this study, dynamic centrifugal model tests for two homogeneous saturated soft clay sites are designed to analyze the influence of overlying sea water on ground motion. We obtain the response spectrum value and amplification coefficient from the acceleration sensor records. Through comparative analysis, we conclude that with the increase in input peak ground motion, the acceleration response spectrum value at the same depth gradually increases. When the input peak value is small, there is no significant difference between the response spectra with and without water; when the input peak value is large, there is no significant difference in the high-frequency part of the response spectrum value. In the middle- and low-frequency part, the response spectrum value with water is obviously smaller than that without water. The amplitude of the response spectrum of the water-free model gradually moves in the long-period direction, but the water model tends to the short-period direction. In the long-period part, the amplification coefficient of the water model is obviously smaller than that of the water free model.

1. Introduction

According to the information from the global seismic network, about 85% of the global earthquakes occur in the sea. Especially in recent years, there have been several major offshore earthquakes, such as the magnitude 8.9 earthquake in the waters near the island of Sumatra in Indonesia in 2004, the magnitude 8.8 earthquake in Chile in 2010, and the magnitude 8.9 earthquake on the northeastern coast of Japan in 2011. The strong tsunamis that these earthquakes triggered have aggravated the seismic hazards on land. Earthquake disasters on land cause serious damage to engineered constructions in offshore areas, resulting in huge casualties and property losses. Therefore, marine engineering safety and earthquake disaster risks have attracted widespread attention.
Site conditions are some of the important factors affecting earthquake damage and ground motion [1], and motion observation records are the most effective basic data for the qualitative and quantitative study of site response. Boore and Smith [2] collated and analyzed the data recorded by SEMS from 1979 to 1997, and concluded that sea water has little influence on horizontal seismic ground motion, which may be due to the resonance between P waves and the seawater layer. Based on a sea area seismic record of a SEMS station in the USA, Sleepfe [3] concluded that the horizontal peak acceleration of the affected sea area is close to that of the affected land area, and the vertical peak acceleration of seabed earthquakes is smaller than that of the land ground motion. Chen et al. [4] concluded that the vertical and horizontal peak acceleration ratio of sea ground motion is half of that of land ground motion. When the period is less than 0.8 s, the ratio of vertical-to-horizontal peak acceleration of the sea ground motion is less than that of land motion. Diao et al. [5] reached the same conclusion as Boore through SEMS station record and further concluded that the ratio of the vertical to the horizontal parts of long-period sea ground motion is smaller than that of land ground motion, and the peak spectrum moves in the long-period direction. With the increase in the period, the influence of sea water becomes smaller. However, as marine observation technology requires further development and given the lack of measurement records, the results of statistical analysis based on a few samples are not reliable or representative. As such, researchers then developed a series of numerical simulation studies [6,7], showing that seawater can be treated as an ideal fluid in the sea area medium system. The analysis showed that the overlying sea water has no actual effect on the seismic response of the seabed foundation. Hatayama [8] simulated ground motion with and without water, finding that we should consider the influence of sea water and that Rayleigh waves are strongly affected by seawater. The greater the thickness of the seawater layer, the longer the influence period of Rayleigh waves. Nakamura et al. [9] used the finite difference method to simulate the seismic wave field of an earthquake source on land and on the sea floor. The results showed that sea water has a certain amplification effect on the waveform, and the amplitude of the vertical component of the seabed station is four times that of the sea without sea water. To study the influence of sea water on strong ground motion, Petukhin et al. [10] established three-dimensional models of two real seabed structures with and without a sea water layer by using the finite difference method. The analysis of the results showed that only when the sea water depth is shallow is the influence of the sea water layer on Rayleigh waves significant; when the sea water is deep, the influence of the sea water layer on ground motion is small, which can be ignored. Hu et al. [11] used the wave number integral method to study the influence of sea water on sea ground motion. The horizontal component of sea ground motion is little affected by sea water, but the vertical component decreases with the increase in sea water depth. Li et al. [12,13] simulated ground motion propagation in a sea area through a horizontal stratified seawater pore soil bedrock model; they found that the horizontal components of the land and sea floor motion are similar, and the vertical component of seabed motion is much smaller than that of land motion. Fan et al. [14] theoretically derived the transfer function of aa seabed site and proposed a comprehensive method to simulate the seabed ground motion by considering the influence of the soil saturation of the seawater and seabed soil layers on the amplification of the ground motion at a site.
Given the lack of bedrock observation records from the same location, the data from the current sea ground motion observation stations can only be used preliminarily analyze the differences in ground motion between sea area and land areas [15]; however, the site response of sea area ground motion cannot be determined, nor can the ground motion characteristics be obtained at different depths of the seafloor. In this study, dynamic centrifugal model technology was used to simulate and restore a geotechnical seismic observation array in an offshore sea area. We designed two models: one with and one without water. By comparing and summarizing the impact of the overlying seawater on ground motion, we revealed the variation in the ground motion response spectrum of complex structural systems in the sea area with depth. The research results are helpful for deepening the understanding of sea ground motion effects at a site, and have certain engineering and scientific value for the seismic design of sea areas.

2. Design of Dynamic Centrifugal Model Test

2.1. Centrifugal Model Test Equipment

For the centrifuge shaking table test, we used a TK-C500-type geotechnical centrifugal test machine: the maximum centrifugal acceleration was 250 g, the maximum radius was 5 m, and the maximum effective load was 5 t. The model box was a laminated shear model box made of light and high-strength alloy aluminum (Figure 1b,c), which was composed of 12 layers of hollow aluminum rings, which could reduce the side boundary effect [16]. This model box was 1000 mm × 600 mm × 600 mm (length × width × height), the actual weight was about 380 kg, the maximum relative displacement of two adjacent rings could reach 6 mm, and a rubber mold that was 1 mm thick was arranged in the box to ensure the sealing performance of the model box. This box was used to test soil samples with high moisture content.

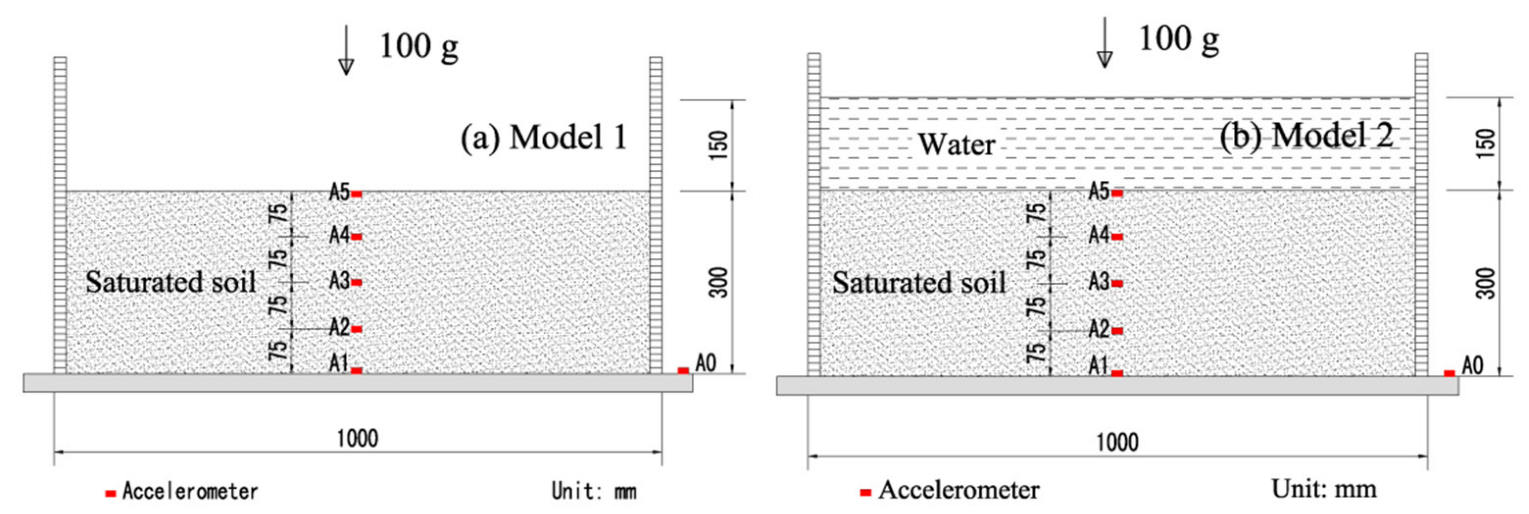
2.2. Model Design Scheme

To explore the influence of overlying seawater on ground motion, we designed and constructed dynamic centrifugal simulation tests of two groups of homogeneous saturated soft clay sites with and without water. We used IMERYS Kaolin clay from Australia in the experiment. The particles were very fine and could simulate the basic characteristics of soft clay. The basic physical and mechanical parameters, such as relative density, liquid plastic limit, and density, were controlled during model soil preparation, as shown in Table 1.
In this study, we designed two centrifugal models with and without overlying water, and we further investigated the effect of overlying seawater on ground motion by comparing the test results. We analyed the overlying water pair to compare the two models with and without water, and then studied the effect of overlying seawater on ground motion site. To ensure the accuracy of the test, we arranged five acceleration sensors in the middle of the model box from top to bottom, A1–A5, where A1 was at the bottom of the model box; A0 was on the side of the box, representing the input acceleration; and the interval between adjacent acceleration sensors was 75 mm to simulate the actual observation station. The scheme design of the test model in shown in Figure 2.

2.3. Model Similarity Rate

Combined with the actual situation where the average depth of offshore water is about 15 m, we used a set of centrifugal scale models to reduce the overlying sea water of 15 m, the seabed soil layer was 30 m. In the test, the acceleration of the centrifuge is 100 g, so the geometric similarity ratio in the test was 1/100 (model/prototype), and other characteristics are shown in Table 2.

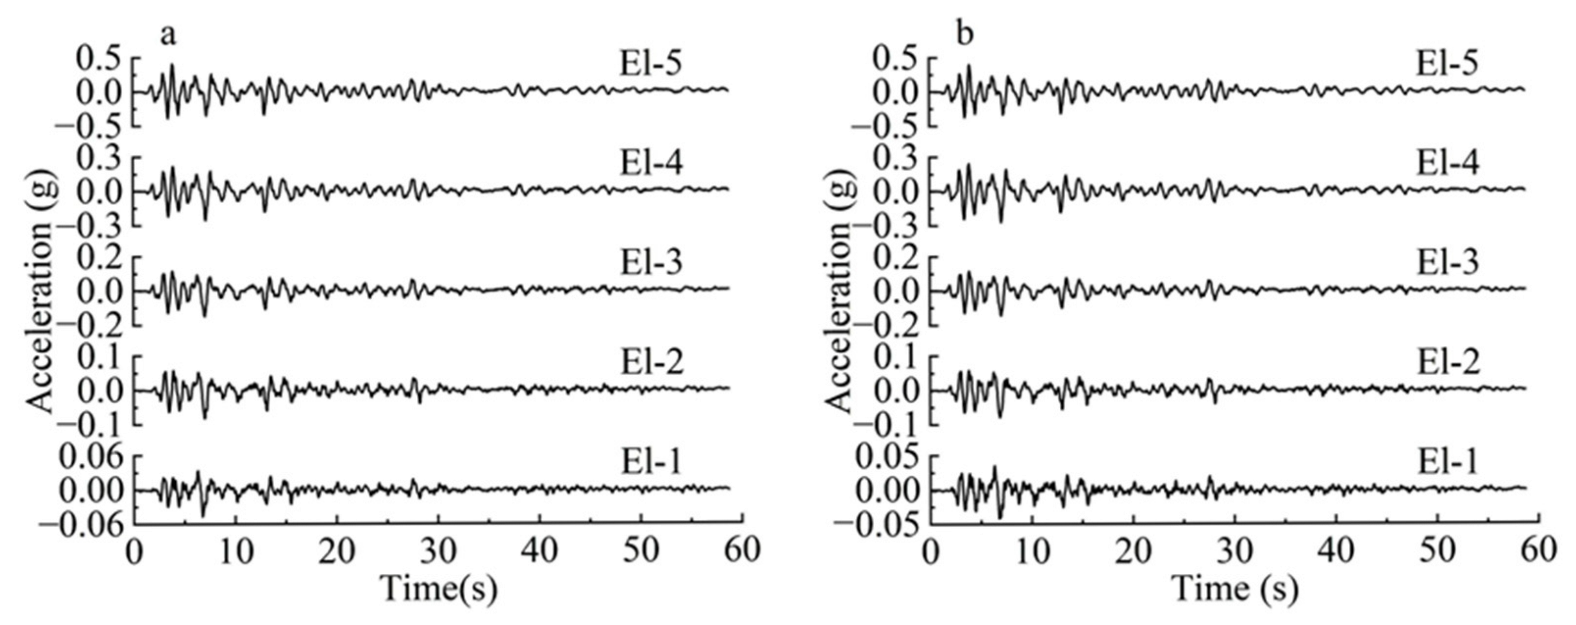
2.4. Inputting Ground Motion Form

In this study, we used El Centro waves, the basic input form of seismic waves. We adjusted the peak acceleration of the seismic waves to 0.025 g, 0.05 g, 0.1 g, 0.2 g and 0.4 g to simulate seismic waves of different intensities, corresponding to five working conditions of El-1, El-2, El-3, El-4, and El-5, respectively. First, we scaled the amplitude and duration of the seismic waves according to the similarity rate of 100 to obtain the target time history. Then, the target time history was further filtered, and then we scaled the filtered time history again to obtain the actual input ground motion. The input seismic wave is shown in Figure 3. The actual input seismic wave parameters are shown in Table 3. It can be seen from Figure 3 that after the seismic waves were filtered, the seismic waves under different working conditions maintained almost the same waveform. In addition to the scaling the amplitude, the spectrum characteristics and duration were basically the same, so they could be used as the base ground motion input.

3. Analysis of Test Results

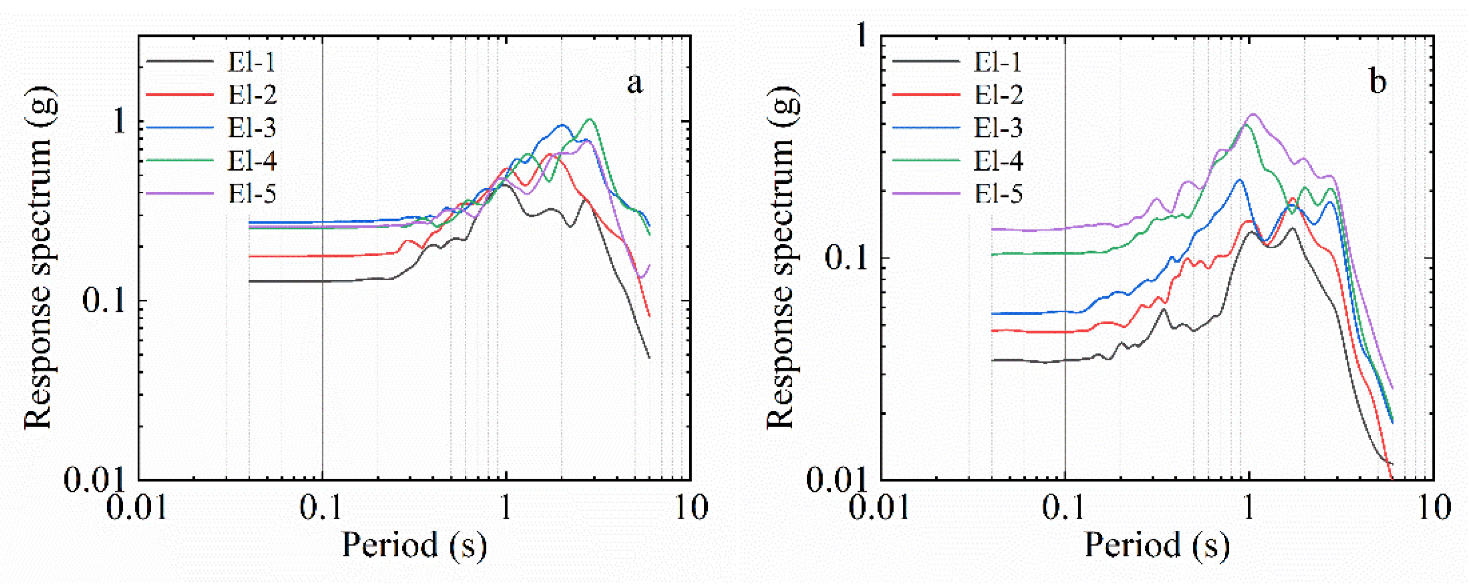
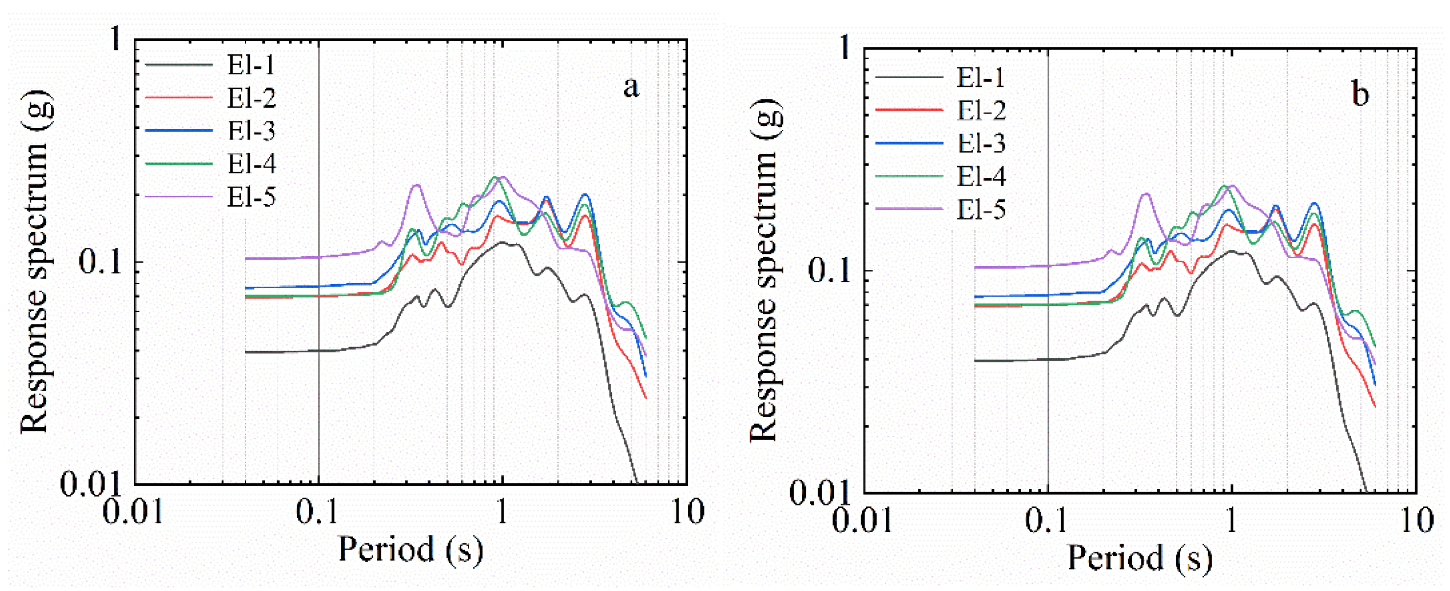
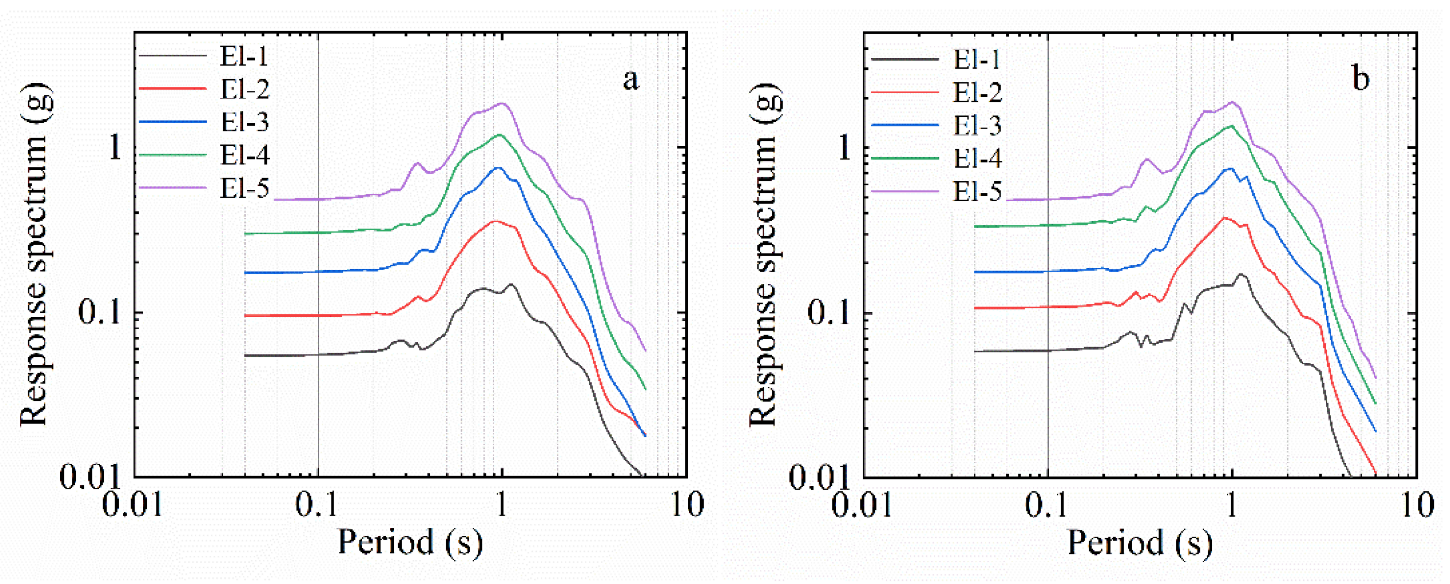
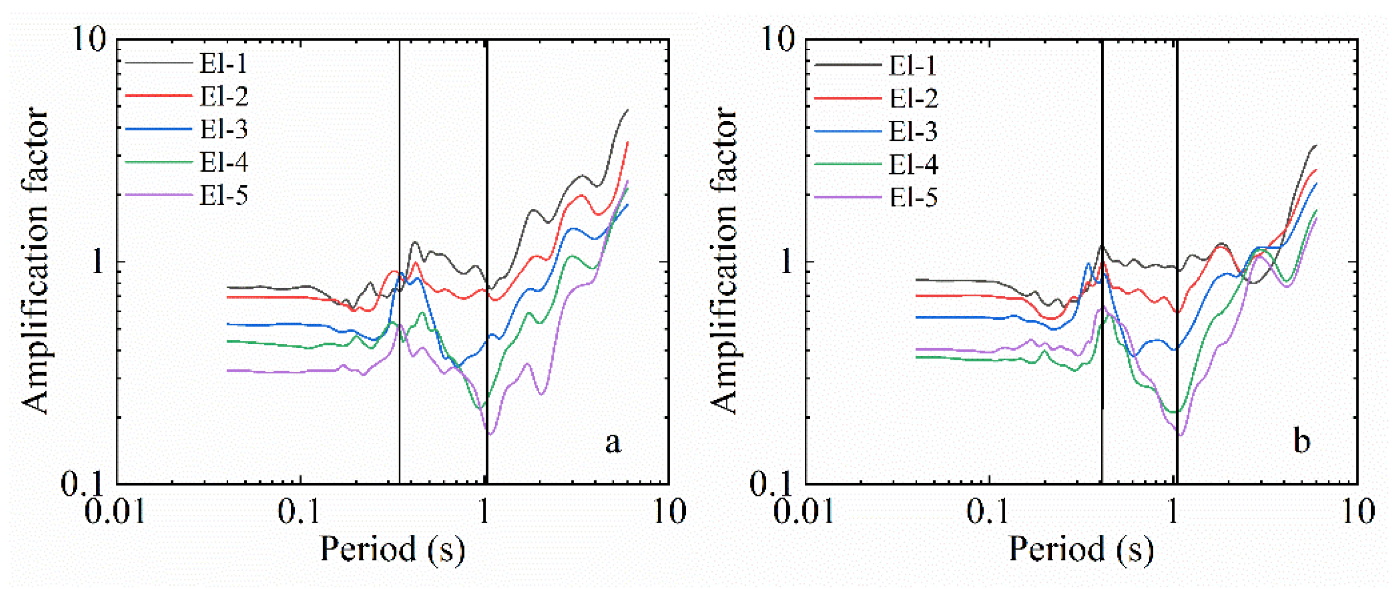
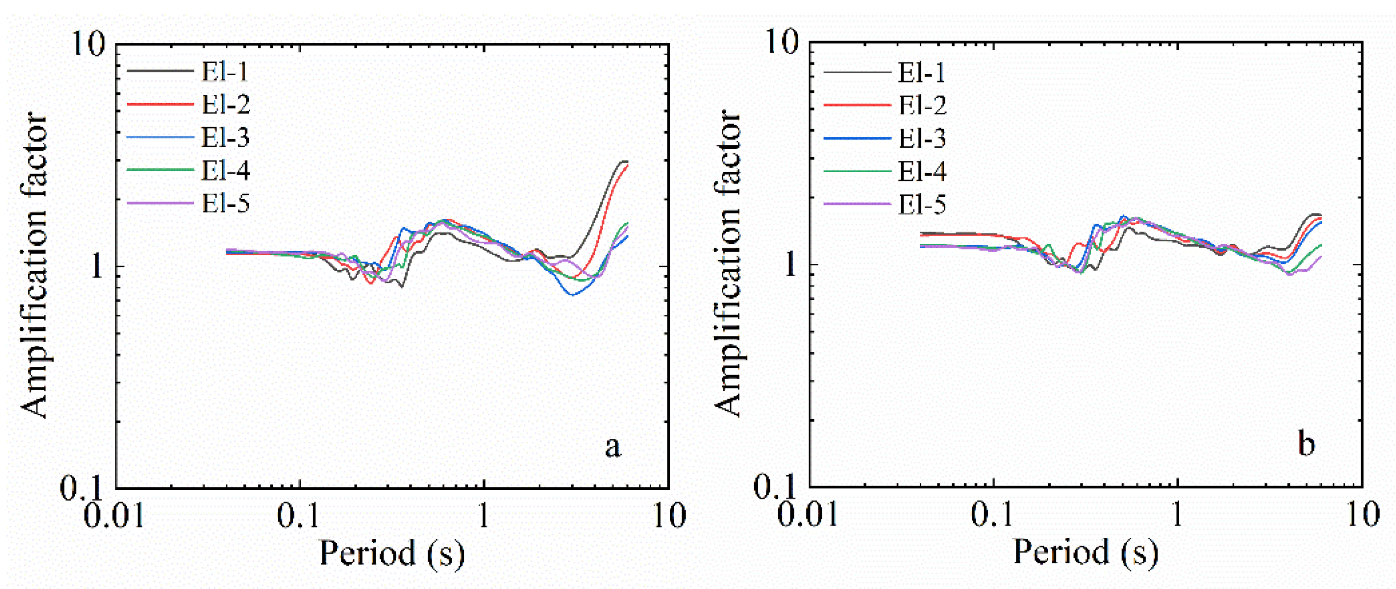
3.1. Effecting of Input Ground Motion on Response Spectrum

From the response spectra at different depths in Figure 4, Figure 5, Figure 6, Figure 7 and Figure 8, we can see that the response spectra of the two groups of models were basically the same at the start. On the whole, the spectrum shape showed a trend of gradual increase and then decrease. With the increase in the input peak ground motion, the response spectra of the models with and without water at the same depth also increase. Under the same working conditions, the response spectrum of the model without water is smaller than that of the model with water. Under different conditions, with the increase in the peak value of the input ground motion, the amplitude of the response spectrum decreases.

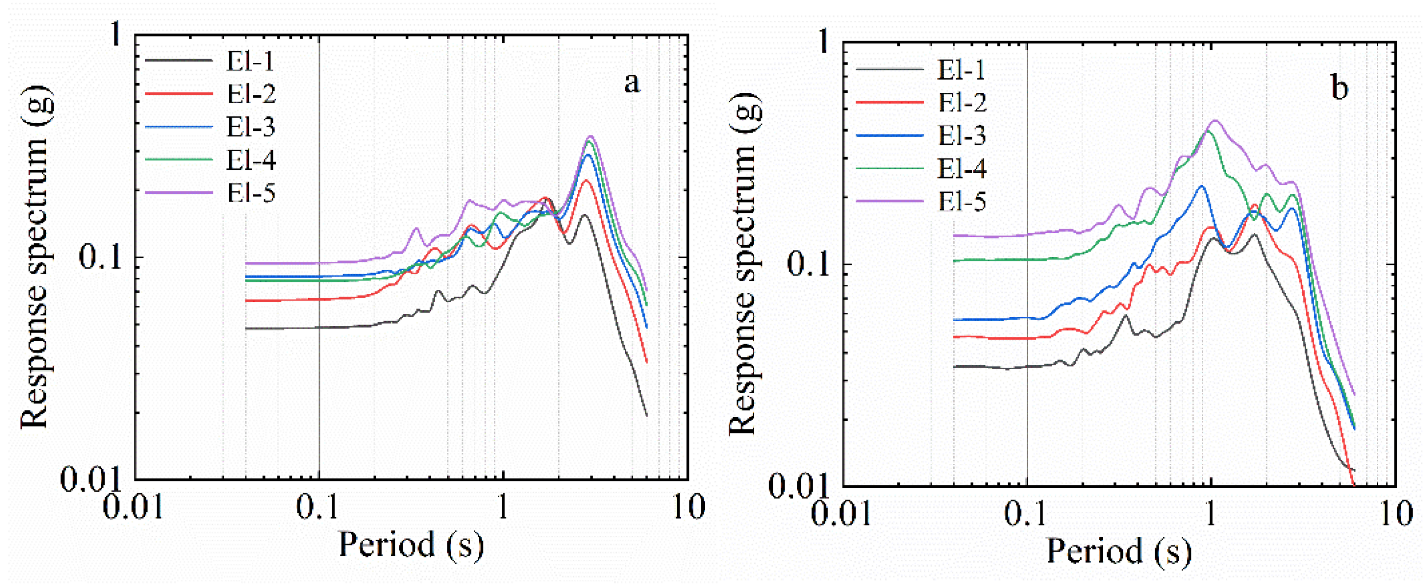
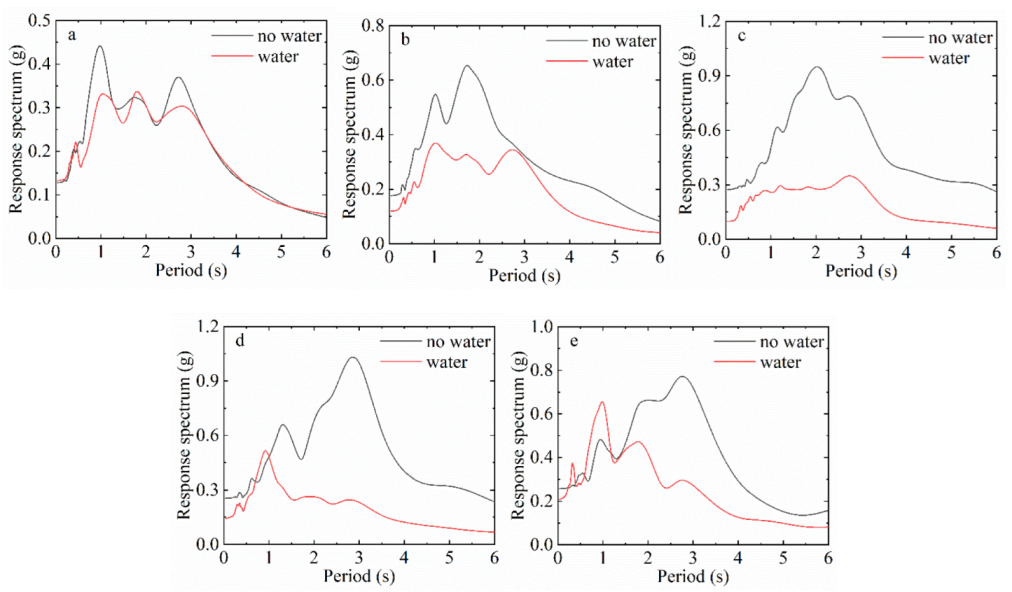
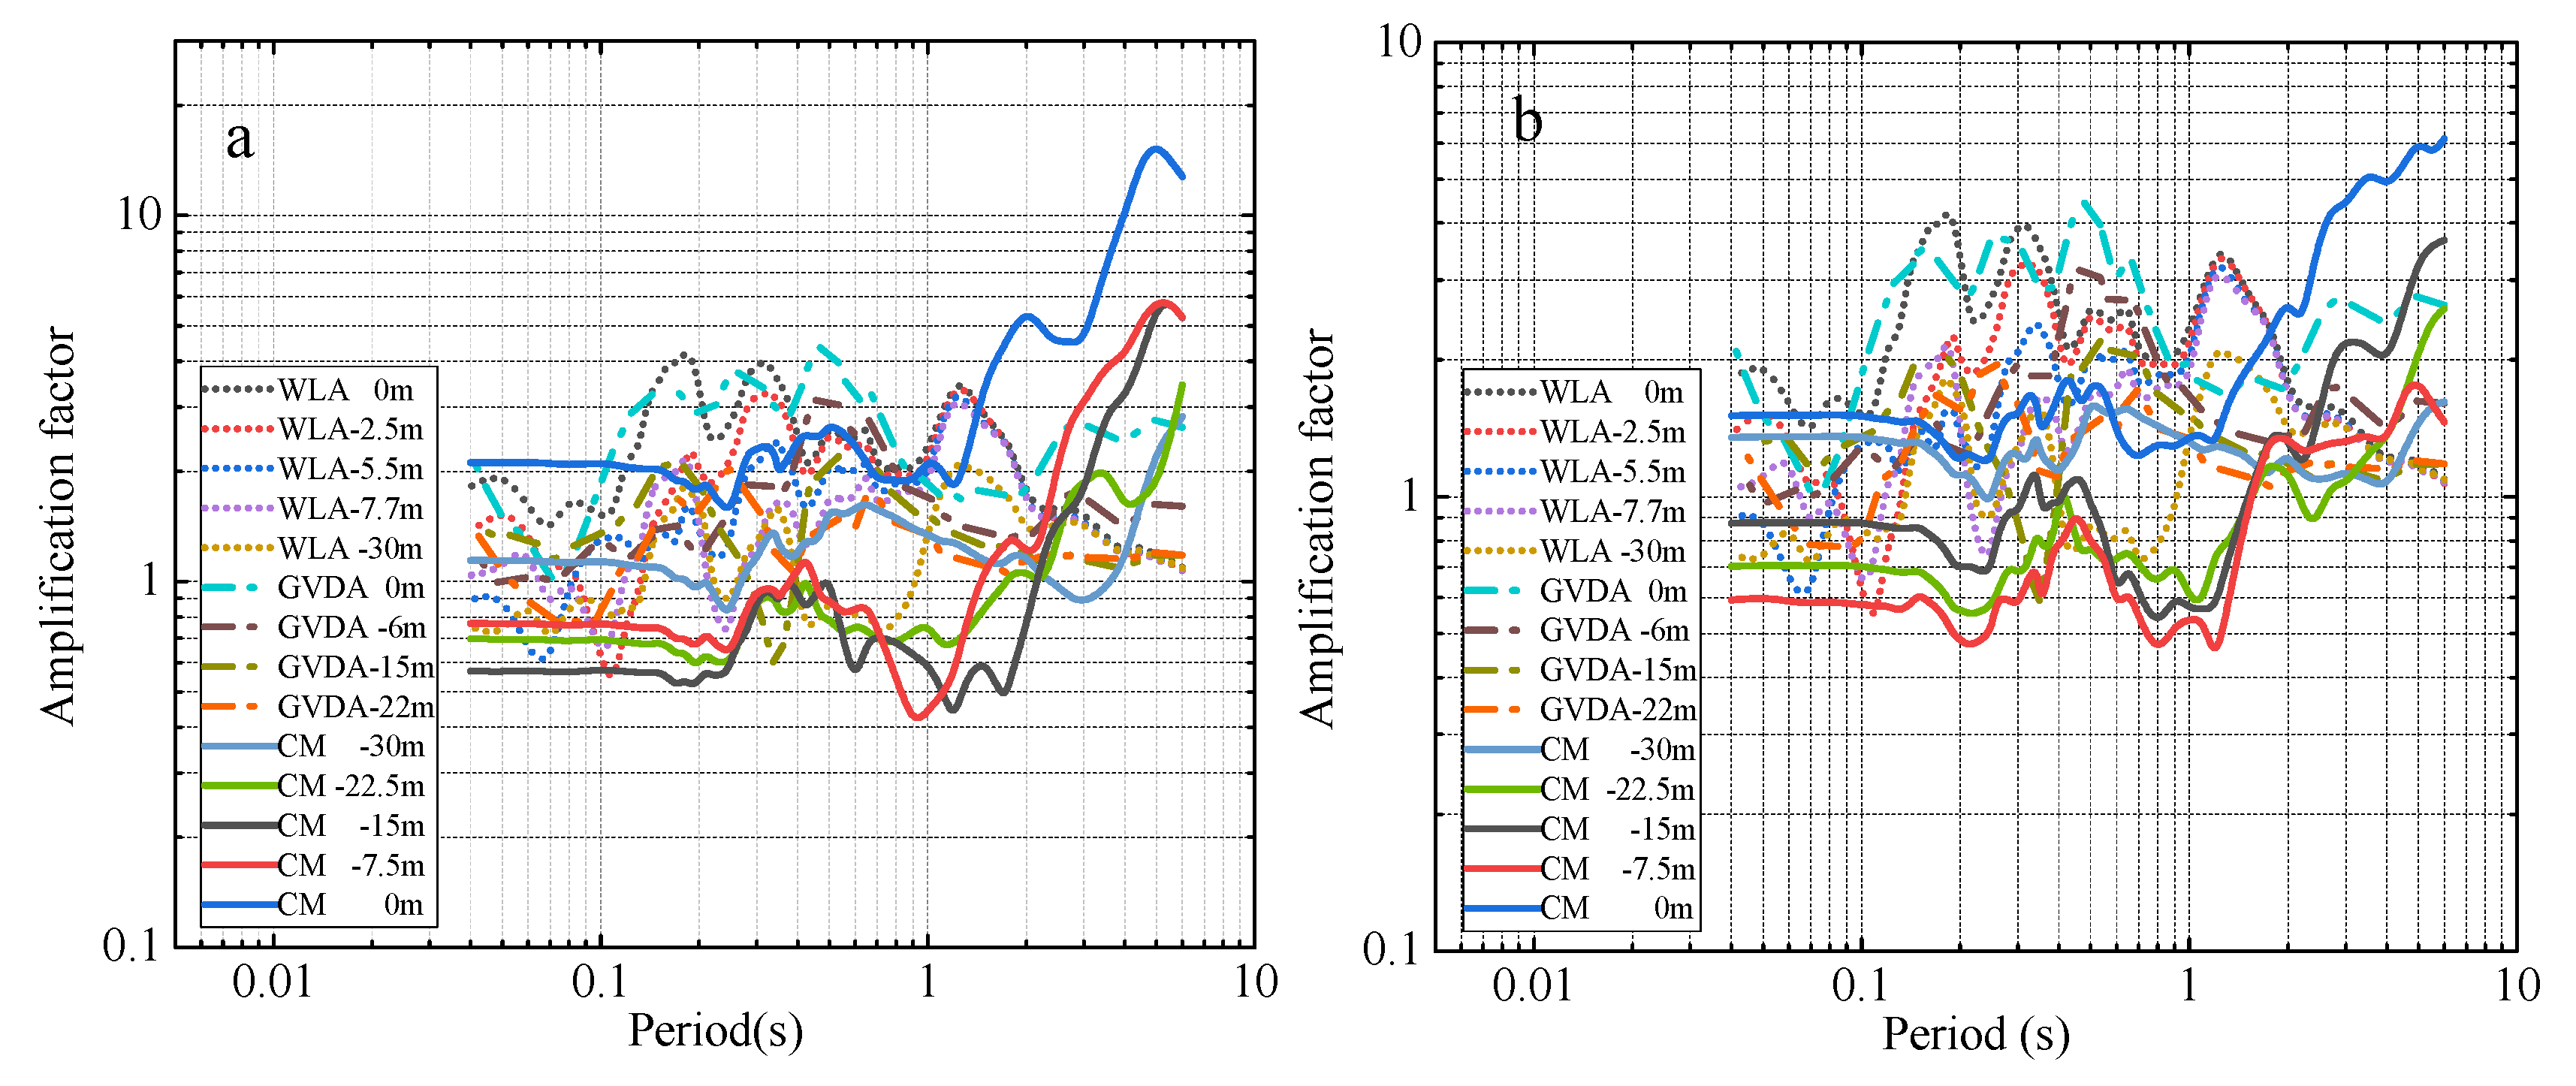
3.2. Comparative Analysis of Surface Response Spectra

In order to further study the difference between the surface response spectra of the site with and without overlying water, we compared the surface response spectrum values of the two models, as shown in Figure 9. The figure shows that the surface response spectrum values of the two models are different. When the input ground motion is small, the surface response spectrum values of the models with and without overlying water are closer, and the difference between the two is smaller. The peak value is higher, and the surface response spectrum value of the overlying water model is significantly smaller than that of the overlying waterless model. When the input ground motion is large, the difference between the surface response spectrum values of the high-frequency part of the models with and without overlying water decreases, and the response spectrum value of the water model in the middle- and low-frequency part is significantly smaller than that of the same part for the waterless model. The response spectrum amplitude of the model without overlying water gradually shifts i the long-period direction, but the that of the water model moves in the short-period direction.
To better analyze the influence of overlying seawater, we compared the acceleration response spectrum values at different depths with the input acceleration response spectrum values, and obtained the acceleration amplification coefficients at different depths, as shown in Figure 10, Figure 11, Figure 12, Figure 13 and Figure 14. The results showed that with the increase in the amplitude of the input ground motion, the amplification coefficients of the acceleration response spectrum of the models with and without water gradually reduce. In the short-period part, except for the surface, the amplification coefficient is basically less than 1, the period is between 0.4 s and 1.5 s, and the difference is the largest under different working conditions. When the period is greater than one, the amplification coefficient of the response spectrum obviously increases. The period of the minimum amplification factor of the two models is close to one, and the period from the base to the minimum amplification factor of the model with no overlying water gradually shifts to a short period, while that of the model with overlying water moves to a long period. Additionally, there is an obvious descending section. The interval of the descending section of the no-overlying-water model gradually decreases with the increase in depth. Comparing and analyzing the two models with and without water, we found that the amplification coefficient of the response spectrum of the model with water is smaller than that of the model without water. By one-to-one correspondence between Figure 4, Figure 5, Figure 6, Figure 7, Figure 8 and Figure 10, Figure 11, Figure 12, Figure 13, Figure 14, we can see that the lowest amplitude and amplification factor of the acceleration response spectrum occur at the same period point, and the maximum amplification factor appears in the long-period part, corresponding to the period of the minimum value of the acceleration response spectrum.
To better reflect the law of the acceleration response spectrum and amplification coefficient, we selected two seismic records from the GVDA and WLA stations in the SEMS of the United States (NEES@UCSB, the website is http://nees.ucsb.edu) 15 February 2021. The peak base accelerations of the two seismic records were 0.074 g and 0.083 gal, respectively, which are close to the acceleration amplitude of condition 2 in the centrifuge model. Therefore, the amplification coefficient of the acceleration response spectrum of each layer in condition 2 was compared with the actual site value. We can see from Figure 15 that when the period is less than 0.1 s, the amplification coefficient of the response spectrum of the models with and without water is slightly smaller than at the actual site; when the period is between 0.1 and 2 s, the amplification factor measured at the site is slightly larger than that of the test model; when the period is greater than 2 s, the amplification factor of the response spectrum of the overlying water model is close to that of the measured site. However, the amplification factor of the response spectrum of the model without overlying water differs from that of the measured site. The amplification coefficient of the response spectrum of the ground surface in the short-period part of the water-free model is close to that of the measured site, but in the long-period part, that of the model with overlying is close to that of the measured site, which shows that water has a certain influence on the ground motion response spectrum of a site.

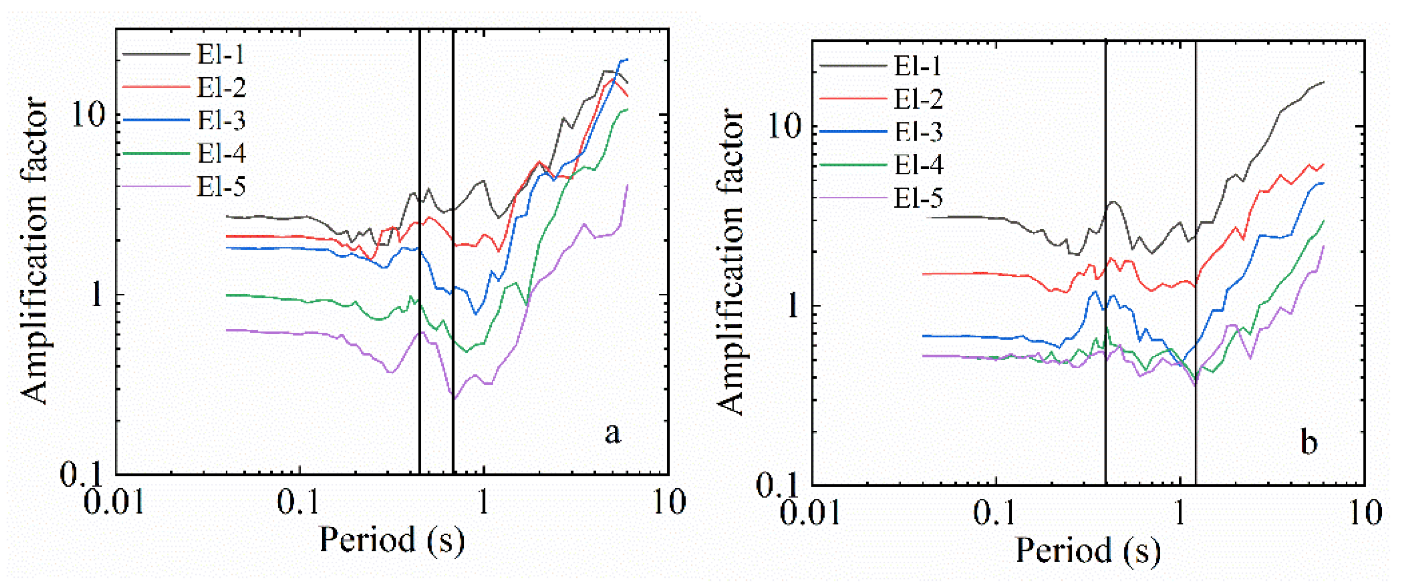
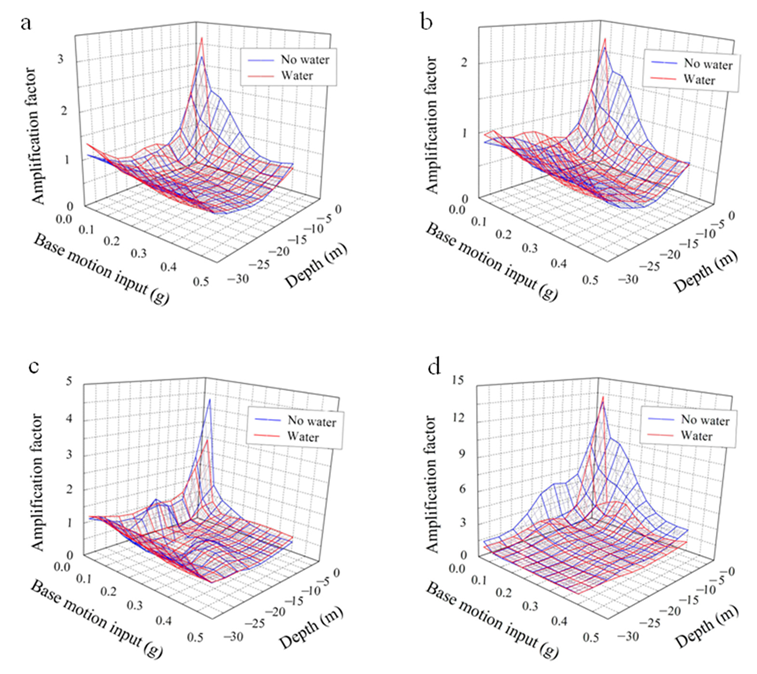
3.3. Amplification Factor of Response Spectrum at Specific Period Point

The American seismic design code NEHRP [17] is comprehensive and well reflects actual engineering situations. In the code, SS and S1 are important ground motion parameters used to classify the building design category, corresponding to acceleration response spectrum values with periods of 0.2 s and 1 s, respectively. The acceleration spectrum isolines of structures at 0.2 s and 1 s, namely MCER ground and motion map, respectively, are the maximum considered earthquakes based on risk targets. Therefore, in this study, we sorted and analyzed the acceleration response spectrum amplification coefficients and the peak acceleration point periods when the period was 0.2 s and 1 s and the four period point amplification factor of the long period of 4 s, as shown in Figure 16.
The acceleration response spectrum amplification factor decreases first and then increases with the change in the period. In the short period (T = 0.04 s and T = 0.2 s), when the input ground motion is small and the depth is deep, in the water-overlying model, the amplification factor is slightly larger than that of the model without overlying water. With the increase in input ground motion, the amplification factor of the water-free model is gradually greater than that of the water-free model. In the middle level, the difference in the amplification factor of the response spectrum between the water and waterless models is small. The amplification factor of the model without water is obviously larger than that of the model with water, but the maximum difference between the two amplification factors is smaller. When the period is 1 s, there is no significant difference in the amplification factor of the response spectrum close to the base. From the base to the surface, the amplification factor of the model without overlying water is significantly greater than that of the model with overlying water, and the maximum difference between the two is large. With a long period (T = 4 s), the amplification factor of the response spectrum gradually increases from the base to the surface, being significantly greater for the waterless model than for the water model. In summary, water has a significant effect on the response spectrum and amplification factor of ground motion, and water has a certain effect on dissipating and absorbing waves. The response spectrum and amplification factor of a site covered with water is smaller than that of a site without water.

4. Conclusions

In this study, two centrifugal models with water and without water were established to study the influence of overlying seawater on ground motion. Our findings have certain research significance. In this study, the response spectra obtained from two different centrifugal model tests were compared, and the following valuable conclusions were obtained:
(1) The results showed that the response spectrum of the site with and without water increases with the increase in the input peak value. The acceleration response spectrum in the model with water is smaller than that in the model without water.
(2) The difference between the response spectra obtained from the water and water-free model is related to the amplitude of the input seismic wave and to the frequency band.
(3) The amplification coefficient of the acceleration response spectrum decreases with the increase in input peak value, and the amplification coefficient of the overlying-water model is smaller than that of the model without overlying water. There are some differences between the results of the amplification coefficients of the response spectra of the two models, which is also related to the frequency range of the response spectra.

Author Contributions

Data Curation, T.W.; Formal Analysis, J.L. (Juan Liu) and X.S.; Investigation, T.W.; Methodology, J.L. (Juan Liu) and J.L. (Jingyan Lan); Resources, X.S.; Supervision, J.L. (Jingyan Lan); Visualization, T.W.; Writing—original draft, J.L. (Juan Liu). All authors have read and agreed to the published version of the manuscript.

Funding

This research was funded by the Scientific Research Fund of Institute of Engineering Mechanics, China Earthquake Administration grant number 2021D31, Guangxi Natural Science Foundation grant number 2021GXNSFAA220017, the National Natural Science Foundation of China grant number 52168067.

Institutional Review Board Statement

Not applicable.

Informed Consent Statement

Not applicable.

Data Availability Statement

The data used to support the findings and results of this study are available from the corresponding author upon request.

Acknowledgments

The centrifuge test was supported by the National Engineering Laboratory of port hydraulic construction technology, Tianjin Institute of Water Transport Engineering, Ministry of Transport, China. The first author also wishes to express sincere gratitude to Xiaoqing Liu, Xiaoyu An, and engineer Jiangdong Li of the Tianjin Institute of Water Transport Engineering for their assistance during the centrifuge testing.

Conflicts of Interest

The authors declare that they have no conflict of interest.

References

  1. Kubo, H.; Nakamura, T.; Suzuki, W.; Dhakal, Y.P.; Kimura, T.; Kunugi, T.; Takahashi, N.; Aoi, S. Ground-Motion Characteristics and Nonlinear Soil Response Observed by DONET1 Seafloor Observation Network during the 2016 Southeast Off-Mie, Japan, Earthquake. Bull. Seismol. Soc. Am. 2019, 109, 976–986. [Google Scholar] [CrossRef]
  2. Boore, D.M.; Smith, C.E. Analysis of earthquake recordings obtained from the Seafloor Earthquake Measurement System (SEMS) instruments deployed off the coast of southern California. Bull. Seismol. Soc. Am. 1999, 89, 260–274. [Google Scholar] [CrossRef]
  3. Sleefe, G.E. The long-term measurement of strong-motion earthquakes offshore southern California. In Proceedings of the 22nd Annual Offshore Technology Conference, Houston, TX, USA, 7–10 May 1990; pp. 561–568. [Google Scholar]
  4. Chen, B.; Wang, D.; Li, H.; Sun, Z.; Li, C. Vertical-to-horizontal response spectral ratio for offshore ground motions: Analysis and simplified design equation. J. Cent. South Univ. 2017, 24, 203–216. [Google Scholar] [CrossRef]
  5. Diao, H.; Hu, J.; Xie, L. Effect of seawater on incident plane P and SV waves at ocean bottom and engineering characteristics of offshore ground motion records off the coast of southern California, USA. Earthq. Eng. Eng. Vib. 2014, 13, 181–194. [Google Scholar] [CrossRef]
  6. Zhu, J. Coupled motion of sea water and sea bed-soil under earthquake action. Earthq. Eng. Eng. Vib. 1988, 8, 37–43. (In Chinese) [Google Scholar]
  7. Zhu, J.; Zhou, J. A fluid mechanism basis for estimating undersea ground motion. Earthq. Eng. Eng. Vib. 1991, 11, 87–93. (In Chinese) [Google Scholar]
  8. Hatayama, K. Should We Consider Sea in Simulating Strong Ground Motion-Numerical Examination of Effects of Sea in the 2-D P-SV Wave Field. AGU Fall Meet. Abstr. 2003, 2003, S51E-0091. [Google Scholar]
  9. Nakamura, T.; Takenaka, H.; Okamoto, T.; Ohori, M.; Tsuboi, S. Long-period ocean-bottom motions in the source areas of large subduction earthquakes. Sci. Rep. 2015, 5, 16648. [Google Scholar] [CrossRef] [PubMed] [Green Version]
  10. Petukhin, A.; Iwata, T.; Kagawa, T. Study on the effect of the oceanic water layer on strong ground motion simulations. Earth Planets Space 2010, 62, 621–630. [Google Scholar] [CrossRef] [Green Version]
  11. Hu, J.; Zheng, X.; Hao, Y.; Xie, L. Characterization of strong motion of subduction earthquakes and its attenuation relationship. Chin. J. Geophys. 2017, 60, 1773–1787. [Google Scholar]
  12. Li, C.; Hao, H.; Li, H.; Bi, K. Theoretical modeling and numerical simulation of seismic motions at seafloor. Soil Dyn. Earthq. Eng. 2015, 77, 220–225. [Google Scholar] [CrossRef] [Green Version]
  13. Li, C.; Hao, H.; Li, H.; Bi, K.; Chen, B. Modeling and simulation of spatially correlated ground motions at multiple onshore and offshore sites. J. Earthq. Eng. 2017, 21, 359–383. [Google Scholar] [CrossRef] [Green Version]
  14. Fan, S.; Shi, Y.; Liu, C.; Li, W. Simulation of spatially varying seafloor ground motions with random seawater layer and complex terrain. Soil Dyn. Earthq. Eng. 2018, 111, 110–118. [Google Scholar] [CrossRef]
  15. Rong, M.; Yu, T.; Wang, J. Comparative study on site-effects of sea and land area based on strong earthquake observation. Build. Struct. 2018, 48, 345–349. (In Chinese) [Google Scholar]
  16. Lee, C.; Wei, Y.; Kuo, Y. Boundary effects of a laminar container in centrifuge shaking table tests. Soil Dyn. Earthq. Eng. 2012, 34, 37–51. [Google Scholar] [CrossRef]
  17. Building Seismic Safety Council. NEHRP Recommended Provisions for Seismic Regulations for New Buildings and Other Structures; 302/303, Part 1 and 2, 2009 Edition; Federal Emergency Management Agency: Washington, DC, USA, 2010. [Google Scholar]
Figure 1. Centrifugal testing machine and laminar model box: (a) TK-C500 geotechnical centrifuge and vibration system; (b) waterless centrifugal model; (c) water centrifugal model.
Jmse 11 00167 g001
Figure 2. Design of models for dynamic centrifuge shake table test (unit: millimeters): (a) Model 1 is the model without water upon the soil layer; (b) Model 2 is model with water upon the soil layer.
Jmse 11 00167 g002
Figure 3. Acceleration time history of basement input: (a) with and (b) with water.
Jmse 11 00167 g003
Figure 4. Acceleration response spectrum (depth: 0 m) (a) without and (b) with water.
Jmse 11 00167 g004
Figure 5. Acceleration response spectrum (depth: −7.5 m) (a) without and (b) with water.
Jmse 11 00167 g005
Figure 6. Acceleration response spectrum (depth: −15 m) (a) without and (b) with water.
Jmse 11 00167 g006
Figure 7. Acceleration response spectrum (depth: −22.5 m) (a) without and (b) with water.
Jmse 11 00167 g007
Figure 8. Acceleration response spectrum (depth: −30 m) (a) without and (b) with water.
Jmse 11 00167 g008
Figure 9. Comparison of ground acceleration response spectra of the models with and without overlying water: (a) El-1; (b) El-2; (c) El-3; (d) El-4; (e) El-5.
Jmse 11 00167 g009
Figure 10. Acceleration response spectrum ratio (depth: 0 m): (a) without and (b) with water.
Jmse 11 00167 g010
Figure 11. Acceleration response spectrum ratio (depth: −7.5 m) (a) without and (b) with water.
Jmse 11 00167 g011
Figure 12. Acceleration response spectrum ratio (depth: −15 m) (a) without and (b) with water.
Jmse 11 00167 g012
Figure 13. Acceleration response spectrum ratio (depth: −22.5 m) (a) without and (b) with water..
Jmse 11 00167 g013
Figure 14. Acceleration response spectrum ratio (depth: −30 m) (a) without and (b) with water.
Jmse 11 00167 g014
Figure 15. Comparison of amplification factors between centrifugal model tests and measured sites (a) without and (b) with overlying water.
Jmse 11 00167 g015
Figure 16. The 3D graphs of the trend in the amplification factor with depth and input ground shaking. CM represents the centrifuge model. (a) T = 0.04 s; (b) T = 0.2 s; (c) T = 1 s; (d) T = 4 s.
Jmse 11 00167 g016
Table 1. Basic physical properties of model soil.
Density ρWater Content ωPlastic LimitLiquid LimitVoid Ratio e
1.61 g/m336%26%48%1.17
Table 2. Scaling factors of model to prototype.
Physical QuantityModelPrototype
Length1100
Inputting vibration time1100
Acceleration11/100
Velocity`11
Displacement1100
Vibration frequency11/100
Table 3. Actual input ground motion parameters of sea free-field centrifugal model test.
Seismic Wave TypeWorking ConditionAmplitude (g)Duration (s)
No WaterWater
El Centro waveEl-10.0470.04160
El-20.0830.079
El-30.1500.146
El-40.2550.272
El-50.4030.395
Disclaimer/Publisher’s Note: The statements, opinions and data contained in all publications are solely those of the individual author(s) and contributor(s) and not of MDPI and/or the editor(s). MDPI and/or the editor(s) disclaim responsibility for any injury to people or property resulting from any ideas, methods, instructions or products referred to in the content.

