
Dynamic Co-Simulation Analysis and Control of an IEA 15 MW Offshore Floating Semi-Submersible Wind Turbine under Taiwan Offshore-Wind-Farm Conditions of Wind and Wave

Abstract
:1. Introduction
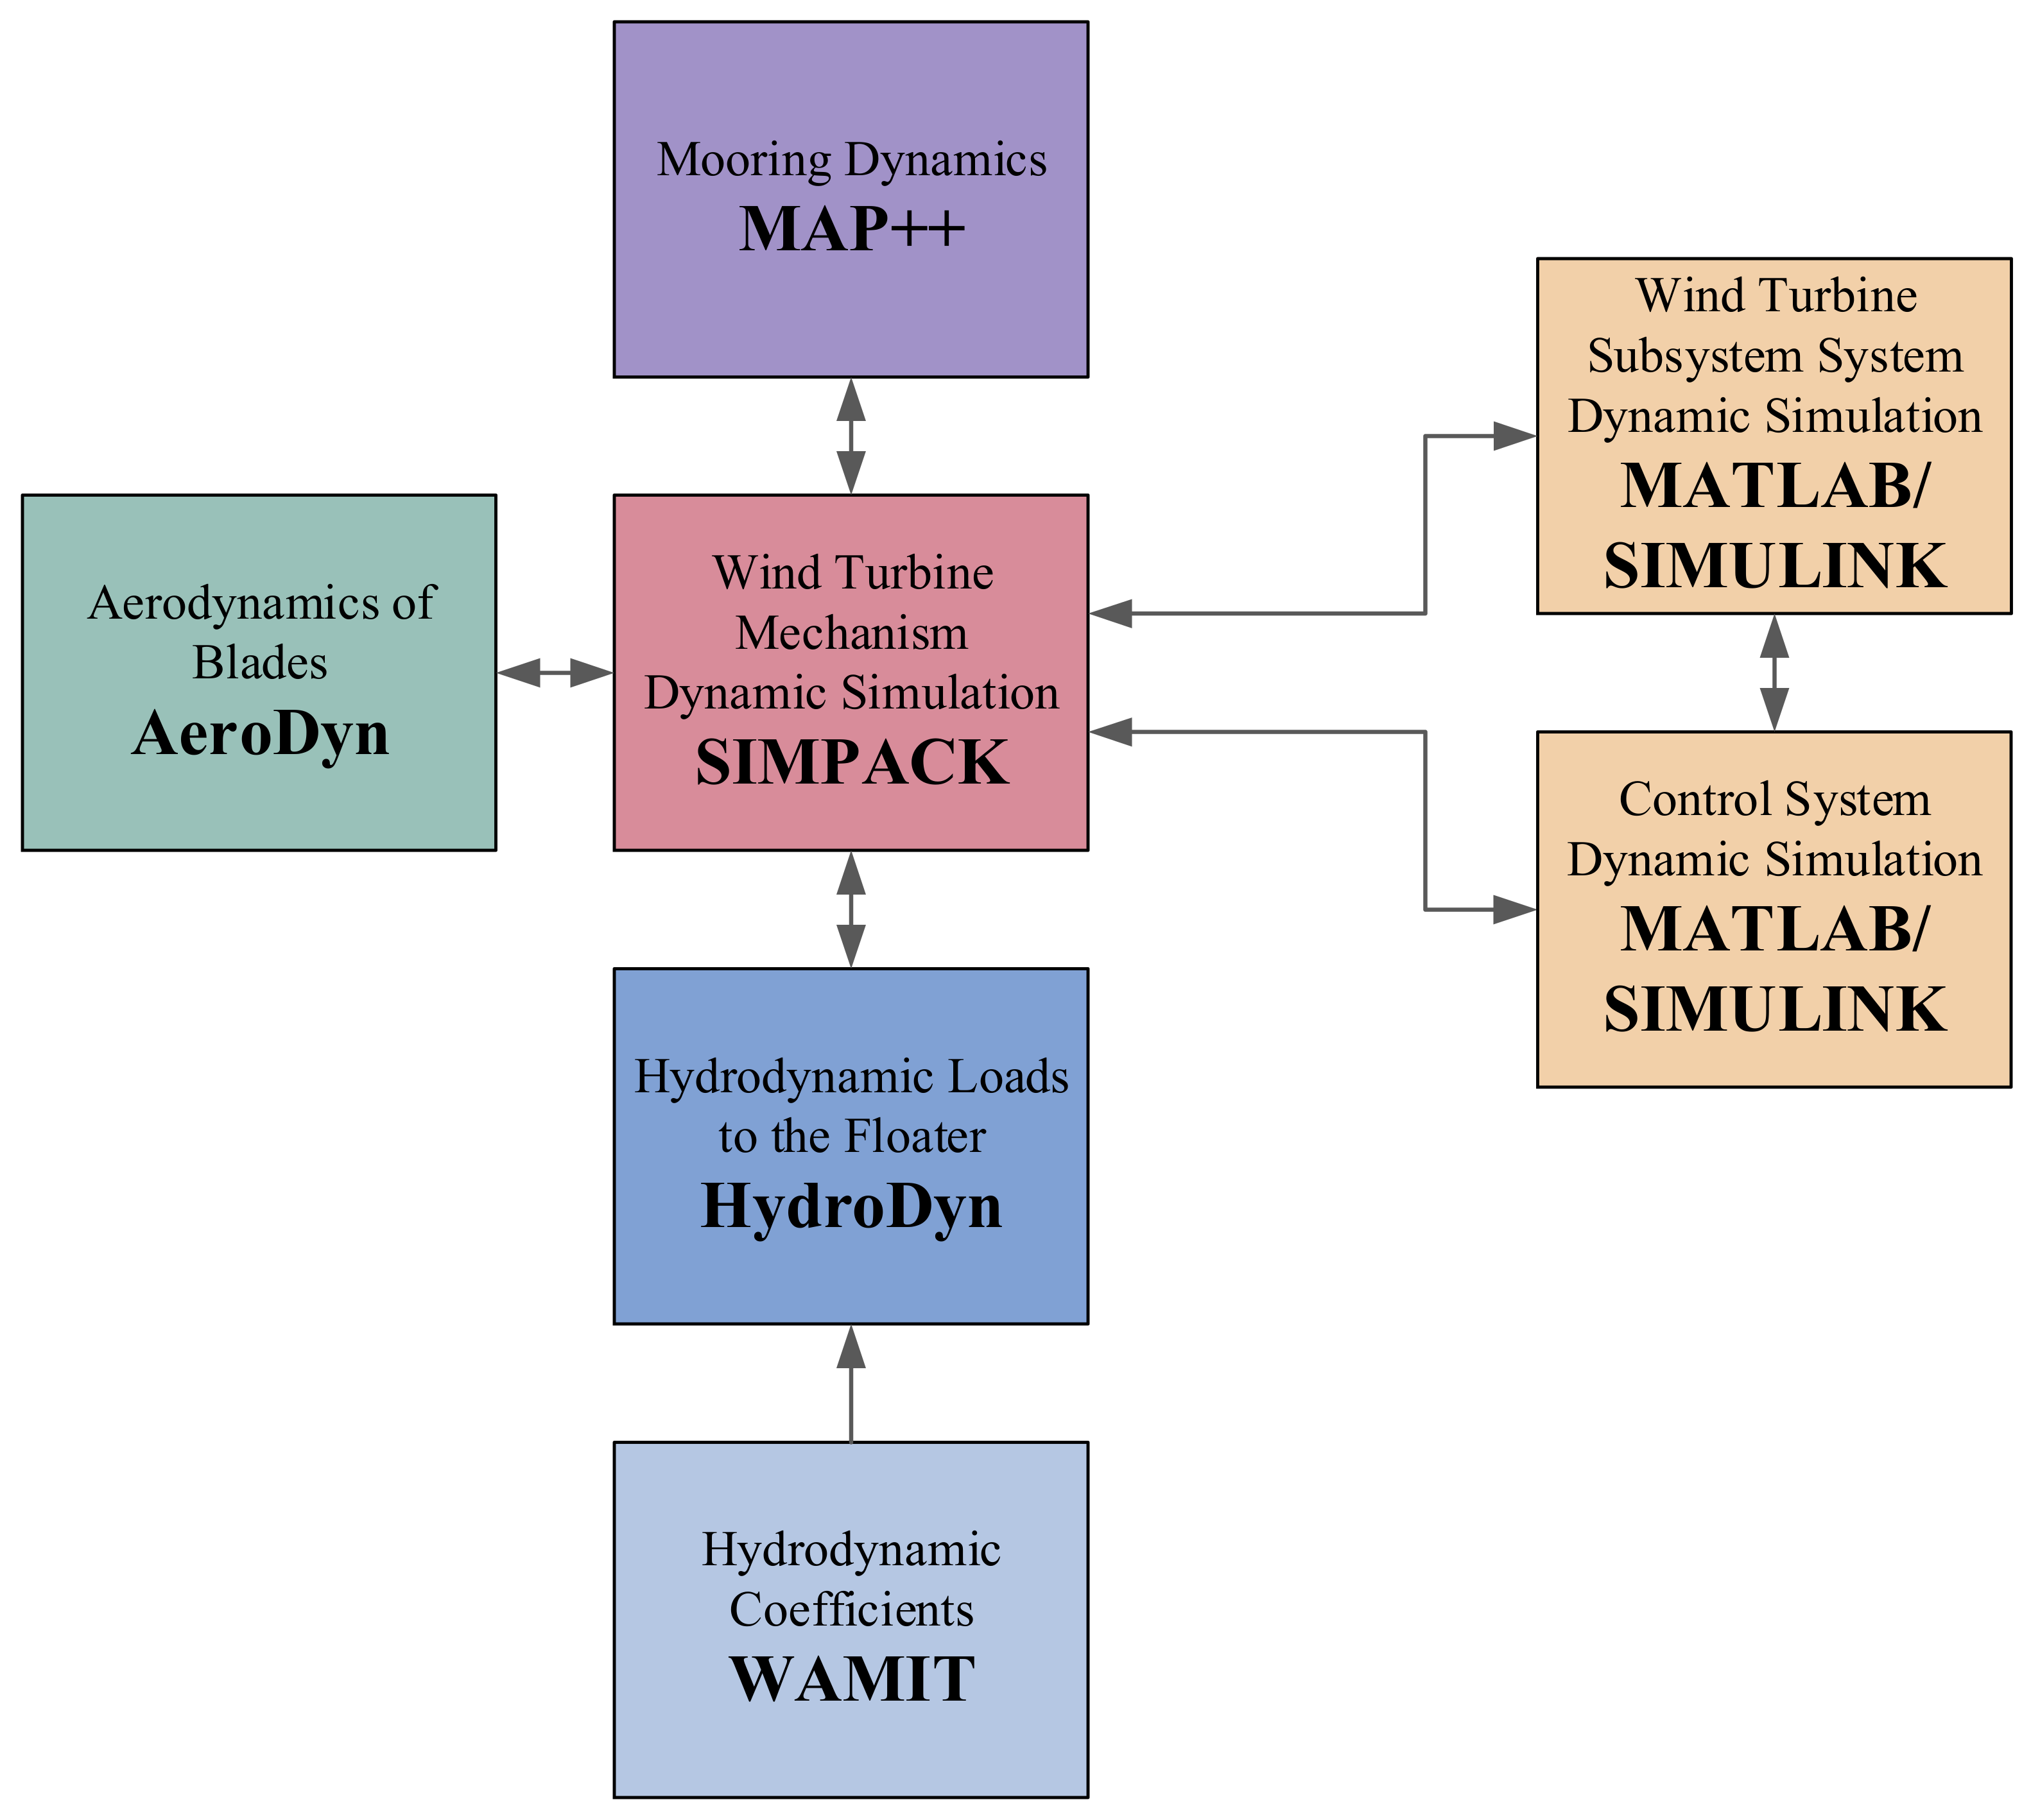
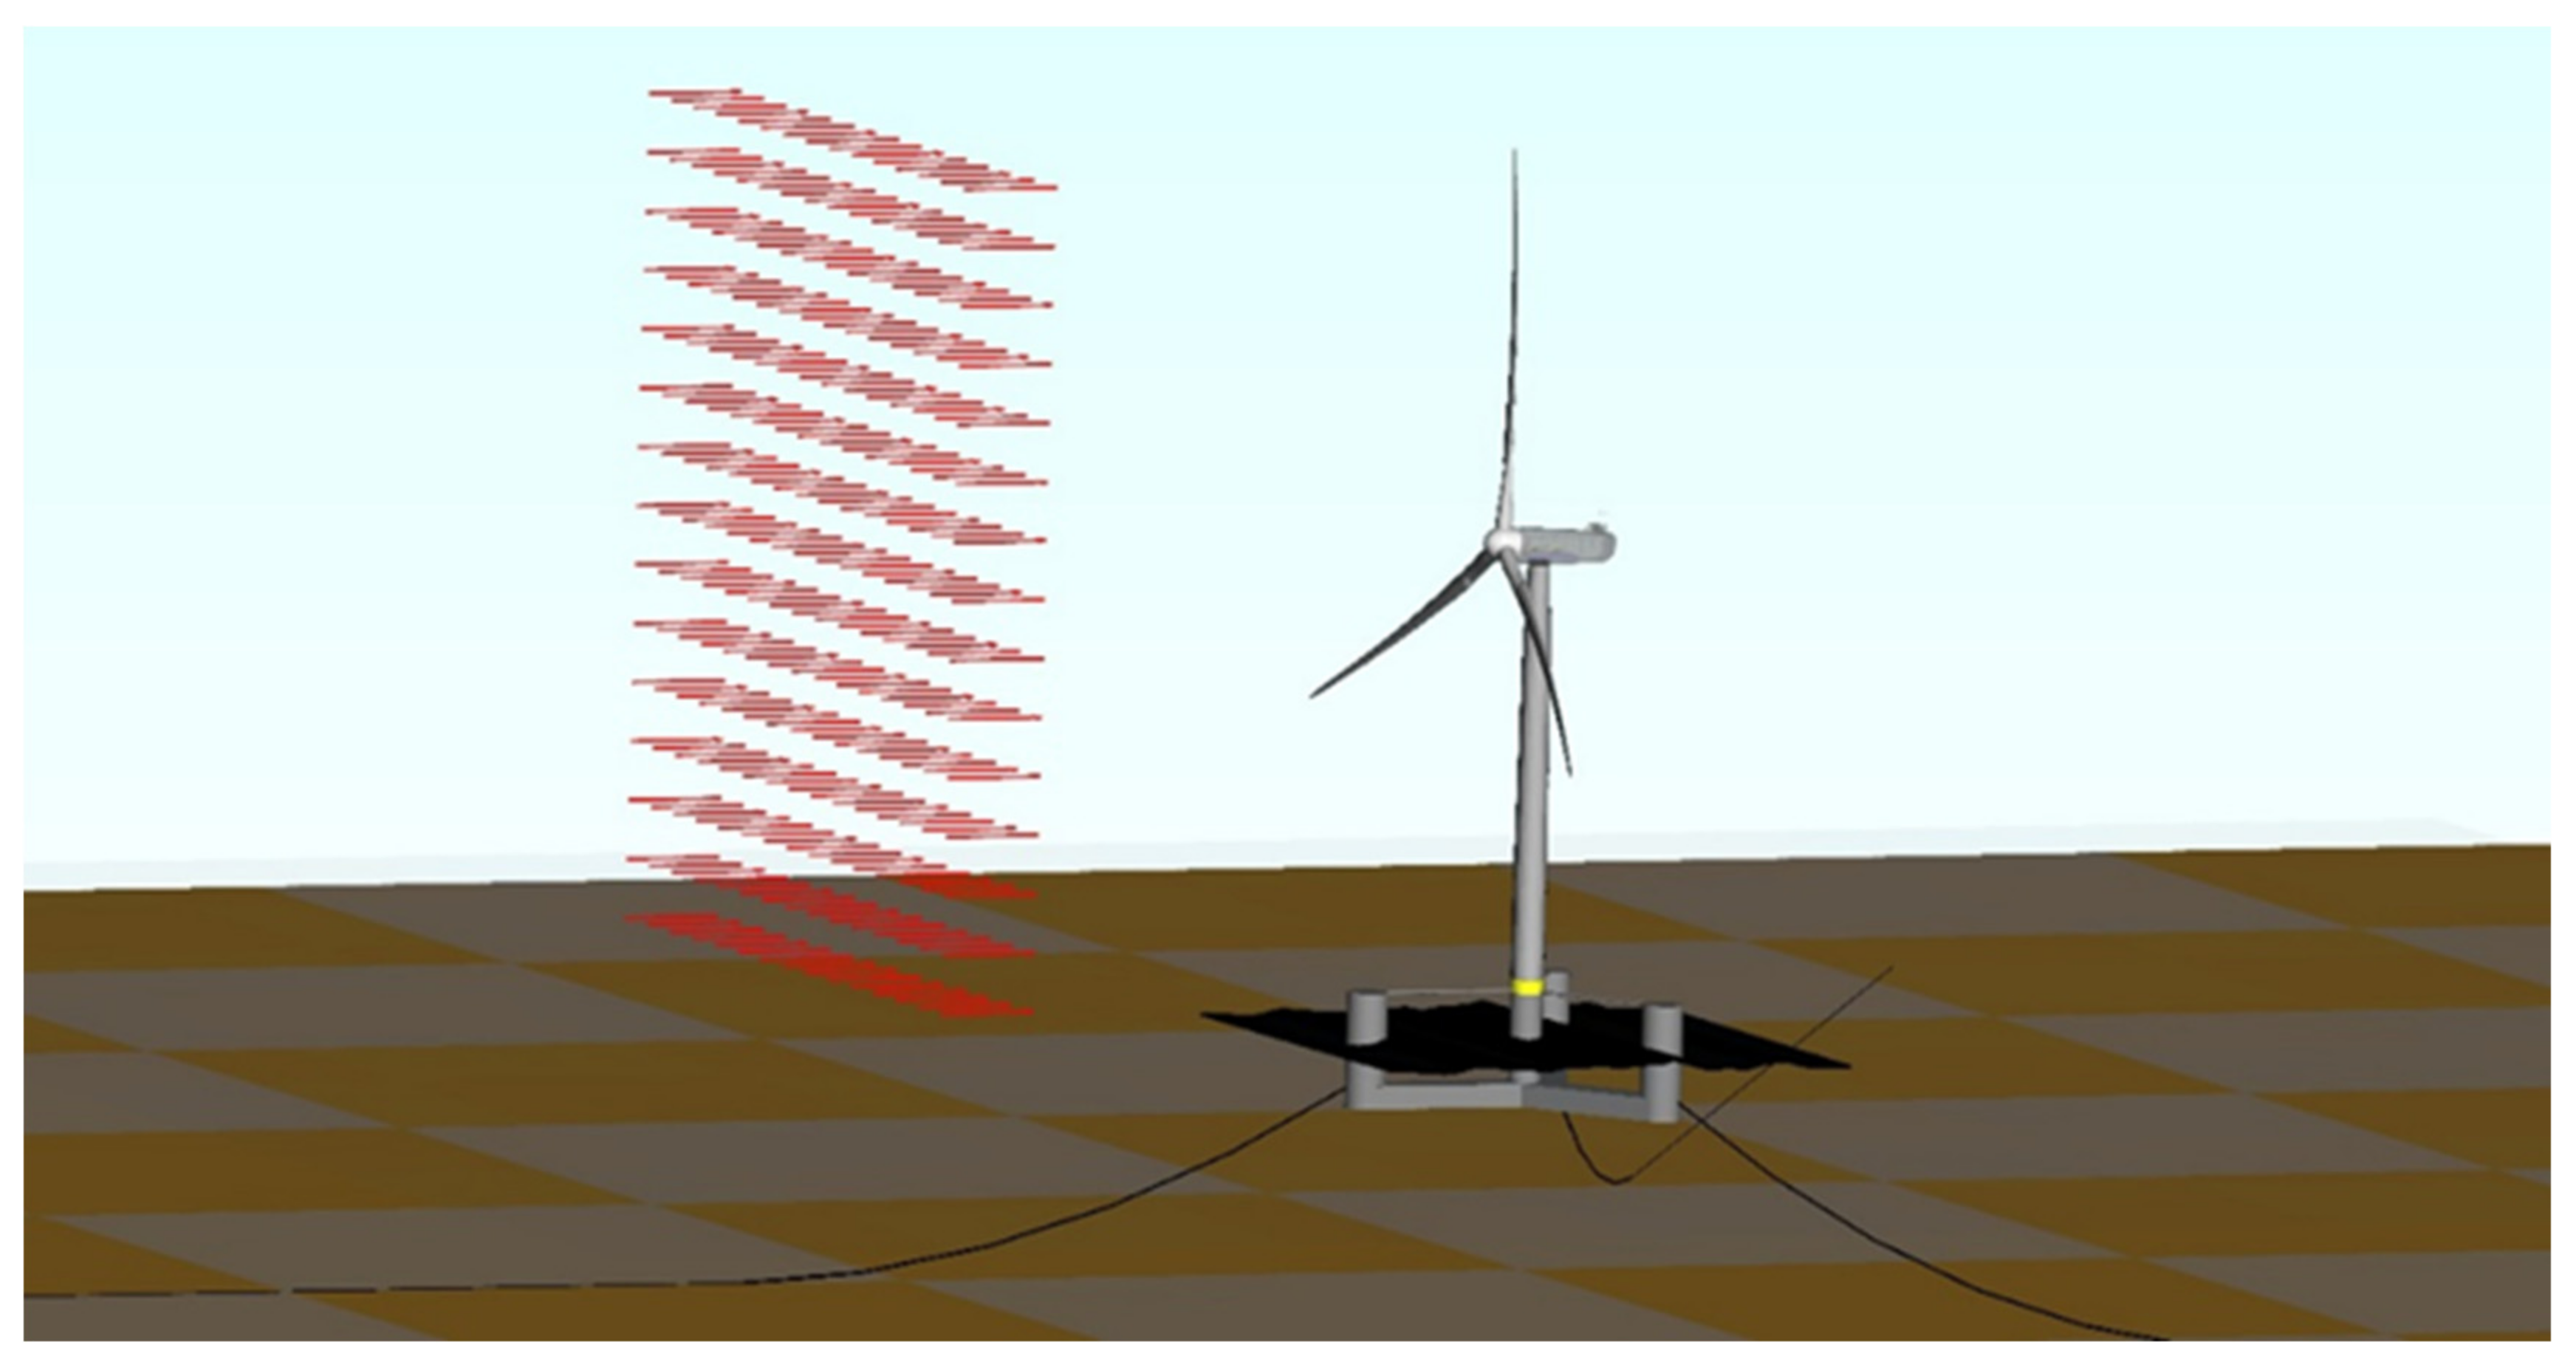
2. Simulation Software Framework
3. 15 MW Floating-Wind-Turbine Model
3.1. Wind-Speed and Wave Conditions
3.2. 15 MW Floating-Wind-Turbine Model
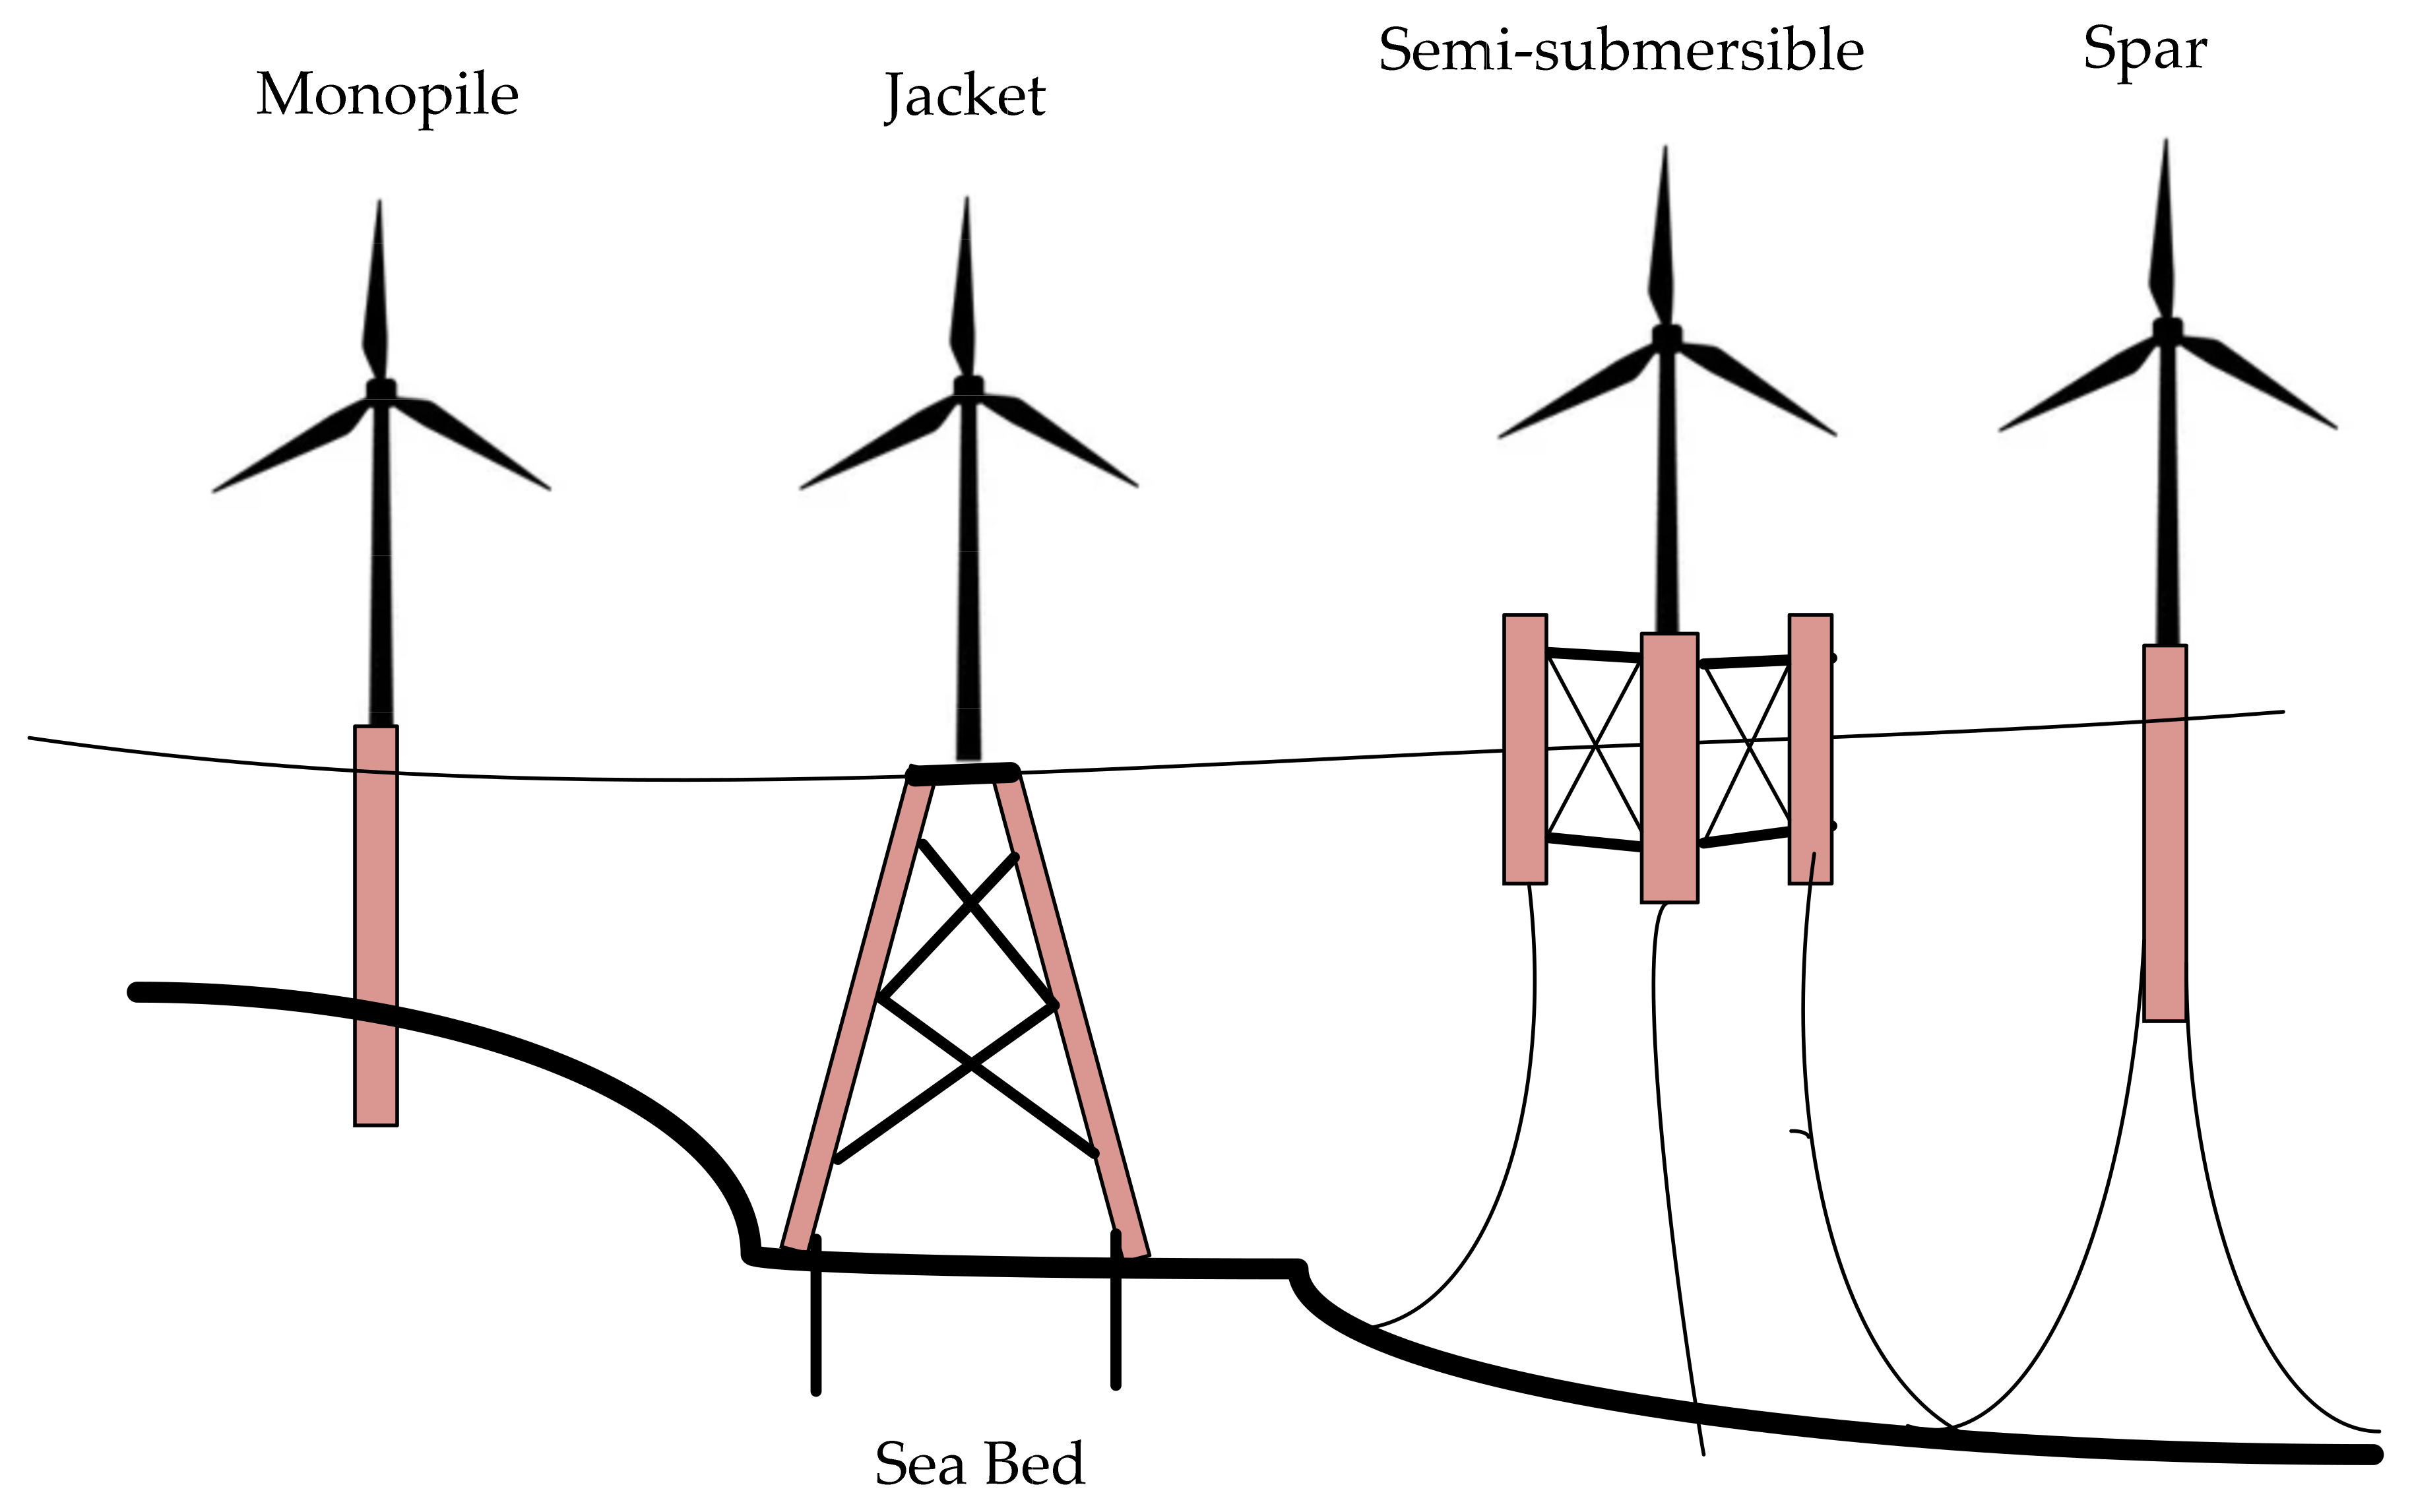
3.3. Floating-Platform and Mooring-System Model
4. Subsystem Modeling of Floating-Wind-Turbine System
4.1. Doubly-Fed Induction Generator
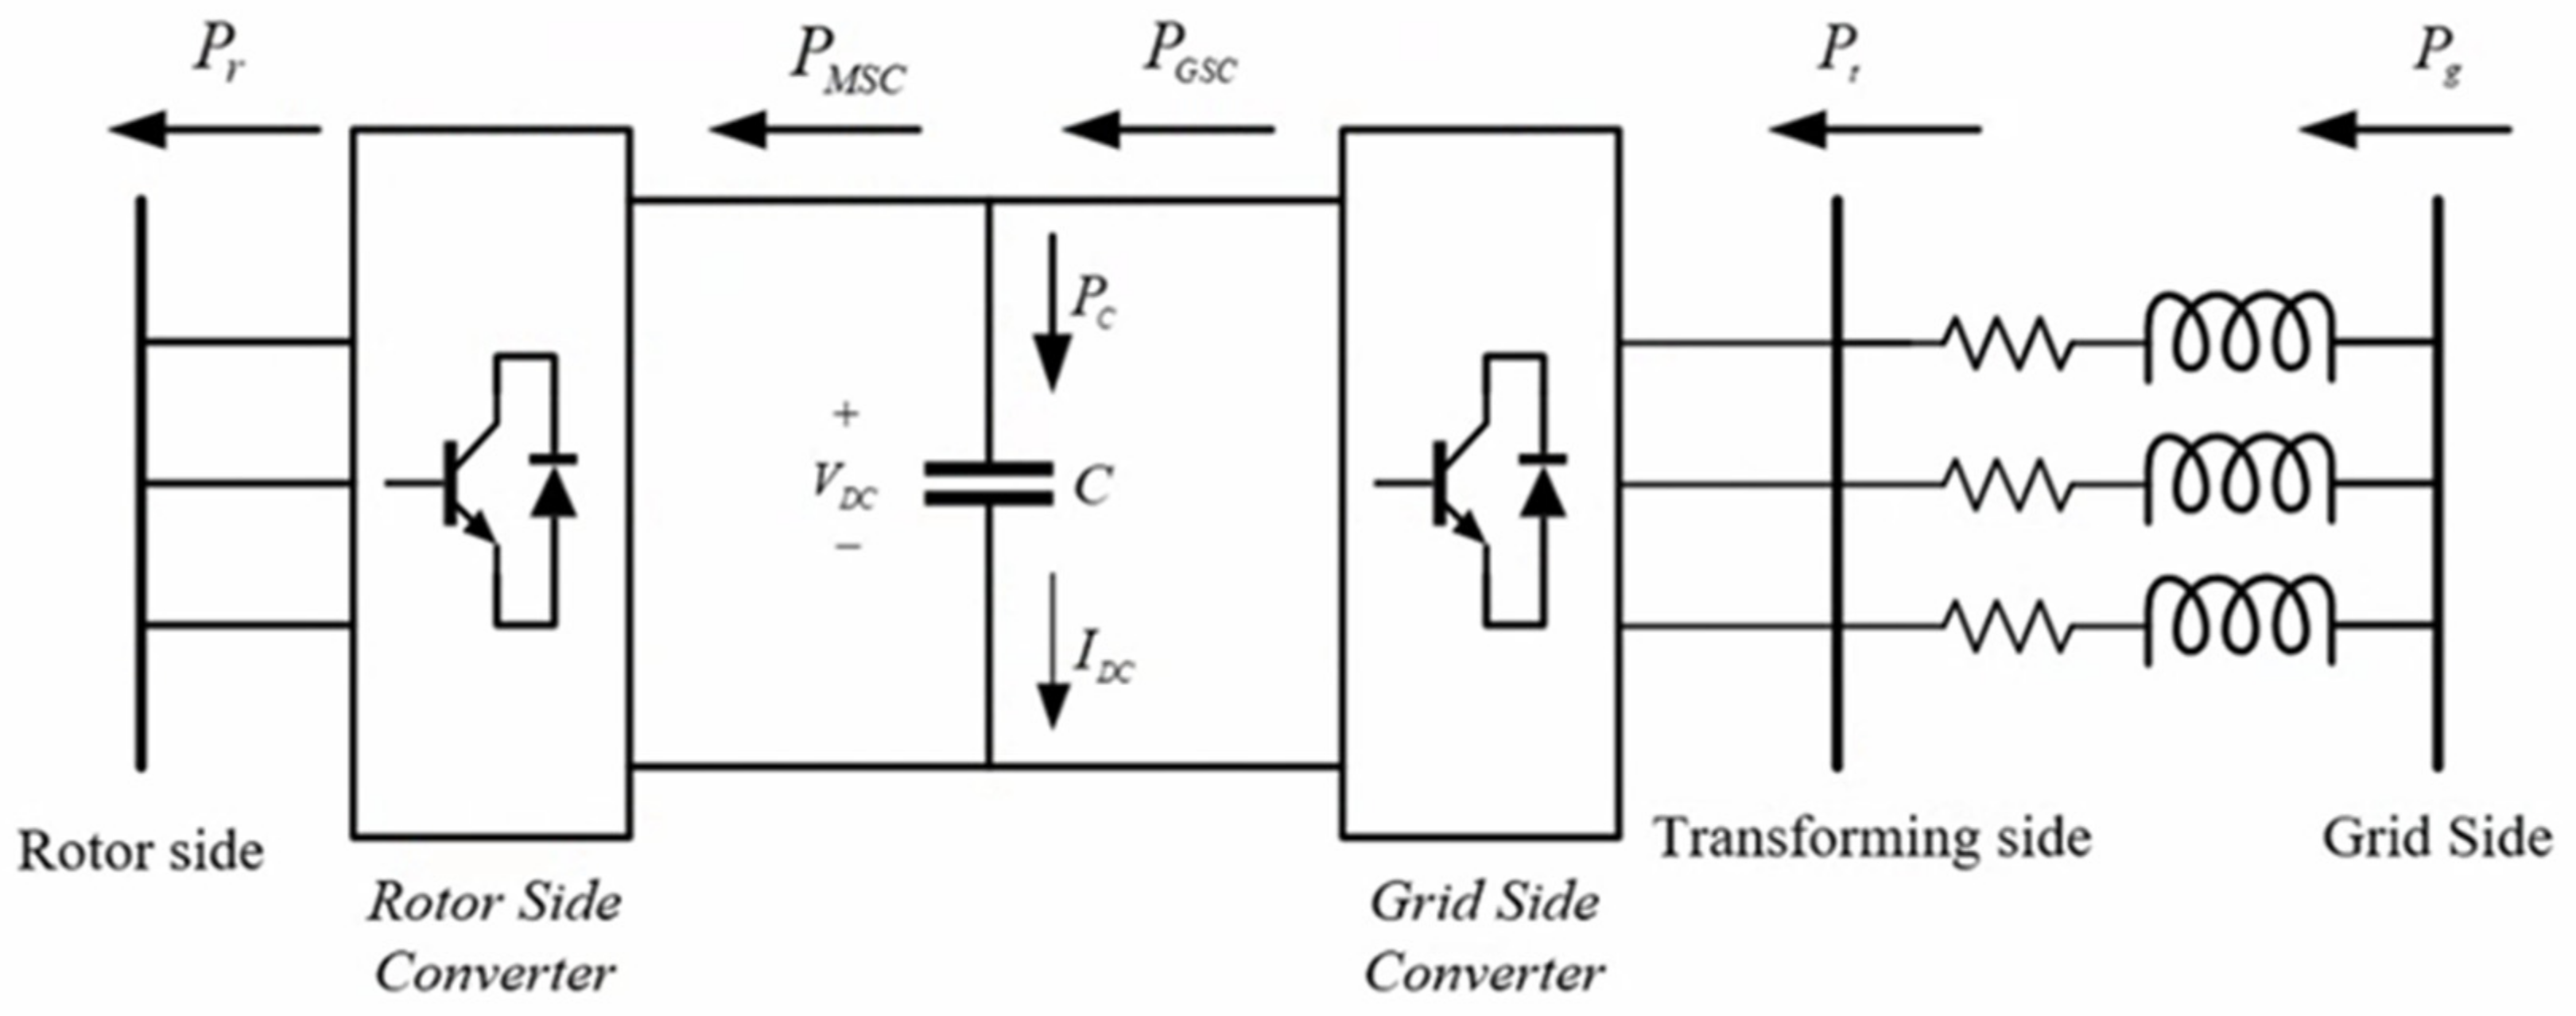
4.2. Grid-Connected System
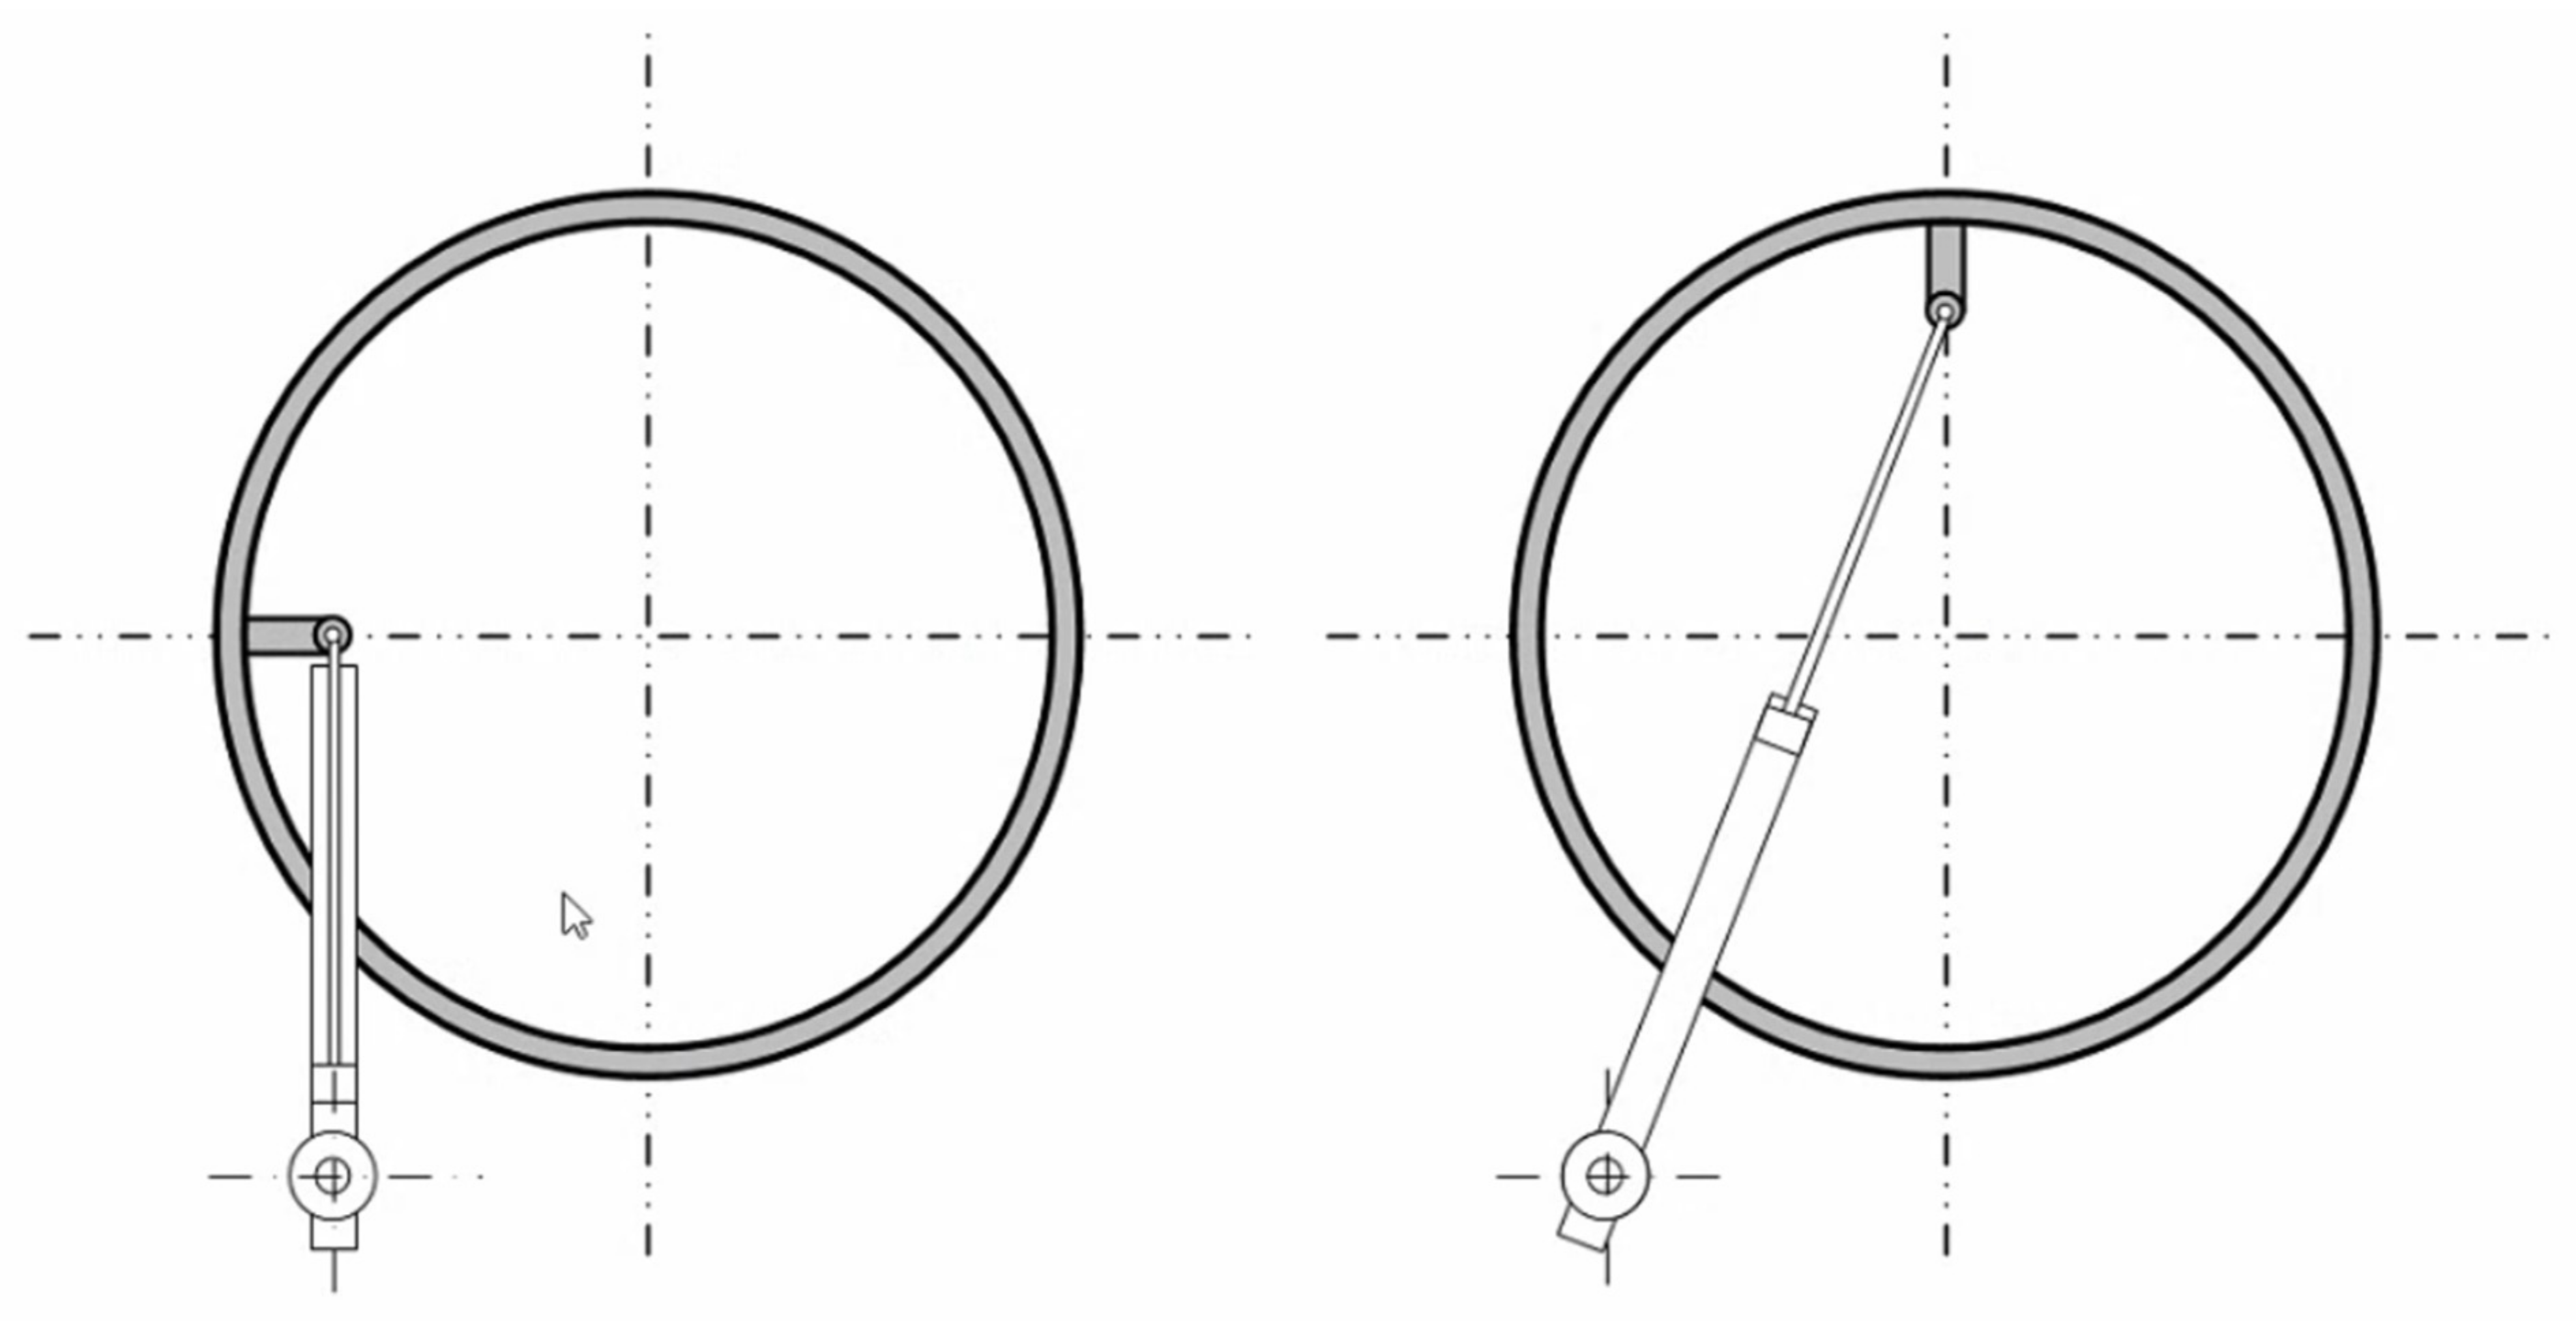
4.3. Hydraulic Variable-Pitch Control System
5. 15 MW Wind-Turbine Control
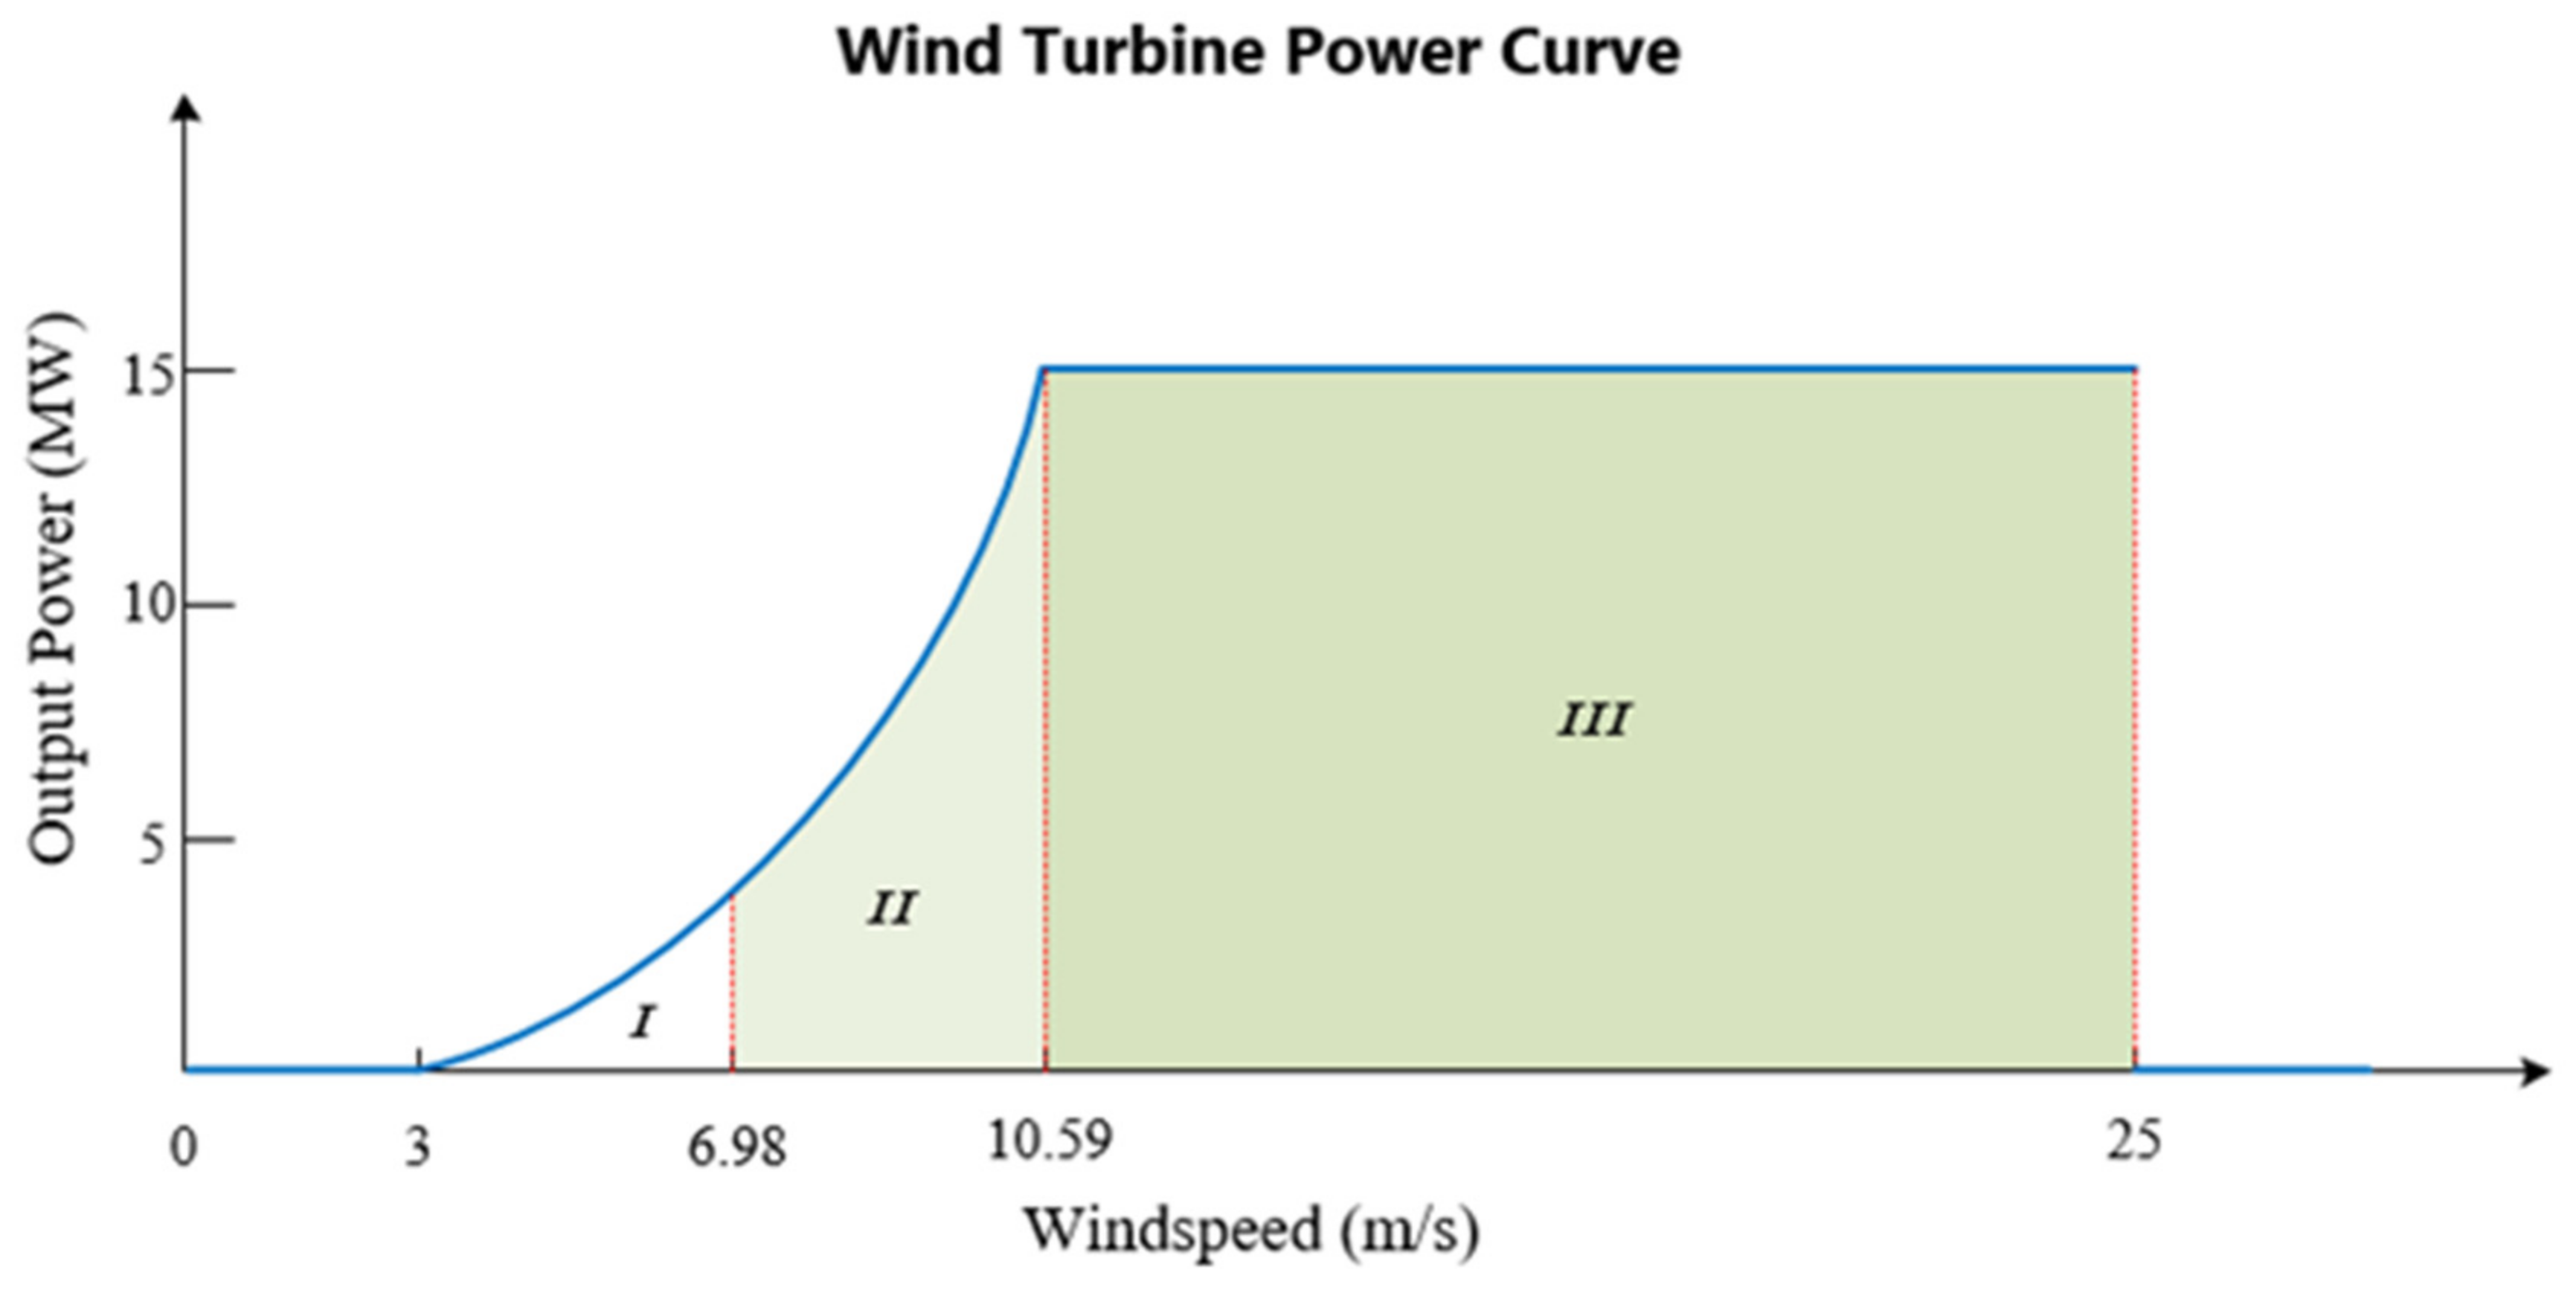
5.1. 15 MW Wind-Turbine Control Strategy
- Region I: Minimum Rotor Speed
- Region II: Optimal Tip-Speed Ratio
- Region III: Rated Power
5.2. Control Theory and Power-Controller Design
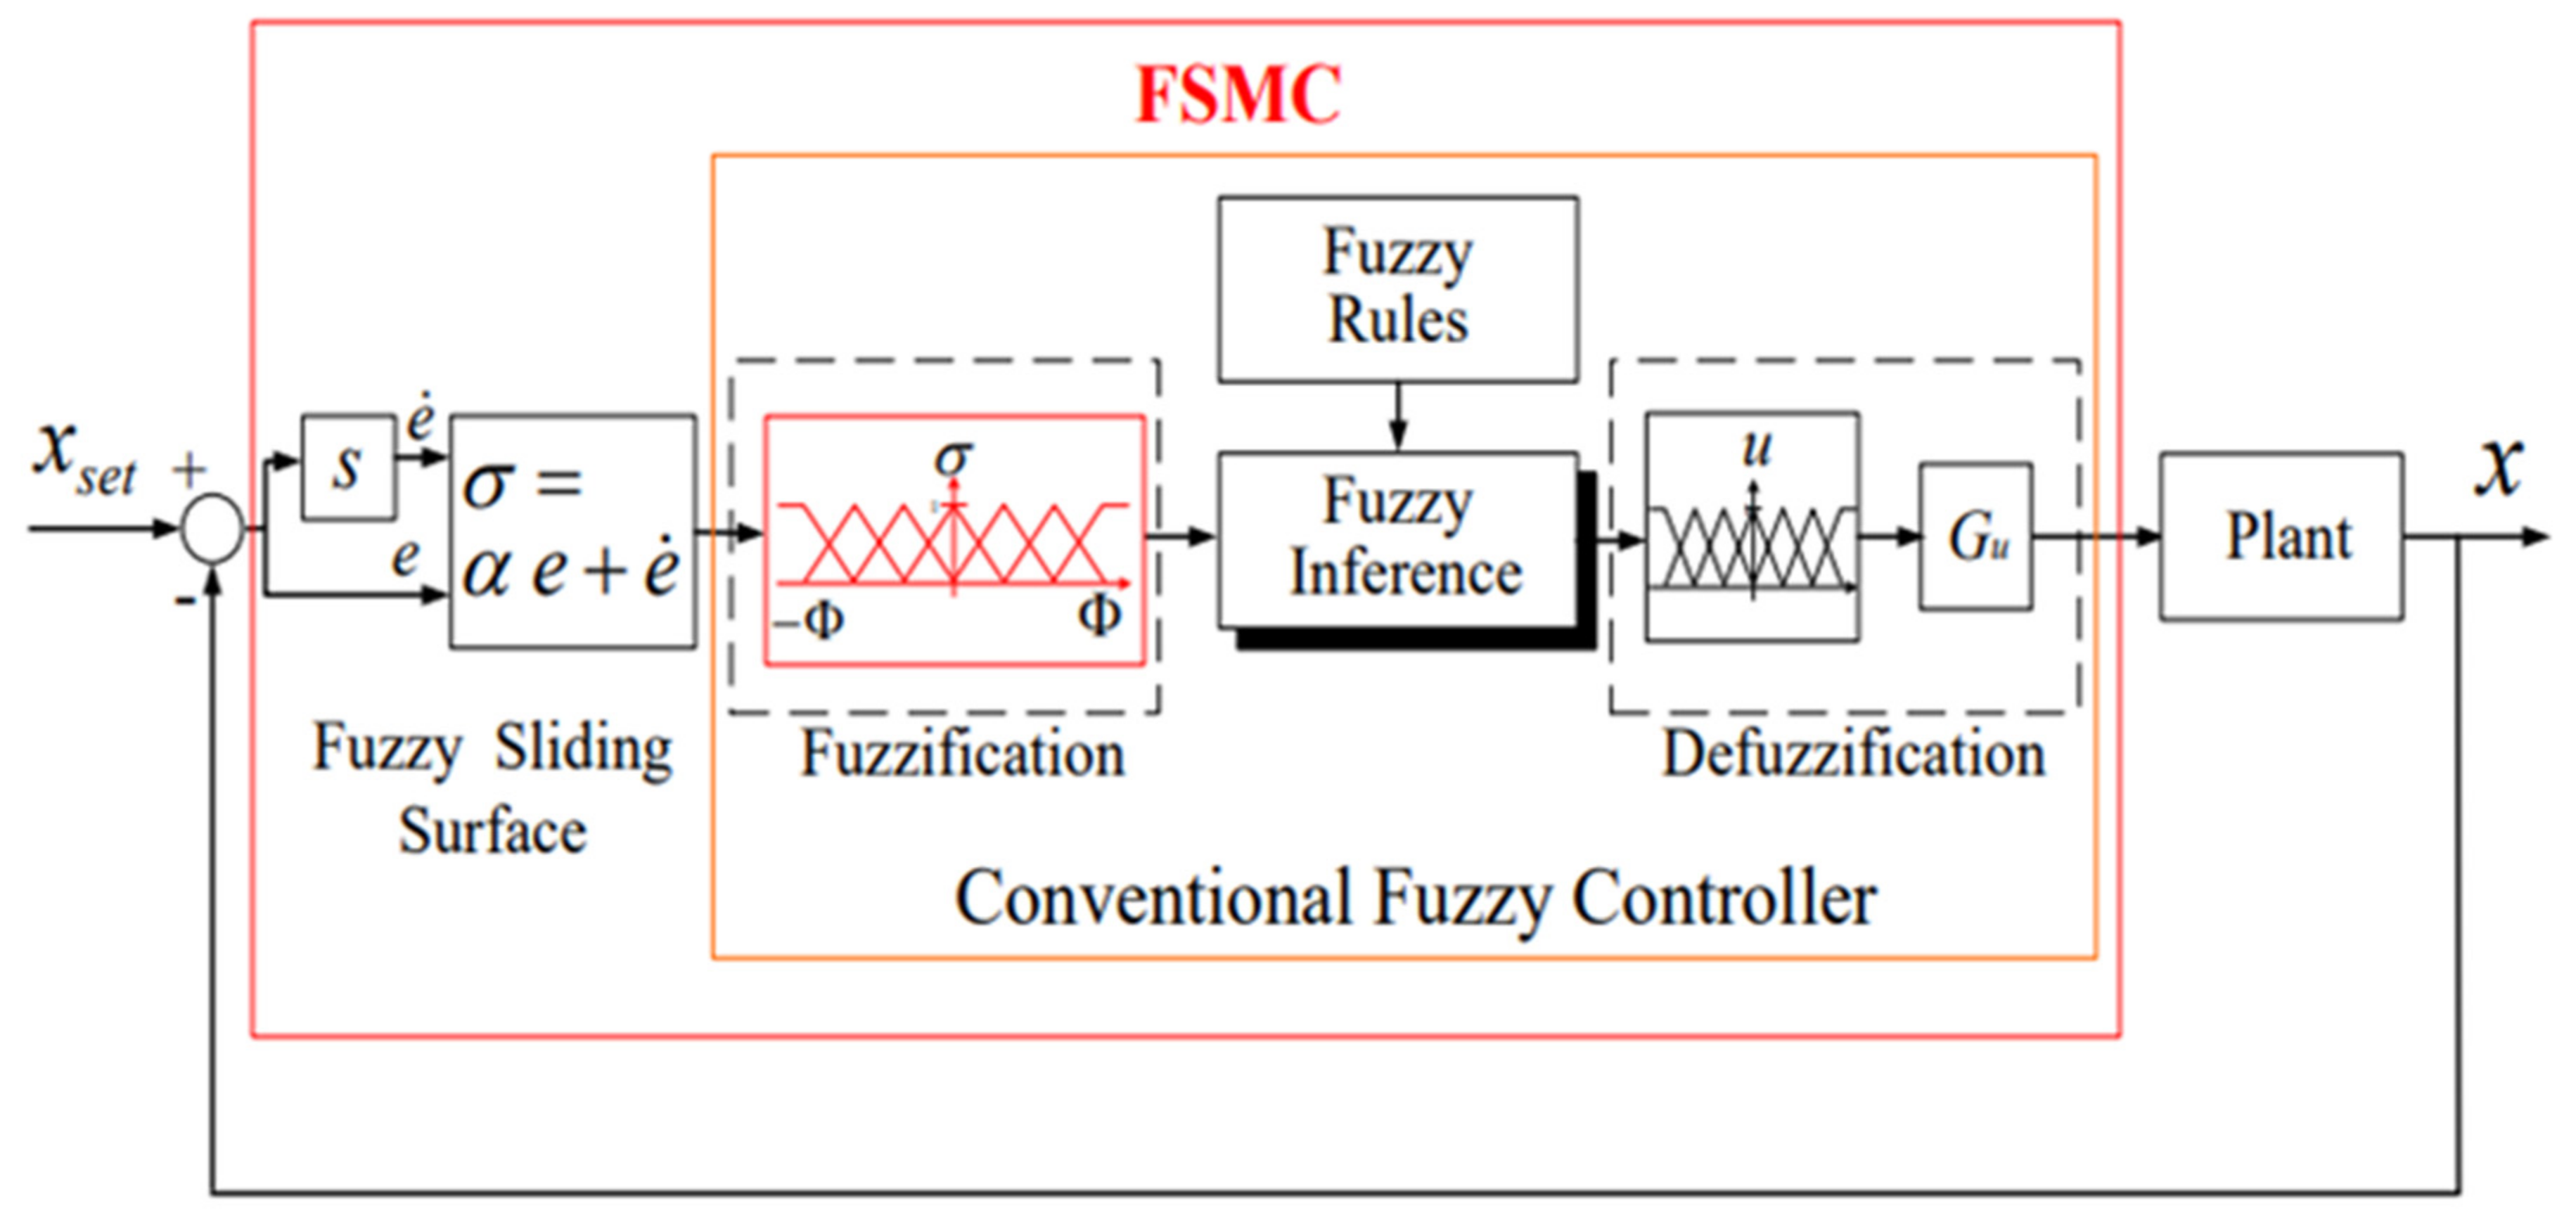
5.2.1. Fuzzy Sliding-Mode Control
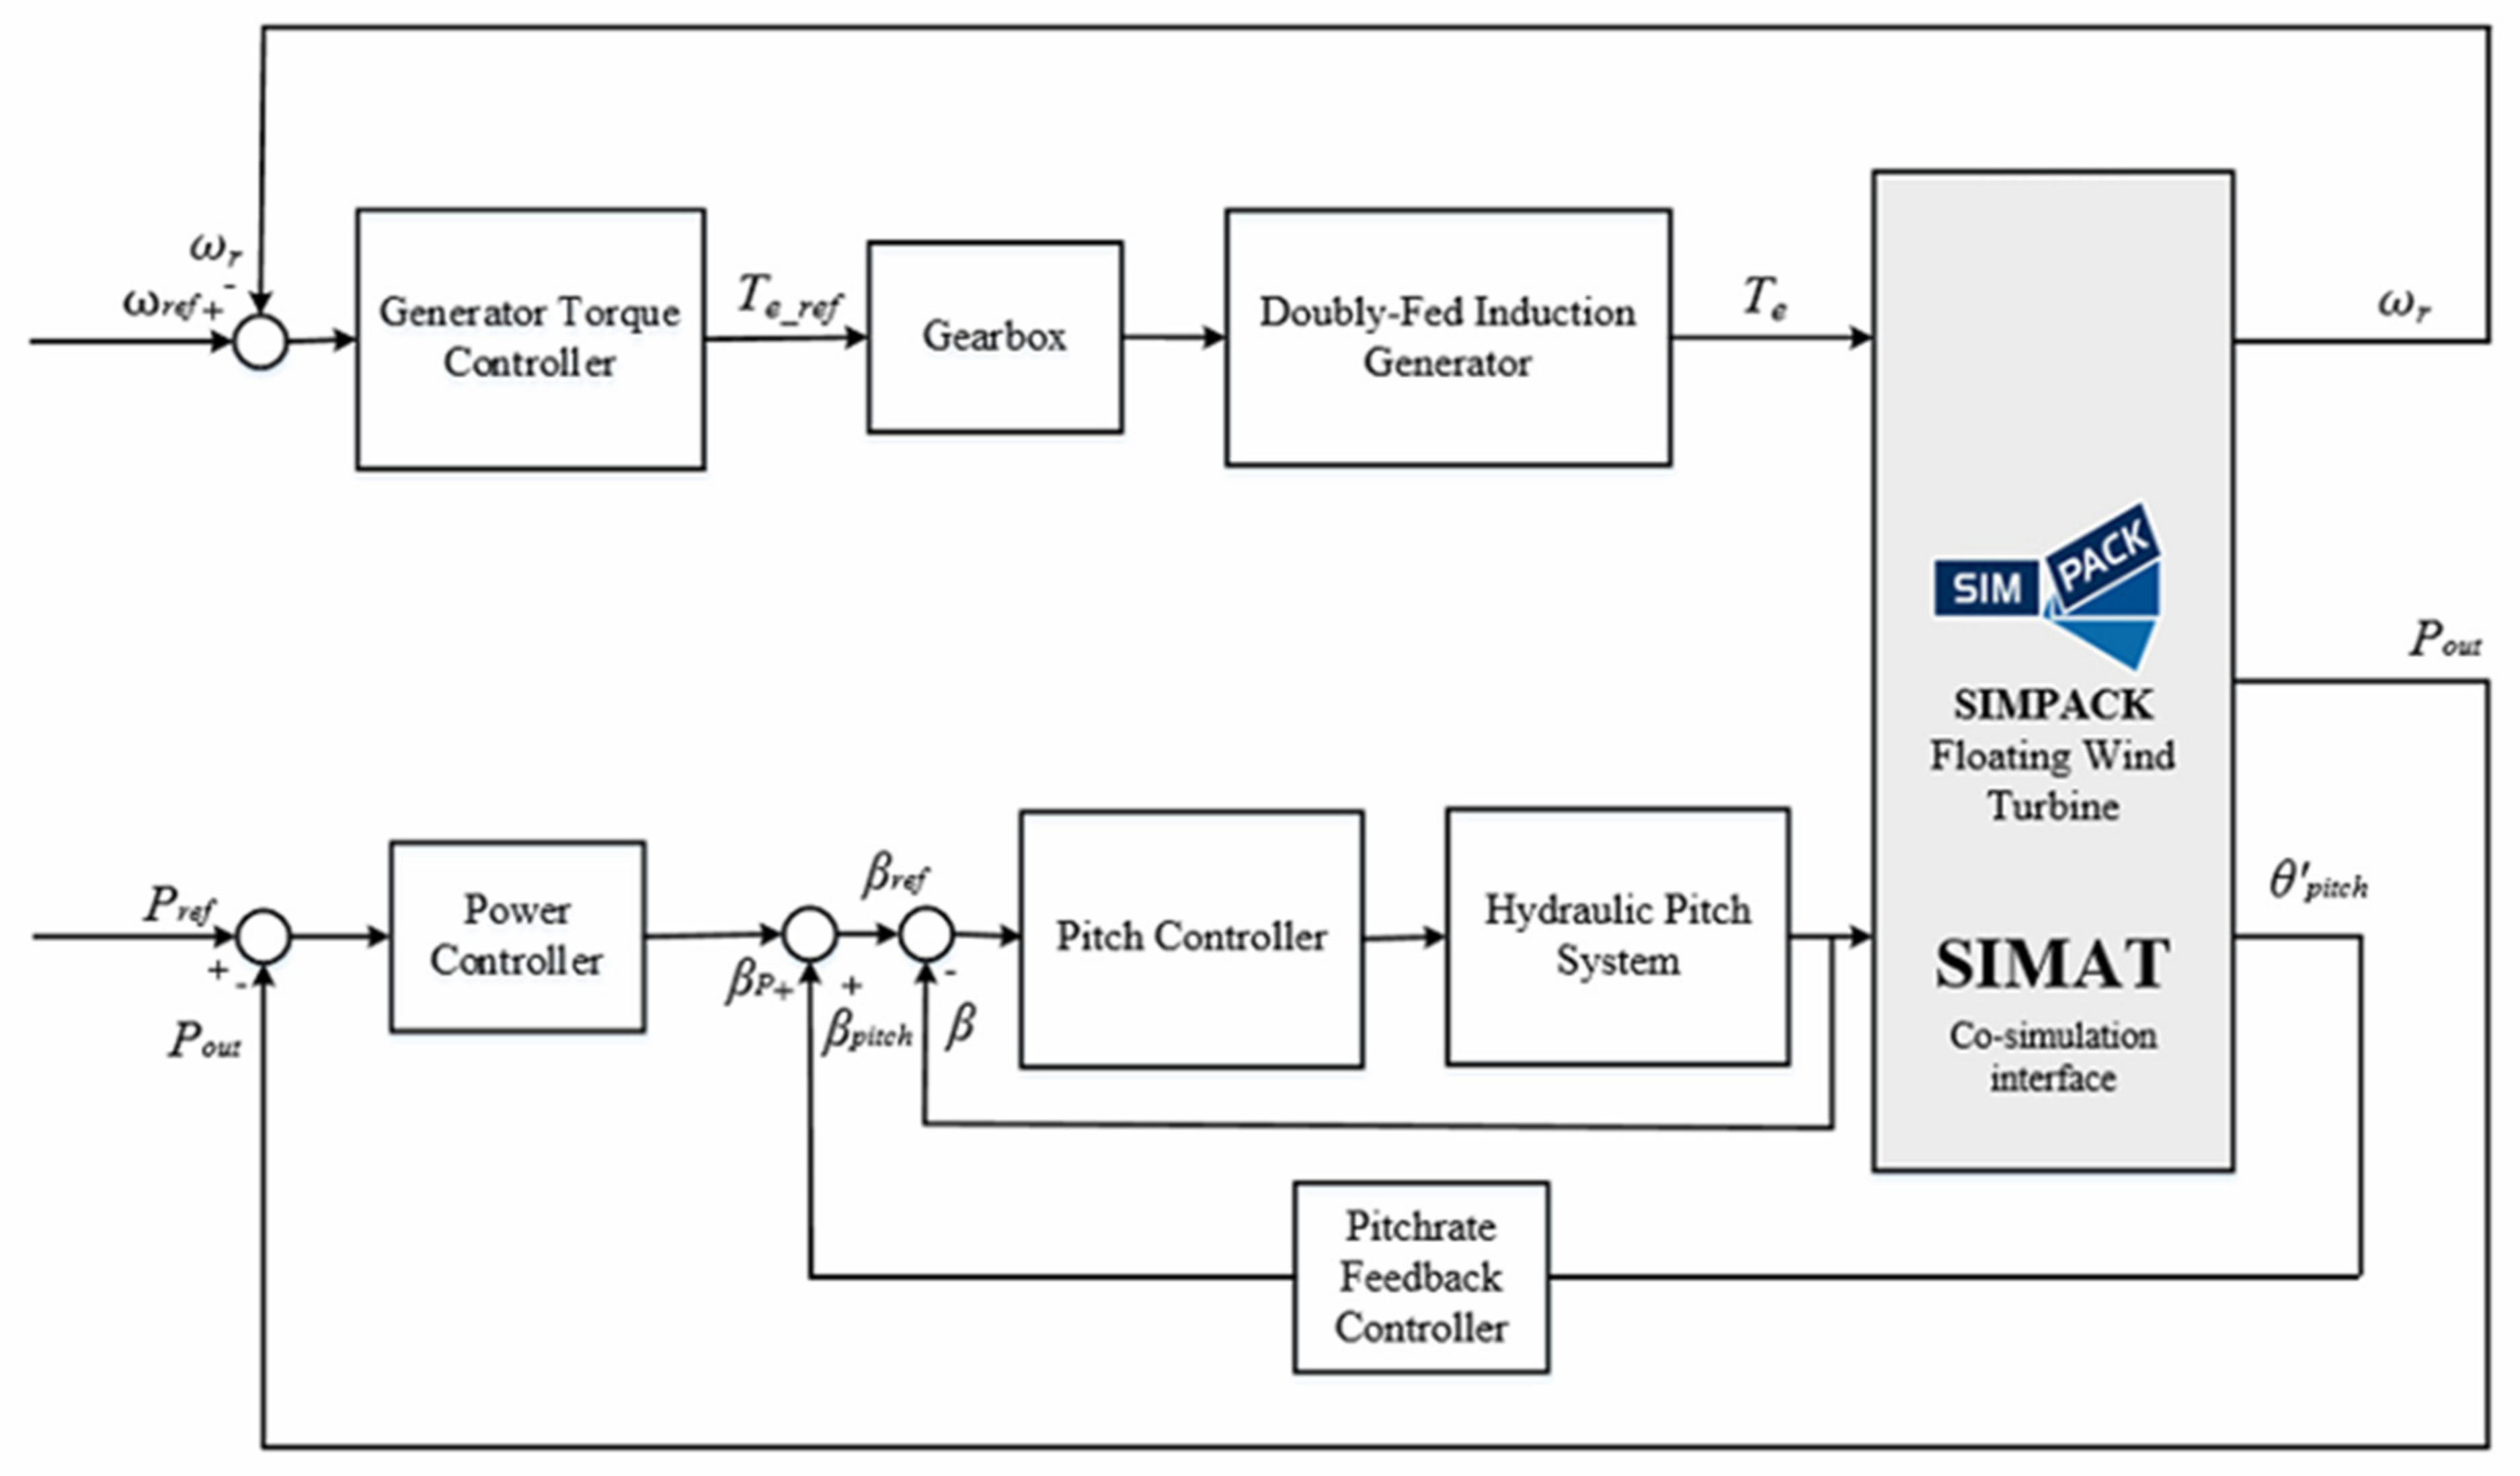
5.2.2. Novel Power Controller with Additional Floating-Platform Pitch-Rate Feedback
6. Simulation Results
6.1. Power Control by FSMC
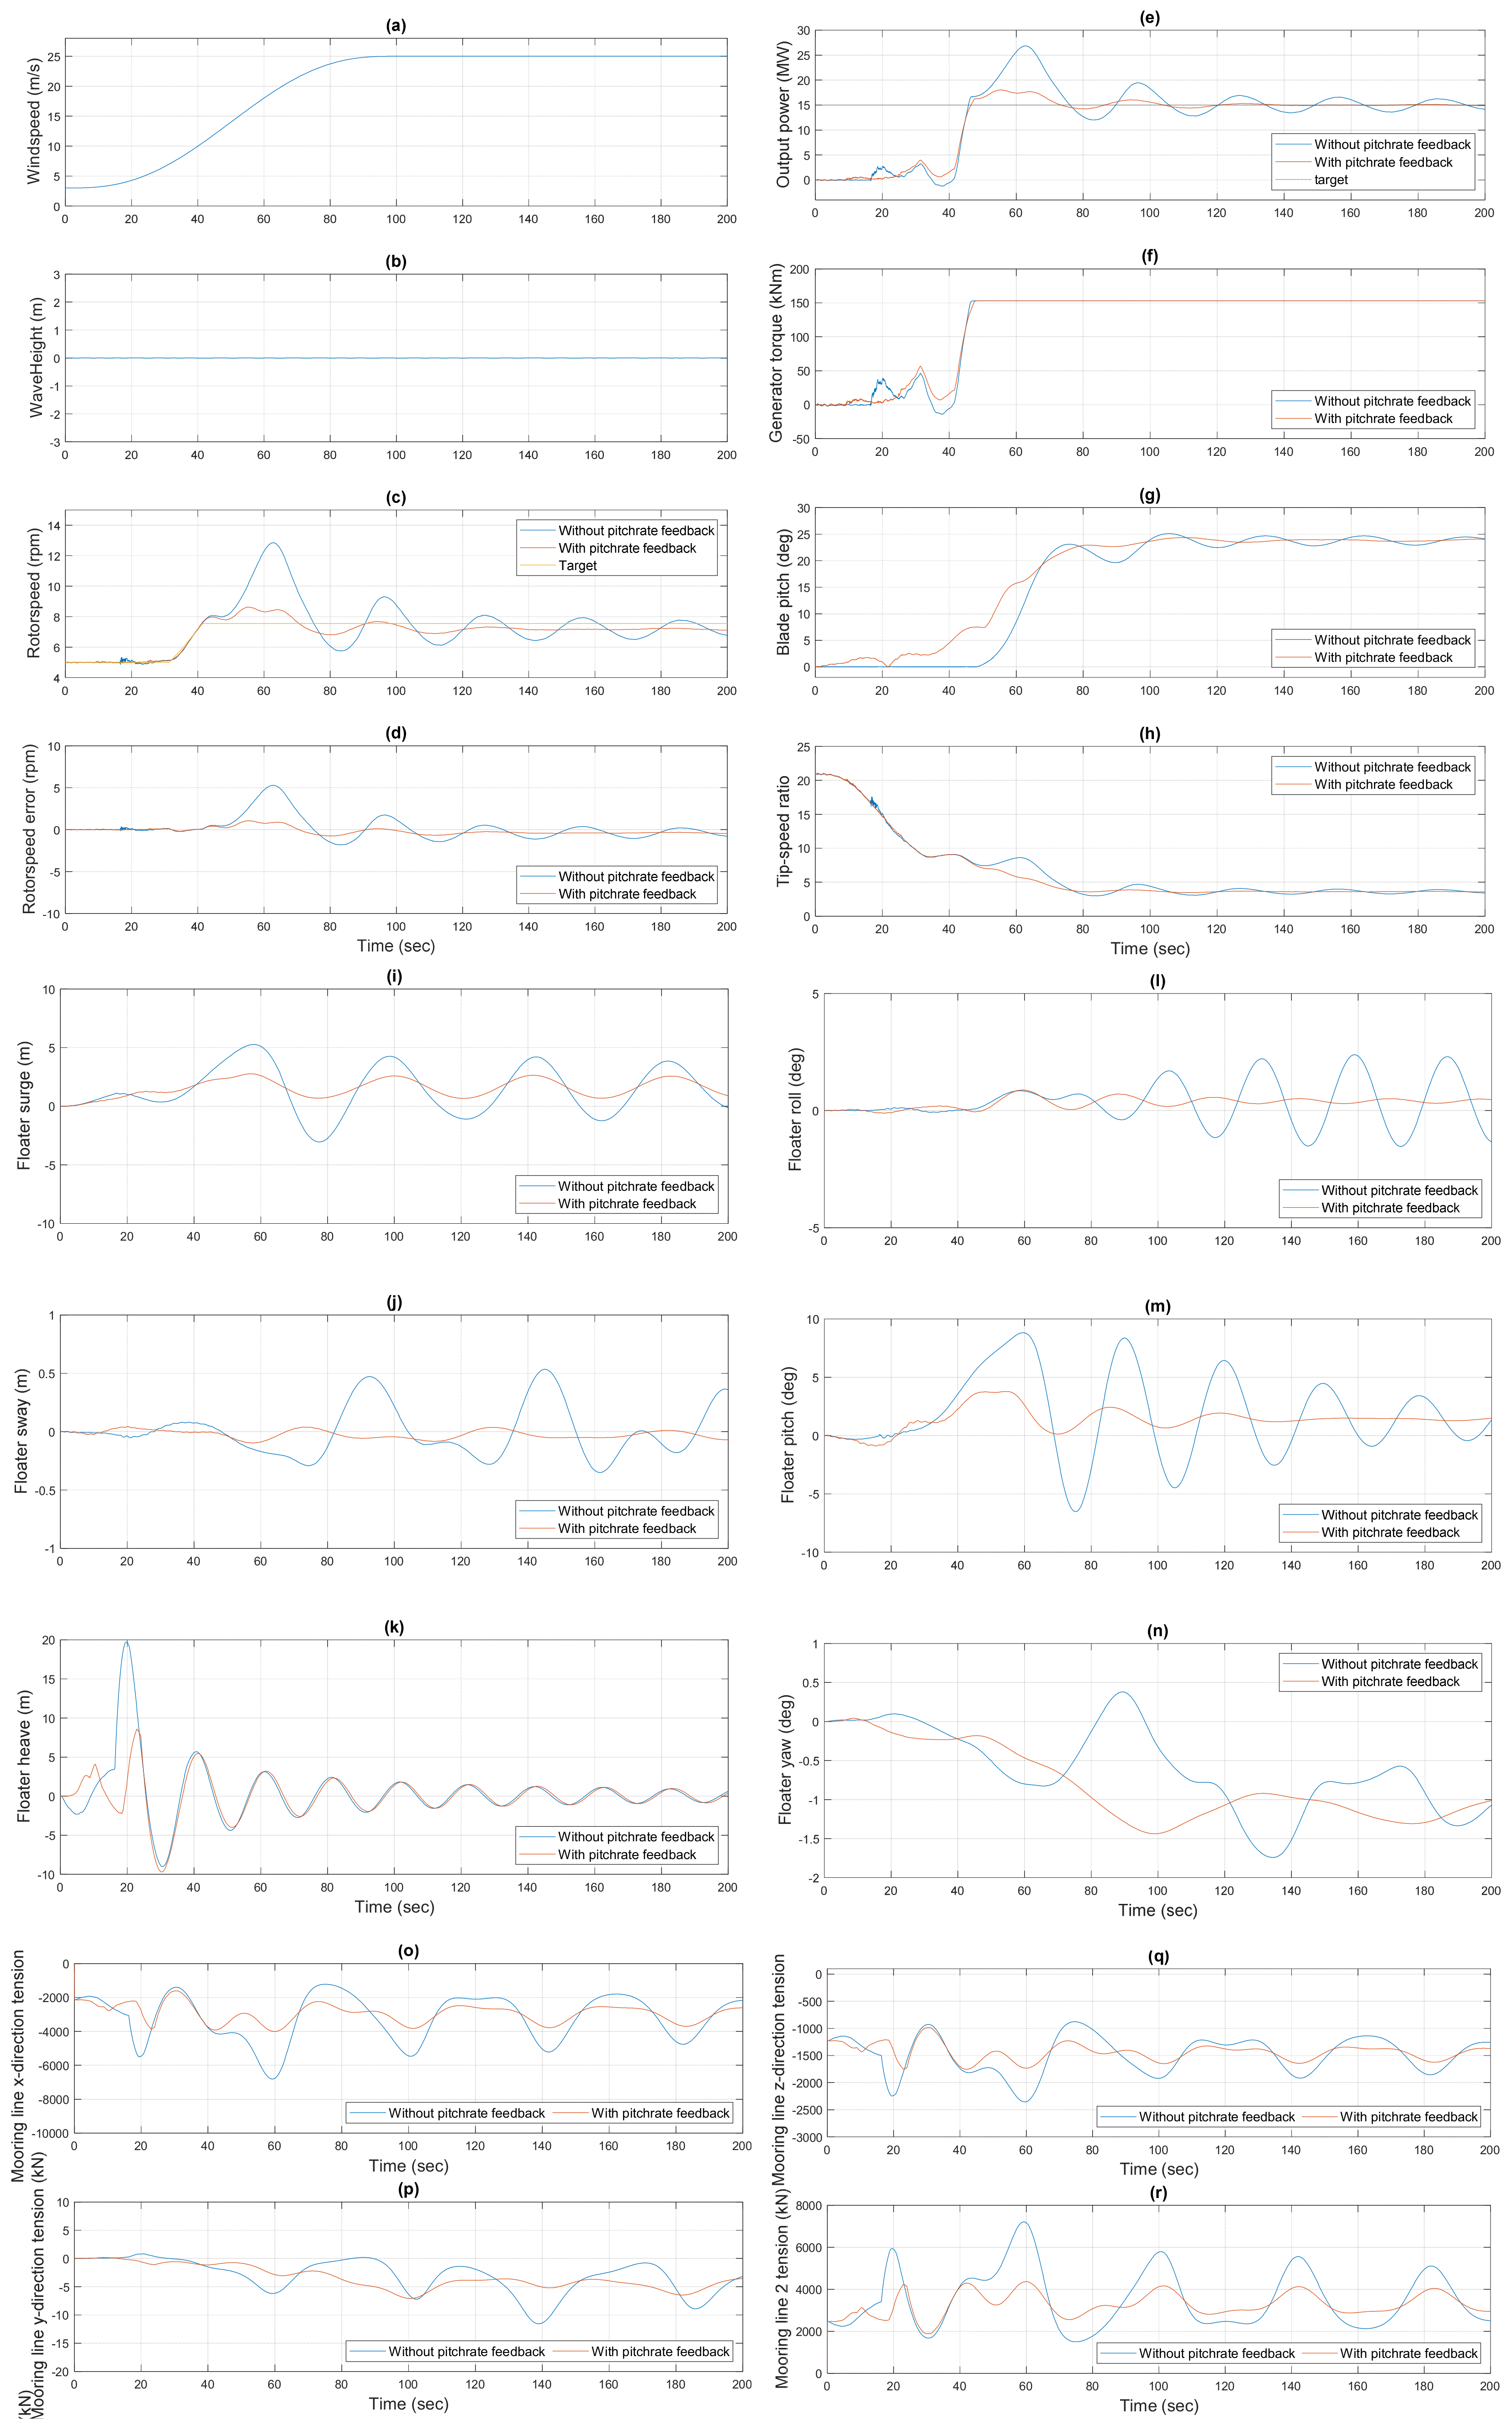
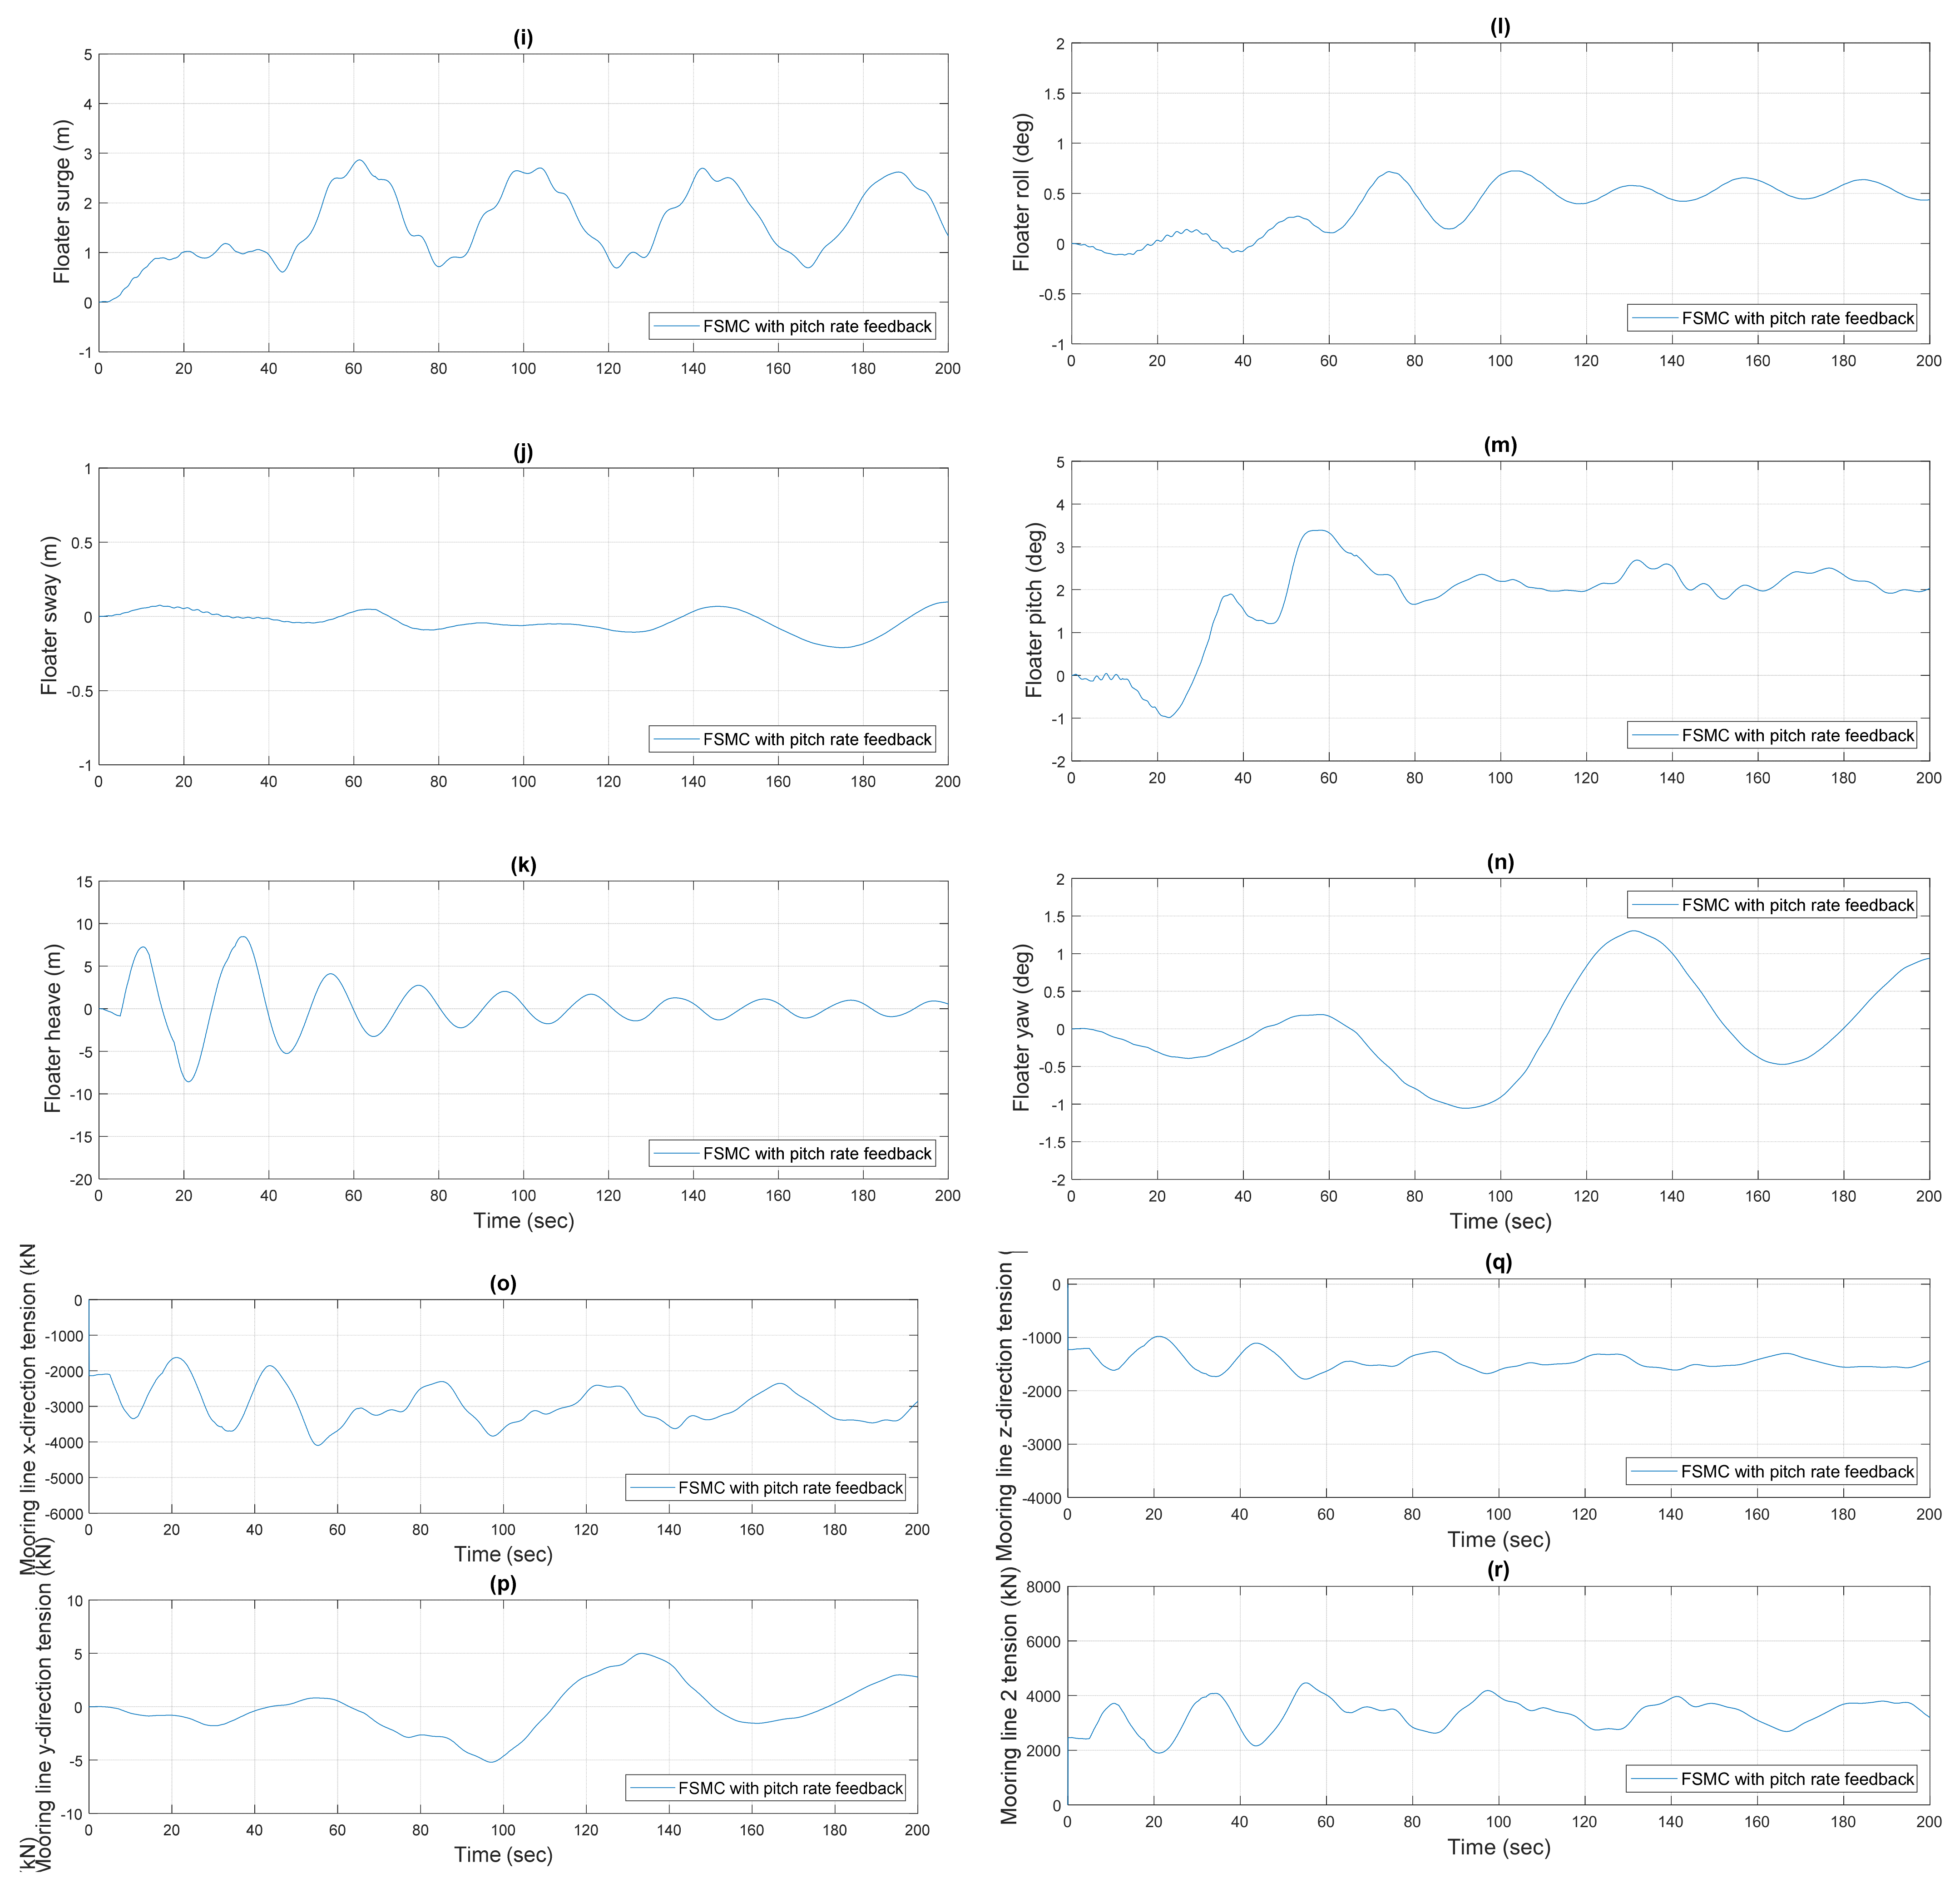
6.2. Power Control by FSMC with Additional Floating-Platform Pitch-Rate Feedback
6.3. Simulation under Normal Operation Conditions
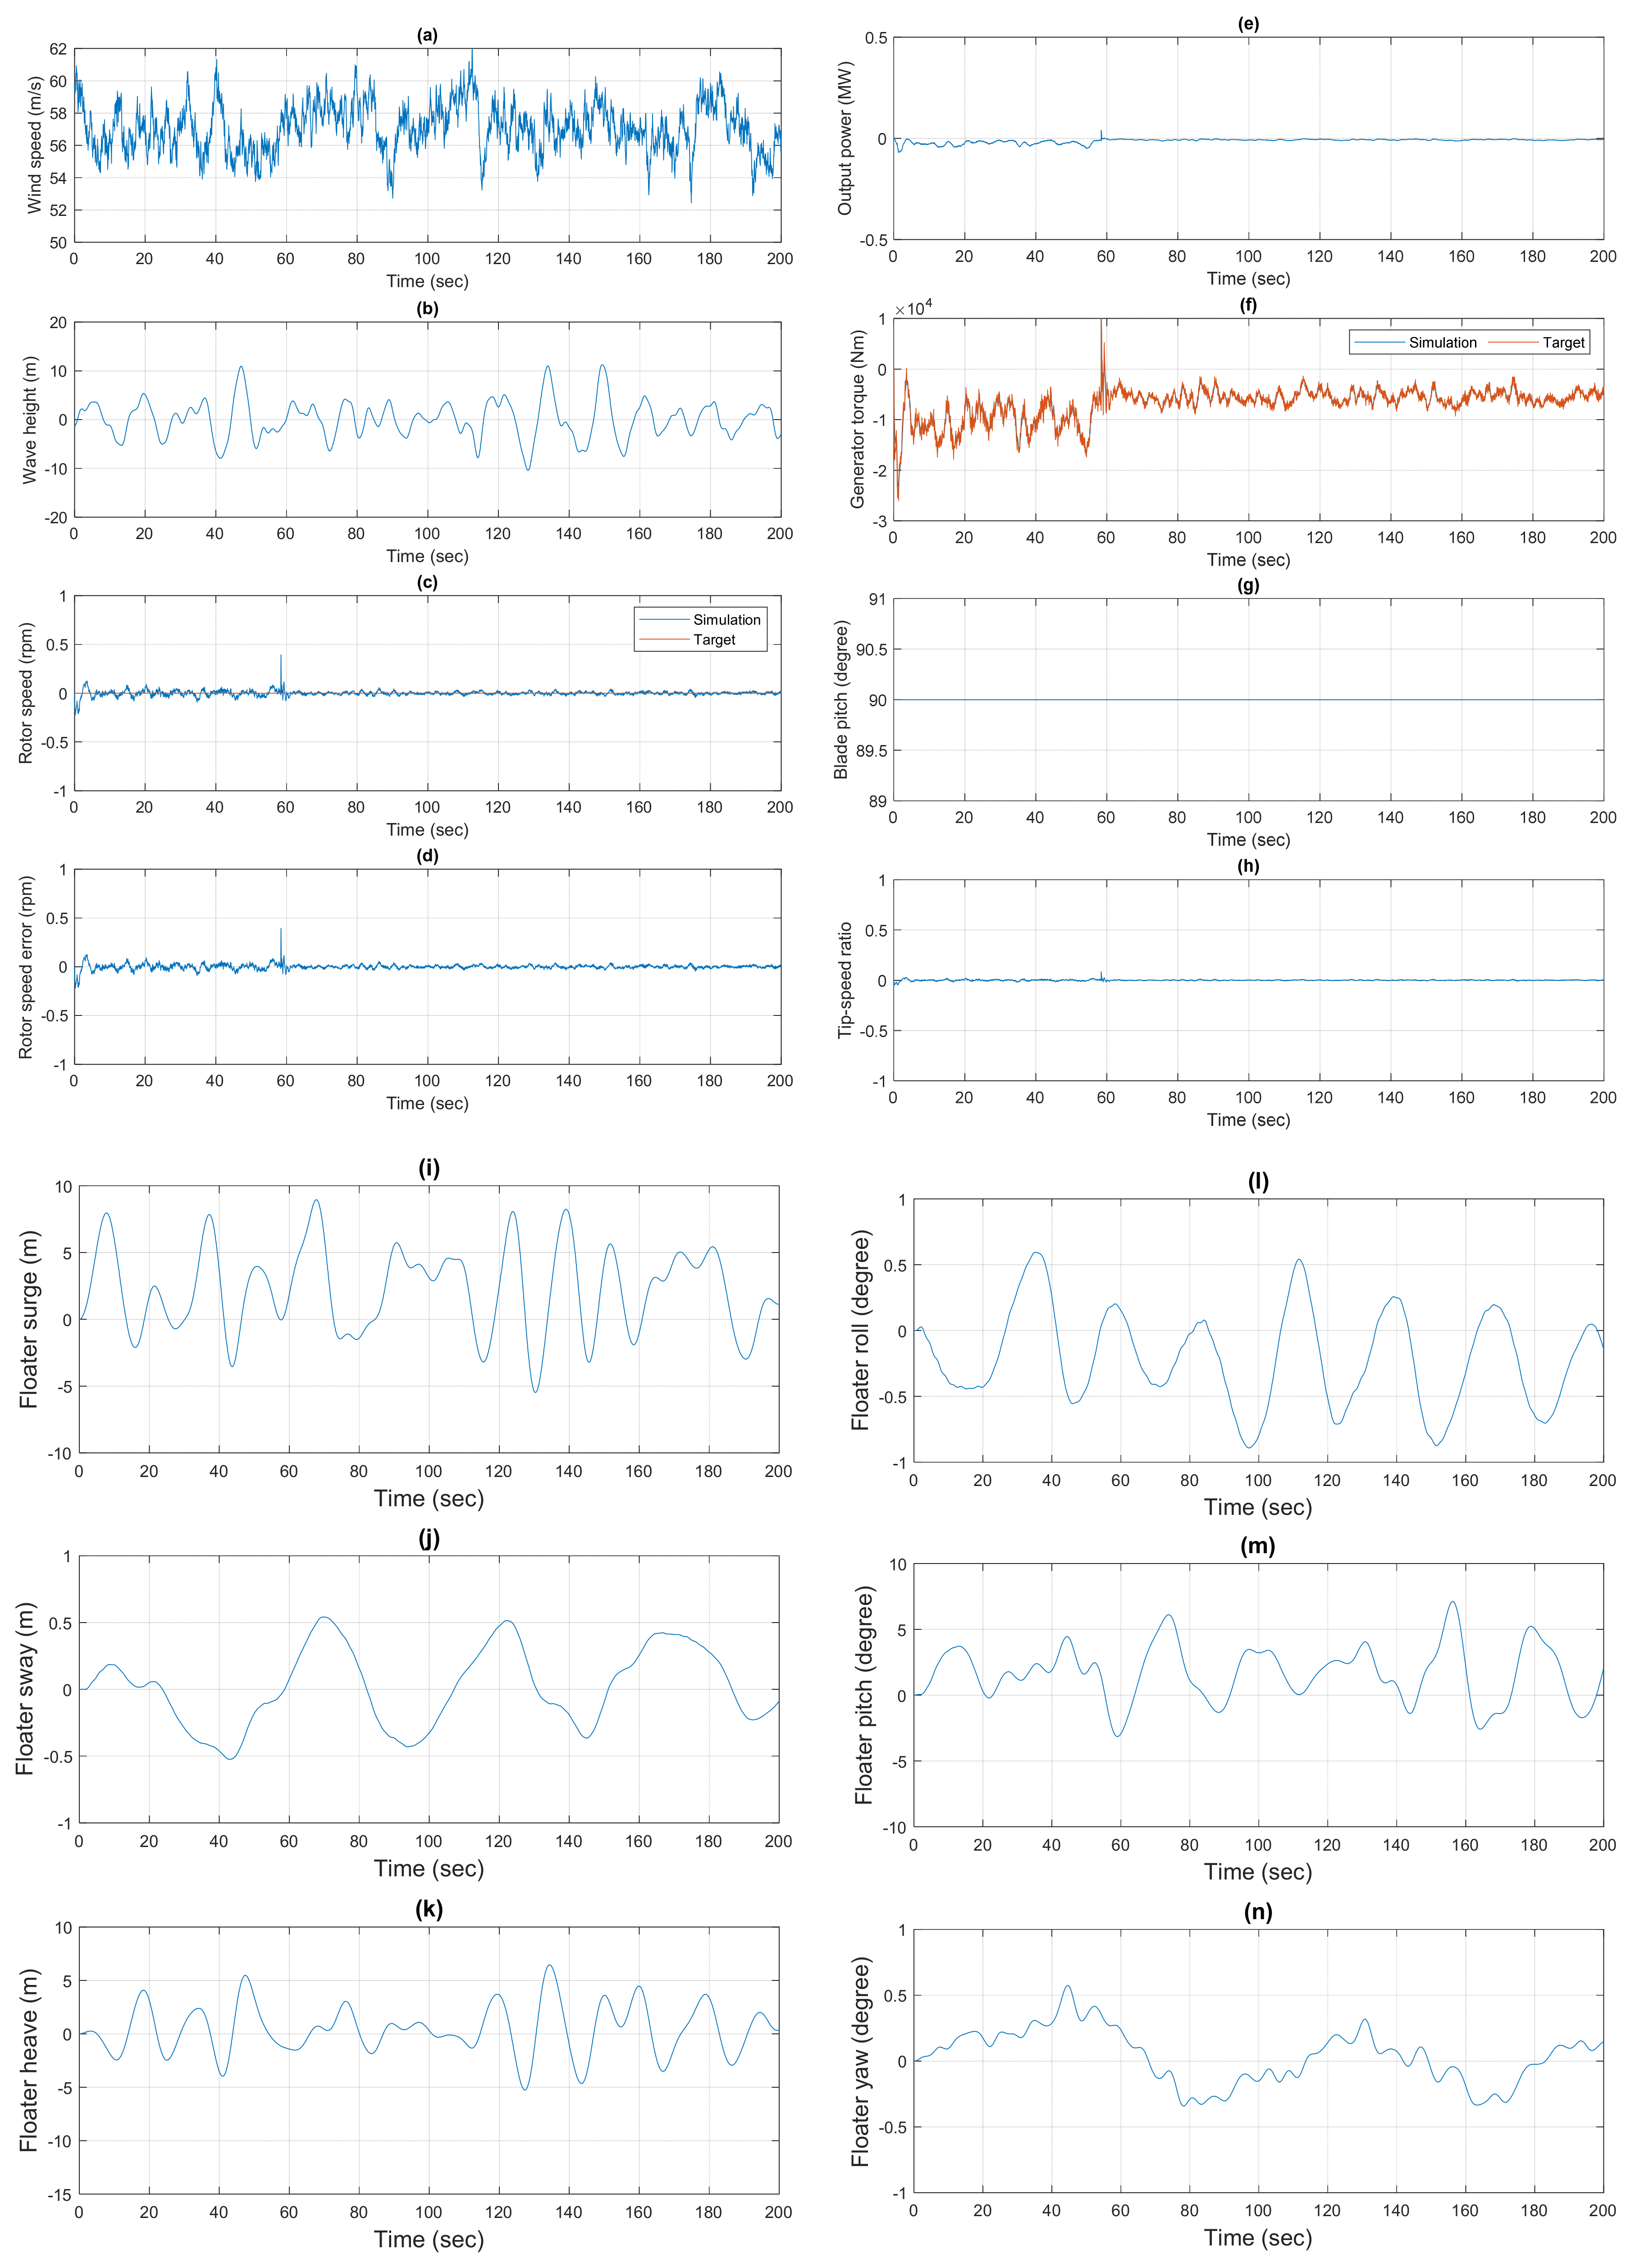
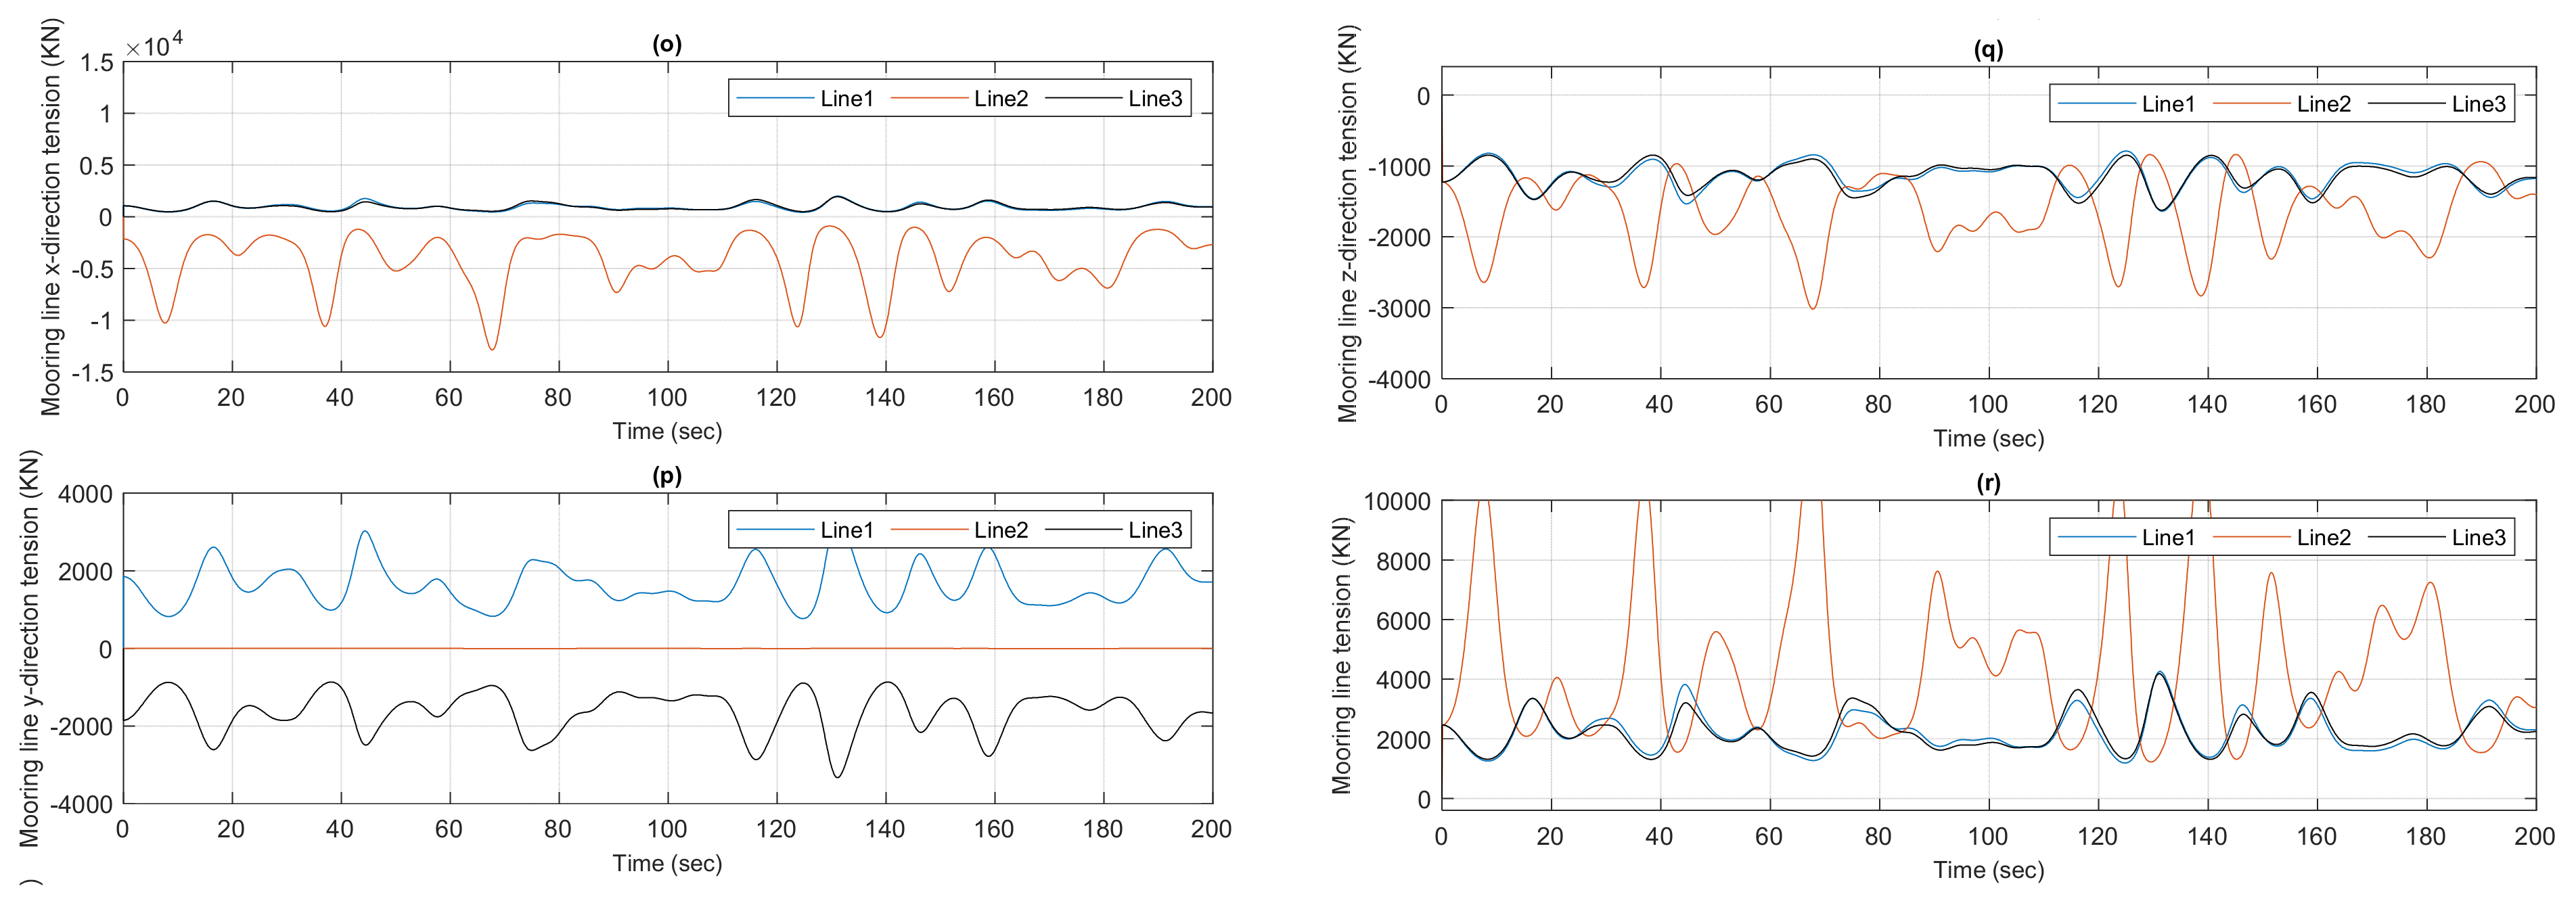
6.4. 50-Year Return-Period Extreme Conditions
7. Conclusions
Author Contributions
Funding
Conflicts of Interest
References
- Taipower. History of Net Power Generated and Purchased by Energy Type. Available online: https://www.taipower.com.tw/tc/index.aspx (accessed on 1 January 2022).
- 4C Offshore. Global Offshore Wind Speeds Rankings. Available online: https://www.4coffshore.com/windfarms/windspeeds.aspx (accessed on 1 January 2019).
- Lee, C.-L. Policy of Offshore Wind in Taiwan; Bureau of Energy, MOEA: Taipei City, Taiwan, 2019; Available online: https://www.tresor.economie.gouv.fr/Articles/f27ed9b3-e7db-40bf-880c-5f1351c0a826/files/f4318f81-7d7b-44cc-a462-193ca3840d20 (accessed on 1 April 2019).
- Formosa I Wind Power Co., Ltd. FOWI, Formosa Offshore Wind Farm. Available online: https://formosa1windpower.com/ (accessed on 8 June 2018).
- Buljan, A. TPC’s 109.2MW Offshore WInd Farm in Full Array. offshoreWIND.biz. 2021. Available online: https://www.offshorewind.biz/2021/06/23/tpcs-109-2-mw-offshore-wind-farm-in-full-array/ (accessed on 23 June 2021).
- Bureau of Energy, Ministry of Economic Affairs. MOEA Initiates the Offshore Wind Energy Zonal Development Selection Mechanism. Available online: https://www.moea.gov.tw/MNS/english/news/News.aspx?kind=6&menu_id=176&news_id=97414 (accessed on 25 October 2021).
- Boukhezzar, B.; Lupu, L.; Siguerdidjane, H.; Hand, M. Multivariable control strategy for variable speed, variable pitch wind turbines. Renew. Energy 2007, 32, 1273–1287. [Google Scholar] [CrossRef]
- Lindeberg, E.; Svendsen, H.G.; Uhlen, K. Smooth transition between controllers for floating wind turbines. Energy Procedia 2012, 24, 83–98. [Google Scholar] [CrossRef] [Green Version]
- Bashetty, S.; Ozcelik, S. Effect of Pitch Control on the Performance of an Offshore Floating Multi-Wind-Turbine Platform. J. Phys. Conf. Ser. 2021, 1828, 012055. [Google Scholar] [CrossRef]
- Plestan, F.; Shtessel, Y.; Bregeault, V.; Poznyak, A. New methodologies for adaptive sliding mode control. Int. J. Control. 2010, 83, 1907–1919. [Google Scholar] [CrossRef] [Green Version]
- Jonkman, J.M.; Hayman, G.; Jonkman, B.; Damiani, R.; Murray, R. AeroDyn v15 user’s guide and theory manual. NREL Draft Rep. 2015, 46. [Google Scholar]
- Jonkman, J.M.; Robertson, A.; Hayman, G.J. HydroDyn user’s guide and theory manual. Natl. Renew. Energy Lab. 2014. [Google Scholar]
- Masciola, M. MAP++ Documentation; NREL: Golden, CO, USA, 2018.
- Jung, C.; Schindler, D. The role of the power law exponent in wind energy assessment: A global analysis. Int. J. Energy Res. 2021, 45, 8484–8496. [Google Scholar] [CrossRef]
- DNV. Available online: https://www.dnv.com/services/meteorological-and-oceanographic-studies-12401 (accessed on 1 March 2015).
- Huler, S. Defining the Wind: The Beaufort Scale and How a 19th-Century Admiral Turned Science into Poetry; Crown: New York, NY, USA, 2007. [Google Scholar]
- Gaertner, E.; Rinker, J.; Sethuraman, L.; Zahle, F.; Anderson, B.; Barter, G.; Abbas, N.; Meng, F.; Bortolotti, P.; Skrzypinski, W.; et al. IEA Wind TCP Task 37: Definition of the IEA 15-Megawatt Offshore Reference Wind Turbine; National Renewable Energy Lab. (NREL): Golden, CO, USA, 2020. [Google Scholar]
- Allen, C.; Viscelli, A.; Dagher, H.; Goupee, A.; Gaertner, E.; Abbas, N.; Hall, M.; Barter, G. Definition of the UMaine VolturnUS-S Reference Platform Developed for the IEA Wind 15-Megawatt Offshore Reference Wind Turbine; National Renewable Energy Lab. (NREL): Golden, CO, USA, 2020. [Google Scholar]
- Wu, C.-C. Simulation and Experiment of a Turbine Access System with Three-Axial Active Motion Compensation; National Taiwan University, Department of Engineering Science and Ocean Engineering: Taipei, Taiwan, 2016. [Google Scholar]
- Madsen, P.H.; Risø, D. Introduction to the IEC 61400-1 Standard; Risø National Laboratory, Technical University of Denmark: Roskilde, Denmark, 2008. [Google Scholar]


| Beaufort Number | Wind Speed (m/s) | Wave Height (m) |
|---|---|---|
| 0 | 0–0.2 | 0–0.1 |
| 1 | 0.3–1.5 | 0.1–0.3 |
| 2 | 1.6–3.3 | 0.3–0.5 |
| 3 | 3.4–5.4 | 0.5–0.9 |
| 4 | 5.5–7.9 | 0.9–1.25 |
| 5 | 8–10.7 | 1.25–2.5 |
| 6 | 10.8–13.8 | 2.5–3 |
| 7 | 13.9–17.1 | 3–4 |
| 8 | 17.2–20.7 | 4–6 |
| 9 | 20.8–24.4 | 6–9 |
| 10 | 24.5–28.4 | 9–11 |
| Parameter | Value | Unit |
|---|---|---|
| Rotor orientation | Upwind | - |
| Control | Variable speed | - |
| collective pitch | - | |
| Cut-in wind speed | 3 | m/s |
| Cut-out wind speed | 25 | m/s |
| Rated wind speed | 10.59 | m/s |
| Rated electrical power | 15 | MW |
| Number of blades | 3 | |
| Rotor diameter | 240 | m |
| Parameter | Value | Unit |
|---|---|---|
| Mass | 1263 | ton |
| Length | 129.582 | m |
| Young’s Modulus | 2.00 1011 | Pa |
| Shear Modulus | 7.93 1010 | Pa |
| Density | 7850 | kg/m3 |
| Parameter | Value | Unit |
|---|---|---|
| Blade Mass | 65.228 | ton |
| Blade length | 117 | m |
| Tip Prebend | 4.00 | m |
| Max Chord | 5.77 | m |
| Blade Ixx | 4.63 × 10⁷ | kg m2 |
| Blade Iyy | 4.63 × 10⁷ | kg m2 |
| Blade Izz | × 104 | kg m2 |
| Parameter | Value | Unit |
|---|---|---|
| Hull Displacement | 20,206 | m3 |
| Hull Steel Mass | 3914 | ton |
| Tower Interface Mass | 100 | ton |
| Ballast Mass (Fixed/Fluid) | 2540/11,300 | ton |
| Draft | 20 | m |
| Freeboard | 15 | m |
| Parameter | Value | Unit |
|---|---|---|
| Number of Lines | 3 | - |
| Anchor Depth | 70 | m |
| Fairlead Depth | 14 | m |
| Anchor Radial Spacing | 779.6 | m |
| Fairlead Radial Spacing | 58.00 | m |
| Line Unstretched Length | 789.64 | m |
| Nominal Chain Diameter | 0.185 | m |
| Dry-Line Linear Density | 685 | kg/m |
| Extensional Stiffness | 3.27 9 | N |
Disclaimer/Publisher’s Note: The statements, opinions and data contained in all publications are solely those of the individual author(s) and contributor(s) and not of MDPI and/or the editor(s). MDPI and/or the editor(s) disclaim responsibility for any injury to people or property resulting from any ideas, methods, instructions or products referred to in the content. |
© 2023 by the authors. Licensee MDPI, Basel, Switzerland. This article is an open access article distributed under the terms and conditions of the Creative Commons Attribution (CC BY) license (https://creativecommons.org/licenses/by/4.0/).
Share and Cite
Chueh, C.-J.; Chien, C.-H.; Lin, C.; Lin, T.-Y.; Chiang, M.-H. Dynamic Co-Simulation Analysis and Control of an IEA 15 MW Offshore Floating Semi-Submersible Wind Turbine under Taiwan Offshore-Wind-Farm Conditions of Wind and Wave. J. Mar. Sci. Eng. 2023, 11, 173. https://doi.org/10.3390/jmse11010173
Chueh C-J, Chien C-H, Lin C, Lin T-Y, Chiang M-H. Dynamic Co-Simulation Analysis and Control of an IEA 15 MW Offshore Floating Semi-Submersible Wind Turbine under Taiwan Offshore-Wind-Farm Conditions of Wind and Wave. Journal of Marine Science and Engineering. 2023; 11(1):173. https://doi.org/10.3390/jmse11010173
Chicago/Turabian StyleChueh, Cherng-Jer, Chun-Hung Chien, Ching Lin, Ting-Yan Lin, and Mao-Hsiung Chiang. 2023. "Dynamic Co-Simulation Analysis and Control of an IEA 15 MW Offshore Floating Semi-Submersible Wind Turbine under Taiwan Offshore-Wind-Farm Conditions of Wind and Wave" Journal of Marine Science and Engineering 11, no. 1: 173. https://doi.org/10.3390/jmse11010173
APA StyleChueh, C.-J., Chien, C.-H., Lin, C., Lin, T.-Y., & Chiang, M.-H. (2023). Dynamic Co-Simulation Analysis and Control of an IEA 15 MW Offshore Floating Semi-Submersible Wind Turbine under Taiwan Offshore-Wind-Farm Conditions of Wind and Wave. Journal of Marine Science and Engineering, 11(1), 173. https://doi.org/10.3390/jmse11010173