

A Study on the Law of Ring-Shear Band Evolution

Abstract
:1. Introduction
2. Test Design
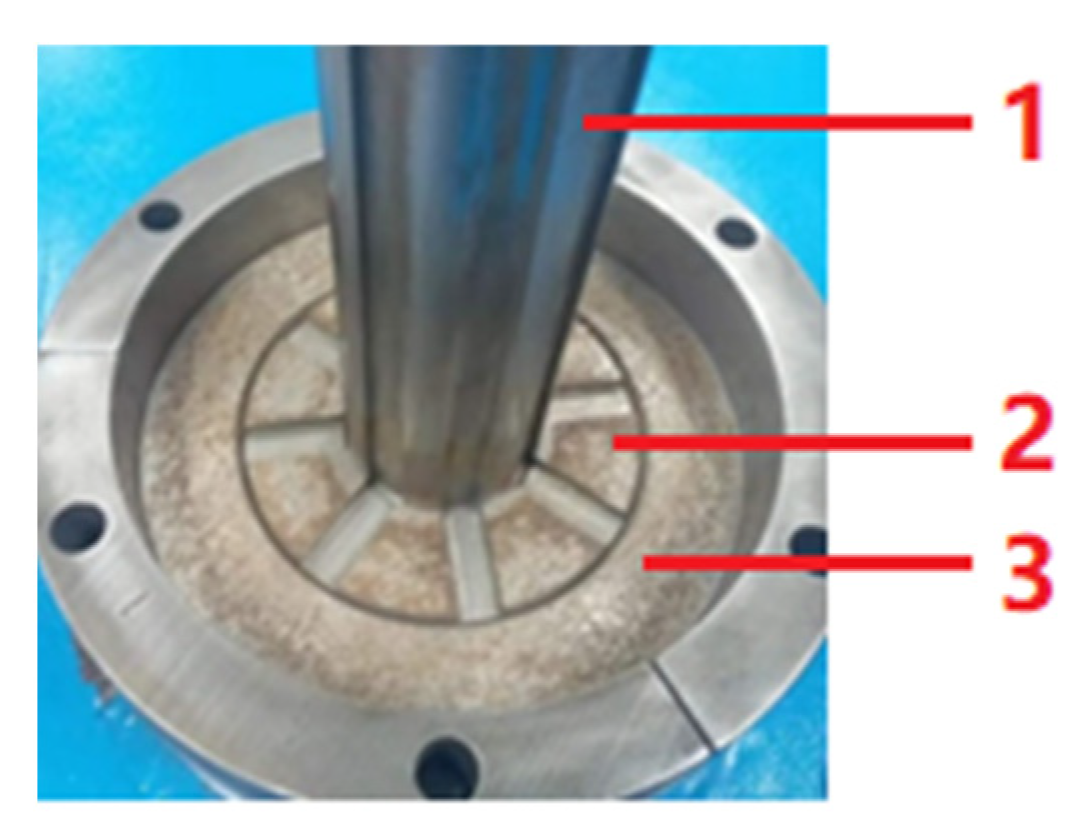
2.1. Set of Test
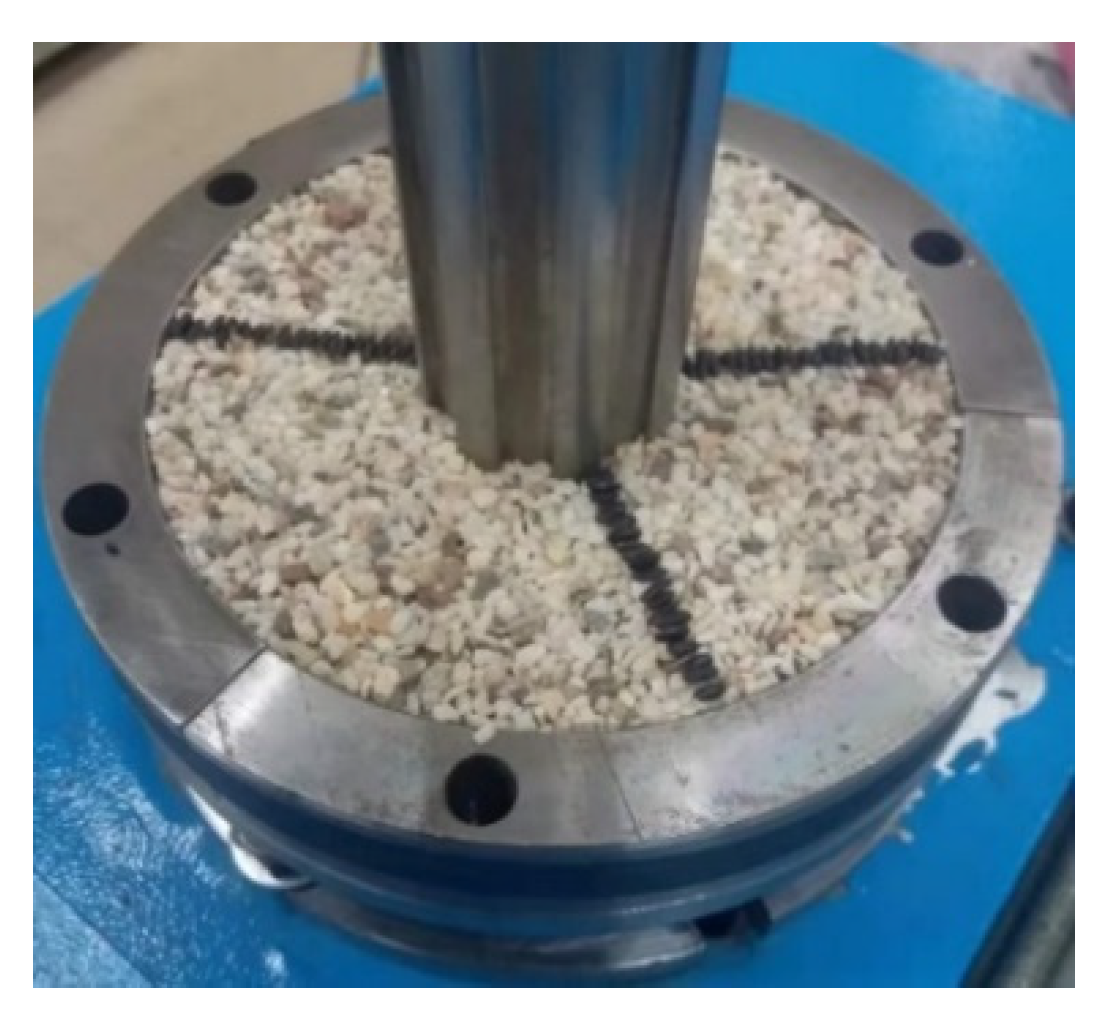
2.2. Test Process
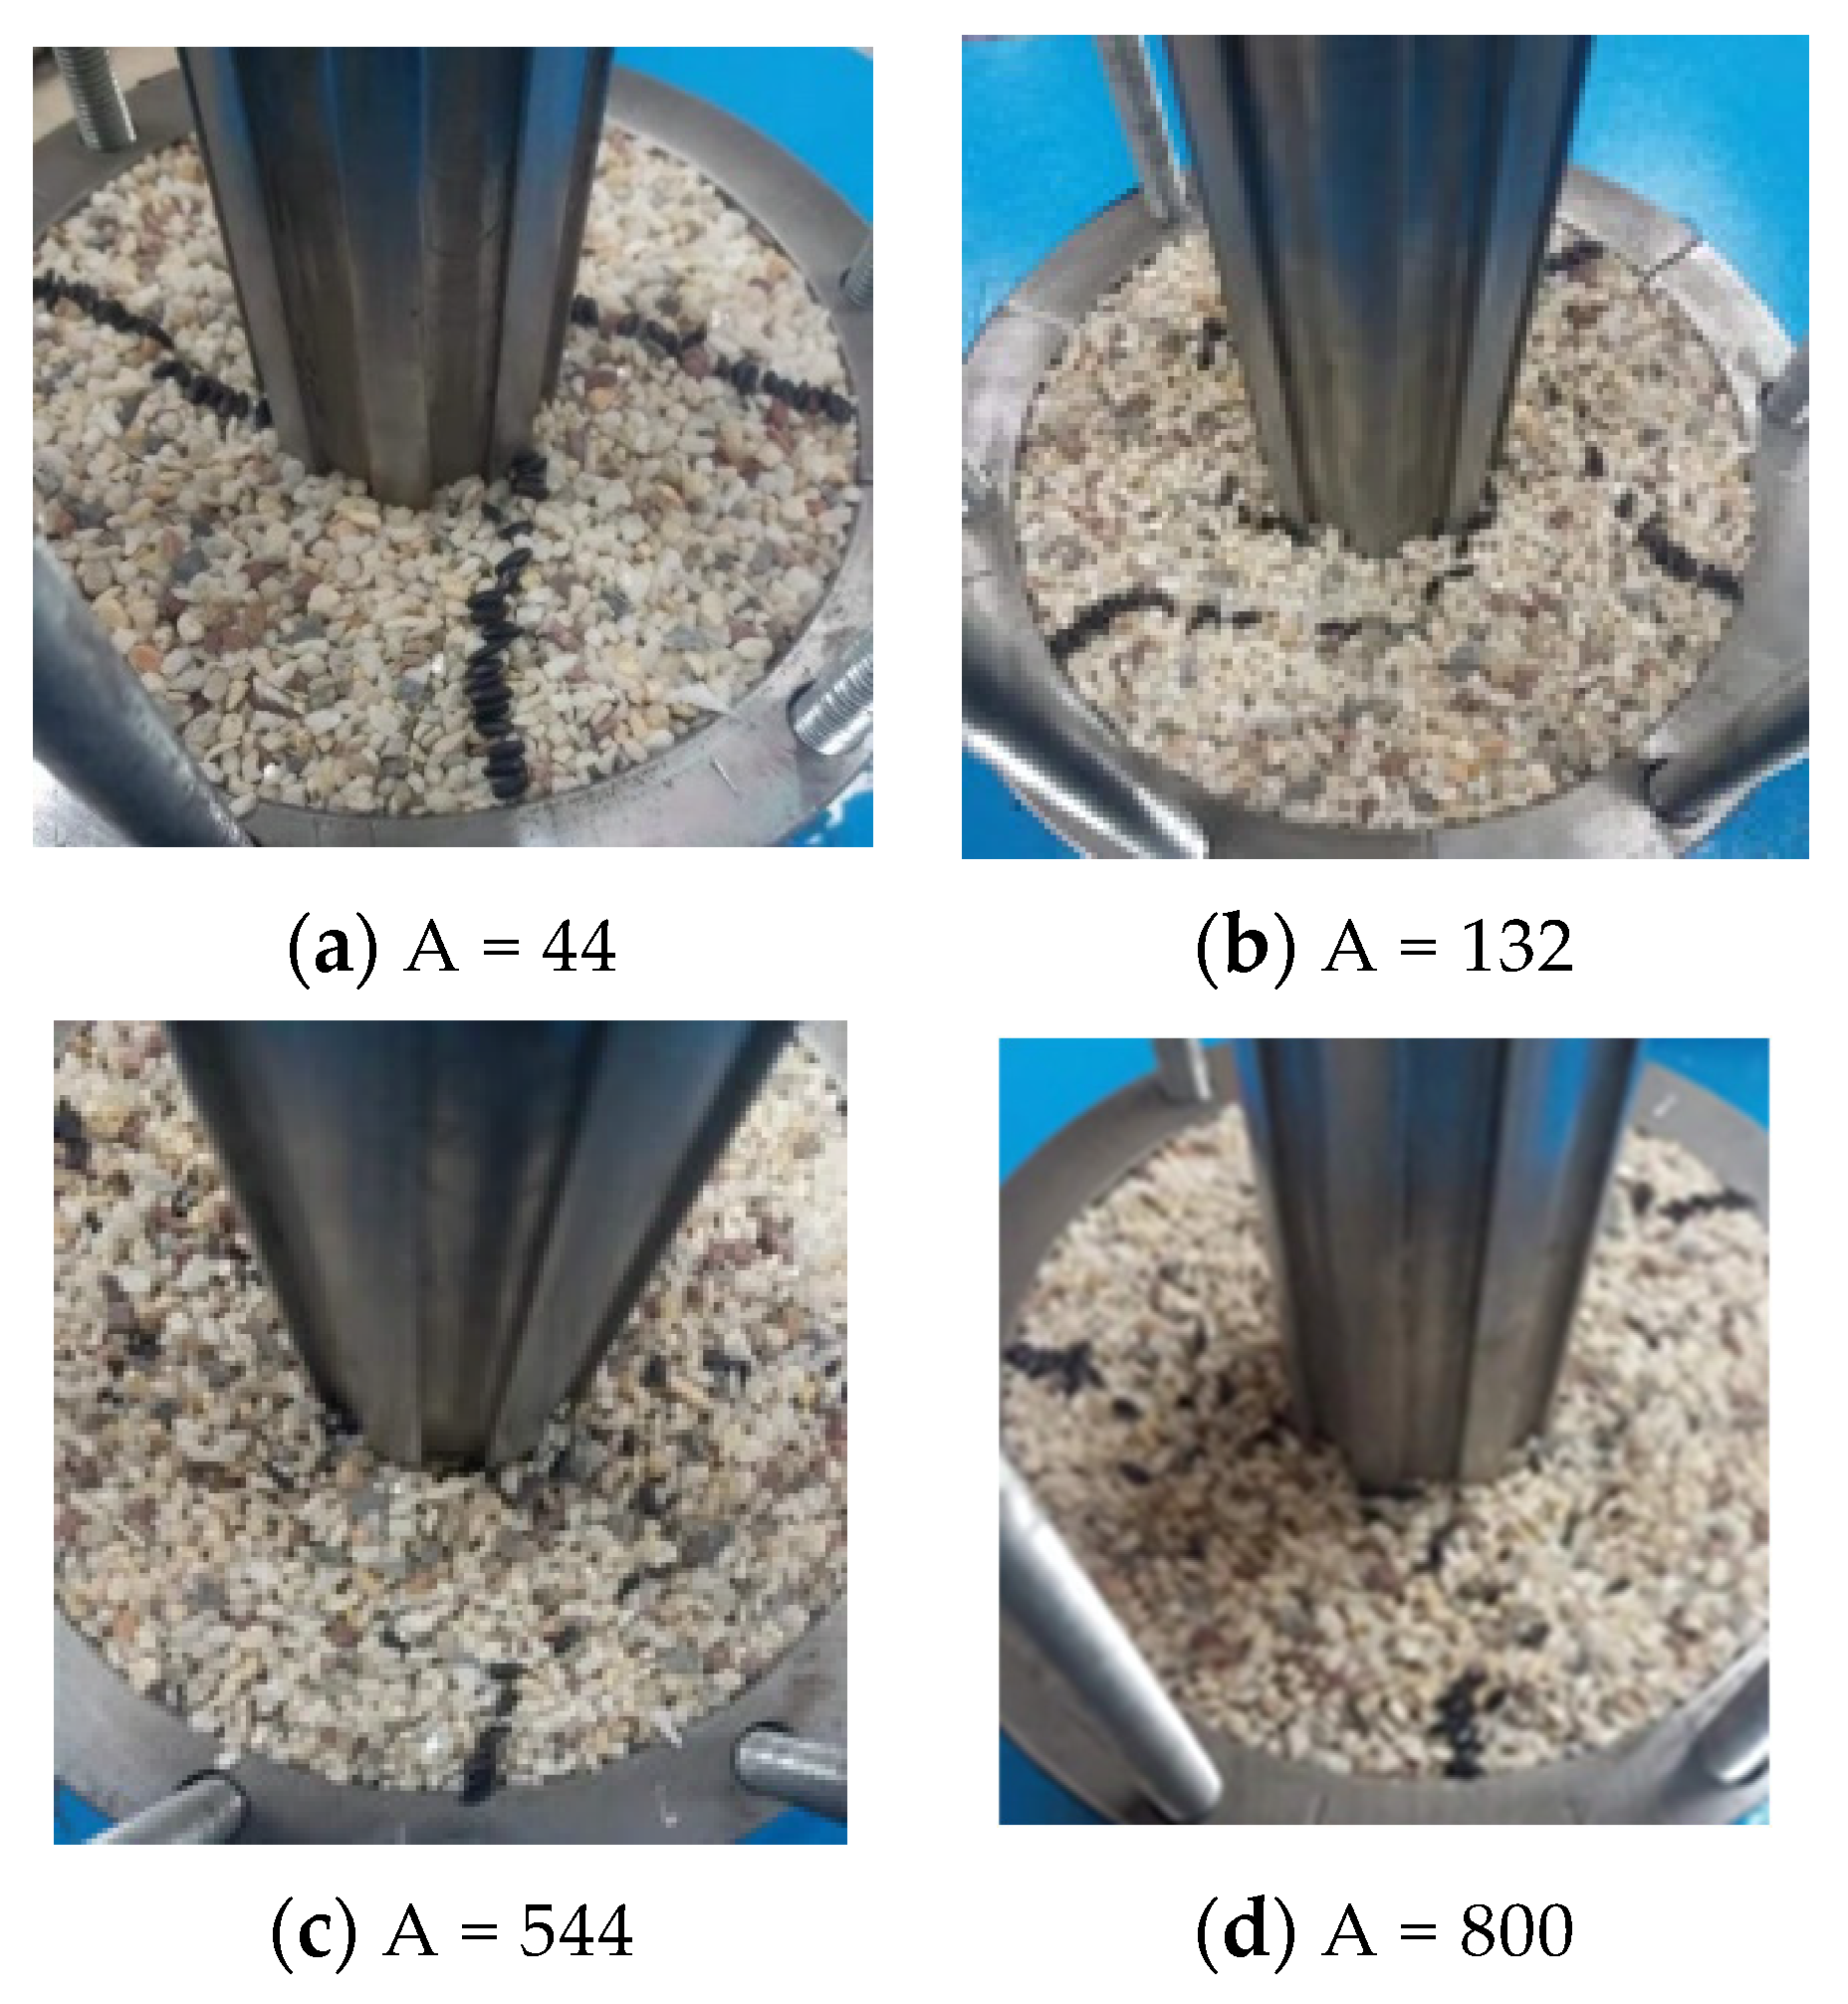
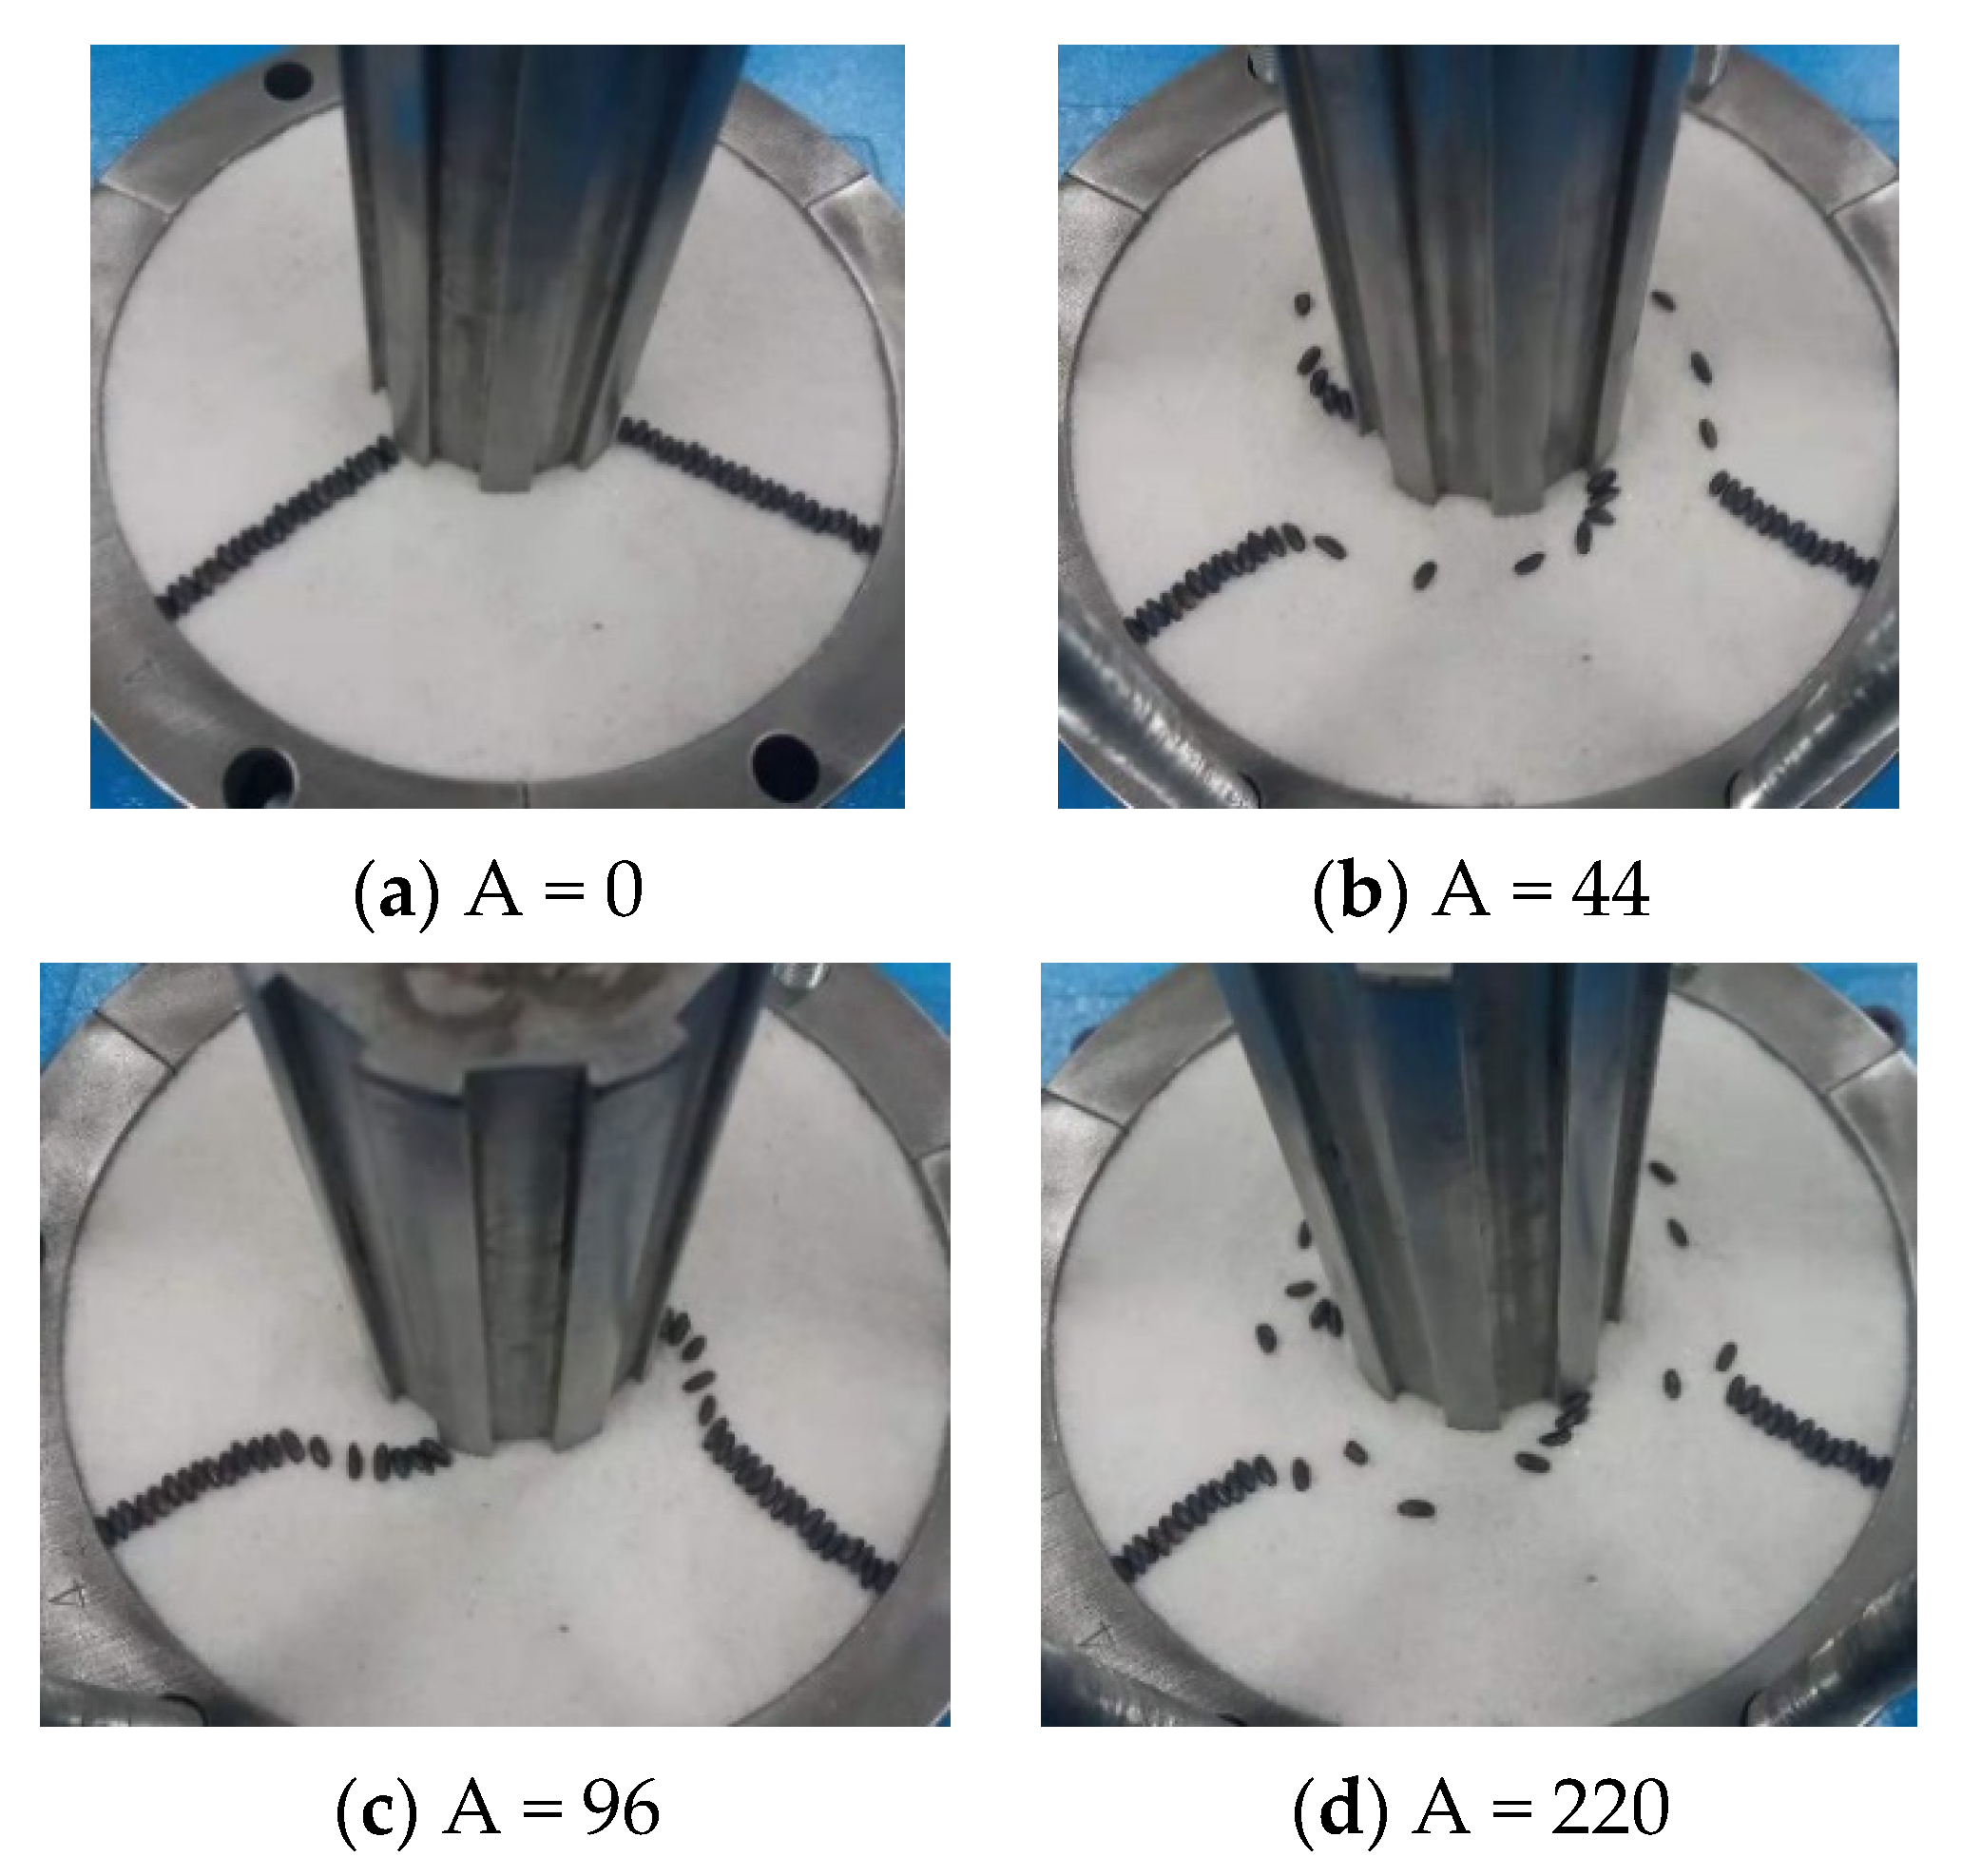
2.2.1. Tests of Different Strengths for Sand
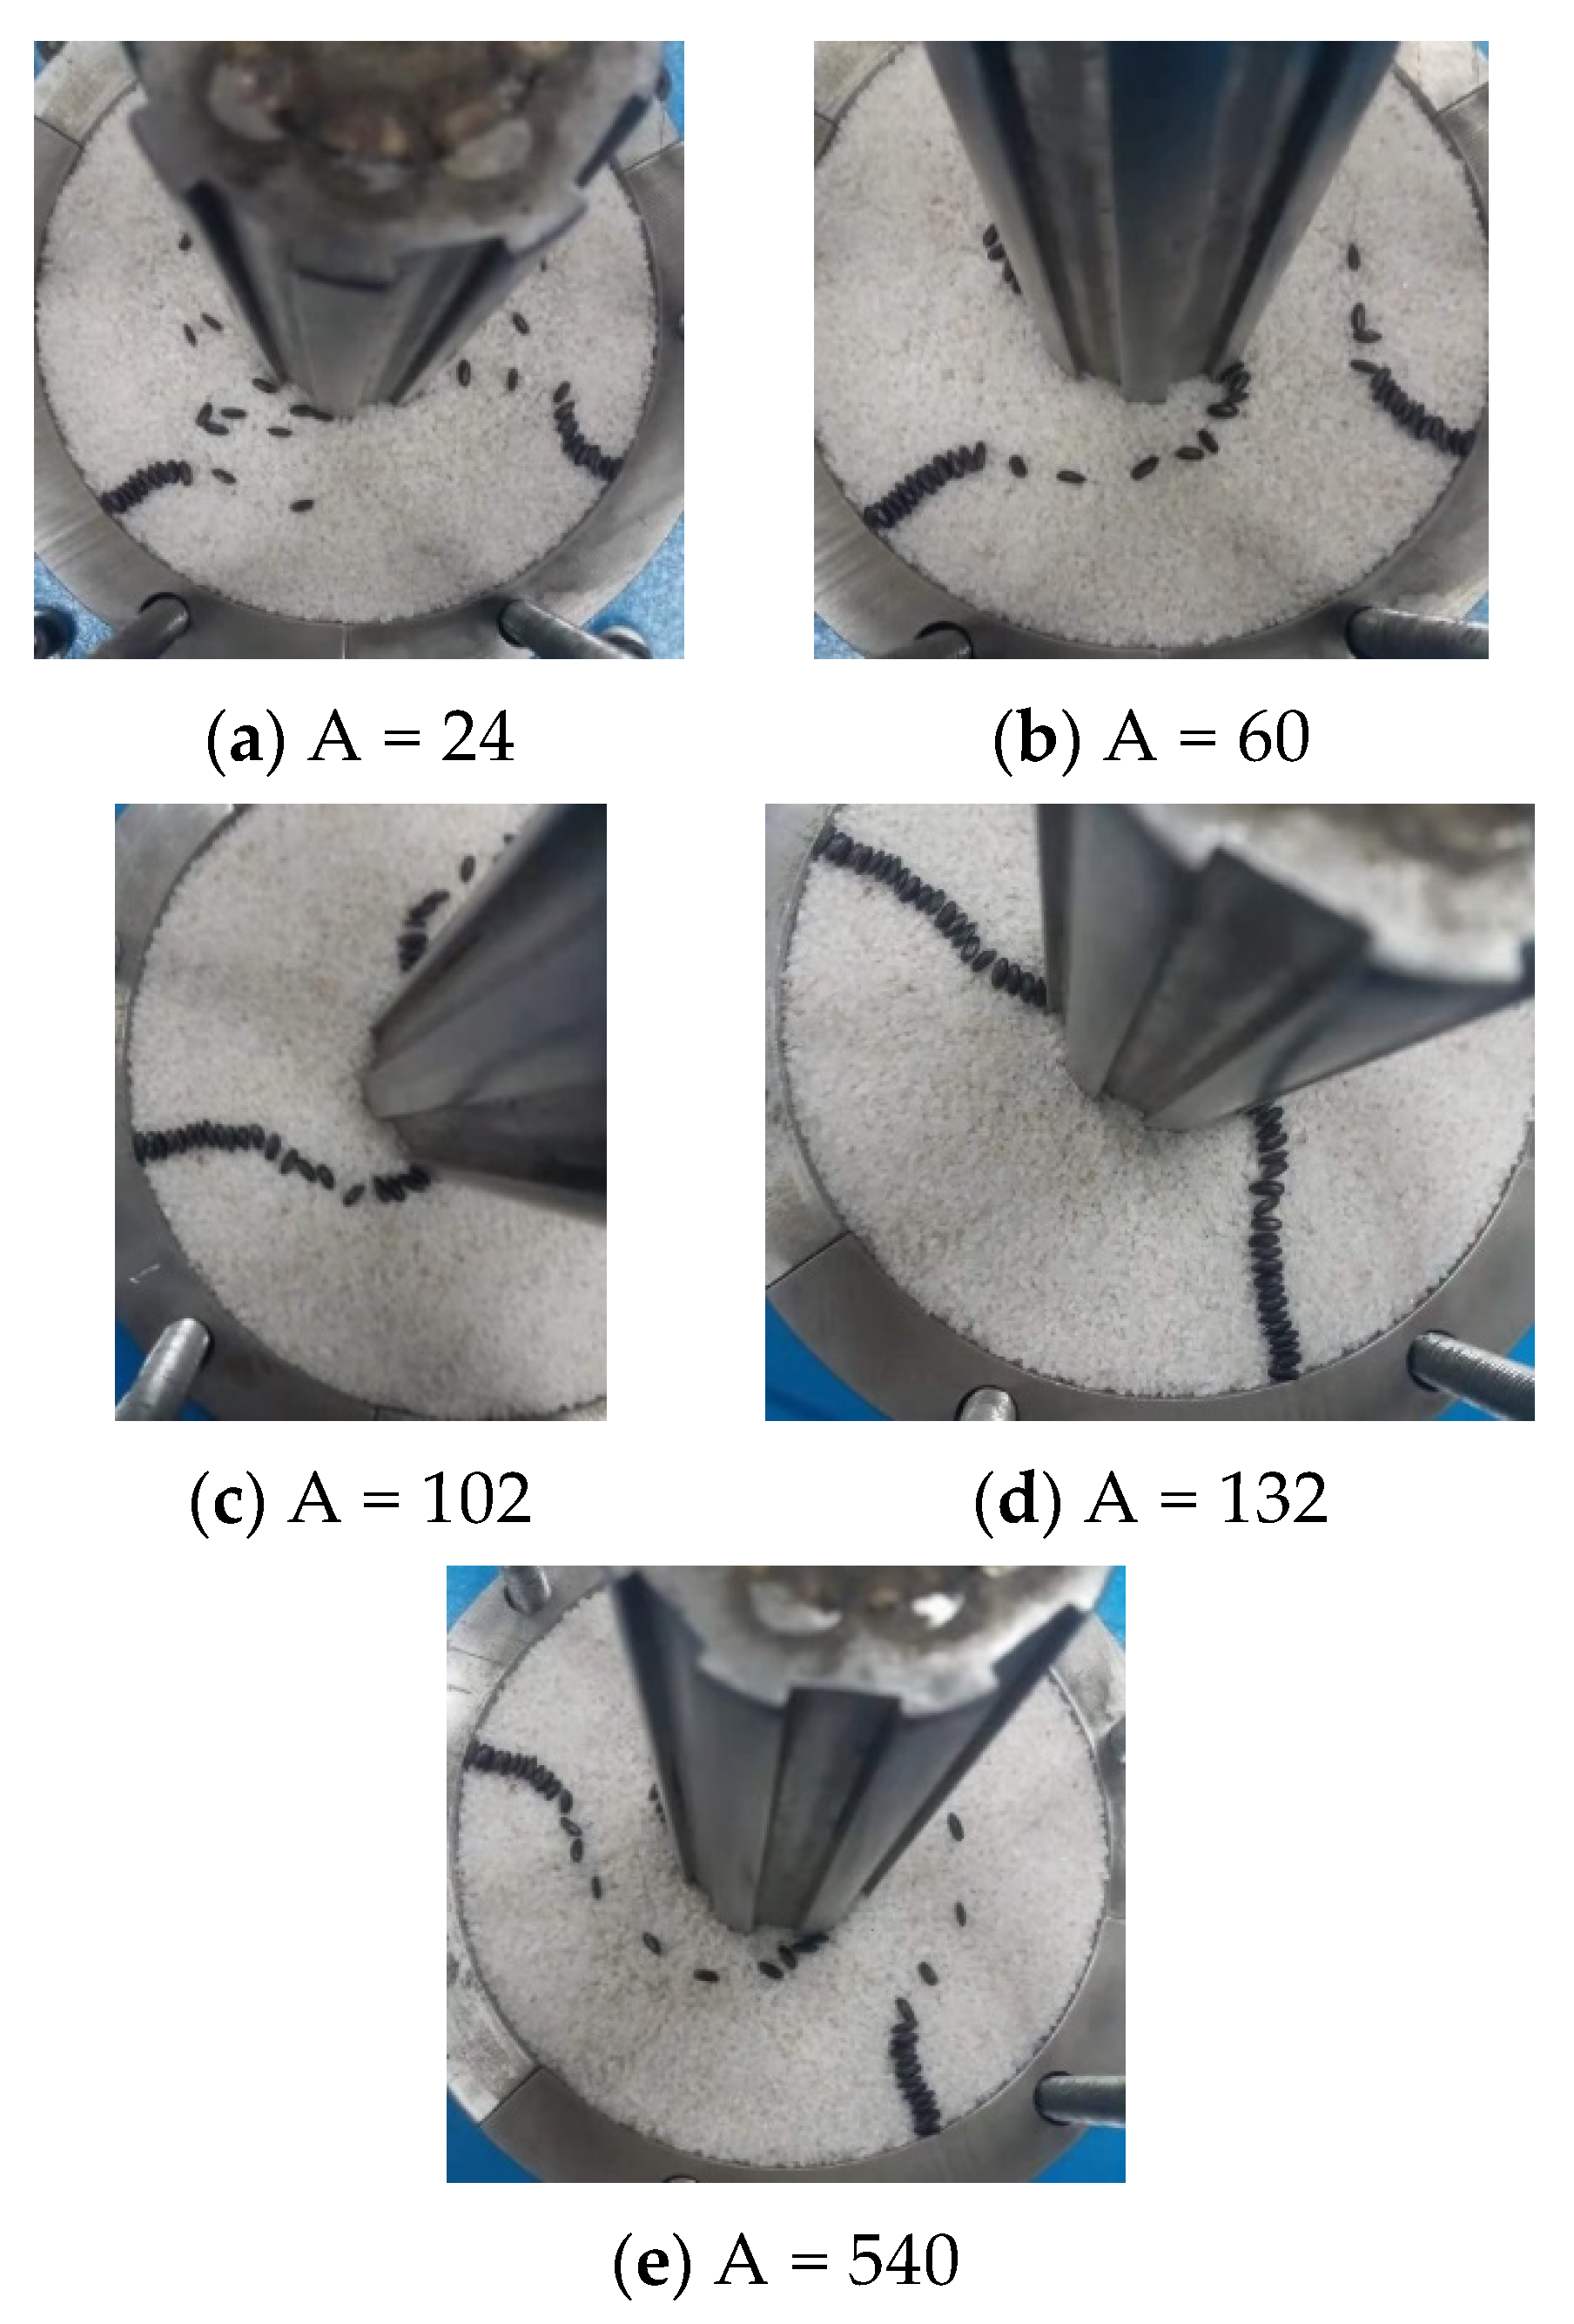
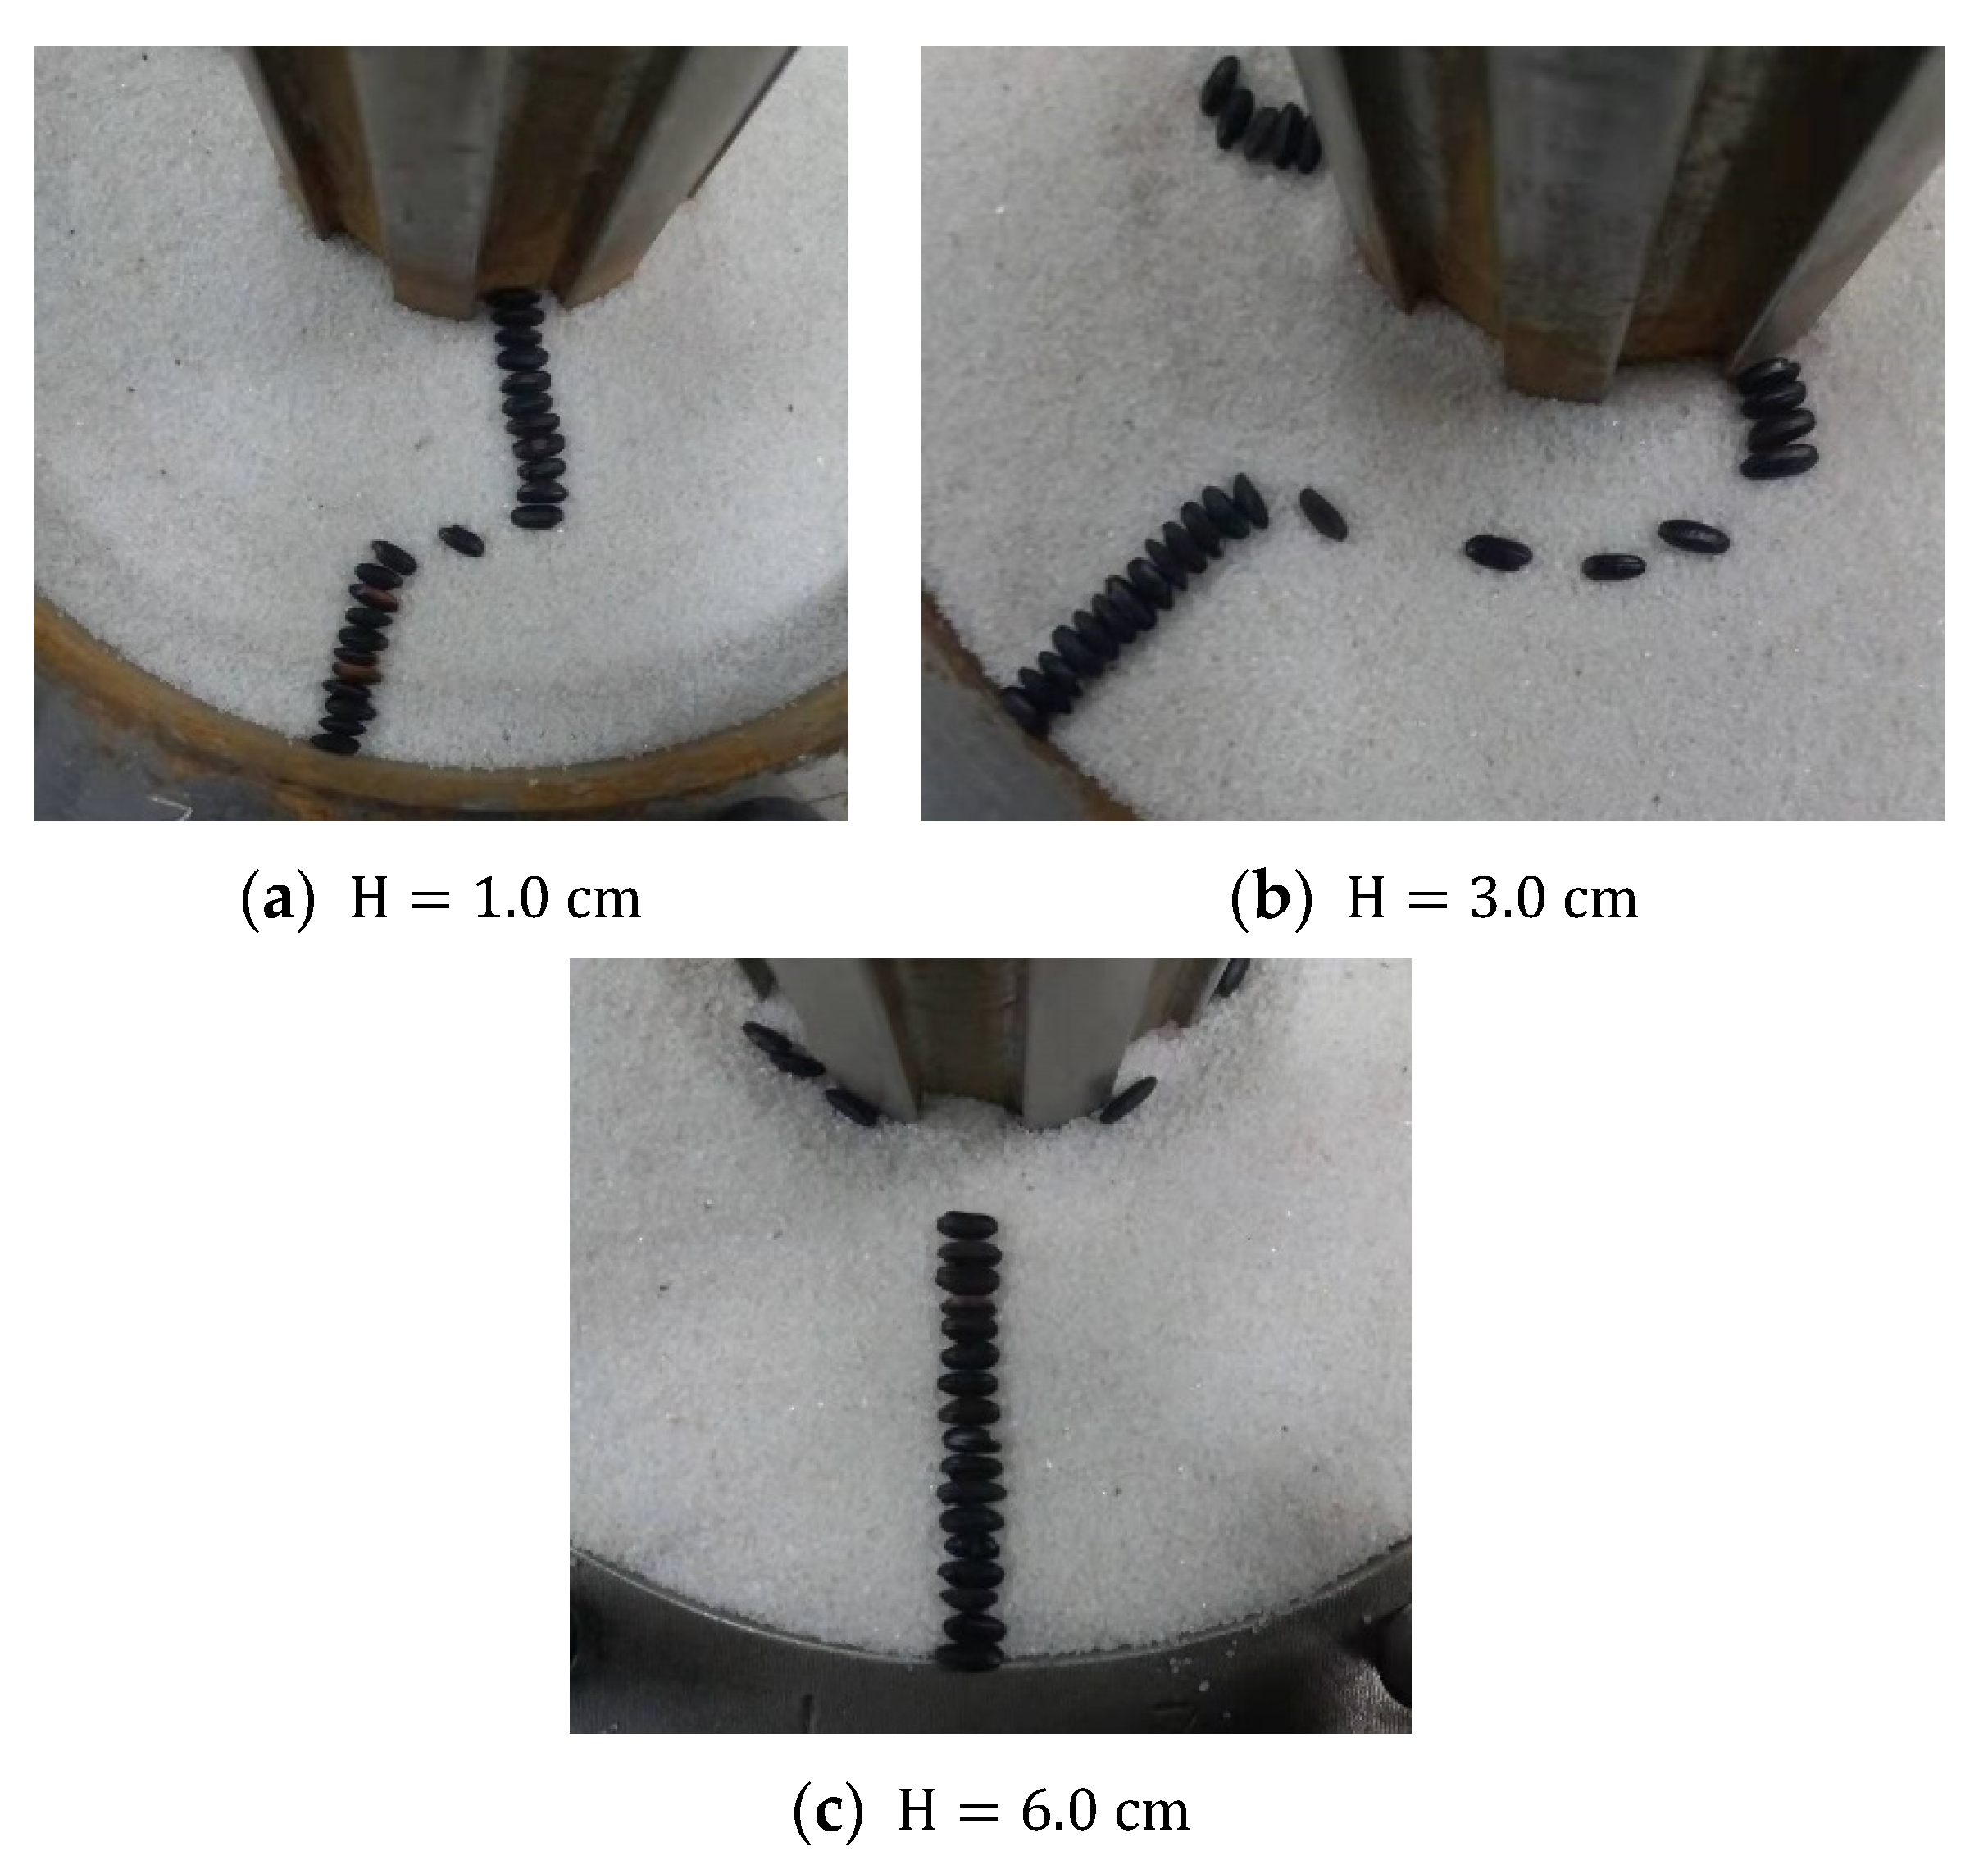
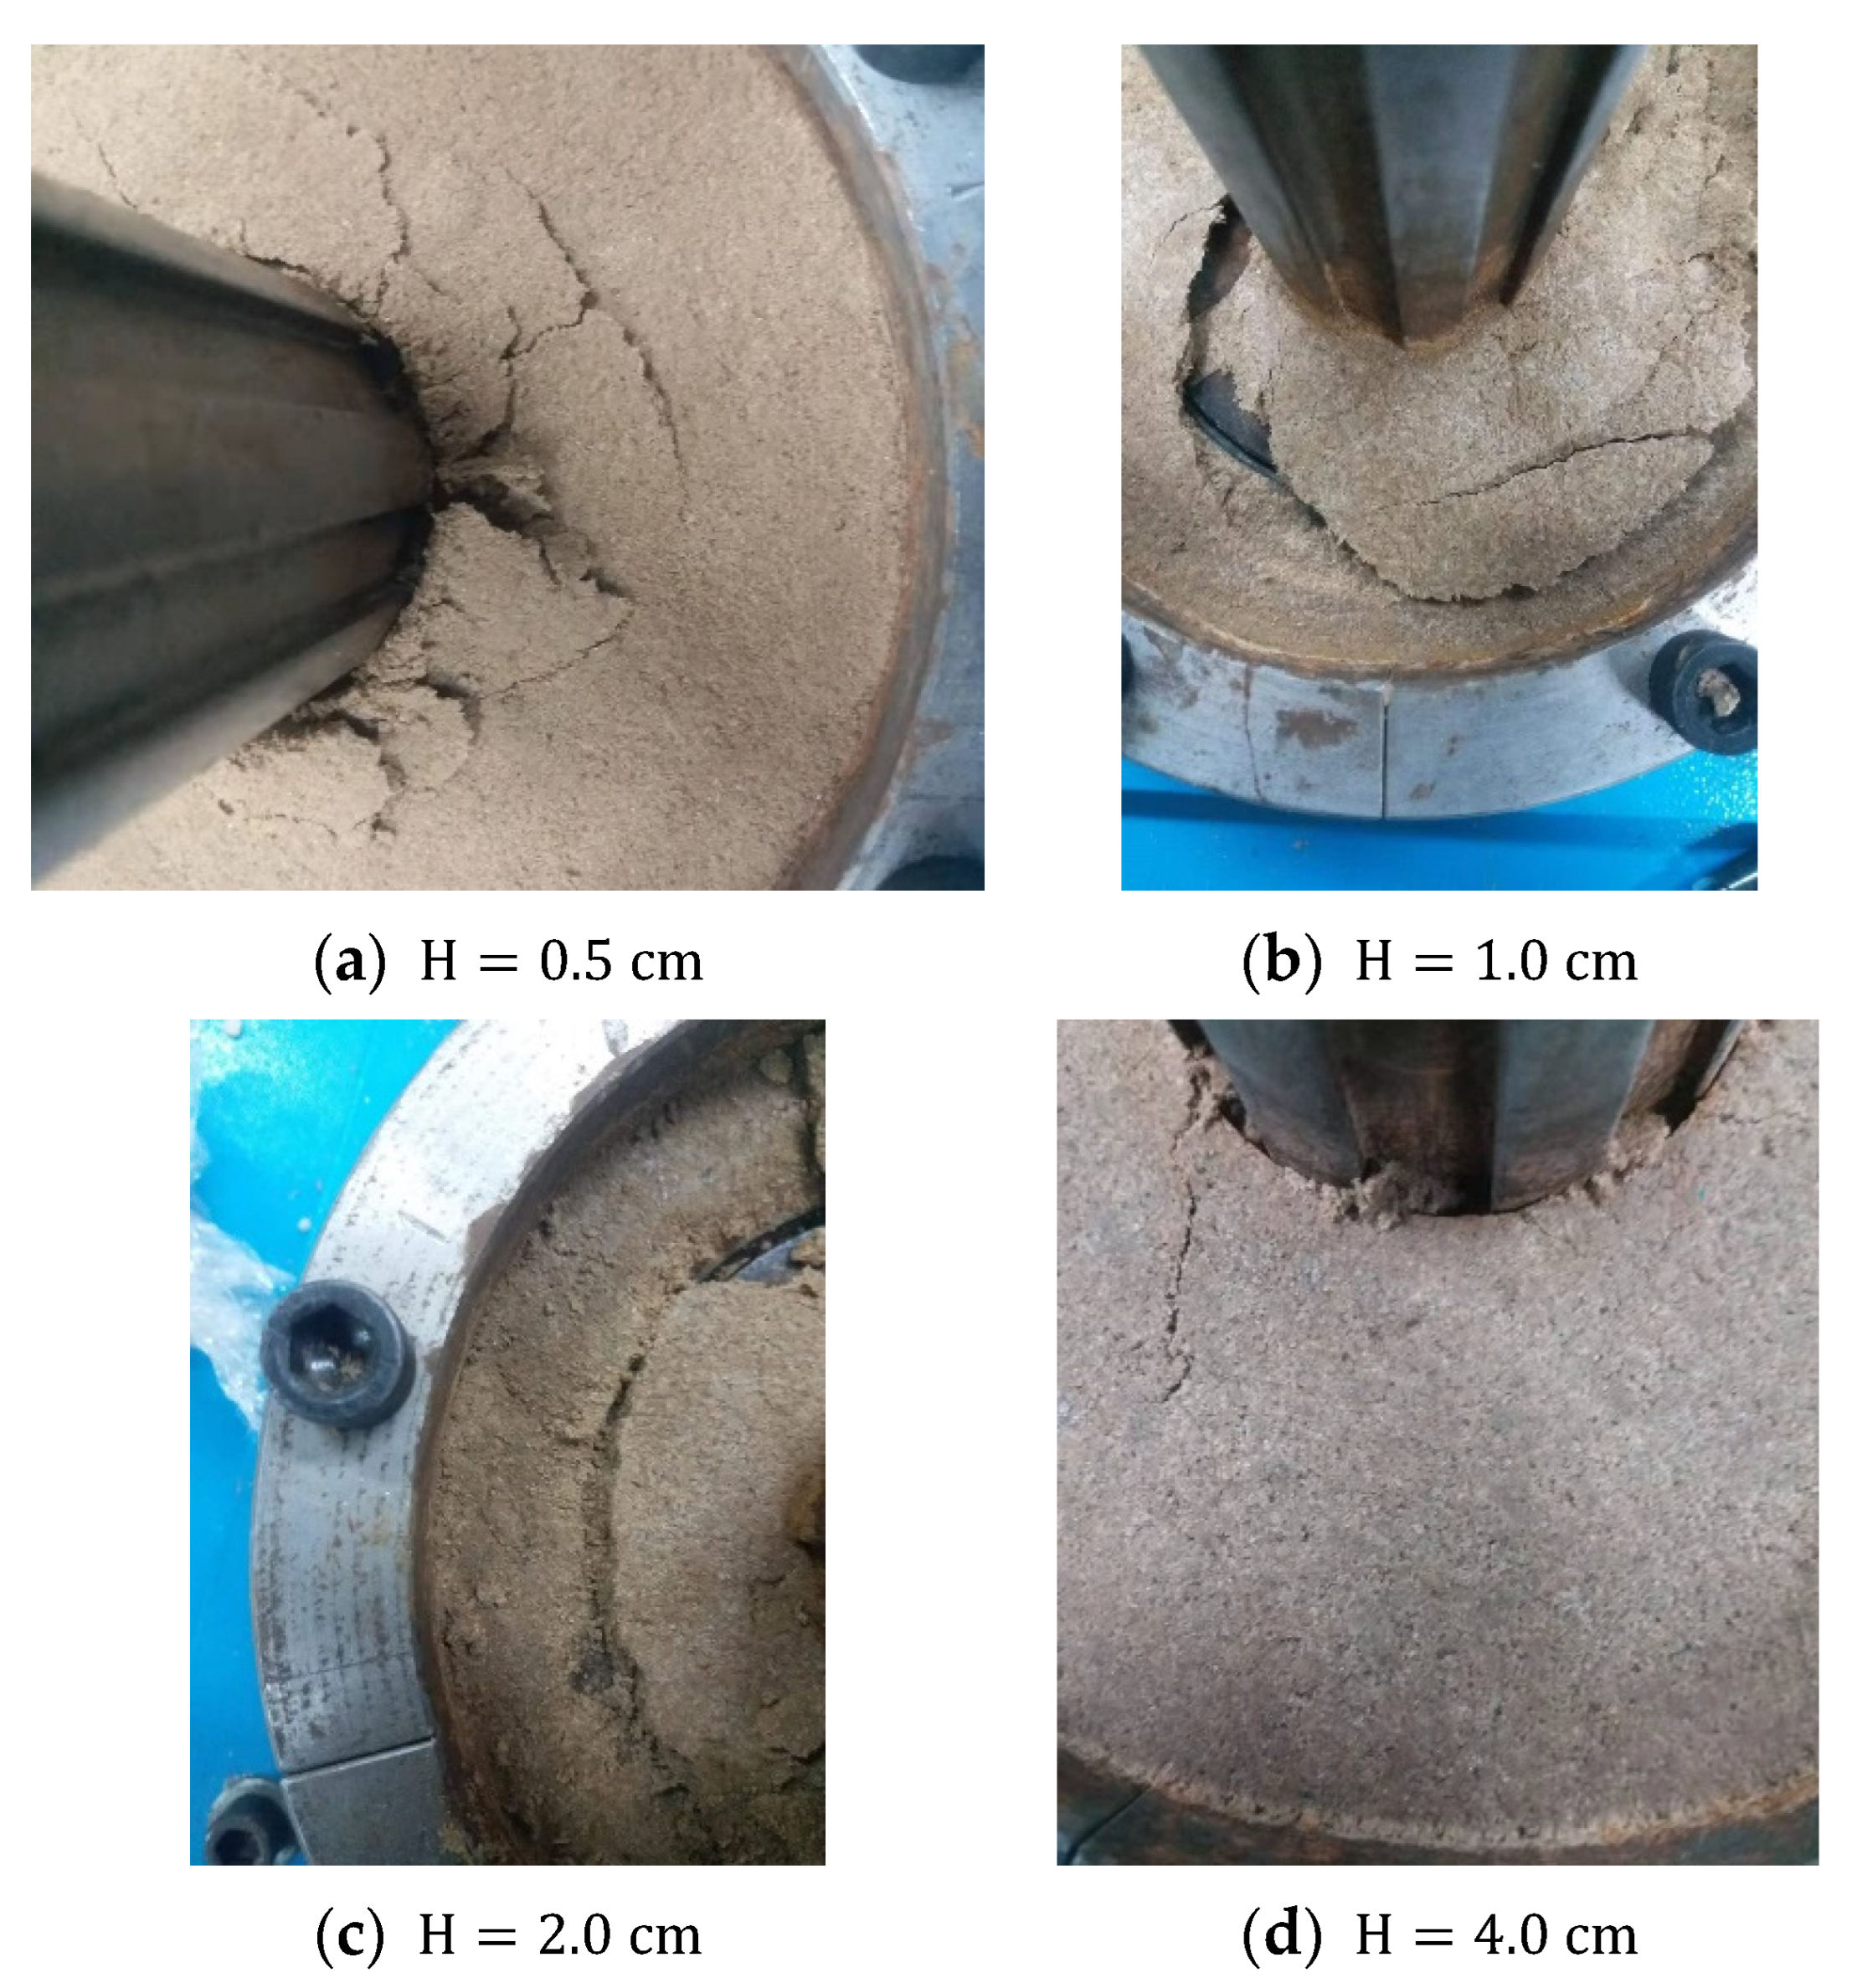
2.2.2. Tests of Different Stacking Heights for Sand
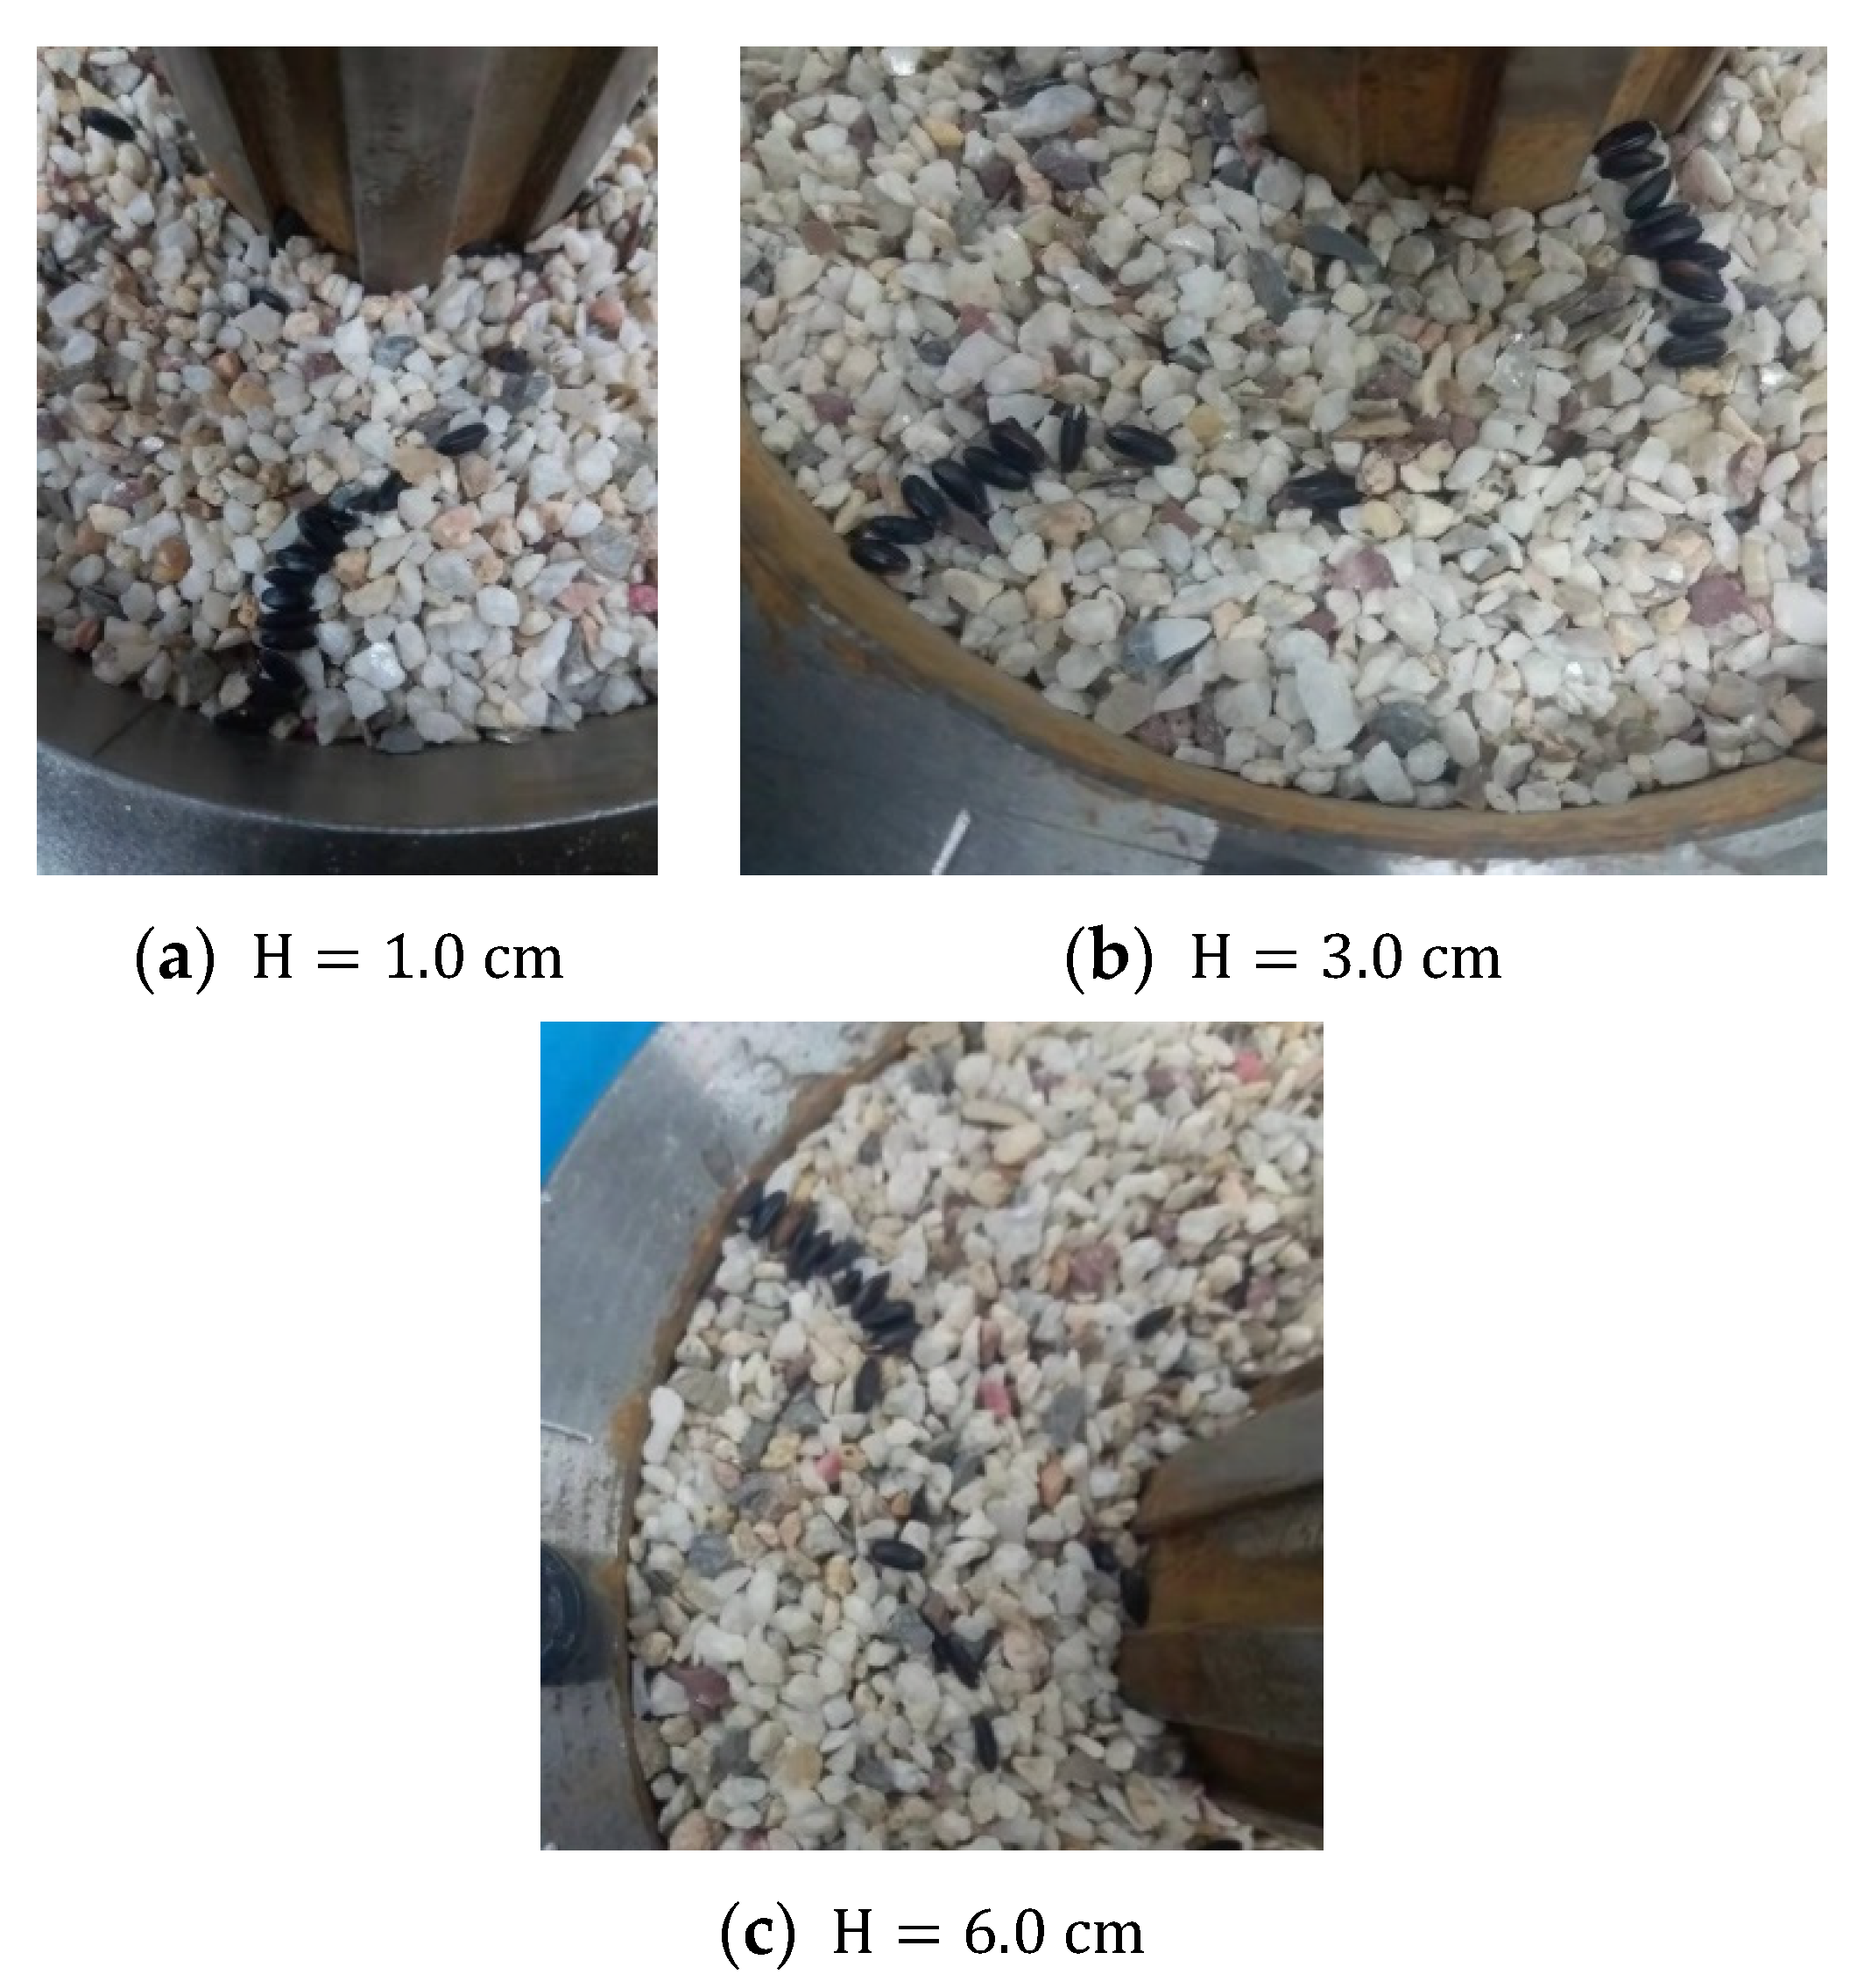
2.2.3. Tests of Different Stacking Heights for Hydrate
3. Numerical Simulation and Analysis
3.1. Constitutive Model
3.2. Numerical Simulation
3.2.1. Verification
3.2.2. Characteristics of Shear Bands
3.2.3. Stress and Strain Distribution
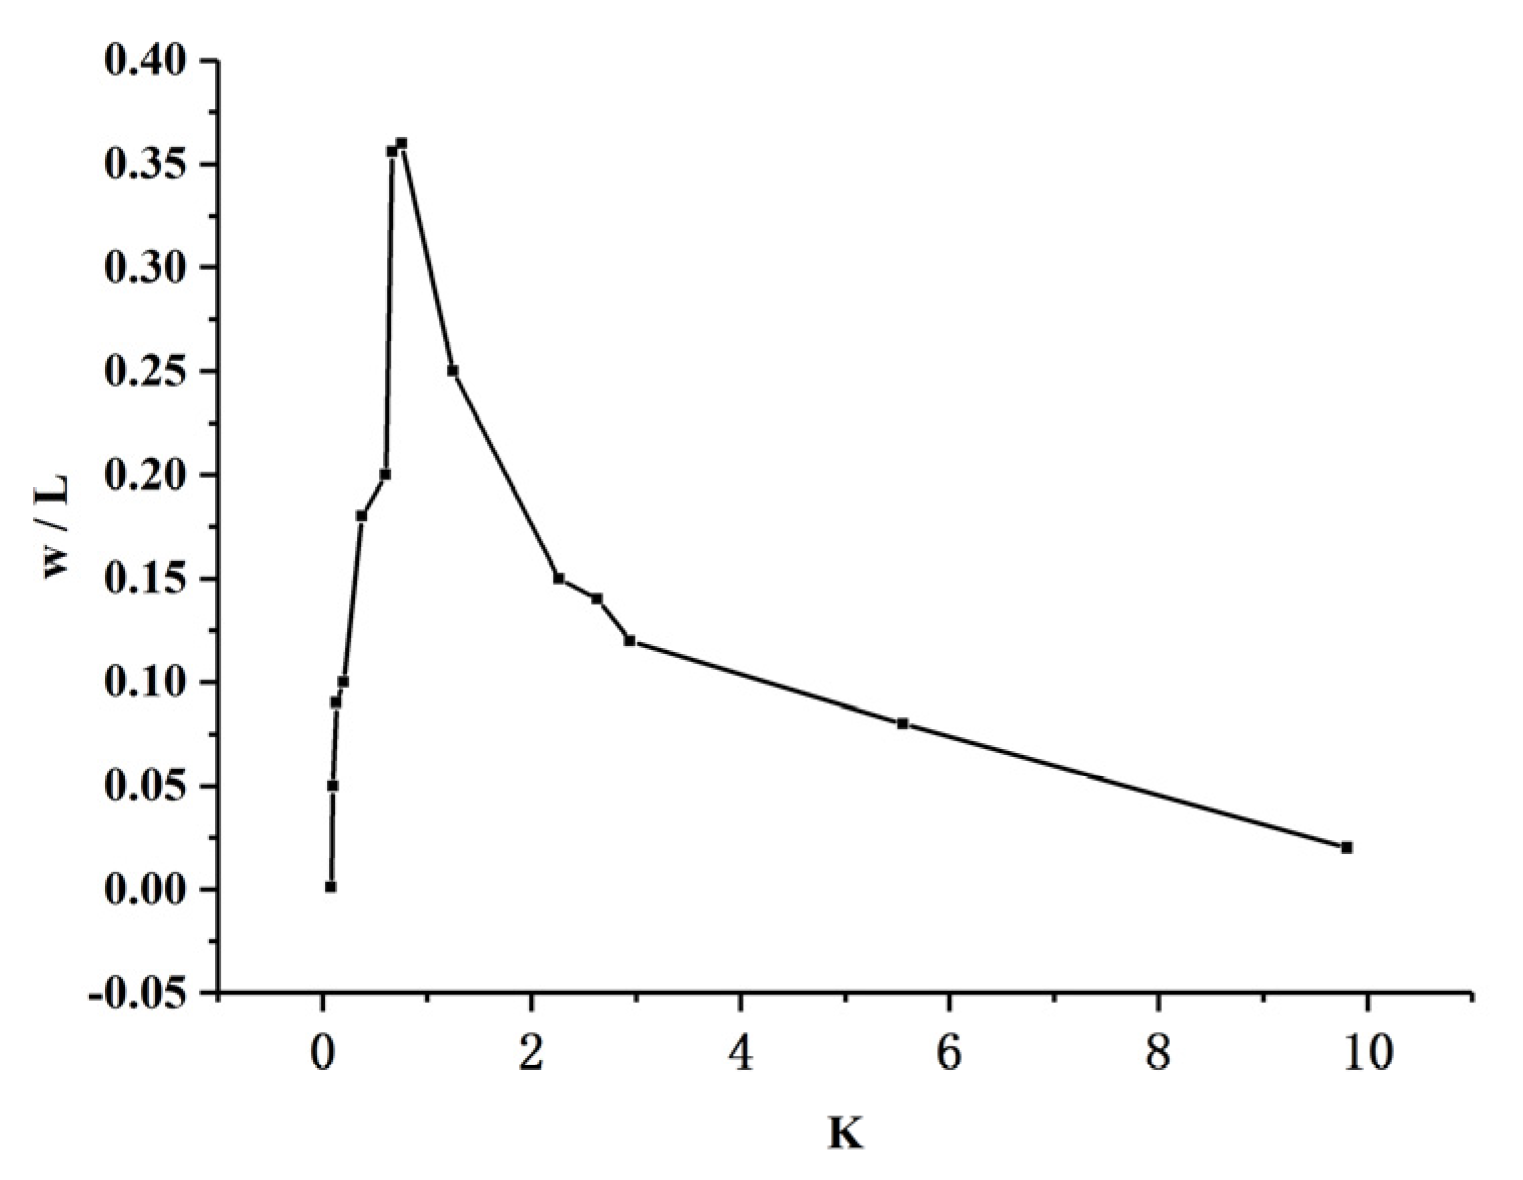
3.2.4. Variation Law of Geometry Characteristics of Shear Band
4. Conclusions and Discussion
Author Contributions
Funding
Institutional Review Board Statement
Informed Consent Statement
Data Availability Statement
Conflicts of Interest
References
- Latzel, M.; Luding, S.; Herrmann, H.J.; Howell, D.W.; Behringer, R.P. Comparing simulation and experiment of a 2D granular Couette shear device. Eur. Phys. J. E 2003, 11, 325–333. [Google Scholar] [CrossRef] [PubMed]
- Lu, X.; Wang, Y.; Wang, S.; Cui, P. On the shear bandwidth in saturated soils. Acta Mech. Sin. 2005, 37, 87–91. [Google Scholar]
- Borja, R.I.; Song, X.; Rechenmacher, A.L.; Abedi, S.; Wu, W. Shear band in sand with spatially varying density. J. Mech. Phys. Solids 2012, 61, 219–234. [Google Scholar] [CrossRef]
- Lobo-Guerrero, S.; Vallejo, L.E. Modelling Granular Crushing in ring shear tests: Experimental and numerical analyses. Soils Found. 2006, 46, 147–157. [Google Scholar] [CrossRef] [Green Version]
- Wang, B.; Wang, T.; Sun, J.; Shi, J. Shearing characteristic of sliding zone soil from ring shear tests for large scale mudstone landslides in Huangshui River basin. J. Eng. Geol. 2017, 25, 124–131. [Google Scholar]
- Suzuki, M.; van Hai, N.; Yamamoto, T. Ring shear characteristics of discontinuous plane. Soils Found. 2017, 57, 1–22. [Google Scholar] [CrossRef]
- Lv, X.; Zhang, B.; Zhang, P. Laboratory ring shear tests for shear strenghth of sand and clay mixtures. J. Eng. Geol. 2019, 27, 1110–1115. [Google Scholar]
- Zhang, Y.; Guo, C.; Yang, Z.; Shen, Y.; Wu, R.A.; Ren, S. Study on shear strength of deep-seated sliding zone soil of Zhouchangping landslide in Maoxian, Sichuan. J. Eng. Geol. 2021, 29, 764–776. [Google Scholar]
- Cundall, P.A.; Strack, O.D.L. A discrete numerical model for granular assemblies. Geotechnique 1979, 29, 47–65. [Google Scholar] [CrossRef]
- Jiang, M.J.; Peng, D.; Shen, Z.F.; Zhang, W. DEM analysis on formation of shear band of methane hydrate bearing soils. Chin. J. Geotech. Eng. 2014, 36, 1624–1630. [Google Scholar]
- Huang, W. Discrete Element Simulation of Shear Zone Evolution and Characteristics in Sandy Media. Ph.D. Thesis, South China University of Technology, Guangzhou, China, 2015. [Google Scholar]
- Jin, W.; Klinger, J.L.; Westover, T.L.; Huang, H. A density dependent Drucker-Prager/Cap model for ring shear simulation of ground loblolly pine. Powder Technol. 2020, 368, 45–58. [Google Scholar] [CrossRef]
- Fenistein, D.; van de Meent, J.W.; van Hecke, M. Universal and wide shear zones in granular bulk flow. Phys. Rev. Lett. 2004, 92, 094301. [Google Scholar] [CrossRef] [PubMed] [Green Version]
- Liang, G.; Zhou, Y.; Gu, Q. Finite Element Language and Its Application I; Science Press: Beijing, China, 2016. [Google Scholar]
- Erlin, W.; Houzhen, W.; Rongtao, Y. Constitutive model for gas hydrate-bearing sediments considering damage. Chin. J. Rock Mech. Eng. 2012, 31 (Suppl. S1), 3045–3050. [Google Scholar]
- Weibull, W. A statistical distribution function of wide applicability. J. Appl. Mech. 1951, 18, 293–297. [Google Scholar] [CrossRef]


| Medium | Particle Size (mm) | Cohesion | Friction Angle (Degree) | Elasticity Modulus |
|---|---|---|---|---|
| Coarse sand | 3.0 | 0 | 32 | 3.7 |
| Medium sand | 1.0 | 0 | 39 | 4.0 |
| Fine sand | 0.25 | 0 | 44 | 4.6 |
| Hydrate | ------ | 510 | 28 | 70.0 |
Disclaimer/Publisher’s Note: The statements, opinions and data contained in all publications are solely those of the individual author(s) and contributor(s) and not of MDPI and/or the editor(s). MDPI and/or the editor(s) disclaim responsibility for any injury to people or property resulting from any ideas, methods, instructions or products referred to in the content. |
© 2023 by the authors. Licensee MDPI, Basel, Switzerland. This article is an open access article distributed under the terms and conditions of the Creative Commons Attribution (CC BY) license (https://creativecommons.org/licenses/by/4.0/).
Share and Cite
Qiao, J.; Lu, X.; Zhang, X. A Study on the Law of Ring-Shear Band Evolution. J. Mar. Sci. Eng. 2023, 11, 70. https://doi.org/10.3390/jmse11010070
Qiao J, Lu X, Zhang X. A Study on the Law of Ring-Shear Band Evolution. Journal of Marine Science and Engineering. 2023; 11(1):70. https://doi.org/10.3390/jmse11010070
Chicago/Turabian StyleQiao, Jiyan, Xiaobing Lu, and Xuhui Zhang. 2023. "A Study on the Law of Ring-Shear Band Evolution" Journal of Marine Science and Engineering 11, no. 1: 70. https://doi.org/10.3390/jmse11010070