Article

Effects of Local Denting and Fracture Damage on the Residual Longitudinal Strength of Box Girders

1
UlsanLab Inc., Ulsan 44610, Republic of Korea
2
Korean Register of Shipping, Busan 46762, Republic of Korea
3
Research Center for Hydrodynamics Technology, National Research and Innovation Agency (BRIN), Surabaya 60112, Indonesia
4
Department of Naval Architecture and Ocean Engineering, Nha Trang University, Nha Trang 650000, Vietnam
*
Author to whom correspondence should be addressed.
J. Mar. Sci. Eng. 2023, 11(1), 76; https://doi.org/10.3390/jmse11010076
Submission received: 30 November 2022 / Revised: 18 December 2022 / Accepted: 26 December 2022 / Published: 3 January 2023
(This article belongs to the Special Issue Ship Collision Risk Assessment)

Abstract

:
The residual strength of denting- and fracture-damaged box girders were experimentally and numerically investigated. The experiments were conducted under a pure bending moment using the four-point bending test method. The load, deflection, and strain were measured. The strains of the extension structures were also measured, and the frictional forces between the model and the supported round bar were estimated. Test models consisting of two groups were fabricated. These groups were designed to estimate the residual strength of denting- and fracture-damaged models. The damage was induced by releasing a striker using a drop-testing machine to consider the dynamic effect. Additionally, numerical analyses were performed via a nonlinear finite element analysis, where the measured initial imperfection data and welding residual stresses were considered. The ultimate longitudinal moments that considered the frictional force of the round bars were reduced by 12% (on average) compared with those obtained by neglecting the frictional forces.

1. Introduction

Ships and offshore structures are subjected to various loads within the sea state during their lifetime. Among them, the most common and serious is the collision load. Ship navigation technology has been significantly improved by adopting electronic navigation charts. However, collision accidents have consistently occurred owing to the increase in maritime trade volume; floating offshore structures, including offshore wind turbines; and ship speed. These accidents result in the loss of life and cargo, as well as serious sea pollution, and the damage to the hull structure caused by collision reduces its strength. A damaged ship is vulnerable to bending loads from waves, which are referred to as hogging and sagging, and therefore, has an increased risk of collapse. Hence, it is essential that the structural design not only considers the ultimate strength of the ship, but also ensures a sufficient residual longitudinal strength in the event of a collision that damages the hull structure. Recently, collision and grounding accidents have started to be considered in the structural design of tankers and bulk carriers by the International Association of Classification Societies (IACS) [1]. The IACS [1] included the residual longitudinal strength requirements in its harmonized common structural rules.
To predict the ultimate strength of the hull structure, several researchers have carried out the bending experiments on intact box girder structures. Sugimura et al. [2] performed collapse tests on 1/5-scale welded steel ship hull girders under longitudinal bending. The design of the test model represented the mid-ship of the destroyer escort. The general buckling strength of the upper deck was investigated considering the effects of the under-deck structures. Compressive and tensile loads were applied in the horizontal direction on the deck and the bottom of the model, respectively. Dowling et al. [3] tested box girder models under three-point bending loads. The tests indicated that the presence of shear and shear lag did not significantly reduce the strength of the stiffened compression flange. Reckling [4] performed a series of collapse tests on seven box girder models under pure bending. Nishihara [5] performed a collapse test on eight box girder models representing various ships: a single-hull tanker, a double-hull tanker, a bulk carrier, and a container ship. All the test specimens were subjected to a pure bending moment. A method for estimating the ultimate bending moment of the hull girder was proposed and applied to the mid-ship sections of actual ships. Mansour et al. [6] conducted bending tests on two girder models with the application of distributed lateral loads via air pressure using air bags. One model was subjected to a sagging–bending moment to investigate the failure behavior of the deck on a single-hull tanker under compression. The other model was tested with loads simulating a hogging–bending moment along with lateral pressure on the bottom to investigate several possible modes of failure of an open-deck ship. Dow [7] performed an ultimate strength test on a 1/3-scale welded steel hull girder model of a frigate. A sagging–bending moment was applied to the model. The buckling of the deck and the upper part of the side shell plating led to the overall collapse of the cross section. The International Ship and Offshore Structures Congress (ISSC) [8] organized a benchmark study on a model test of Dow [7]. Eight participants used five kinds of methods: AM (analytical method), RINA rules, CSR (common structure rules), ISUM (idealized structural unit method), and FEM (finite element method). Although the same definition for the geometry of the model was used, the calculation of results differed by each method. Akhras et al. [9] conducted an experiment with a box girder simulating the behavior of the ship hull. The girder test section was subjected to pure bending until failure occurred. Additionally, the residual stresses and initial geometric imperfections were considered. Qi et al. [10] reported the basic principle of FEM, ISUM, and AM for ultimate longitudinal strength analysis of ship hulls. These methods are verified by model tests (Reckling [4], Nishihara [5], Mansour et al. [6], Dow [7], and Akhras et al. [9]) and the results correspond well with that of the test. The comparative calculations of real ships (large double-hull tankers) are also carried out using the proven methods together with CSR. Yao et al. [11] conducted a series of buckling collapse tests on 1/10-scale hull girder models of a chip carrier under the sagging condition. After the overall buckling of the deck as a stiffened plate and local buckling of the upper-side shell plating, the cross section collapsed. Wu et al. [12] performed an ultimate strength test of a double-hull structure and employed a four-point bending test device for conducting pure bending tests on the test model. The test model was machined by cutting or folding with less welding. Gordo and Guedes Soares [13] conducted an experimental test on the ultimate bending moment strength of a box girder. The box girder specimen was 1 m long and was supported by two 2-m blocks. A four-point bending test was performed to obtain pure constant bending throughout the specimen. The moment curvature relationship was established, and two methods were presented for indirectly evaluating the residual stresses. Gordo and Guedes Soares [14] performed a series of collapse tests on three box girders subjected to a pure bending moment by inducing tension and compression on the bottom and top of the box, respectively. The specimens were made of very high tensile steel with a nominal yield stress of 690 MPa and were reinforced with bar stiffeners of the same material. The tests involved a four-point bending of a beam-like box girder. Another experimental study was conducted by Gordo and Guedes Soares [15] where three tests on the bending of box girders made of mild steel were performed varying the span between transverse frames. It was found that the transverse-frame spacing is an important parameter for the strength of a box girder subjected to bending moment. The increase in the span reduced the ultimate bending moment due to a decrease in the buckling strength of the stiffened panels under compression. Wang et al. [16] investigated the ultimate strength of ultra-large container ships (ULCS). The experiment and non-linear finite element method (NFEM) are utilized to evaluate the ultimate longitudinal strength behaviors of hull girders for ULCS. Chen et al. [17] performed the experimental tests on six stainless steel plate girders subjected to a combination of a bending moment and shear force. The critical buckling and post-buckling behavior of the slender web panels were obtained and carefully analyzed, revealing the interaction effect between bending and shear force. Zhao et al. [18] conducted an experimental investigation for a hull girder specimen with relatively large deck openings subjected to pure bending. The model was also more complex than the usual box girders as it had two decks and openings in both decks, being thus a unique type of structure.
Additionally, researchers have performed residual longitudinal strength tests on damaged box girder models. Saad-Eldeen et al. [19,20] conducted experimental tests of multi-span stiffened box girders representing mid-ship sections. The corrosion wastage of three box girders—initially, moderately, and severely corroded in an actual sea corrosion environment —was analyzed. The box girders were subjected to a four-point loading, leading to a pure bending moment. The moment–curvature relationship was estimated using a mathematical expression according to the readings of the displacement gauges of the deformed box girder. Saad-Eldeen et al. [21,22,23] also conducted a series of simulations with a nonlinear finite element for comparison with the experimental results of corroded box girders under pure bending. Numerical analyses of the ultimate strength were performed based on the commercial code ANSYS. Two groups of analyses were conducted. The first one addressed the corrosion degradation modeled as the average thickness loss based on the real thickness measurements, and the second one, the box girder element thicknesses, were modeled based on the real corrosion thickness measurements. New stress-strain relations have been developed to account for the effect of corrosion on flexural rigidity. Lee and Rim [24] conducted a series of collapse tests on five box girder models to investigate the effects of the damage due to a side collision on the ultimate strength of the hull girder. Five models were tested under a pure bending load. Among the five models, one remained intact, whereas the other four were damaged with an ellipse-shaped damage area that represented the bulbous bow shape of a colliding ship. Among the damaged models, three were made by cutting the plate and stiffener, and one was made via pressing to represent the collision damage. The ultimate strength of the damaged model was reduced by 8–21% compared with that of the intact model. Rim et al. [25] performed a series of collapse tests on five box girder models to investigate the effect of damage due to stranding on the ultimate strength of the hull girder. Among the five models, one remained intact, and the other four exhibited diamond-shaped damage of different sizes, in the shape of the seabed rock section. Among the damaged models, three were made by cutting the plate, and one was made via pressing to represent the stranding damage. According to the experiment results, the ultimate strength of the damaged model was reduced by 14–35% compared with that of the intact model. Yamada and Takami [26] conducted a large-scale bending–collapse test on a box girder with a hole at one side of the shell, which was assumed to be damaged by a ship-to-ship collision. The box girder had a simplified cross section with deck stiffeners and a double bottom designed to represent a tanker double bottom. The model was quasi-statically loaded with a four-point bending moment and collapsed from the mid-ship of the box girder. It was concluded that the rotation of the neutral axis due to the unsymmetrical section occurred, where the side shell of the damaged side was subjected to compression stress only, while the other side was subjected to both tension and compression.
The fracture damage due to collision and grounding was assumed by eliminating structural elements or applying pressing force in (Lee and Rim [24], Rim et al. [25], and Yamada and Takami [26]). However, if the fracture damage is modeled by simply removing structural elements, the effect of the initial plastic deformations and residual stresses caused by the dynamic mass impact cannot be considered; therefore, the effects of these deformations and stresses on the hull girder overall strength is neglected. Additionally, in the case of damage caused by applying a quasi-static loading, such as pressing, the dynamic effects cannot be considered.
The objective of this study was to analyze the effect of denting and fracture damage on ultimate longitudinal strength and to investigate the frictional forces acting at the roller supports between the load-dividing beam and the extension structures. A series of collapse tests were performed on ten box girder models under a pure bending moment using a four-point bending test method. Test models consisting of two groups were fabricated. These groups were designed for the estimation of the residual strength of denting- and fracture-damaged models. The damage was generated by releasing a striker of a drop-testing machine, where initial plastic deformations and residual stresses were contained, as reported in references [27,28]. Additionally, numerical analyses were performed via nonlinear finite element analysis, where the measured initial imperfection data and the welding residual stresses were considered. The numerical modelling and analyses were performed using the commercial software CATIA and ABAQUS and compared with the test data for validation.

2. Test Models

To evaluate the residual longitudinal strength of the box girder structures with denting and fracture damages, ten models were fabricated. The models were divided into two groups, which were denoted as A and B. The parent plates for Groups A and B were ordered separately. Group A comprised one intact model (IB-1) and four denting-damaged models (DB-1, DB-2, DB-3, and DB-4). Group B comprised another intact model (IB-2) and four fracture-damaged models (DB-5, DB-6, DB-7, and DB-8). The box girder models were not scaled down from any actual ships. The tests were designed to analyze the behavior that could be similar to that of the mid-ship section of a ship subjected to a side collision and a vertical bending moment and to validate the numerical method. The denting and fracture damages were generated by performing a lateral collision test.

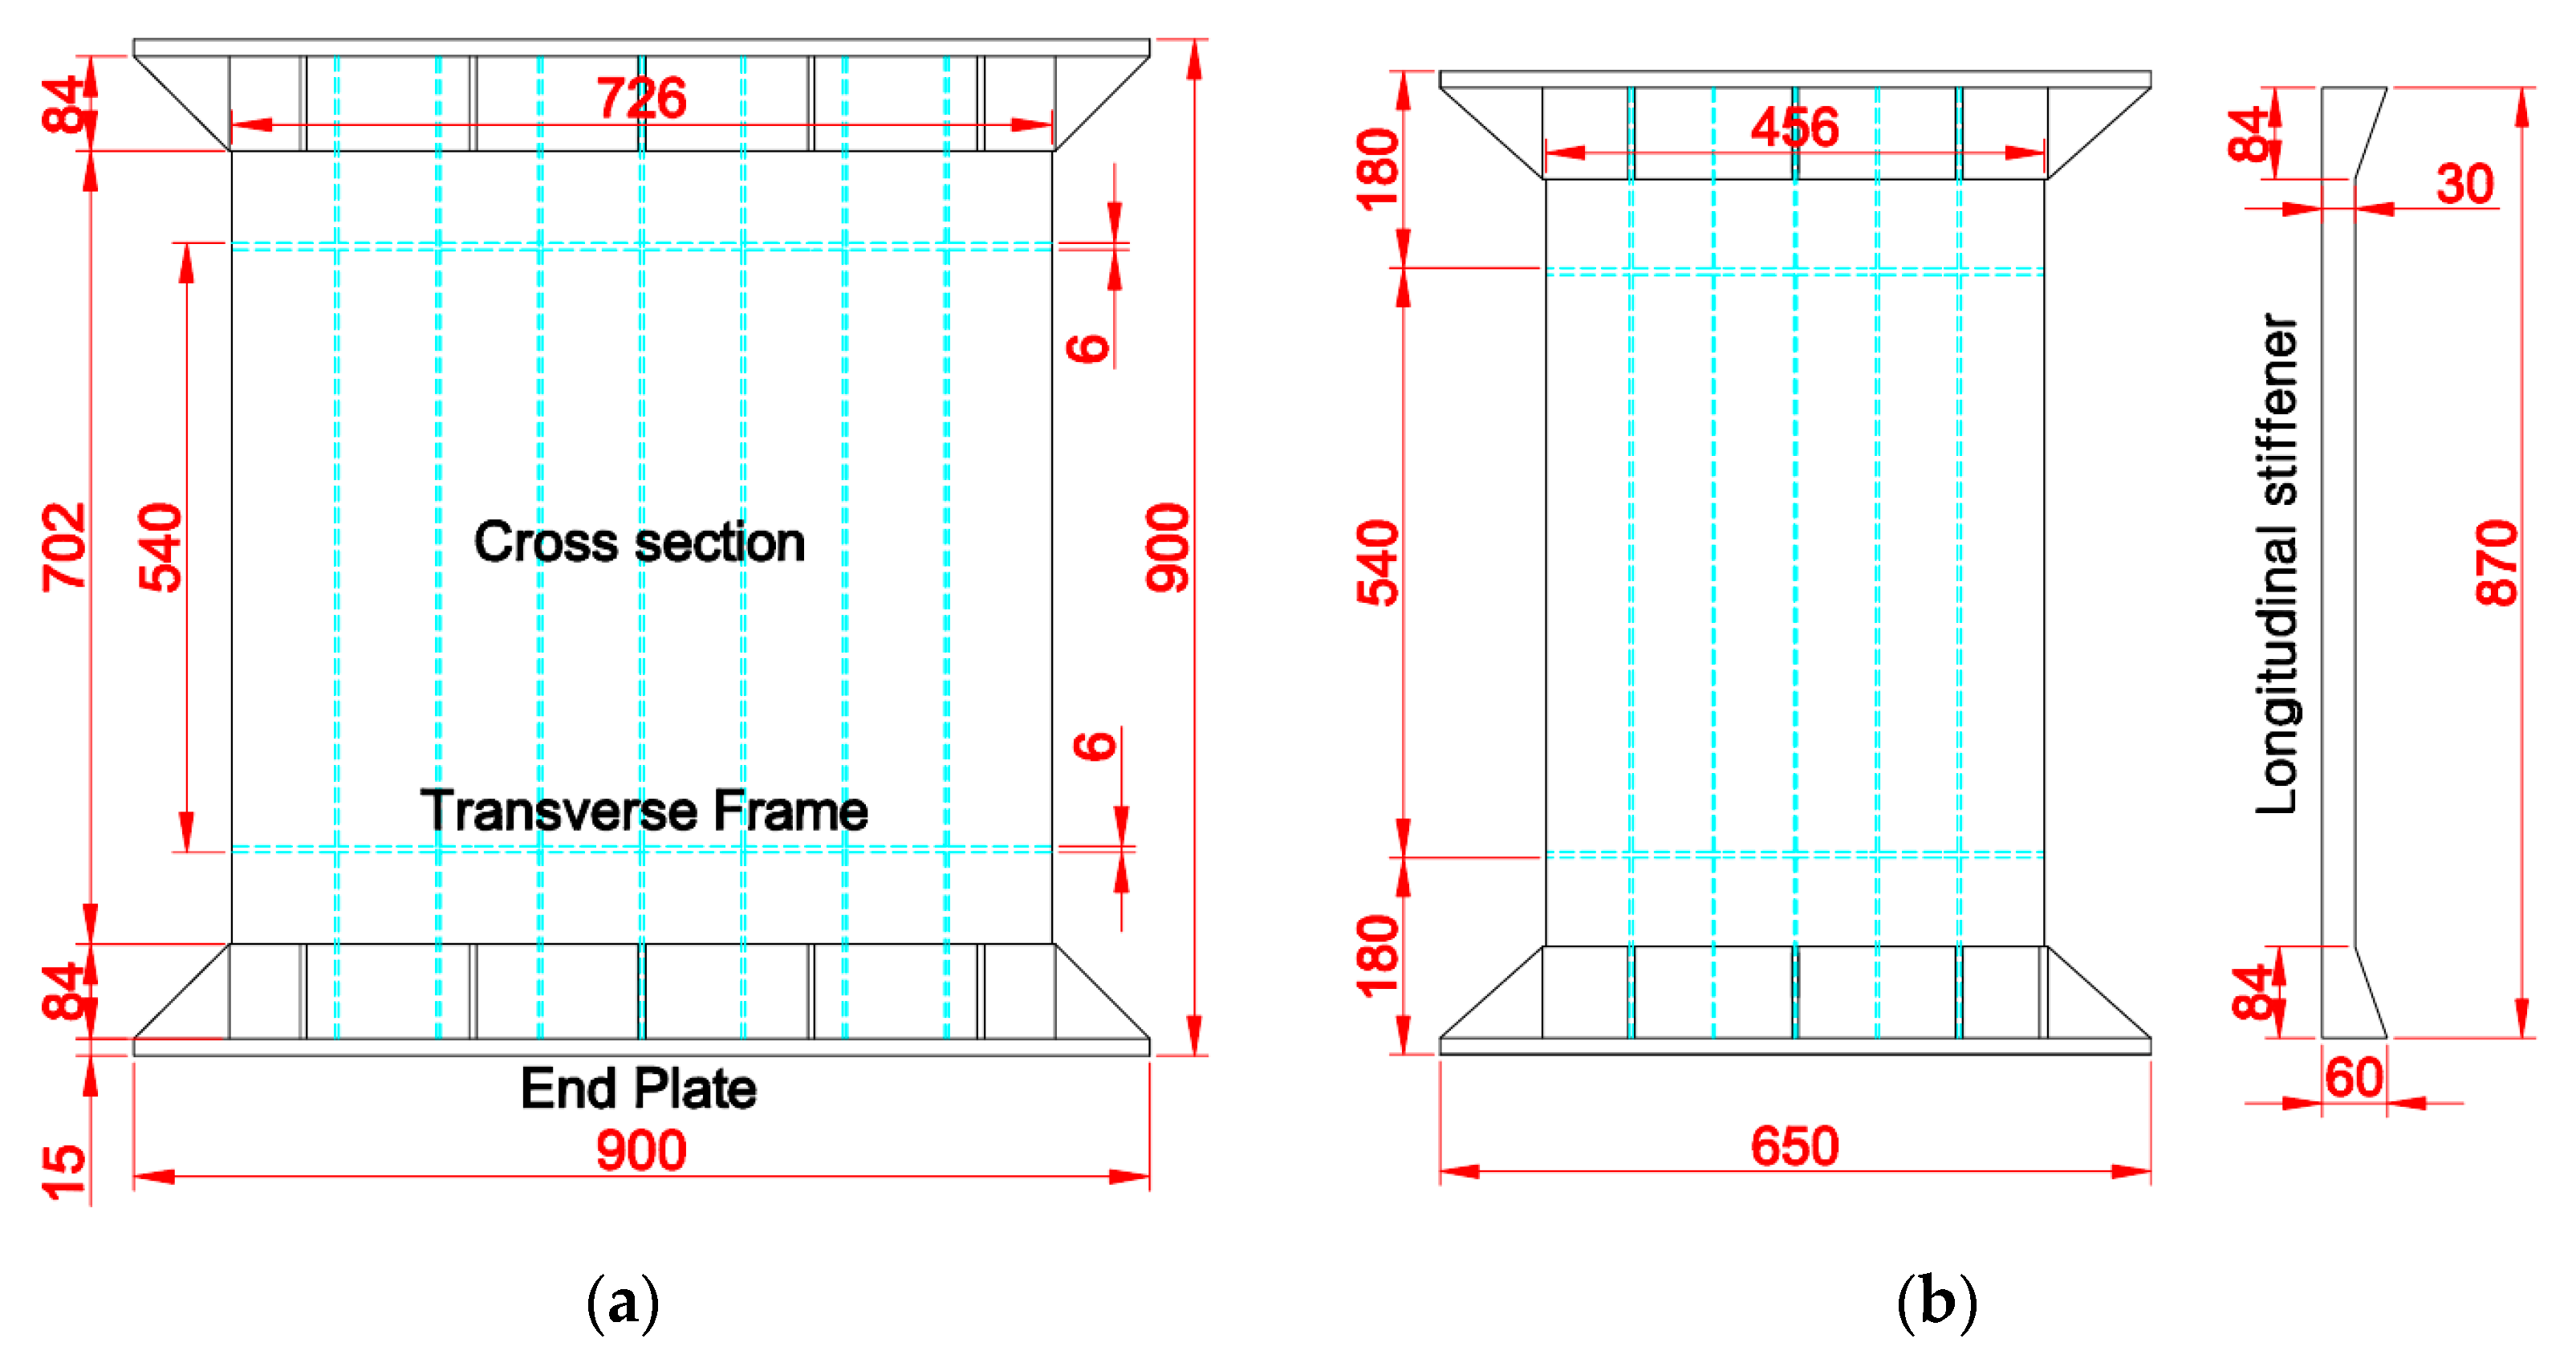
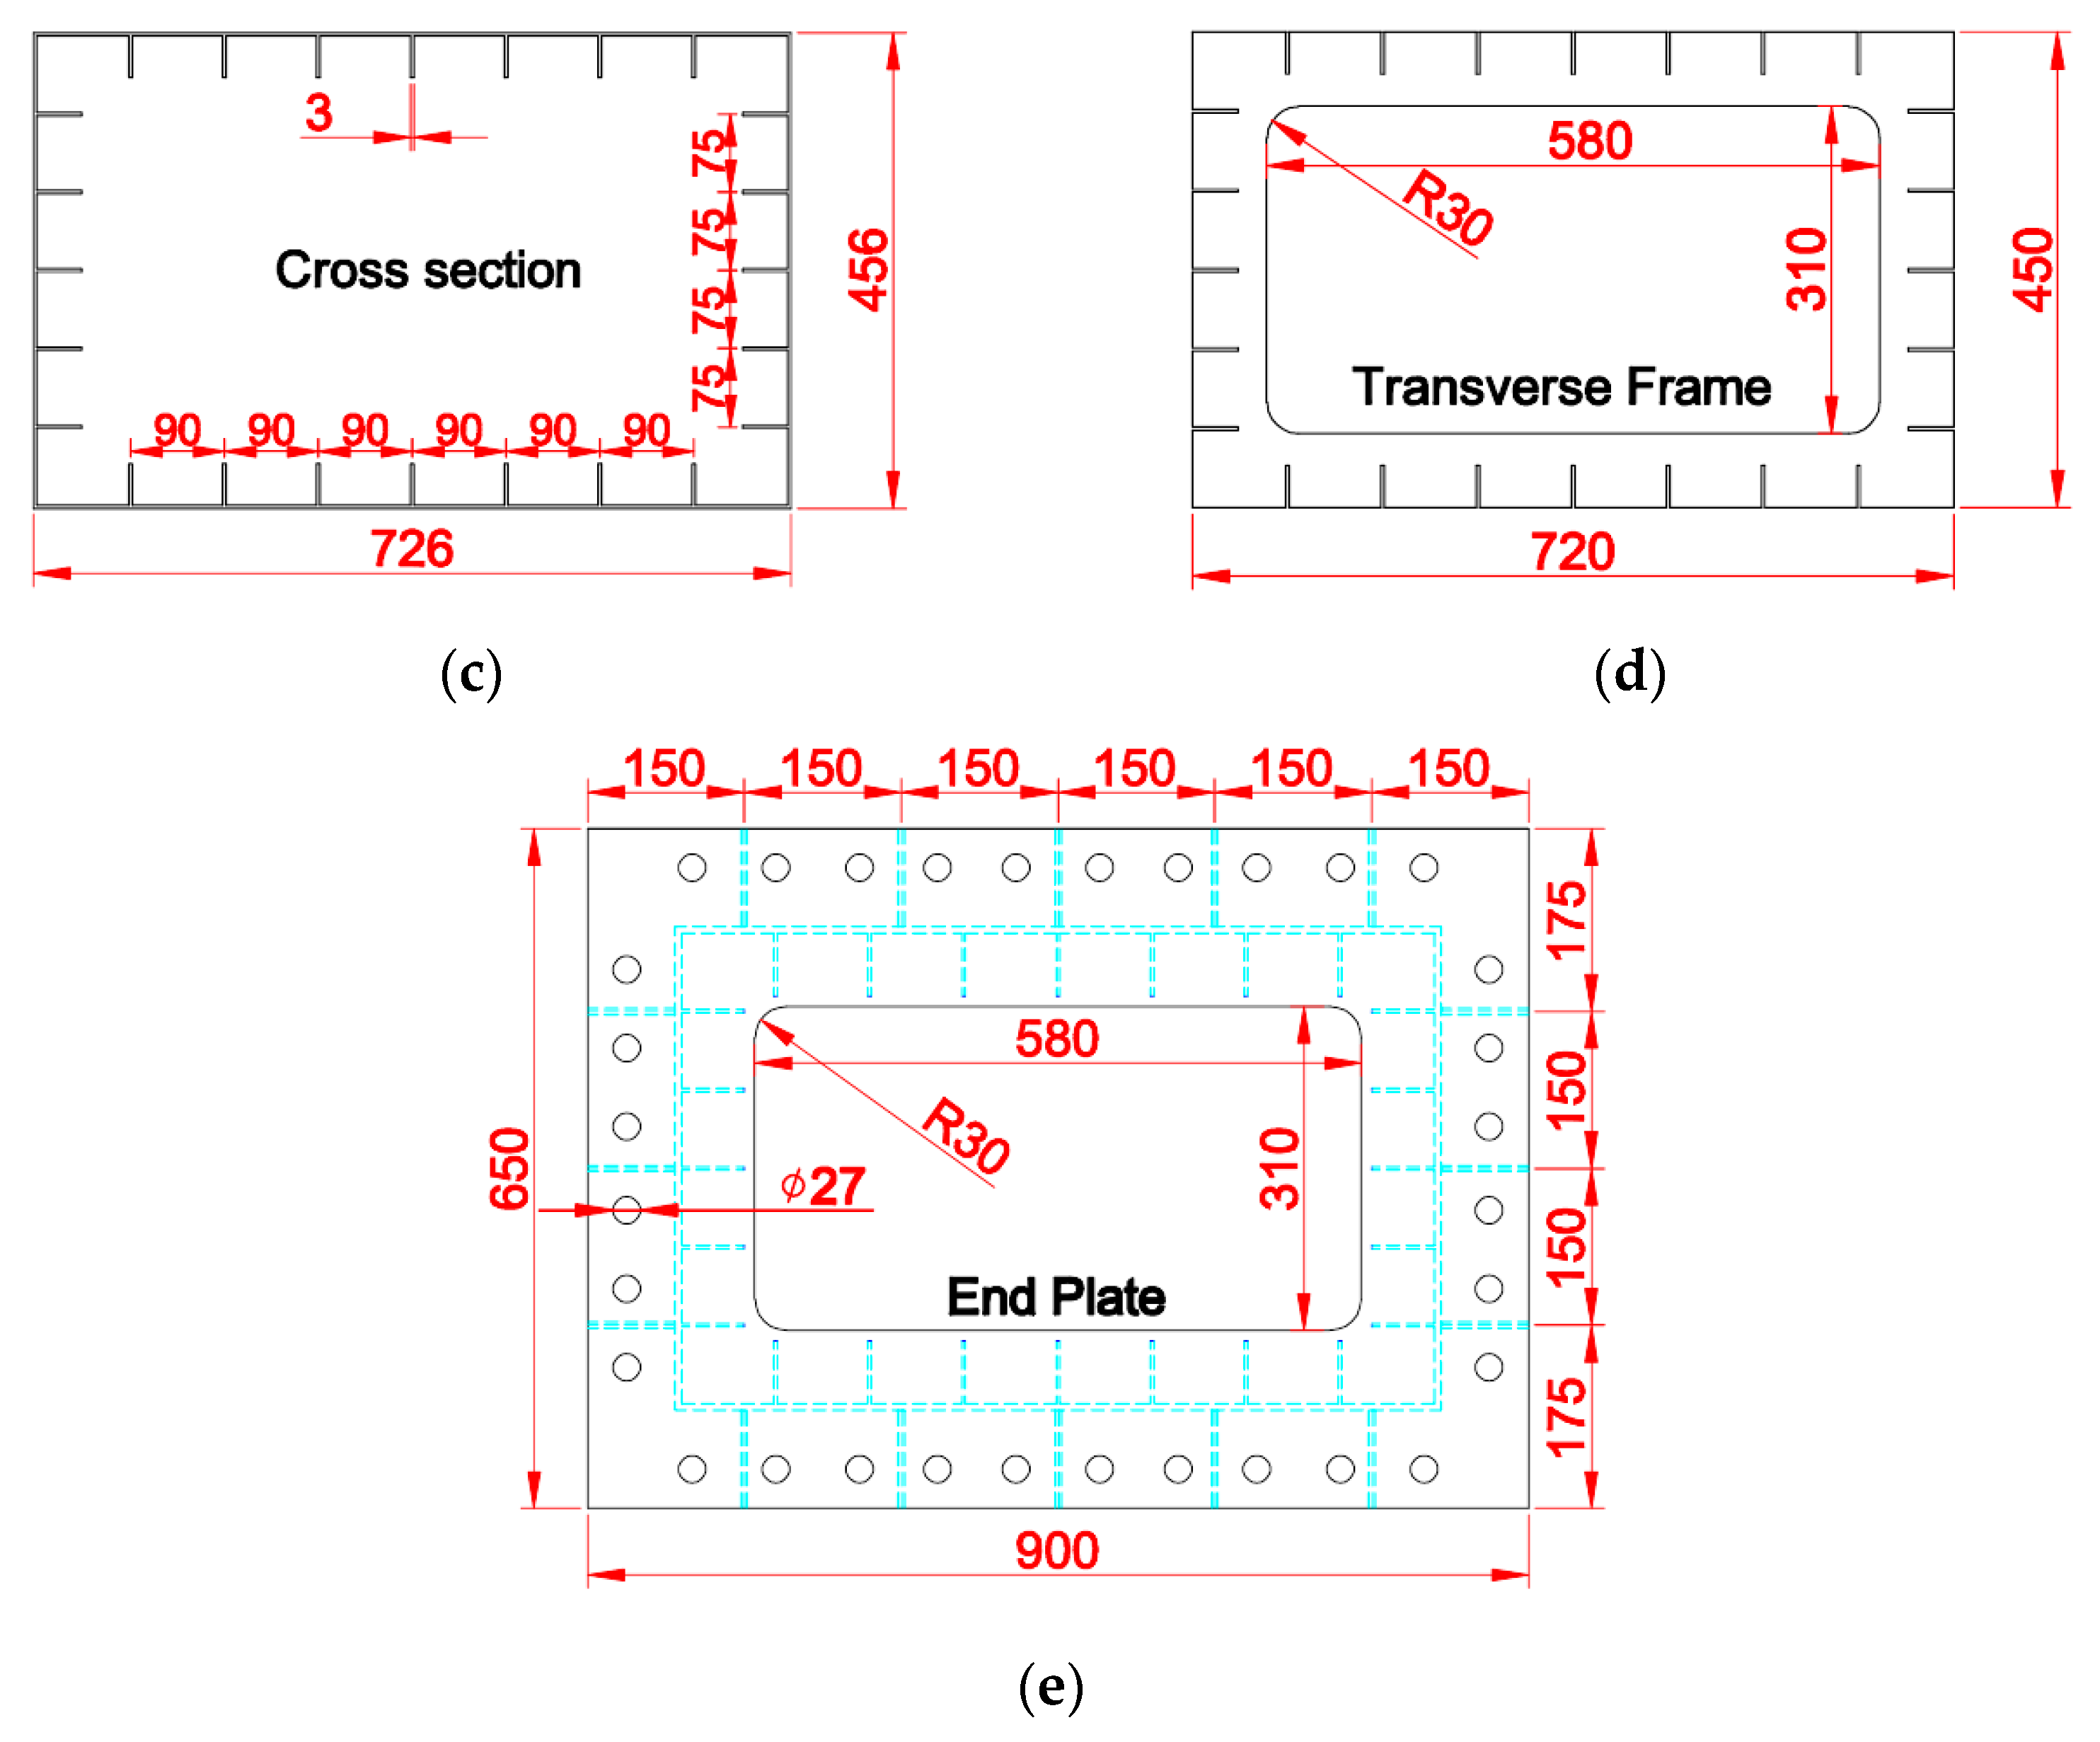
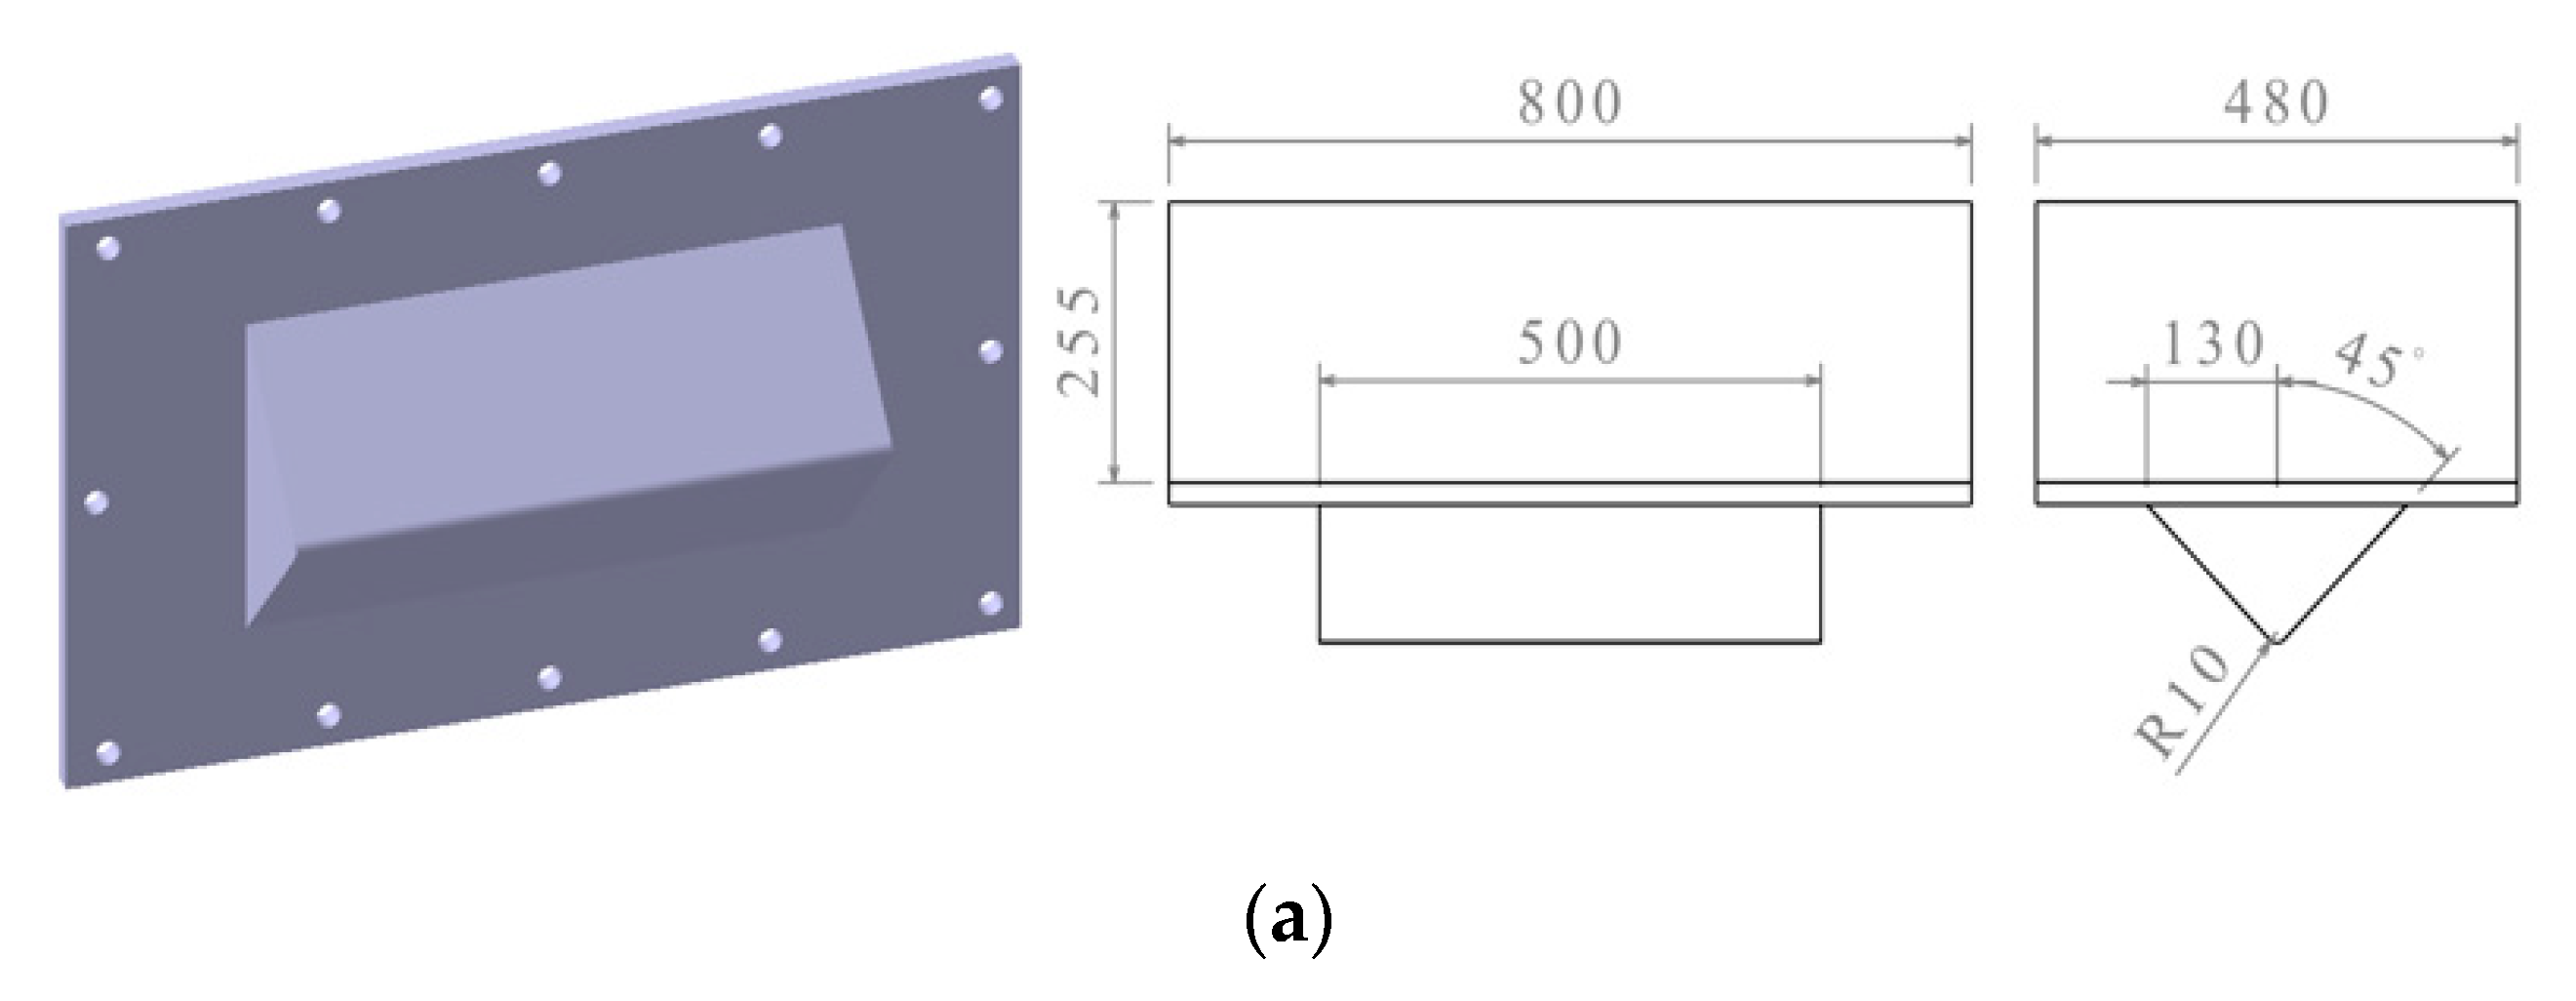
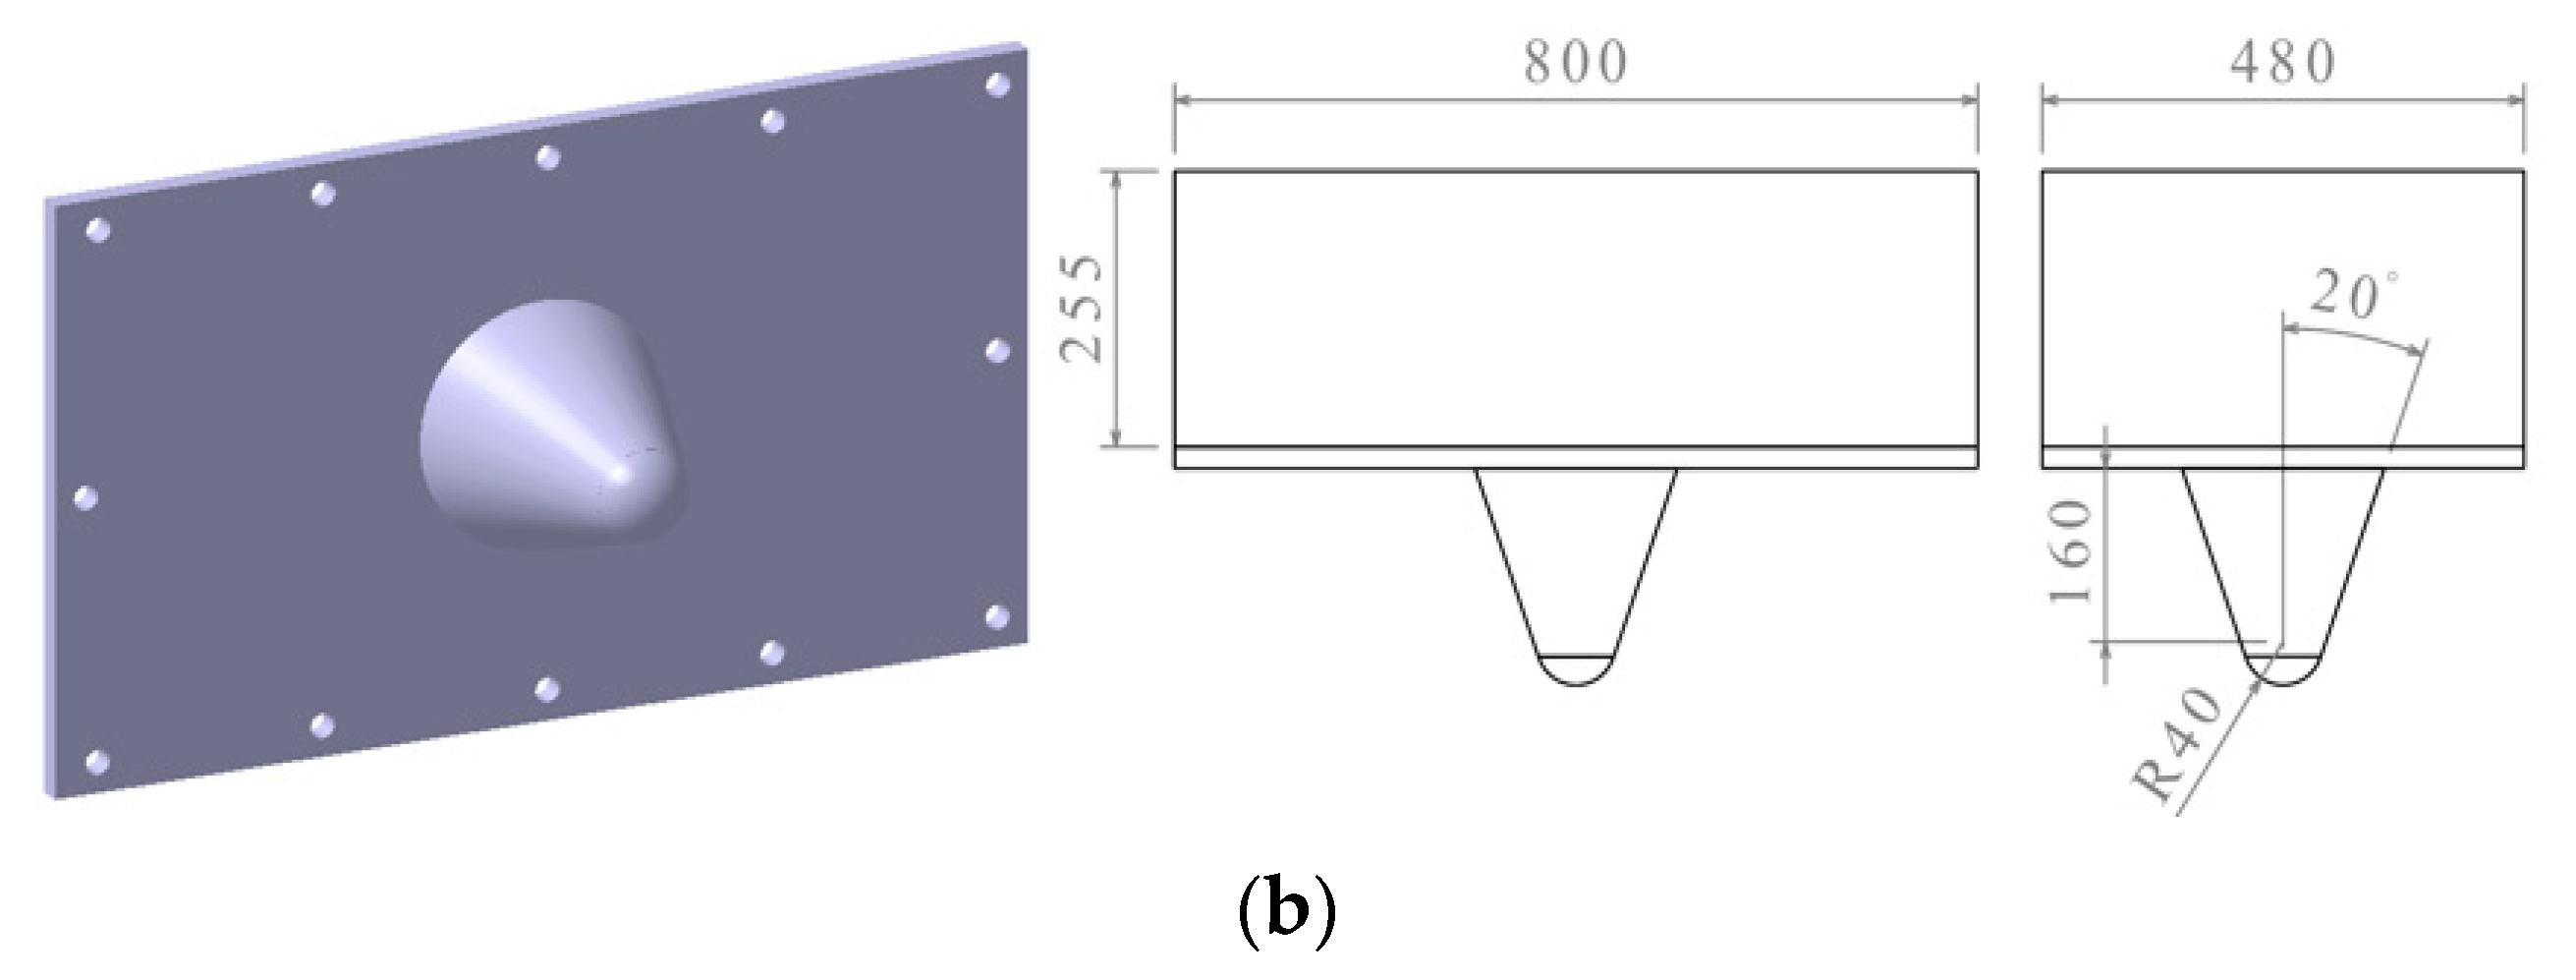
2.1. Dimensions of the Test Models

The geometry and cross sections of the models are shown in Figure 1. The box girder models were 726 mm in width, 456 mm in height, and 900 mm in length. The nominal plate thicknesses in the test sections and longitudinal stiffeners were 3.0 mm, and the nominal plate thicknesses for the extension parts and transverse frames were 6.0 mm. End plates with a thickness of 15 mm were welded to the end of the model. In total, there were 24 flat longitudinal stiffeners. The stiffener scantlings were 40 × 3 mm (Group A) and 30 × 3 mm (Group B), respectively.

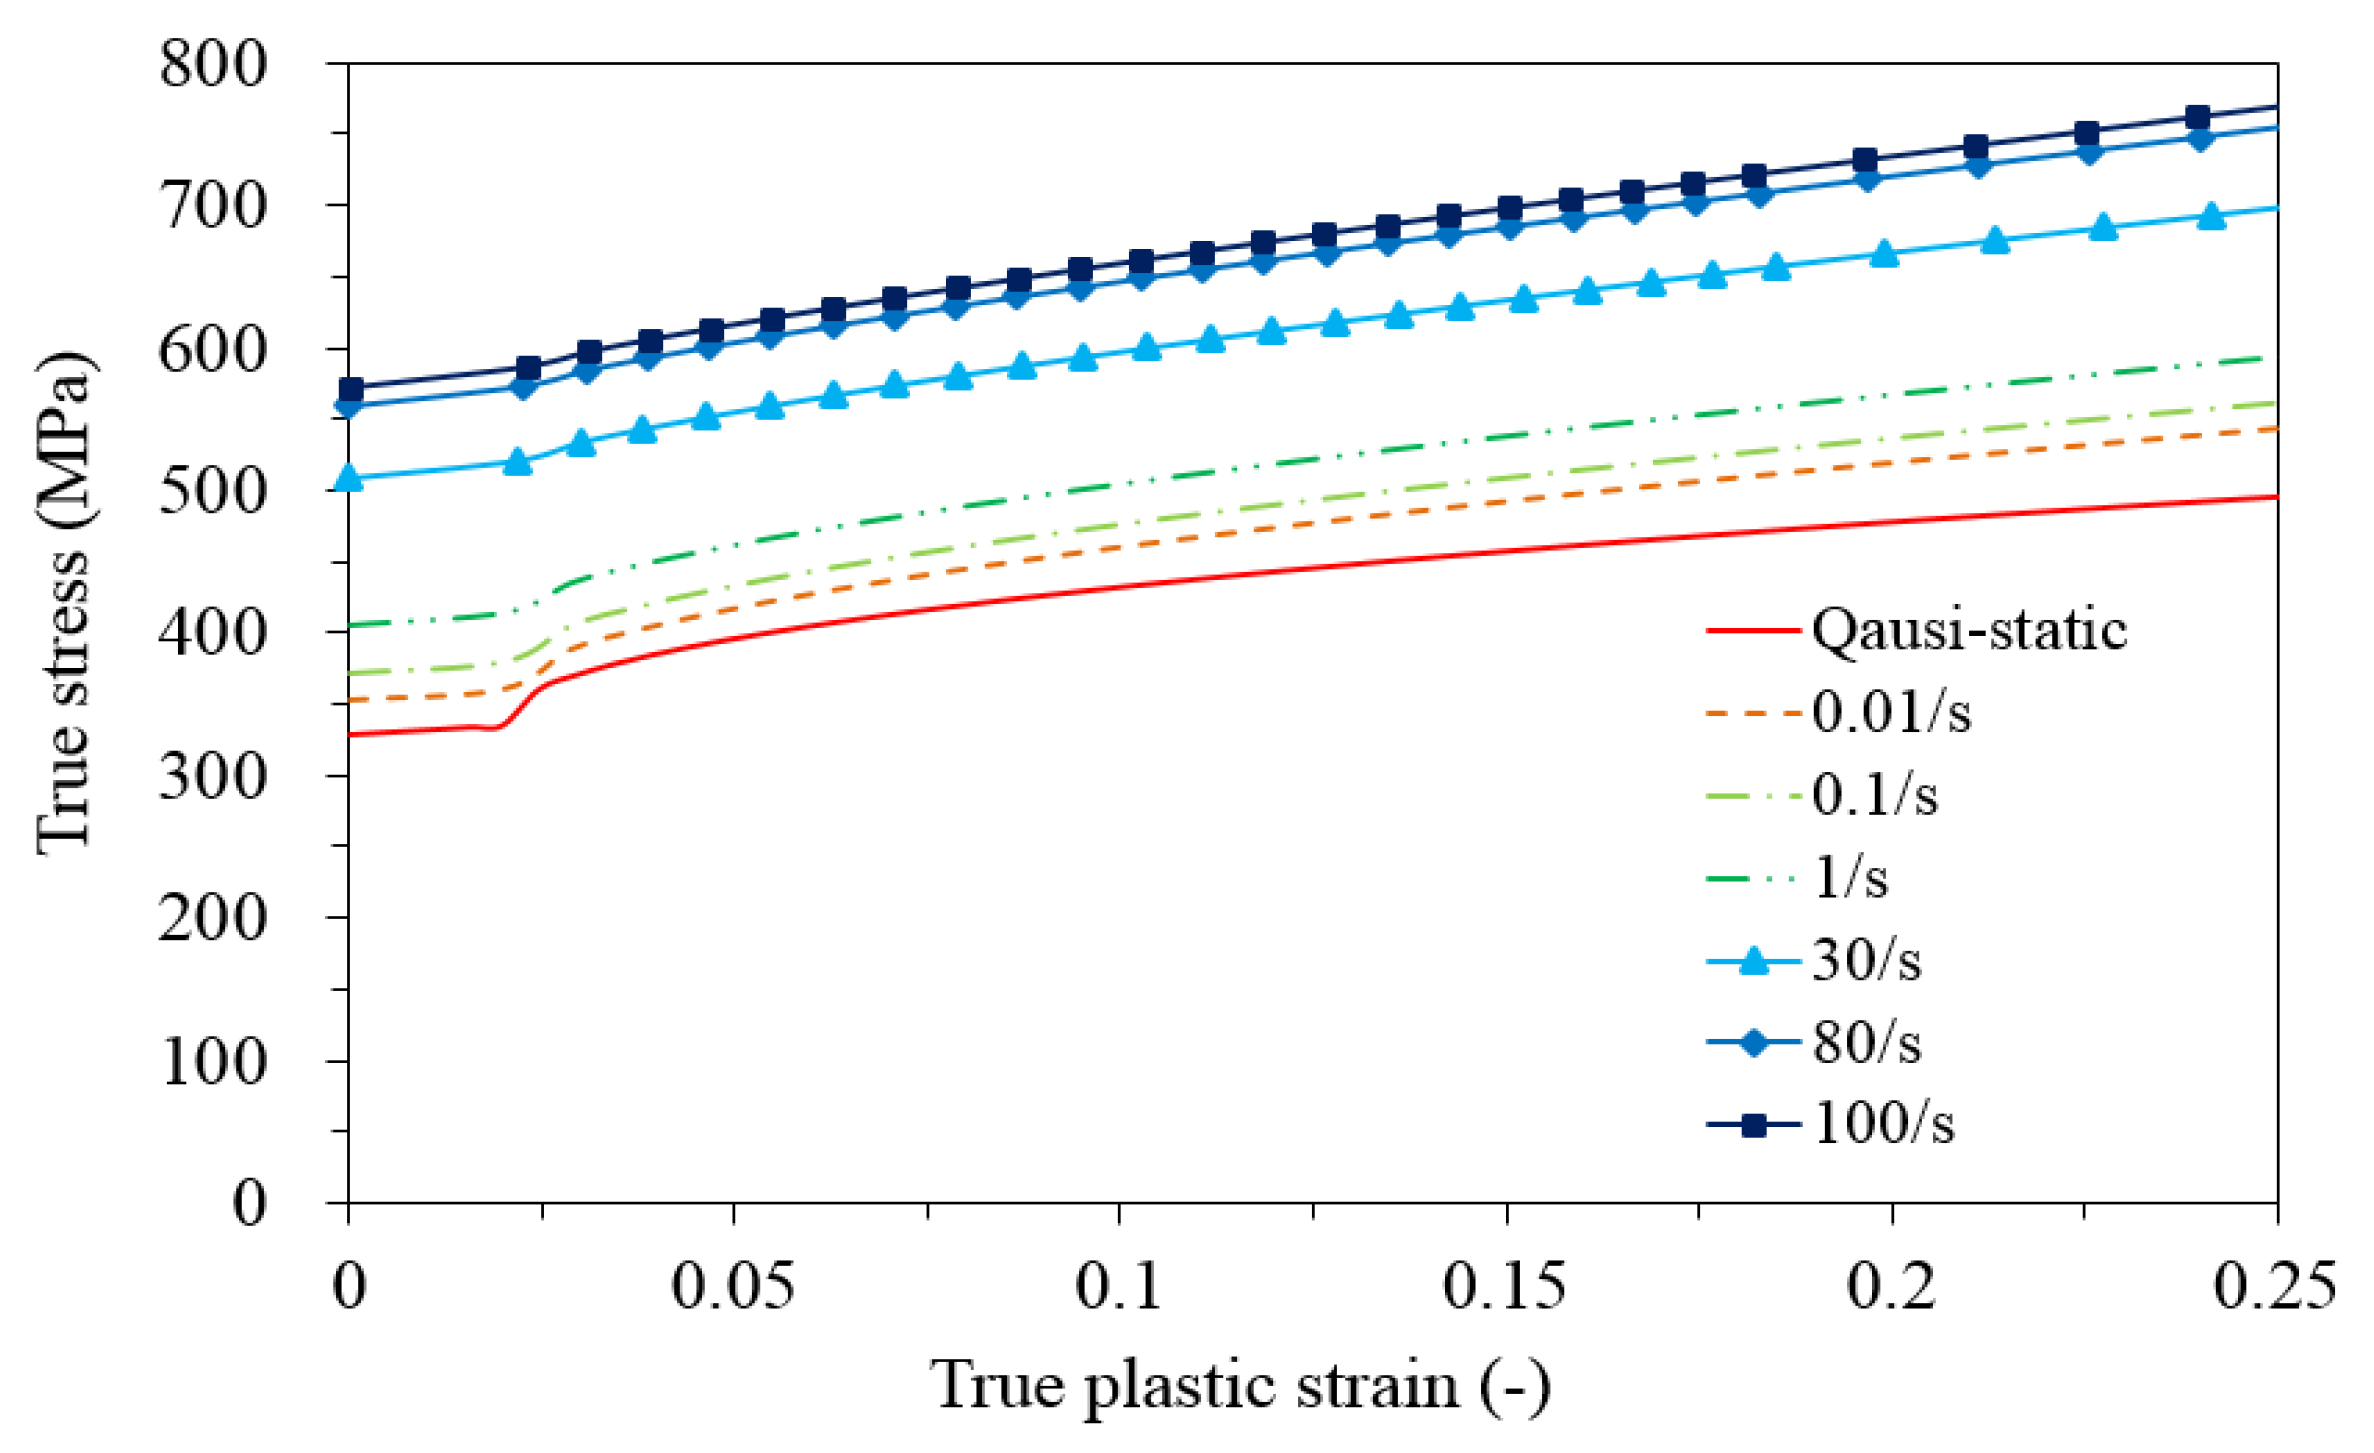
2.2. Material Properties

Before the main tests were conducted, quasi-static tensile tests were performed to determine the material properties of the test models. Mild steel was used as the model material. The tensile-test specimens were prepared according to the KS B 0801 [29]. Three tensile test coupons were cut from each parent plate. For each group, the numbers of coupons were 30 and 6 for thicknesses of 3 and 6 mm, respectively. The tensile tests were performed with a jaw speed of 1 mm/min. The results for the average of the material properties of each group are presented in Table 1. The actual thickness of the parent plate was measured using an ultrasonic thickness gauge. The ranges of the Young’s modulus, yield strength, and ultimate tensile strength were 205–210 GPa, 222.9–325.7 MPa, and 329.2–408.9 MPa, respectively. Negligible variations were observed in all the mechanical properties.

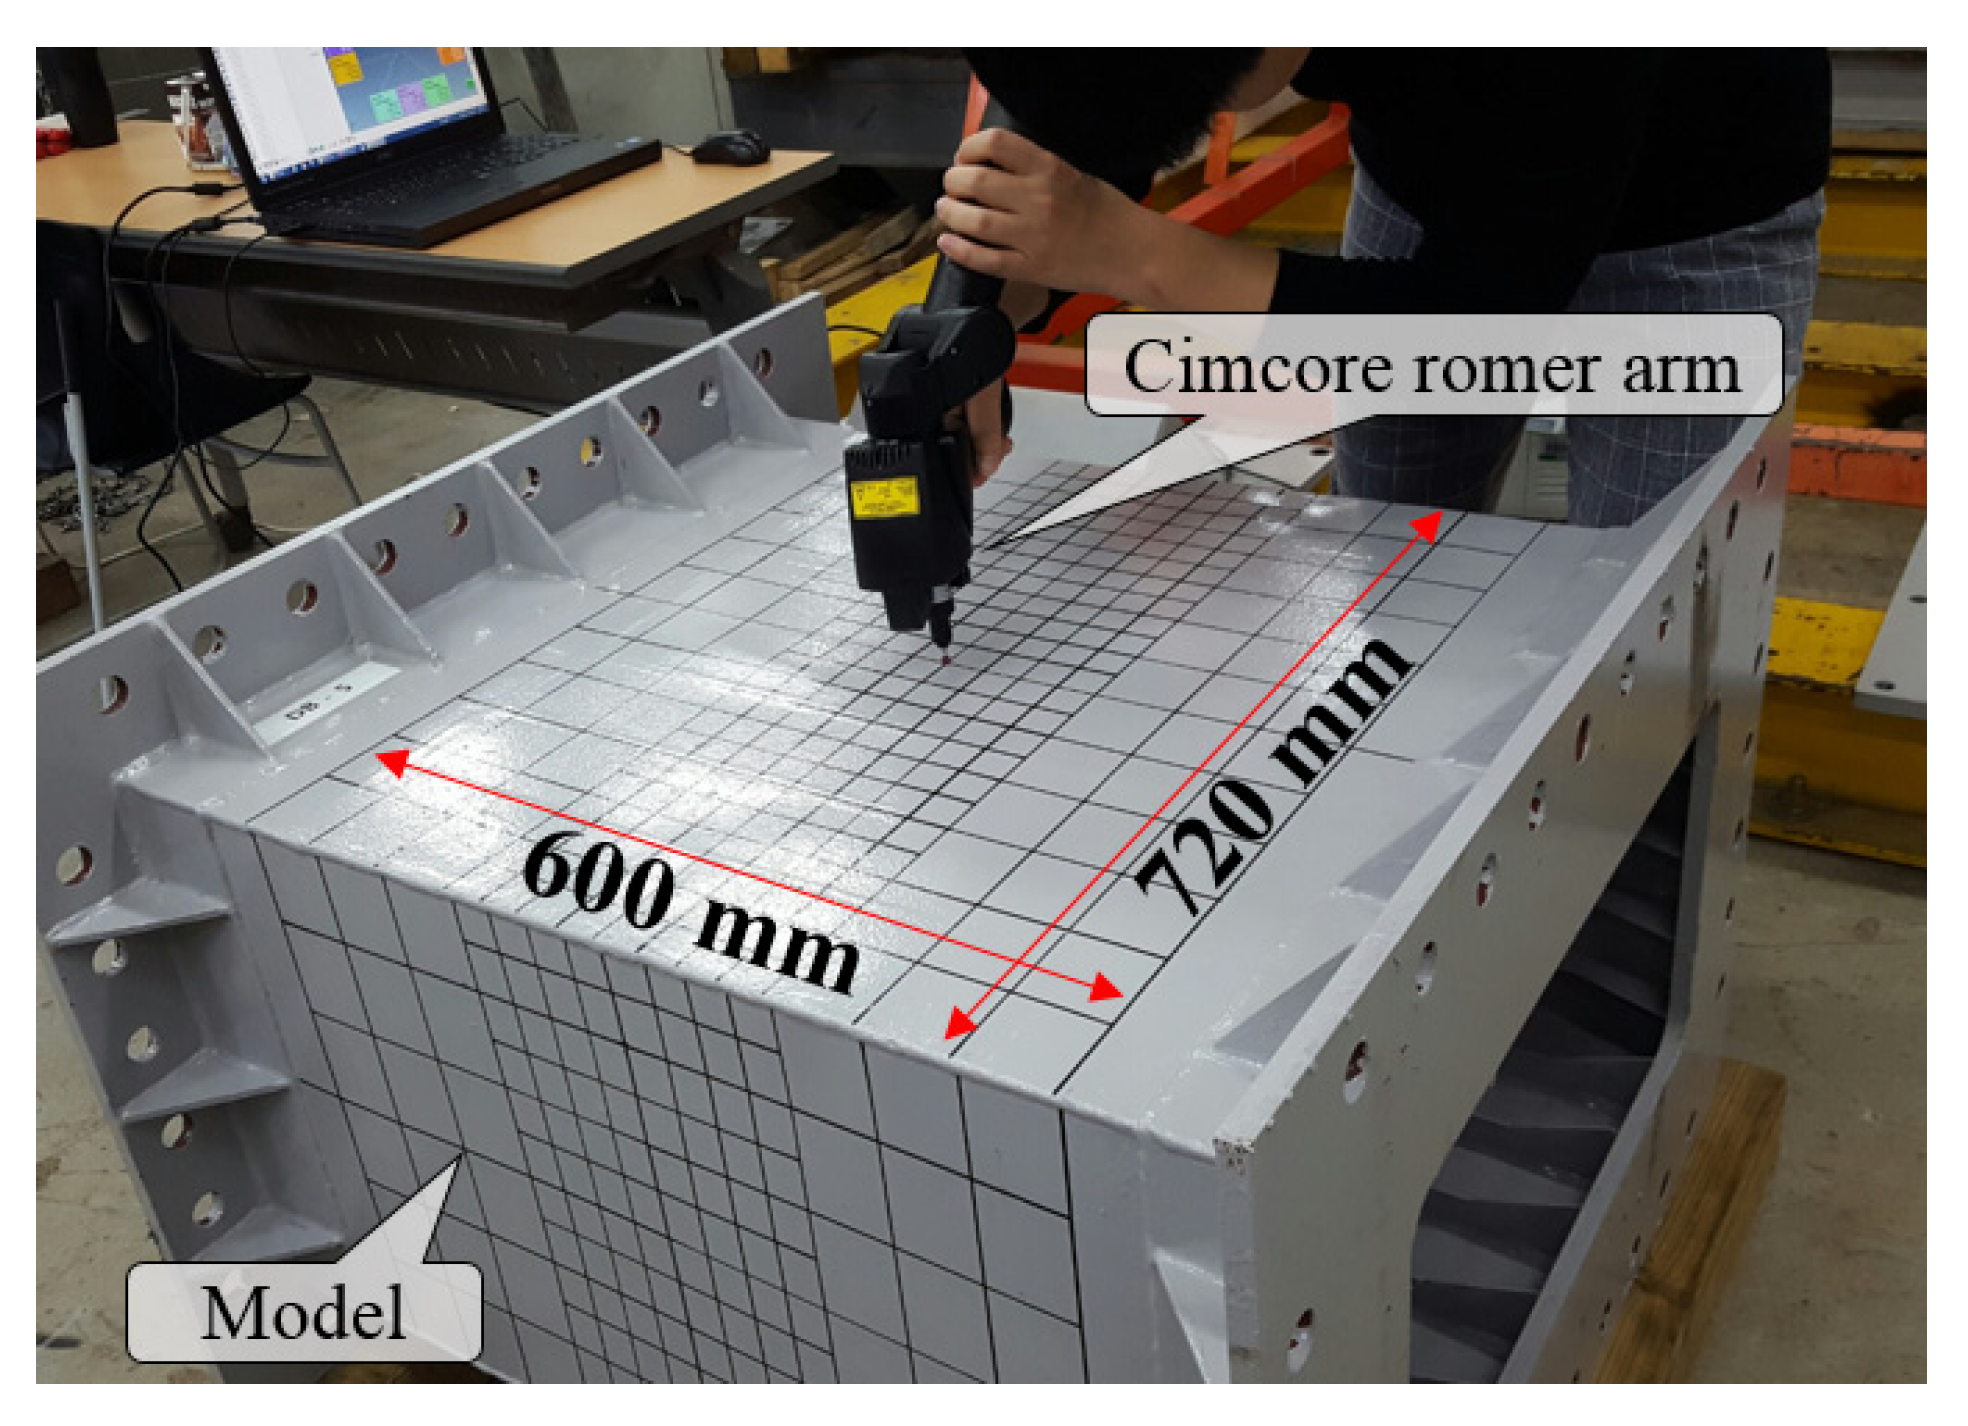
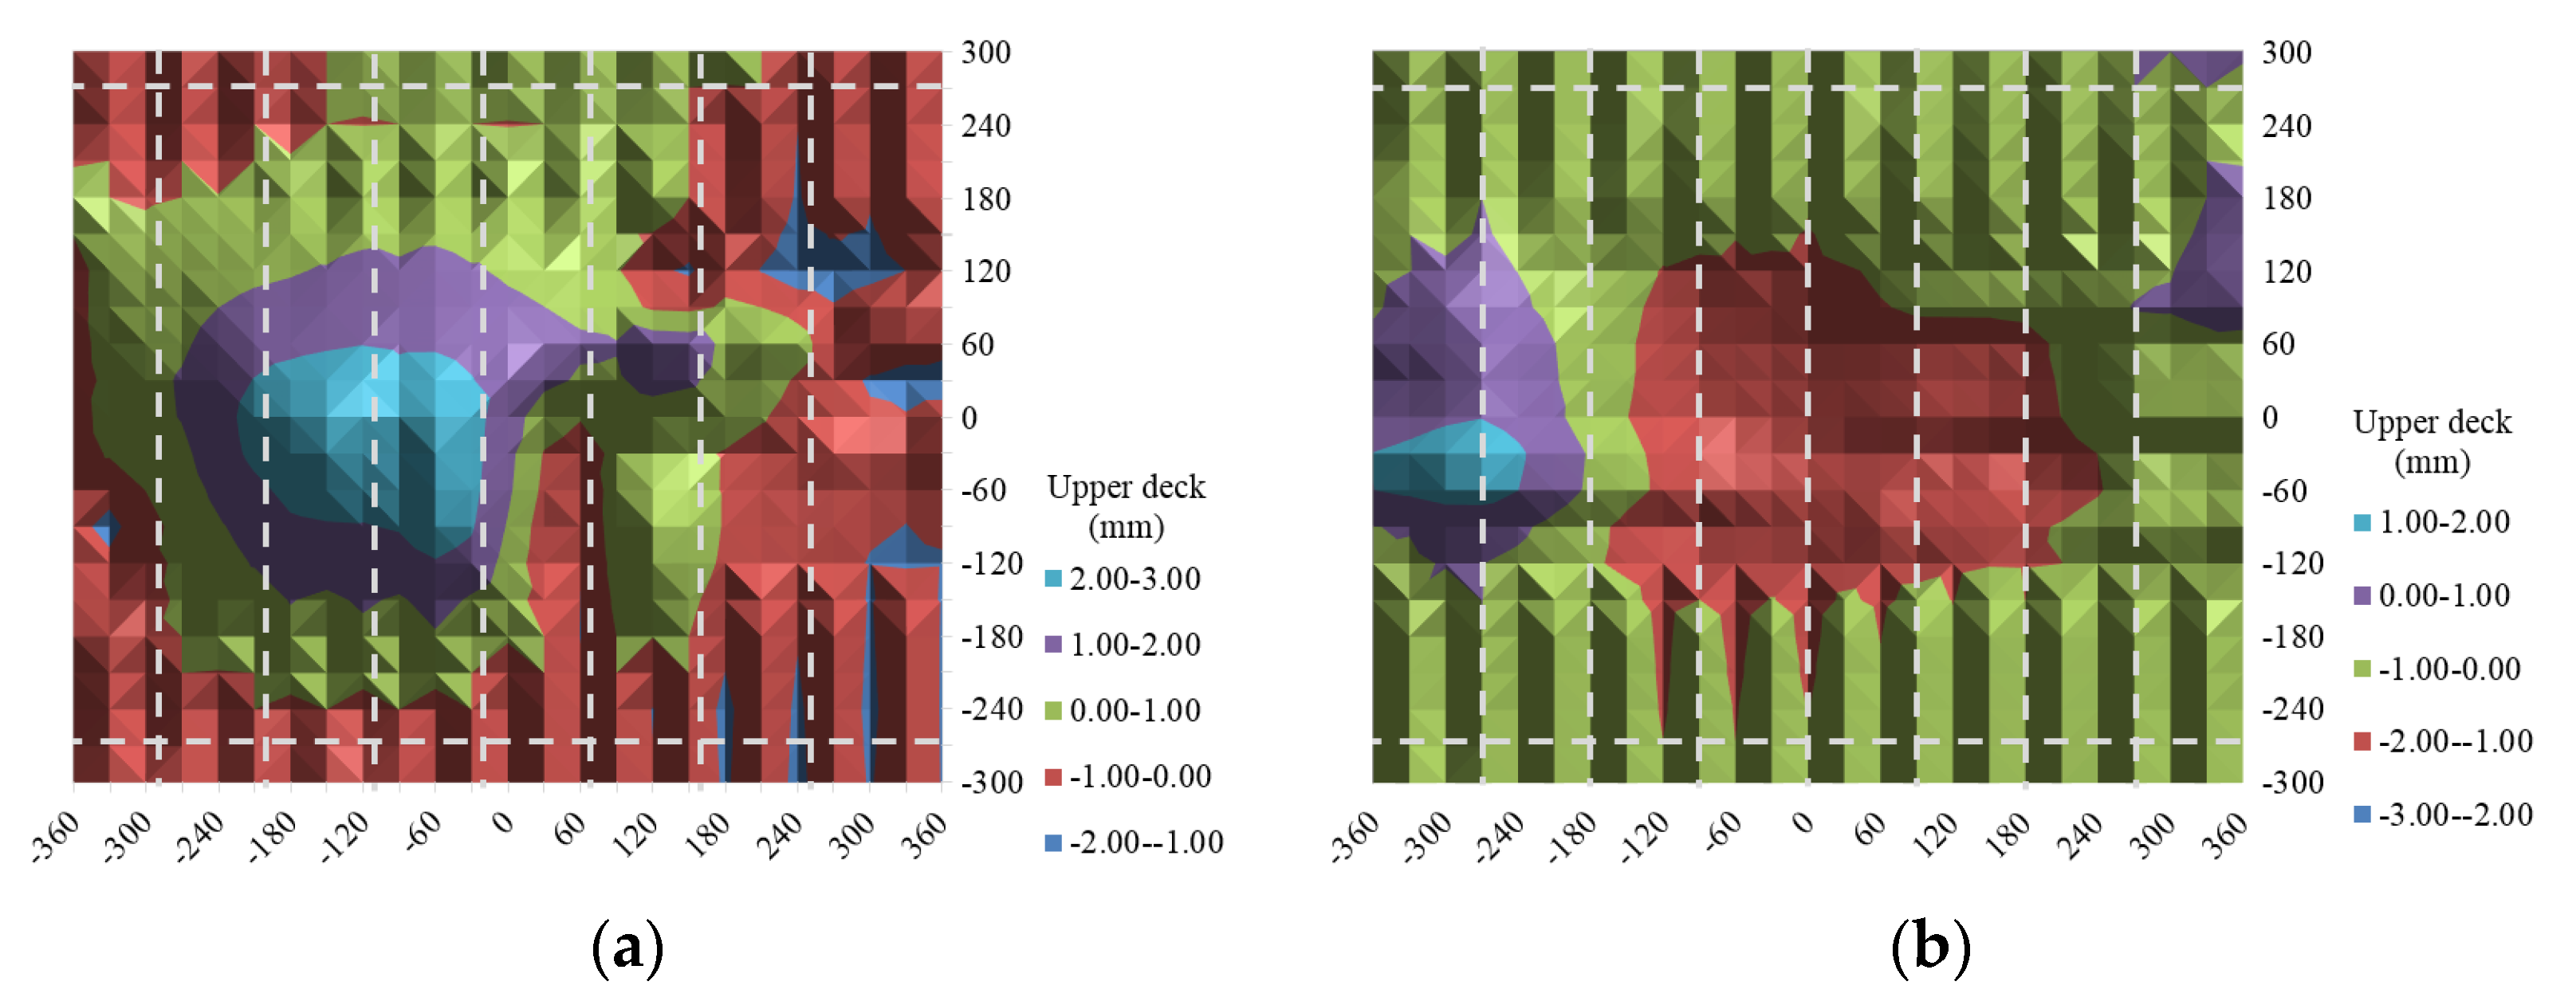
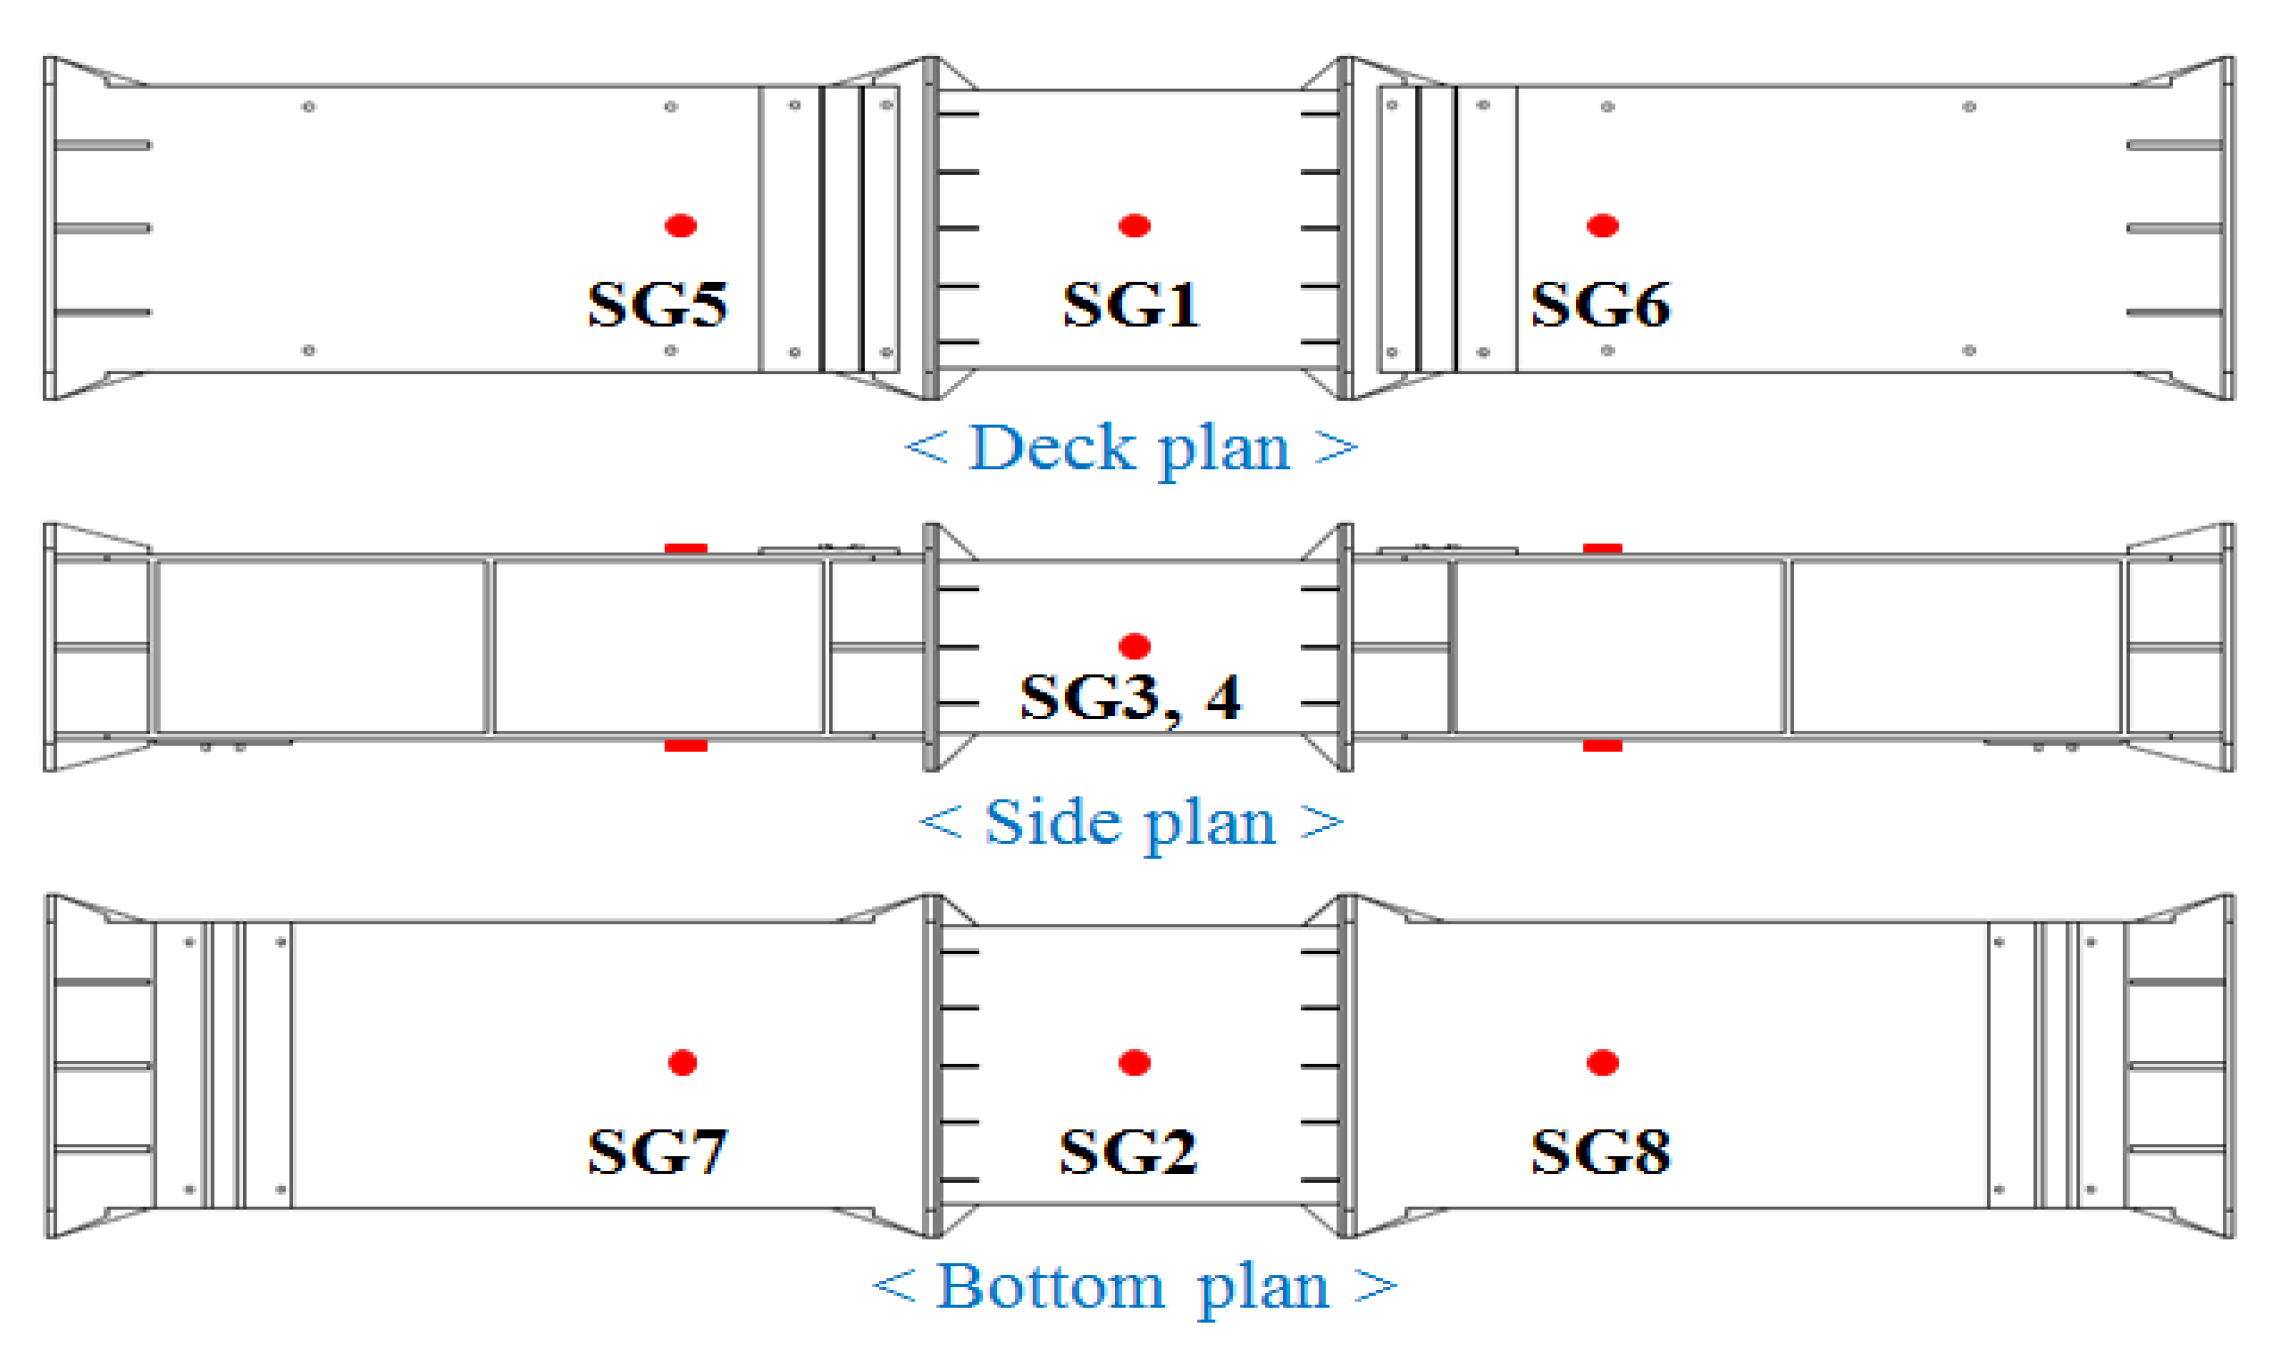
2.3. The Initial Shape-Imperfection Measurement
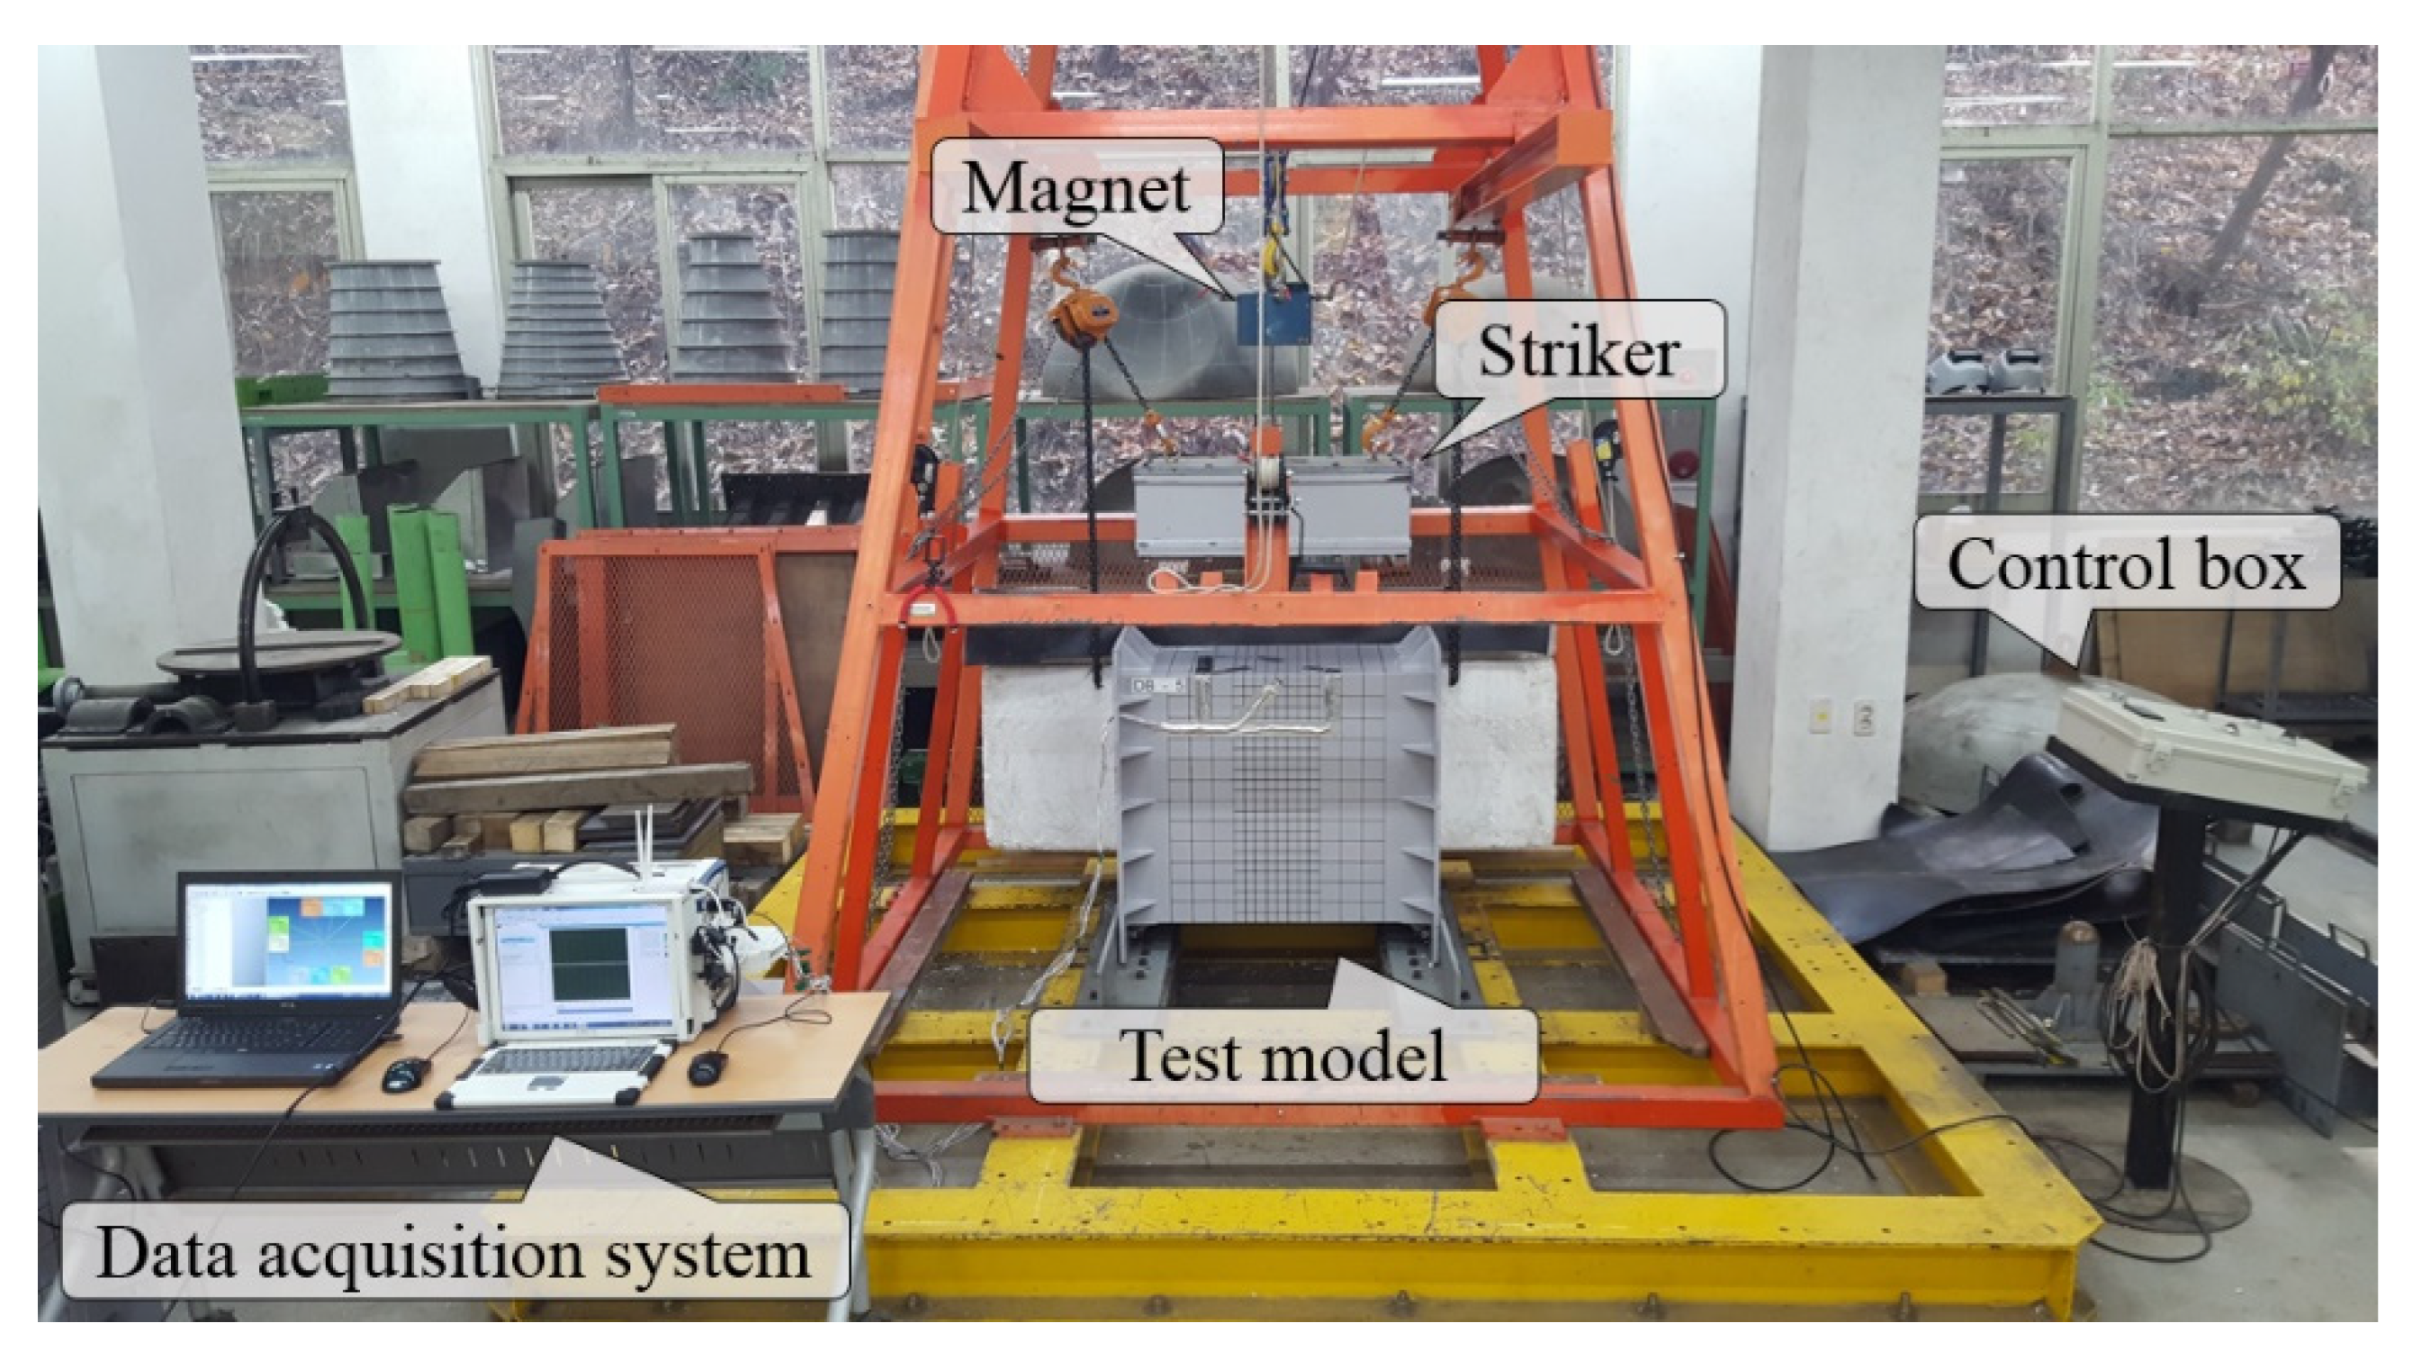
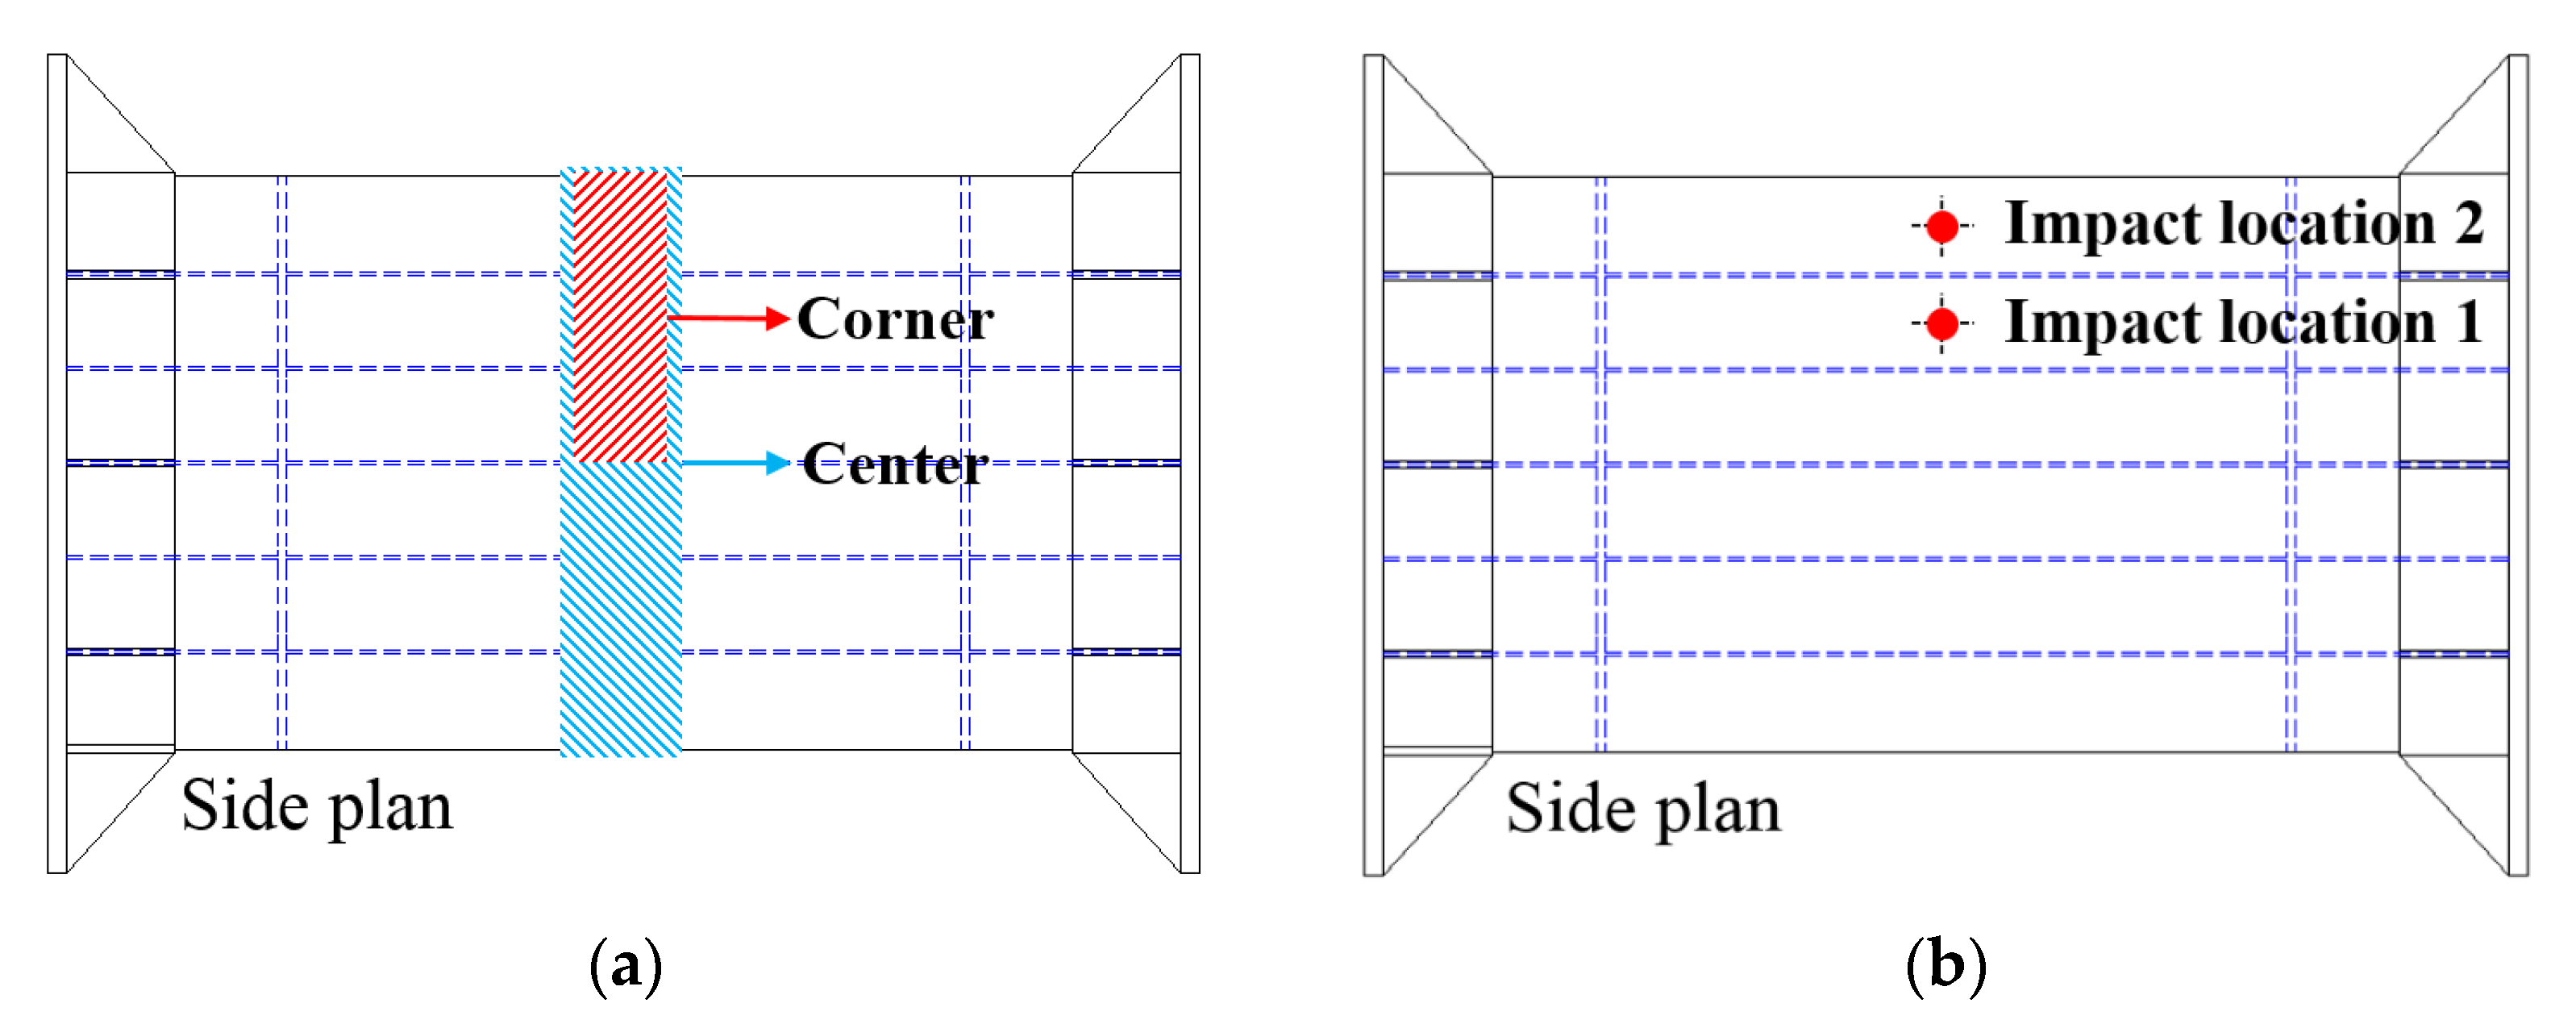
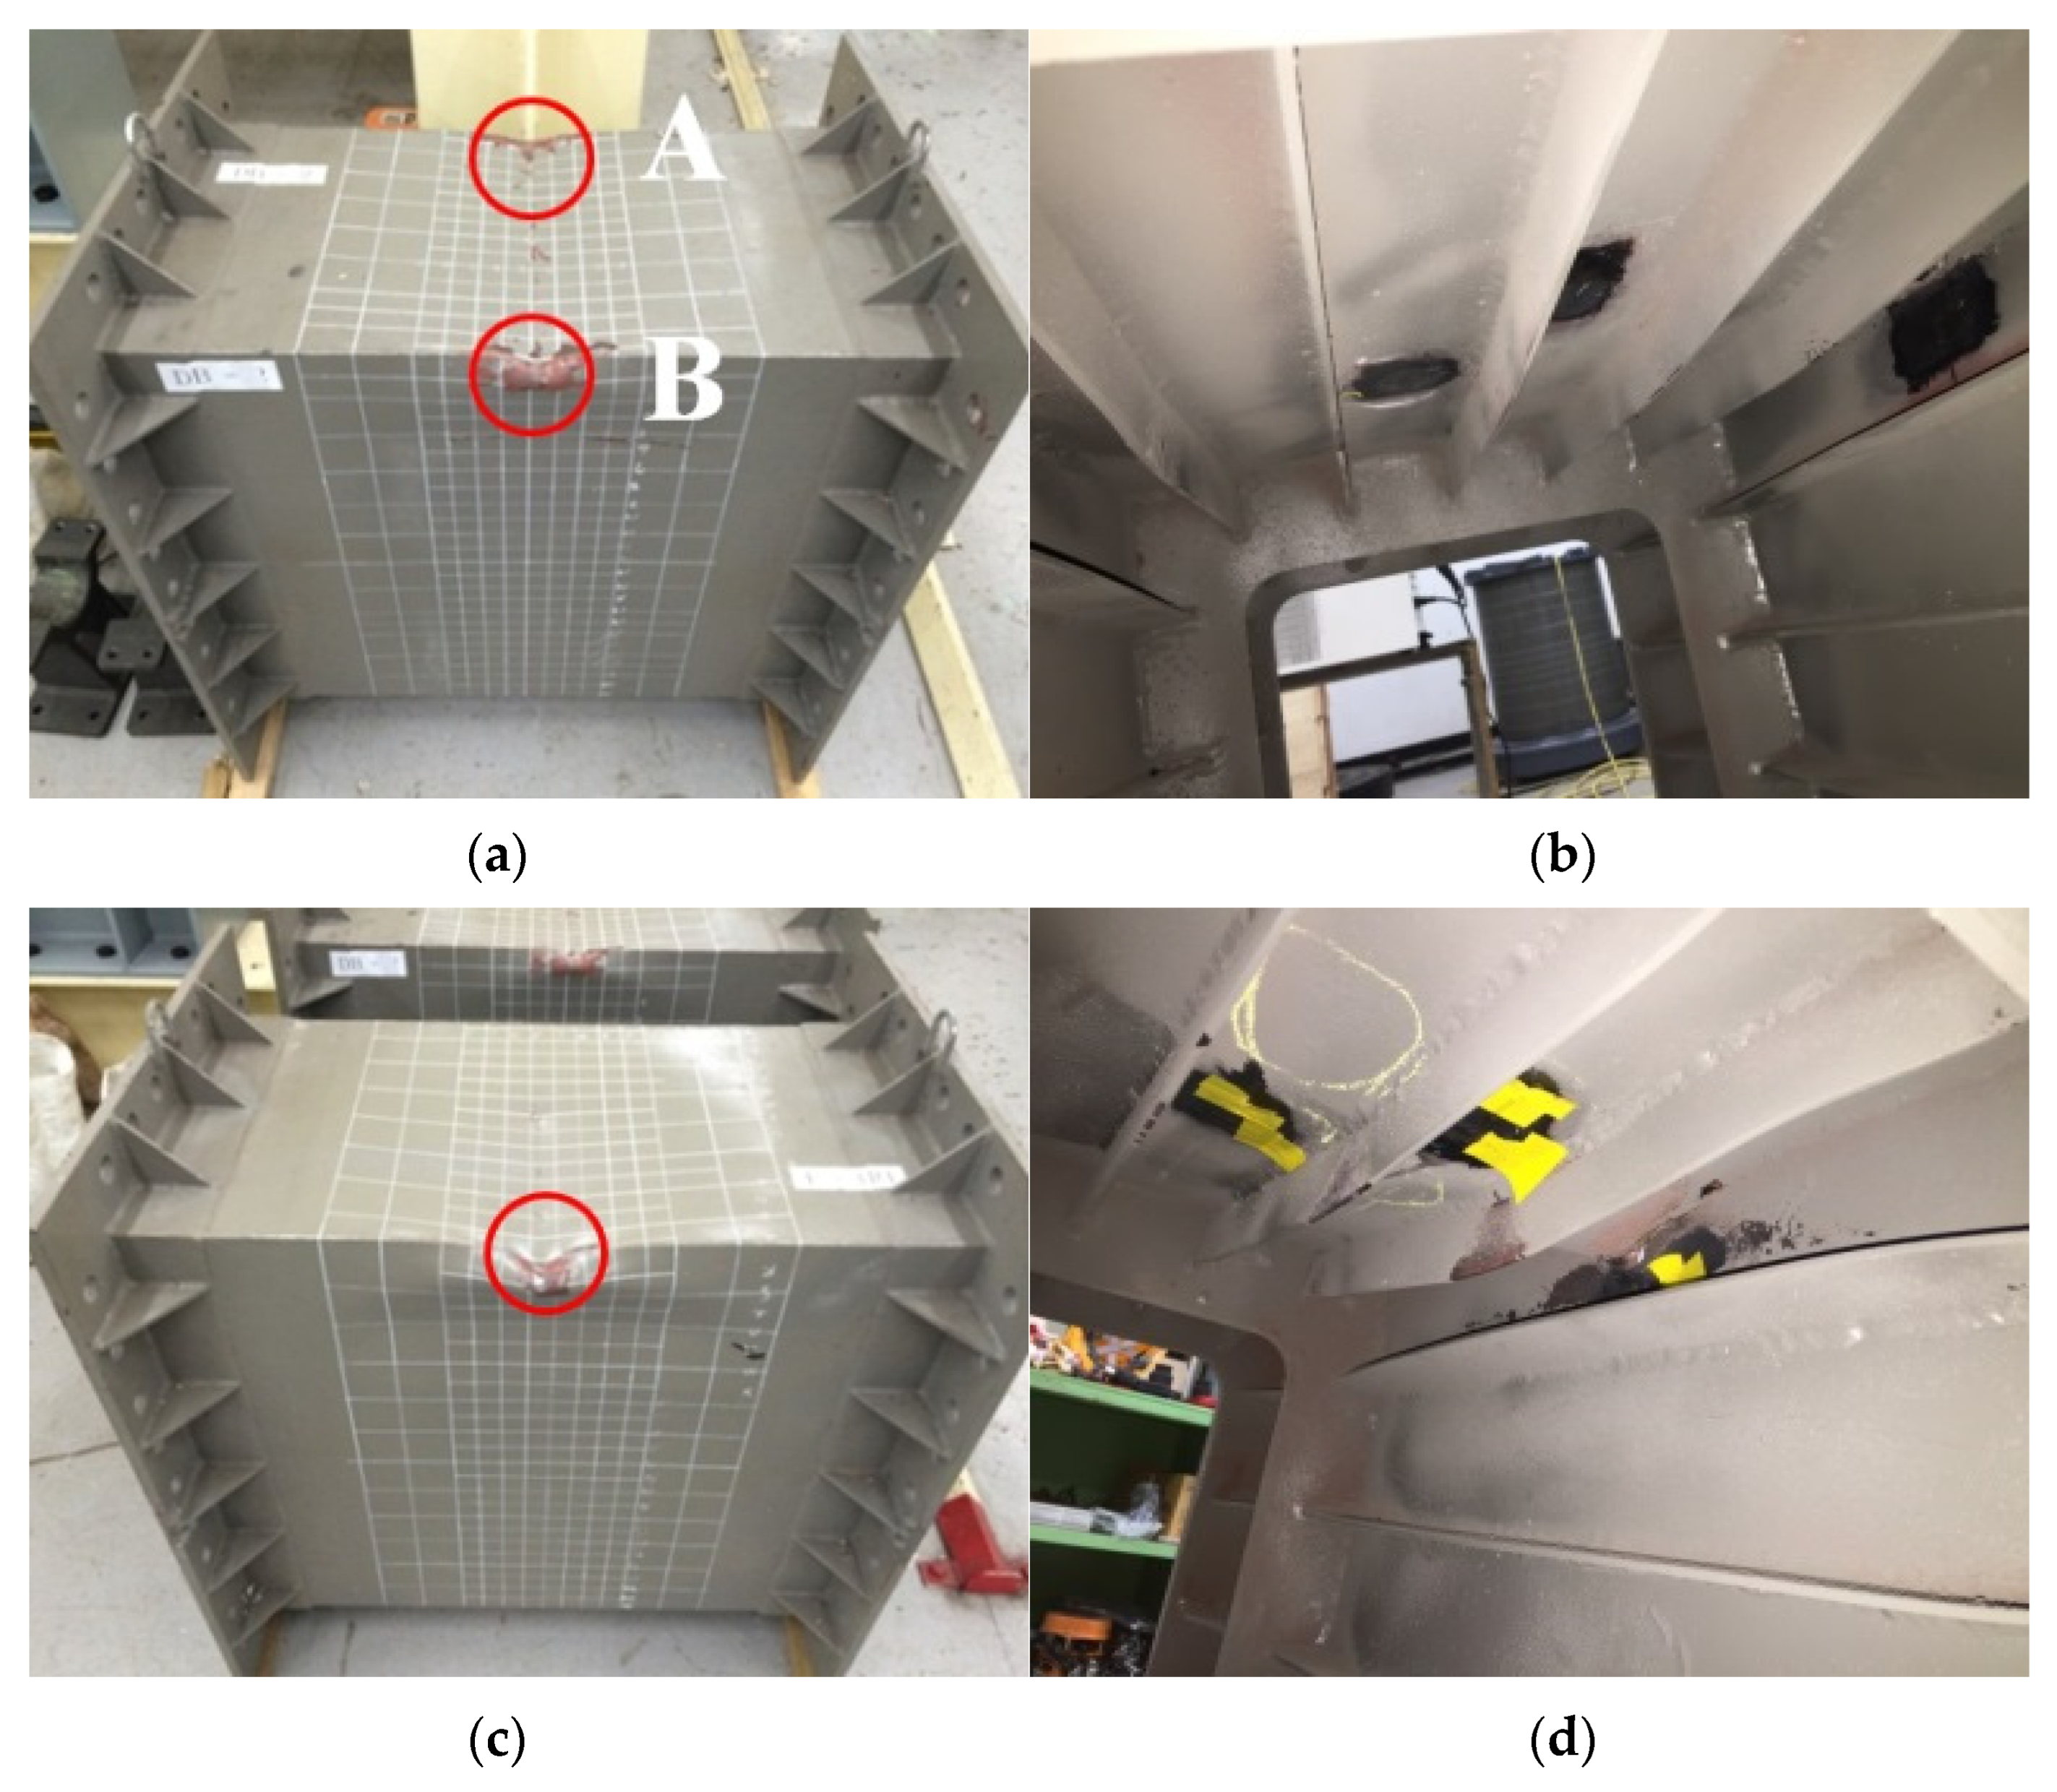
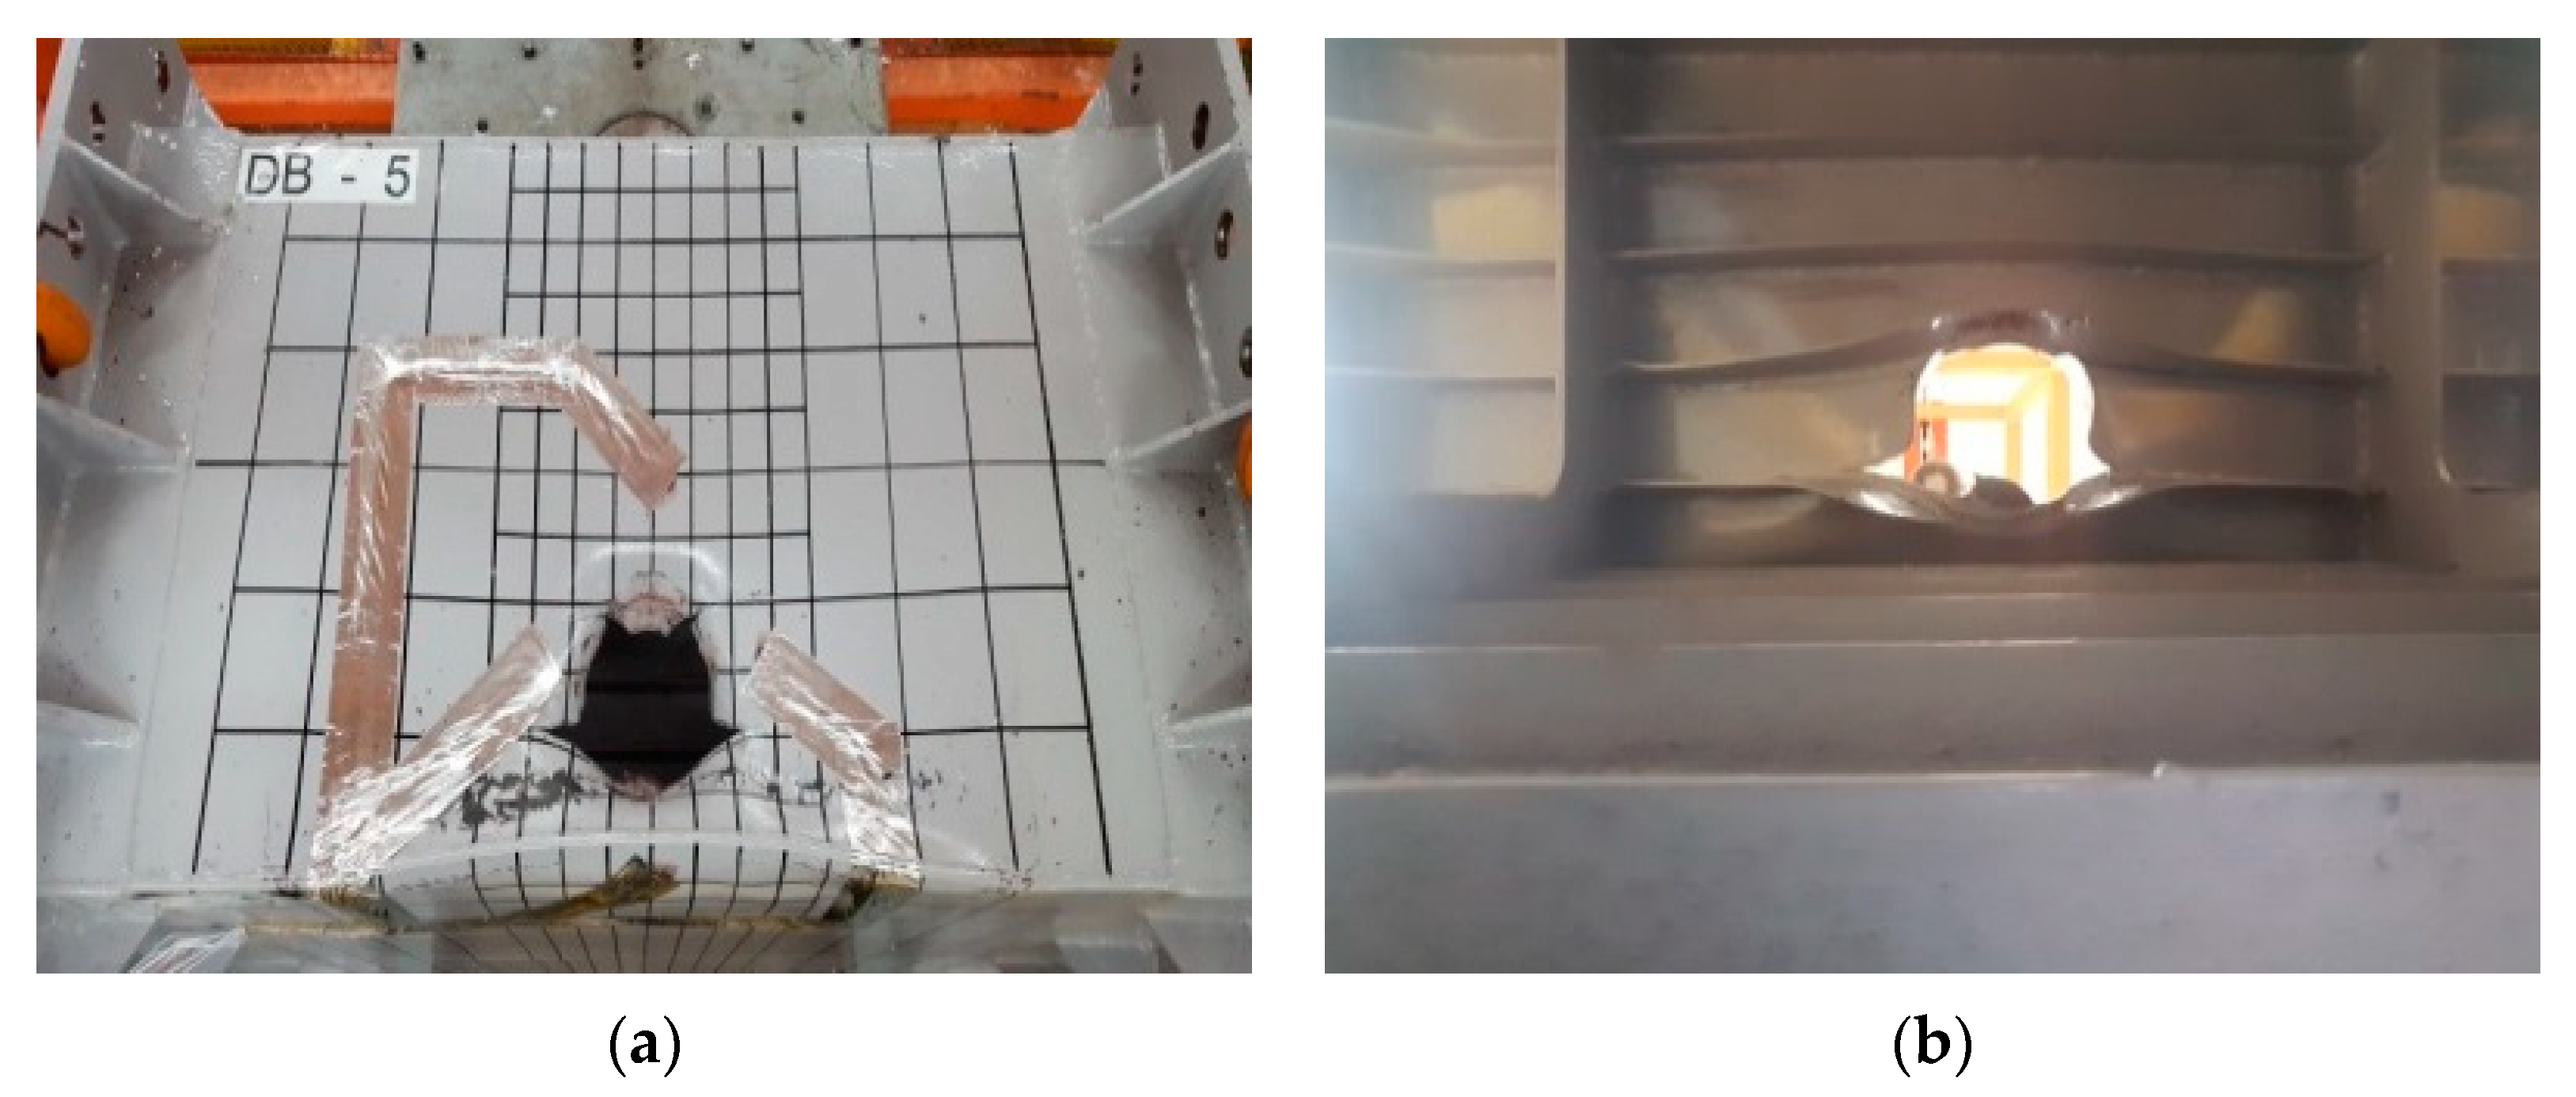
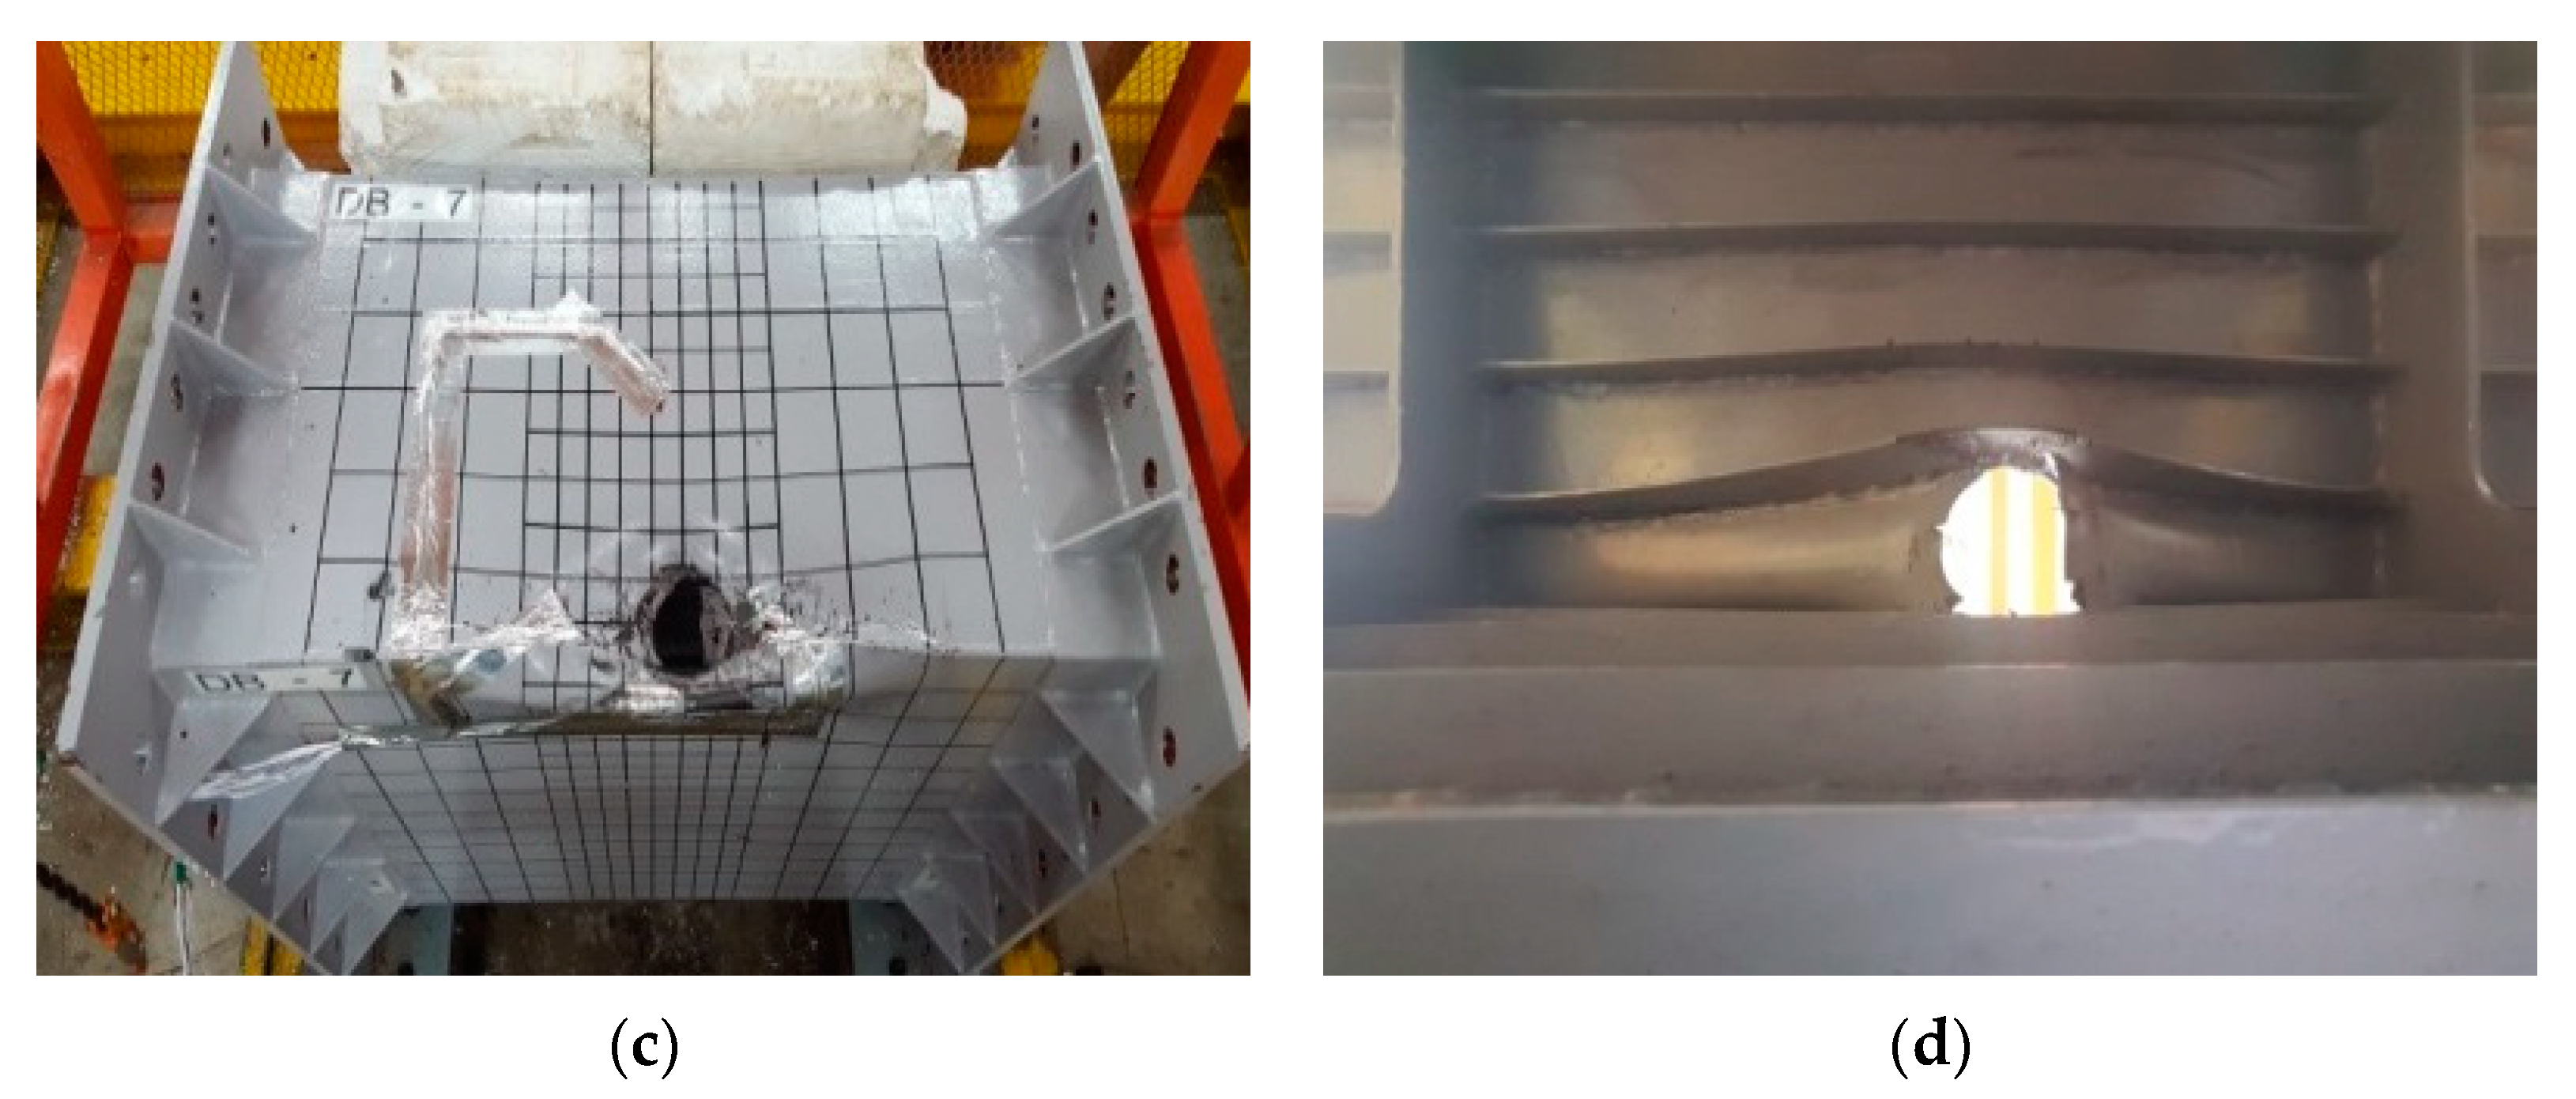
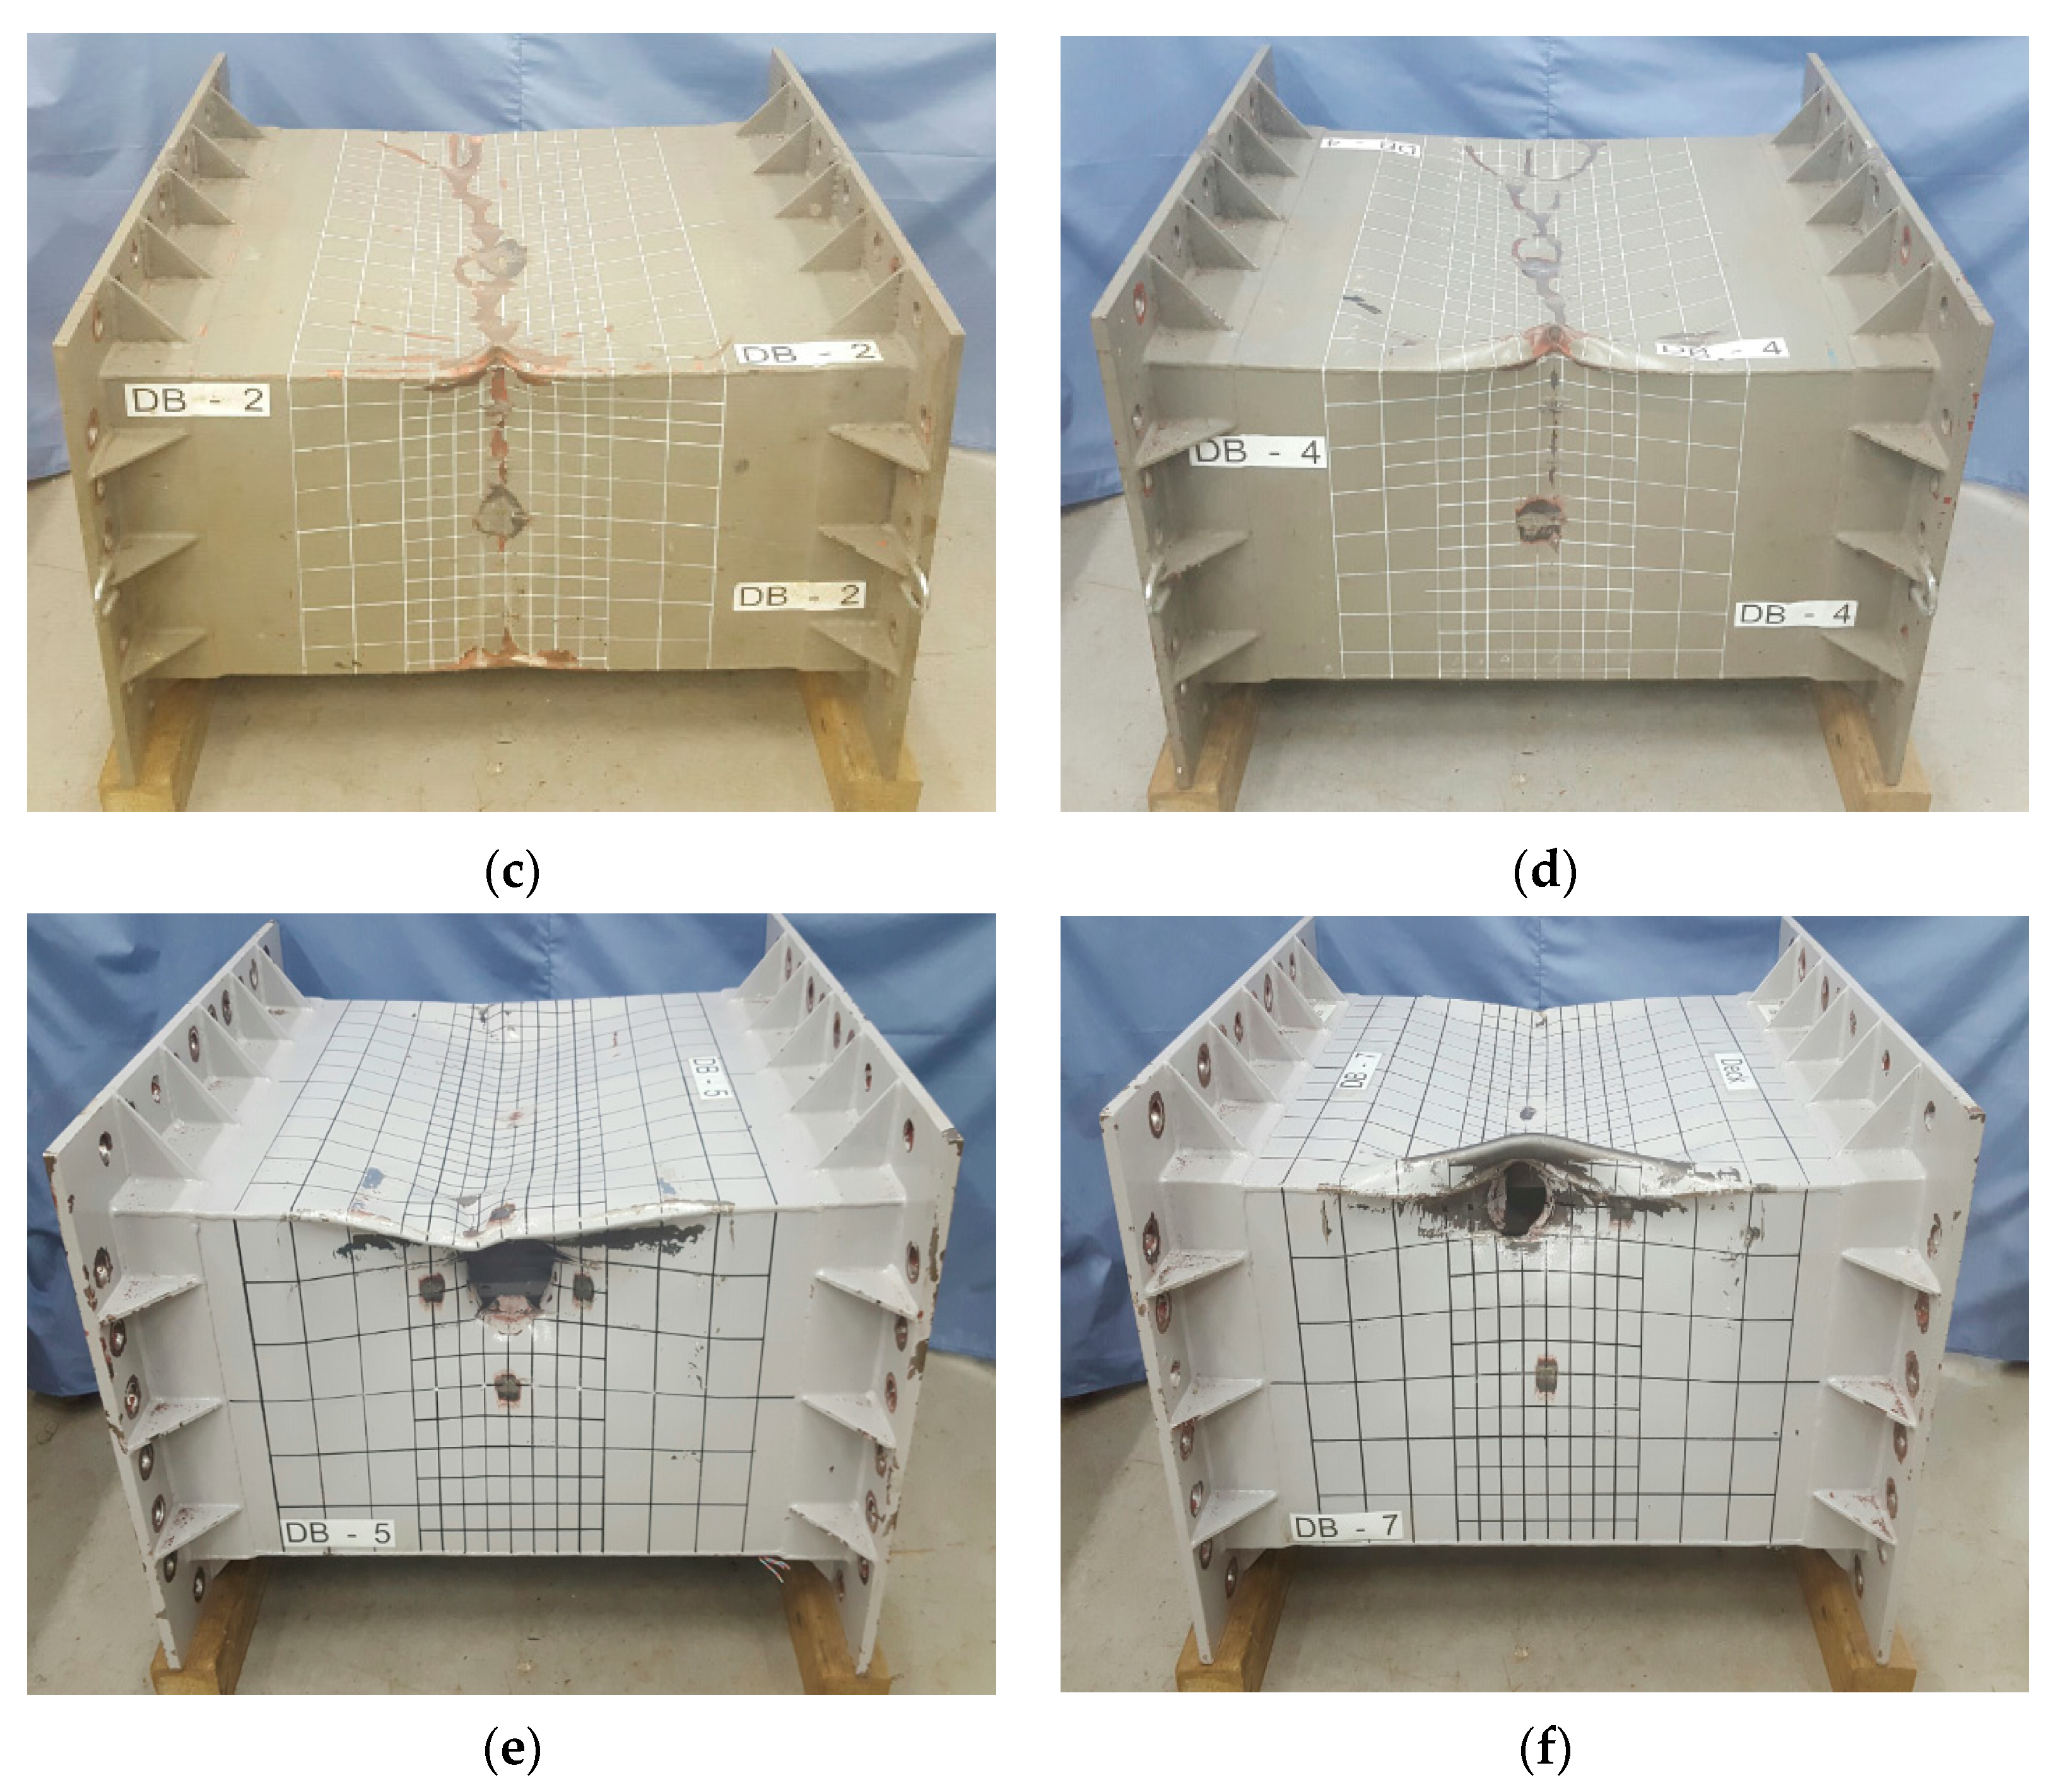
The initial shape imperfections of the fabricated models were measured using a portable measuring arm (Cimcore romer arm), as shown in Figure 2. The error bound of the measured coordinate using the Cimcore romer arm is ±0.075 mm. The grid was plotted to measuring the initial shape imperfection. The size of the grid was 30 × 30 mm in the impact region and 6060 mm in other regions. The measurement results are presented in Table 2. At the surface of the experimental model, the downward direction was assumed to be positive, and the upward direction was assumed to be negative. The results indicated that all ten models had initial imperfections of 1–3 mm. According to the measurement results, a surface chart was made to indicate the initial deformation shape, as shown in Figure 3.

3. Collision Tests

The objective of the collision tests was to generate the denting and fracture damages for the subsequent collapse tests. The damage was induced by using a drop-testing machine, as shown in Figure 4. The test model was moved to a desired position using a chain block. The lower part of the end plates was fixed to the support fixtures clamped to the frame. There was a pulley at the top of the frame tower that guided and held an electromagnet attached to the striker. The drop height of the striker could be varied to achieve the desired impact energy. Once the electromagnetic force was cut off, the striking mass fell and accelerated due to gravity. The tests were divided into two types depending on the damage: denting damage and fracture damage.
To investigate the denting damage due to collision, an experiment involving a knife edge striker was performed. The striker had a mass of 400 kg, and its dimensions are shown in Figure 5. The width of the knife edge was 500 mm, covering the whole model height. The test conditions and results are presented in Table 3. The impact positions for models DB-1 and DB-2 were located at the center, whereas those for models DB-3 and DB-4 were located at the corner (see Figure 6). The drop height of models DB-1 and DB-3 was 1.2 m, whereas that of models DB-2 and DB-4 was 1.6 m. The extent of the damage was measured using the same machine that was employed for the initial shape-imperfection measurement. The permanent deflections of the gunwale and bilge were different, indicating an uneven striker contact. The deformed shapes of the denting-damaged models are shown in Figure 7. The damaged shape of a centrally collided model was observed, with a dent in the side plate and bending in the side stiffeners. The damage evidently extended into the deck and bottom structures. For the case of an impact at the corner, the side longitudinal stiffener next to the gunwale was severely damaged by bending. The deck longitudinal stiffener next to the gunwale was also severely damaged by bending.
To generate fracture damage, the experiments were performed with a conical header having a hemispherical tip. The striker had a mass of 570 kg, and its dimensions are shown in Figure 5. The test conditions and results are presented in Table 4. The striker for models DB-5 and DB-6 collided at ‘Impact location 1’ and for models DB-7 and DB-8 it collided at ‘Impact location 2’ (Figure 6). The drop height for models DB-5 and DB-7 was 1.9 m and for models DB-6 and DB-8 it was 1.6 m. The diagonal length of the fracture was measured. The deformed shapes of the fracture-damaged models are shown in Figure 8. The box girder models were confirmed to have sustained fracture damage with different fracture shapes depending on the impact location and drop height. The fracture shapes of the model were very complicated. In the case of the gunwale, it was confirmed that a large deformation occurred and propagated up to the deck part. Additional details regarding the collision test results are presented in [27,28].

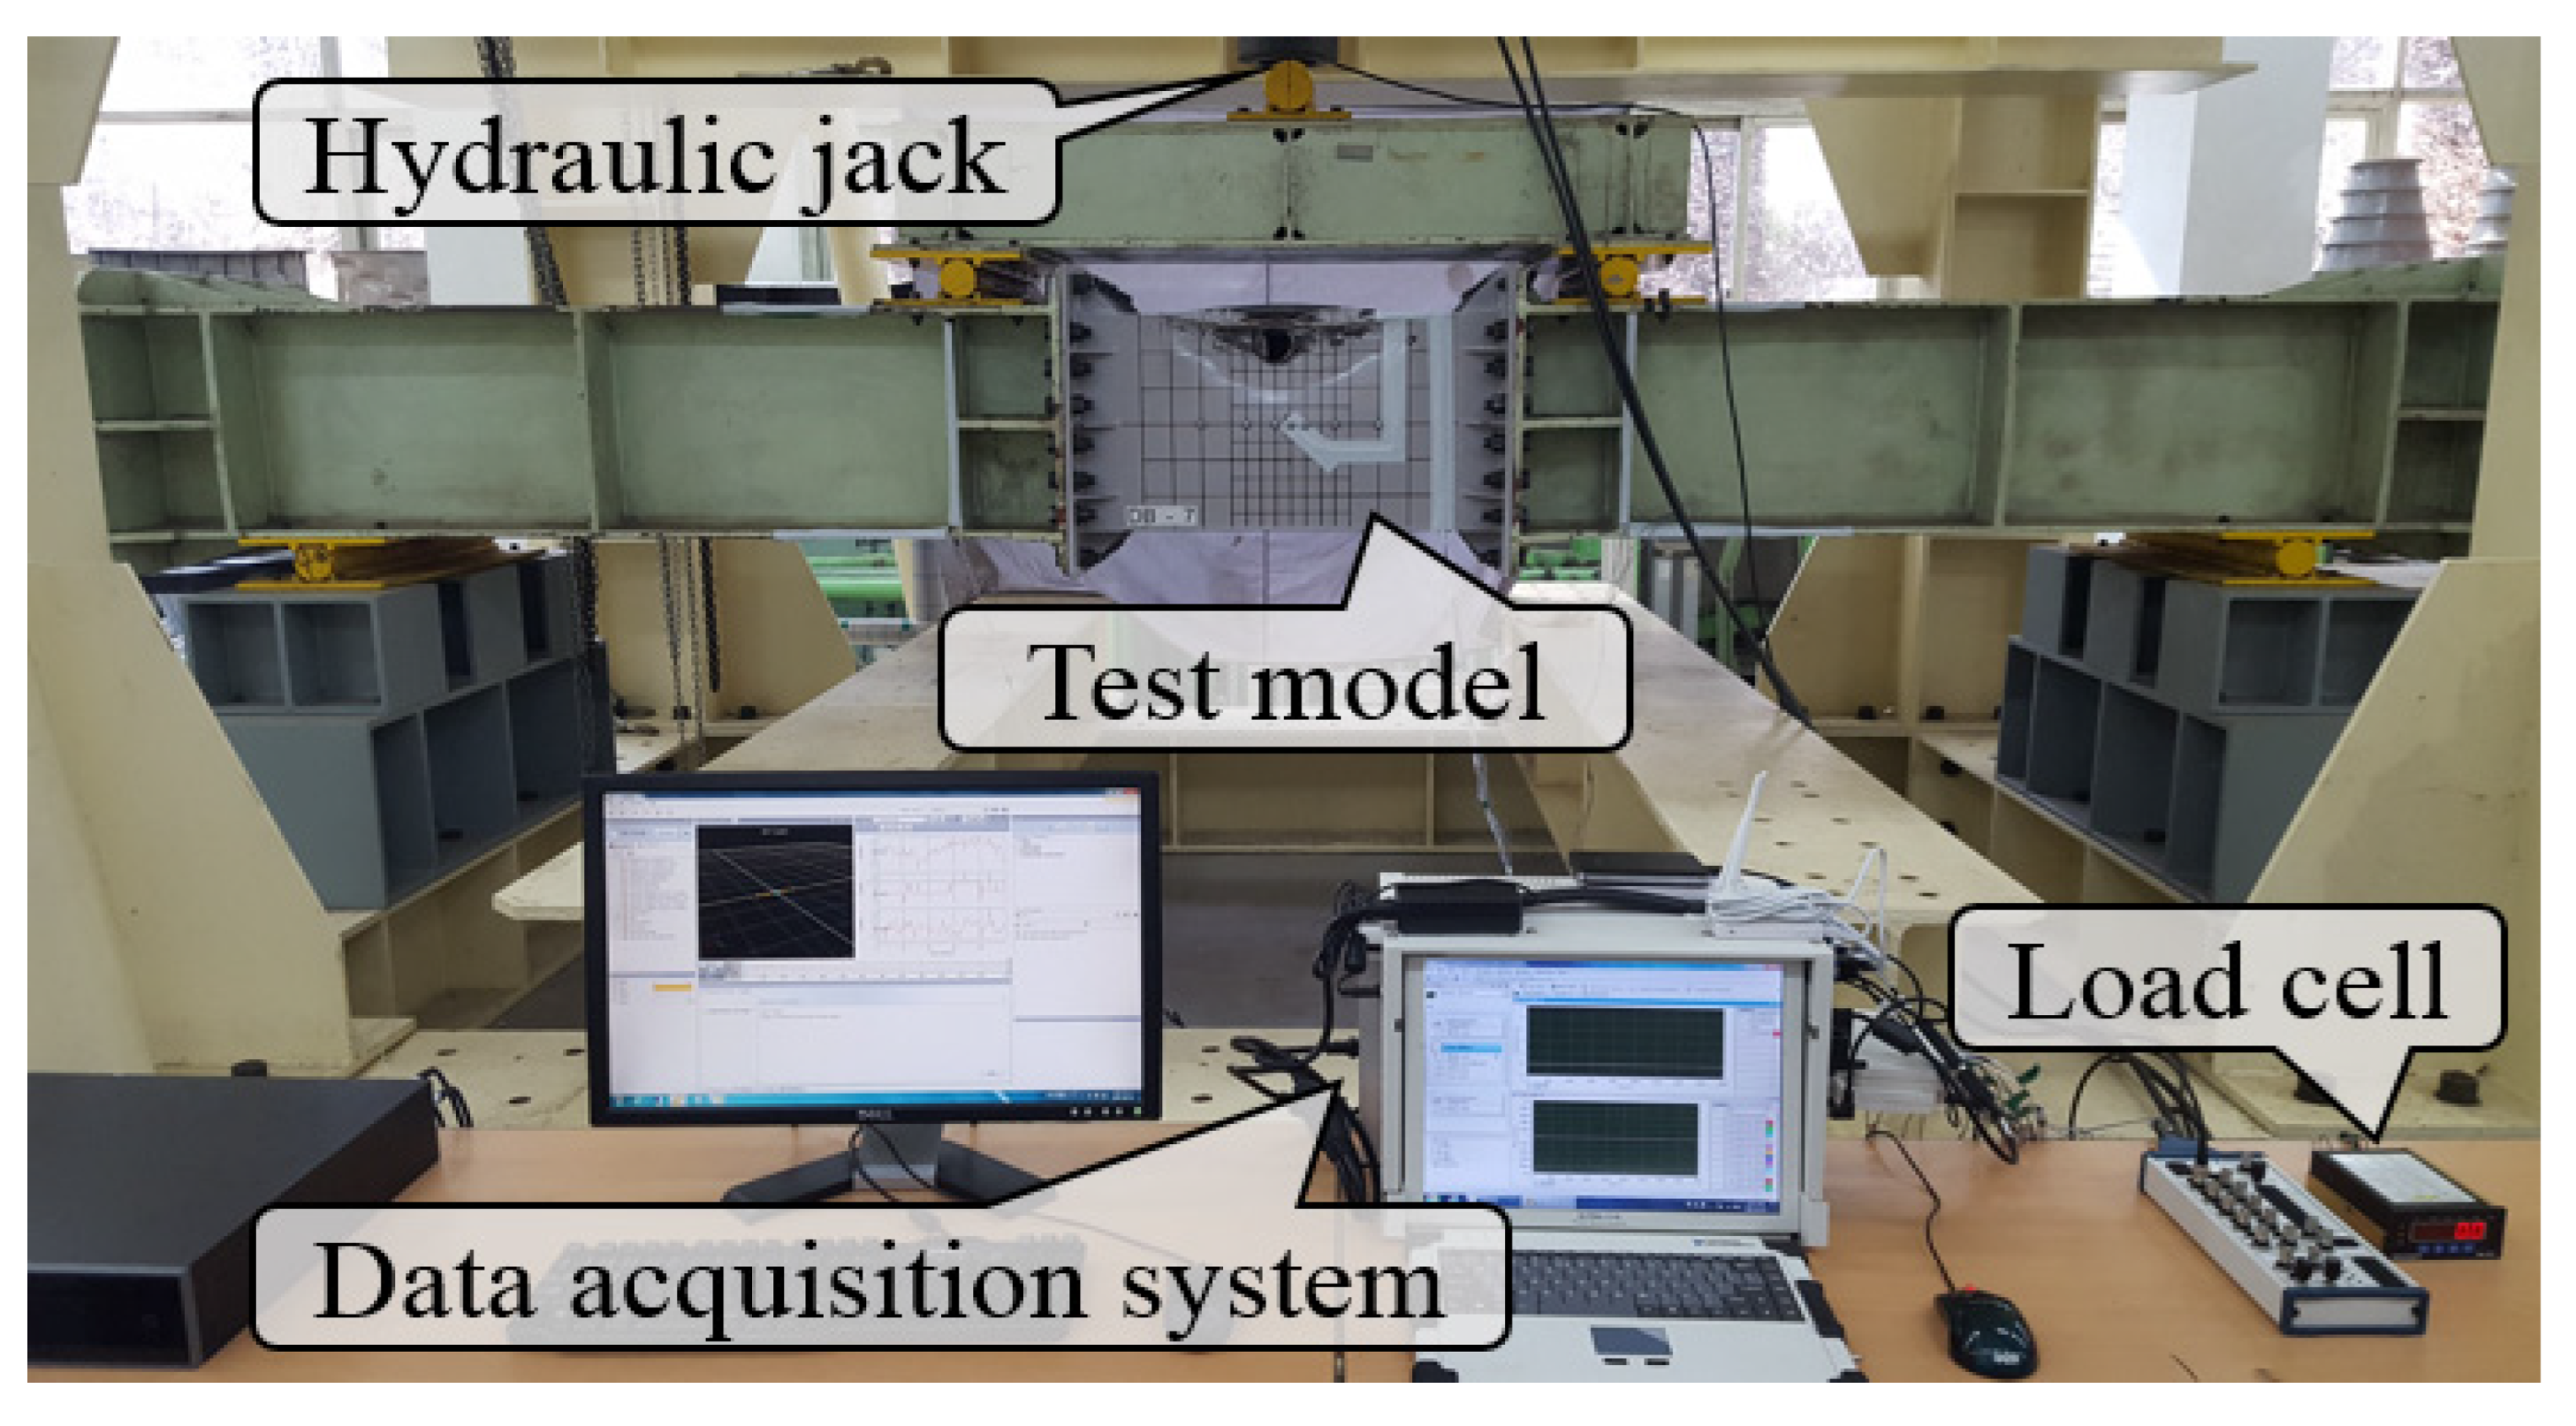
4. Residual Longitudinal Strength Tests

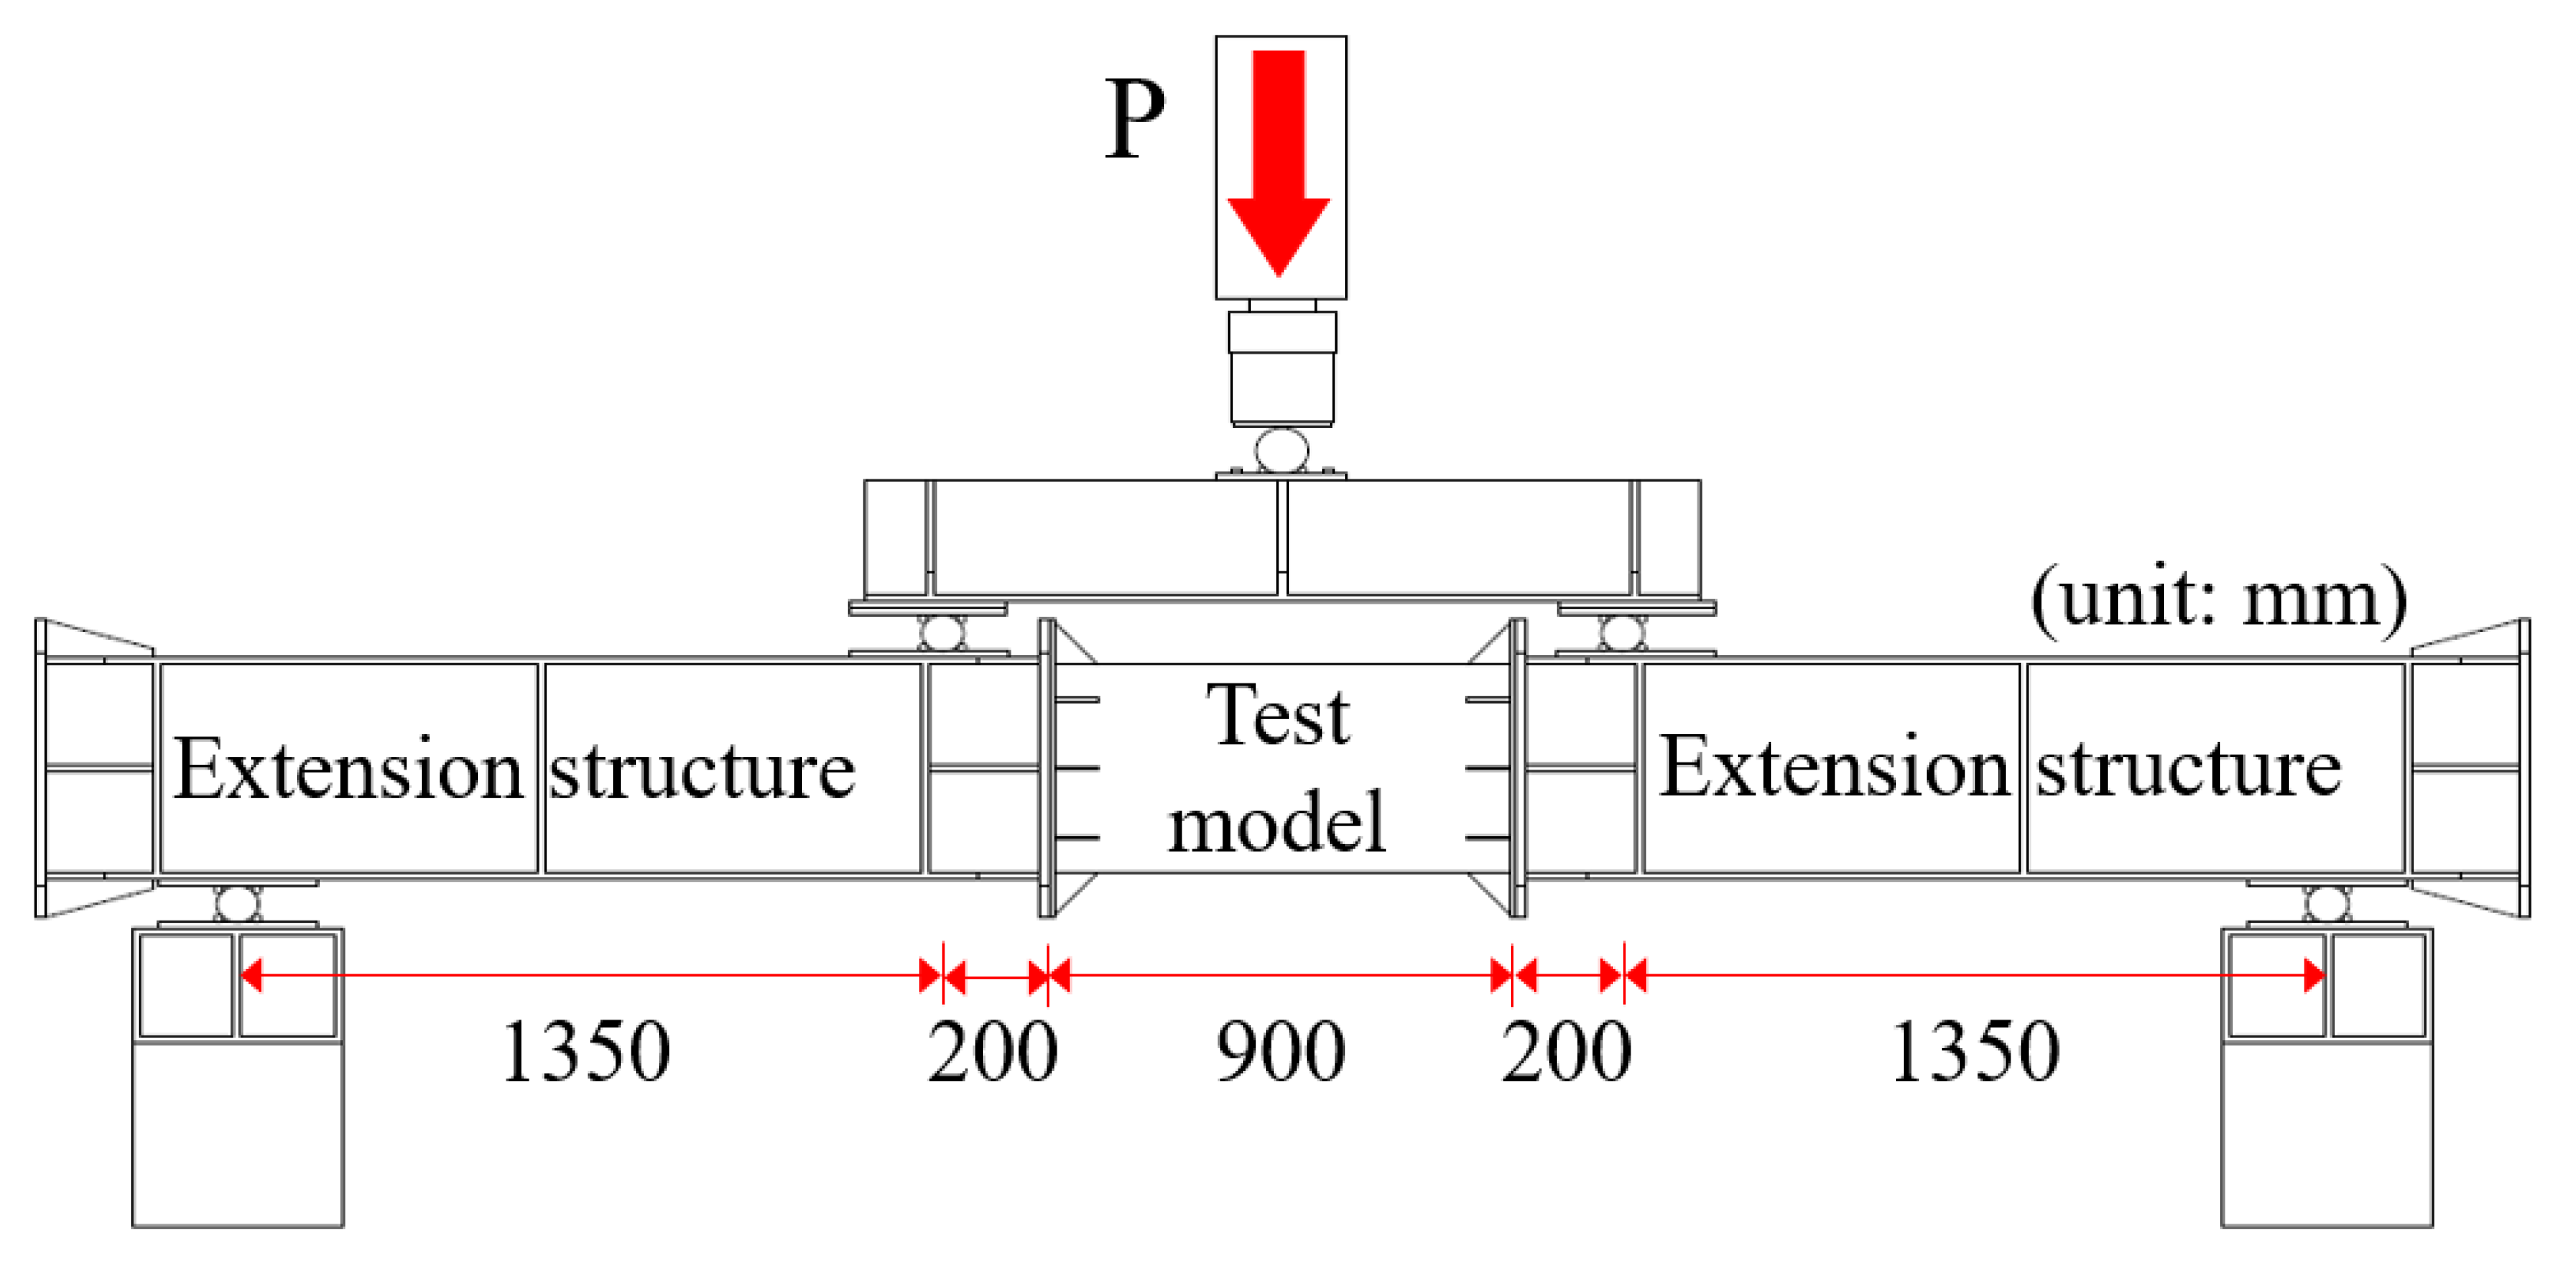
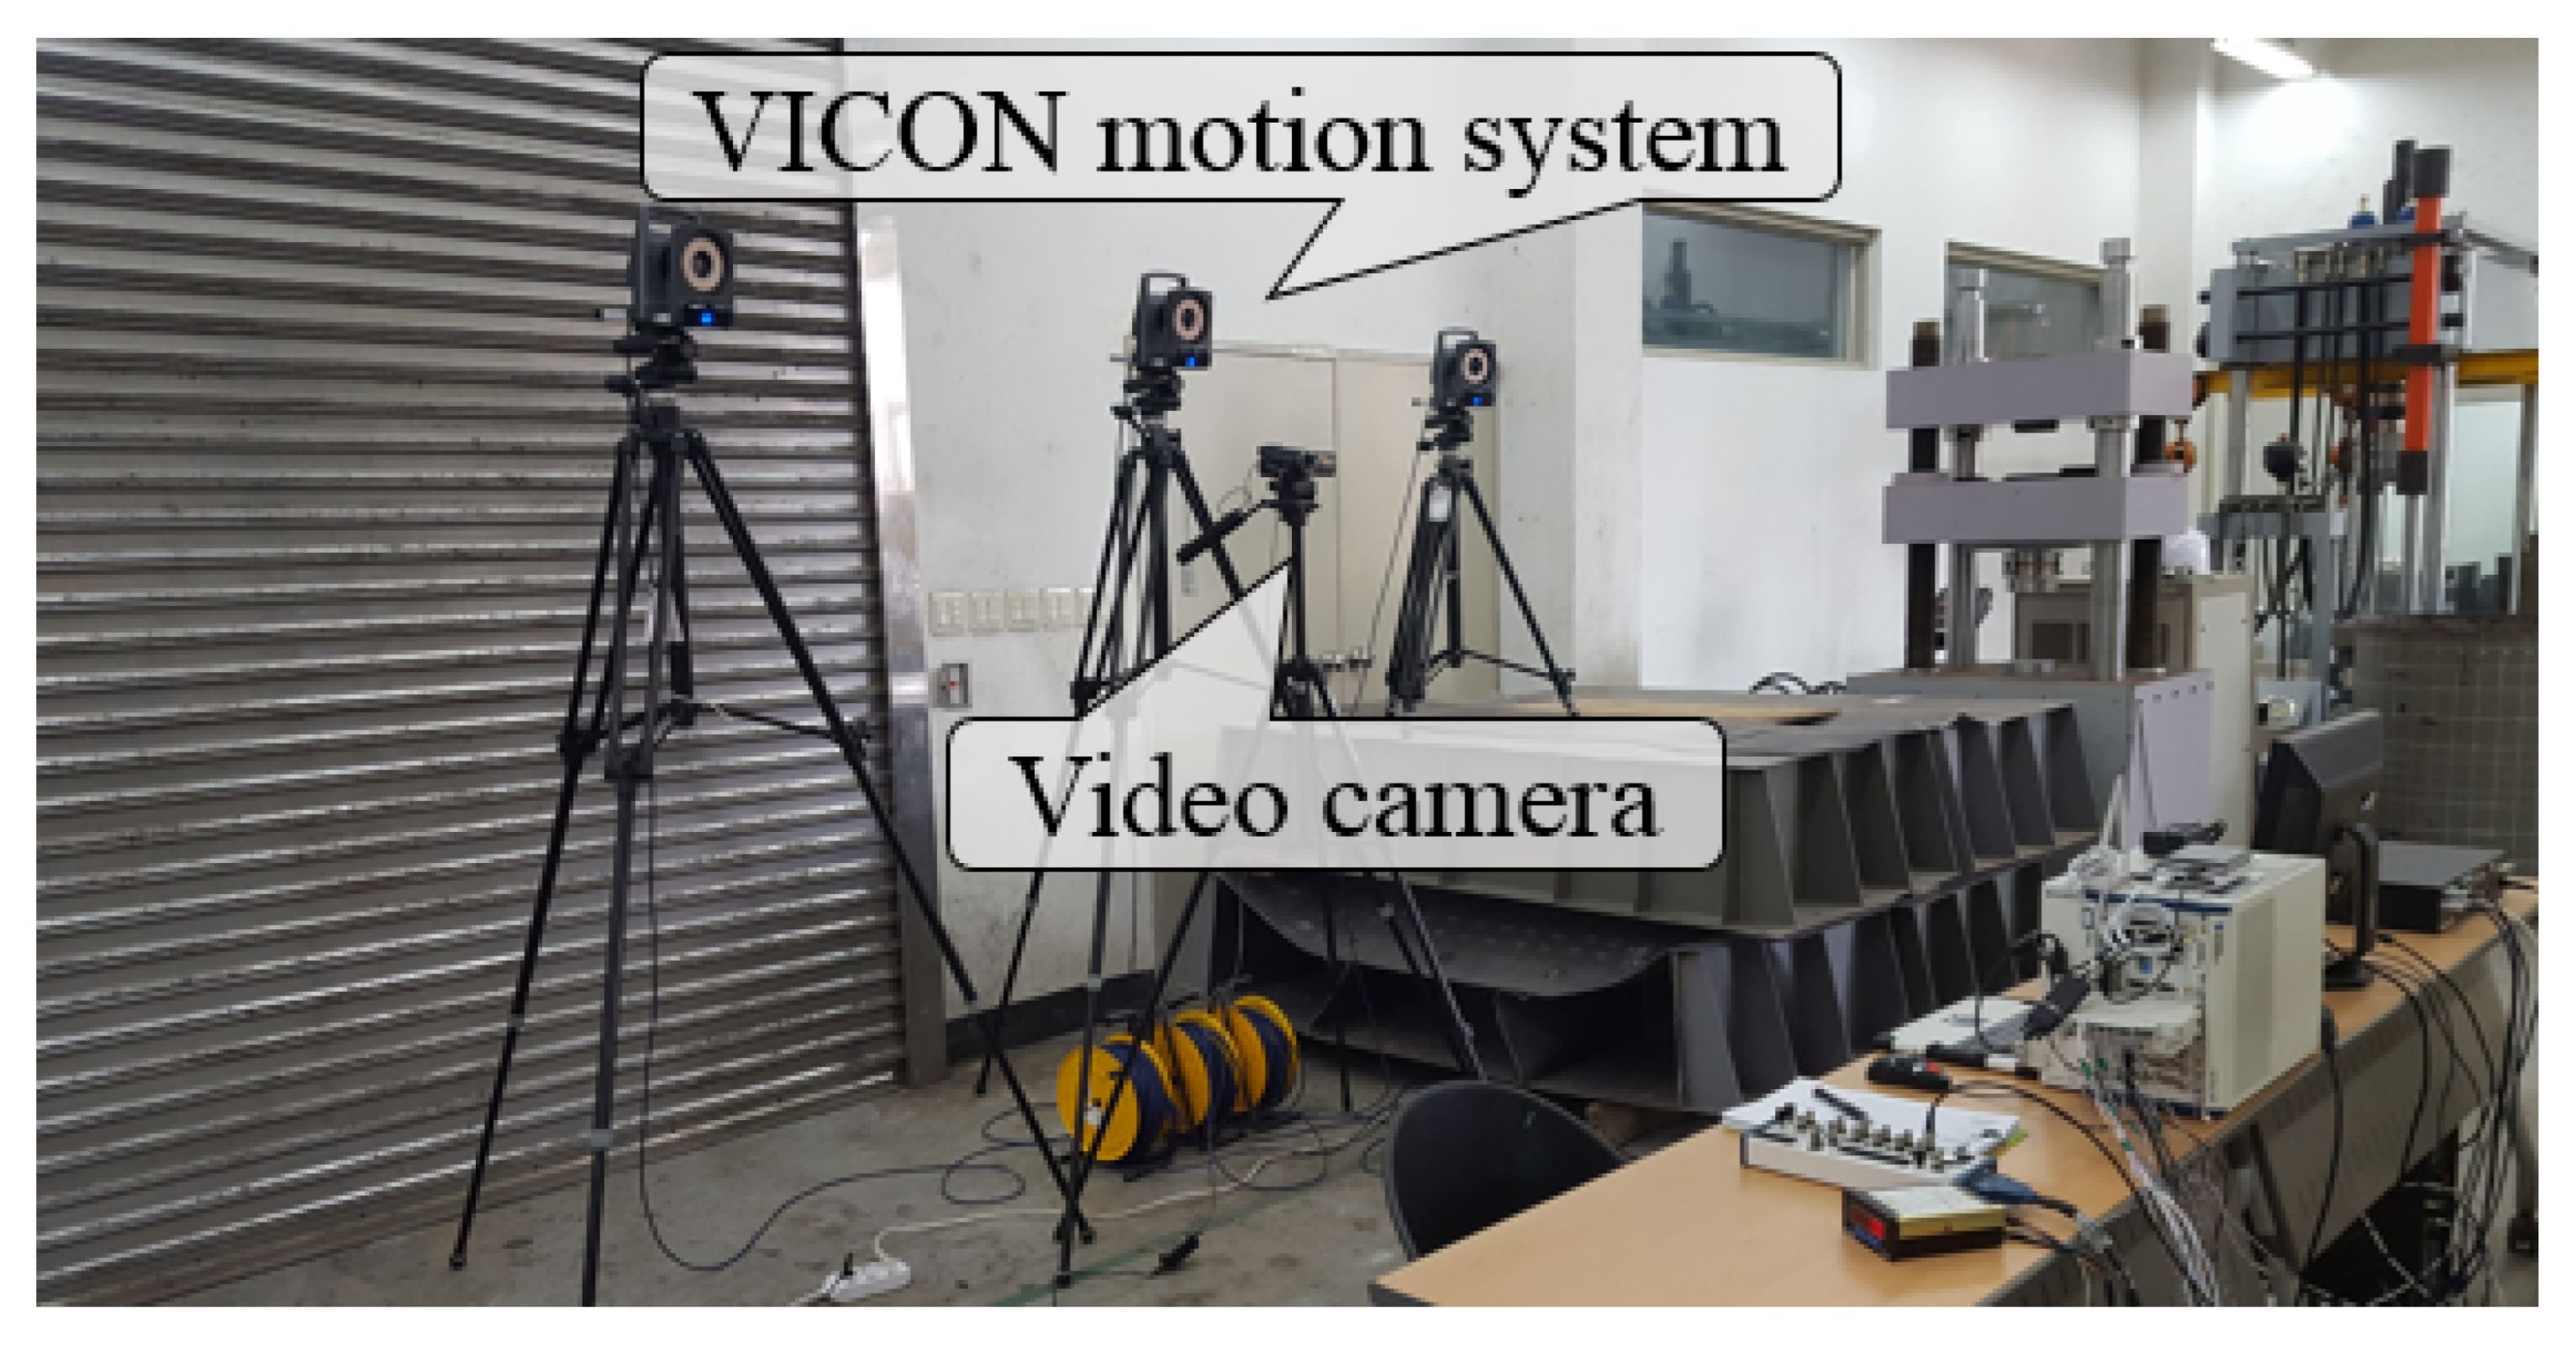
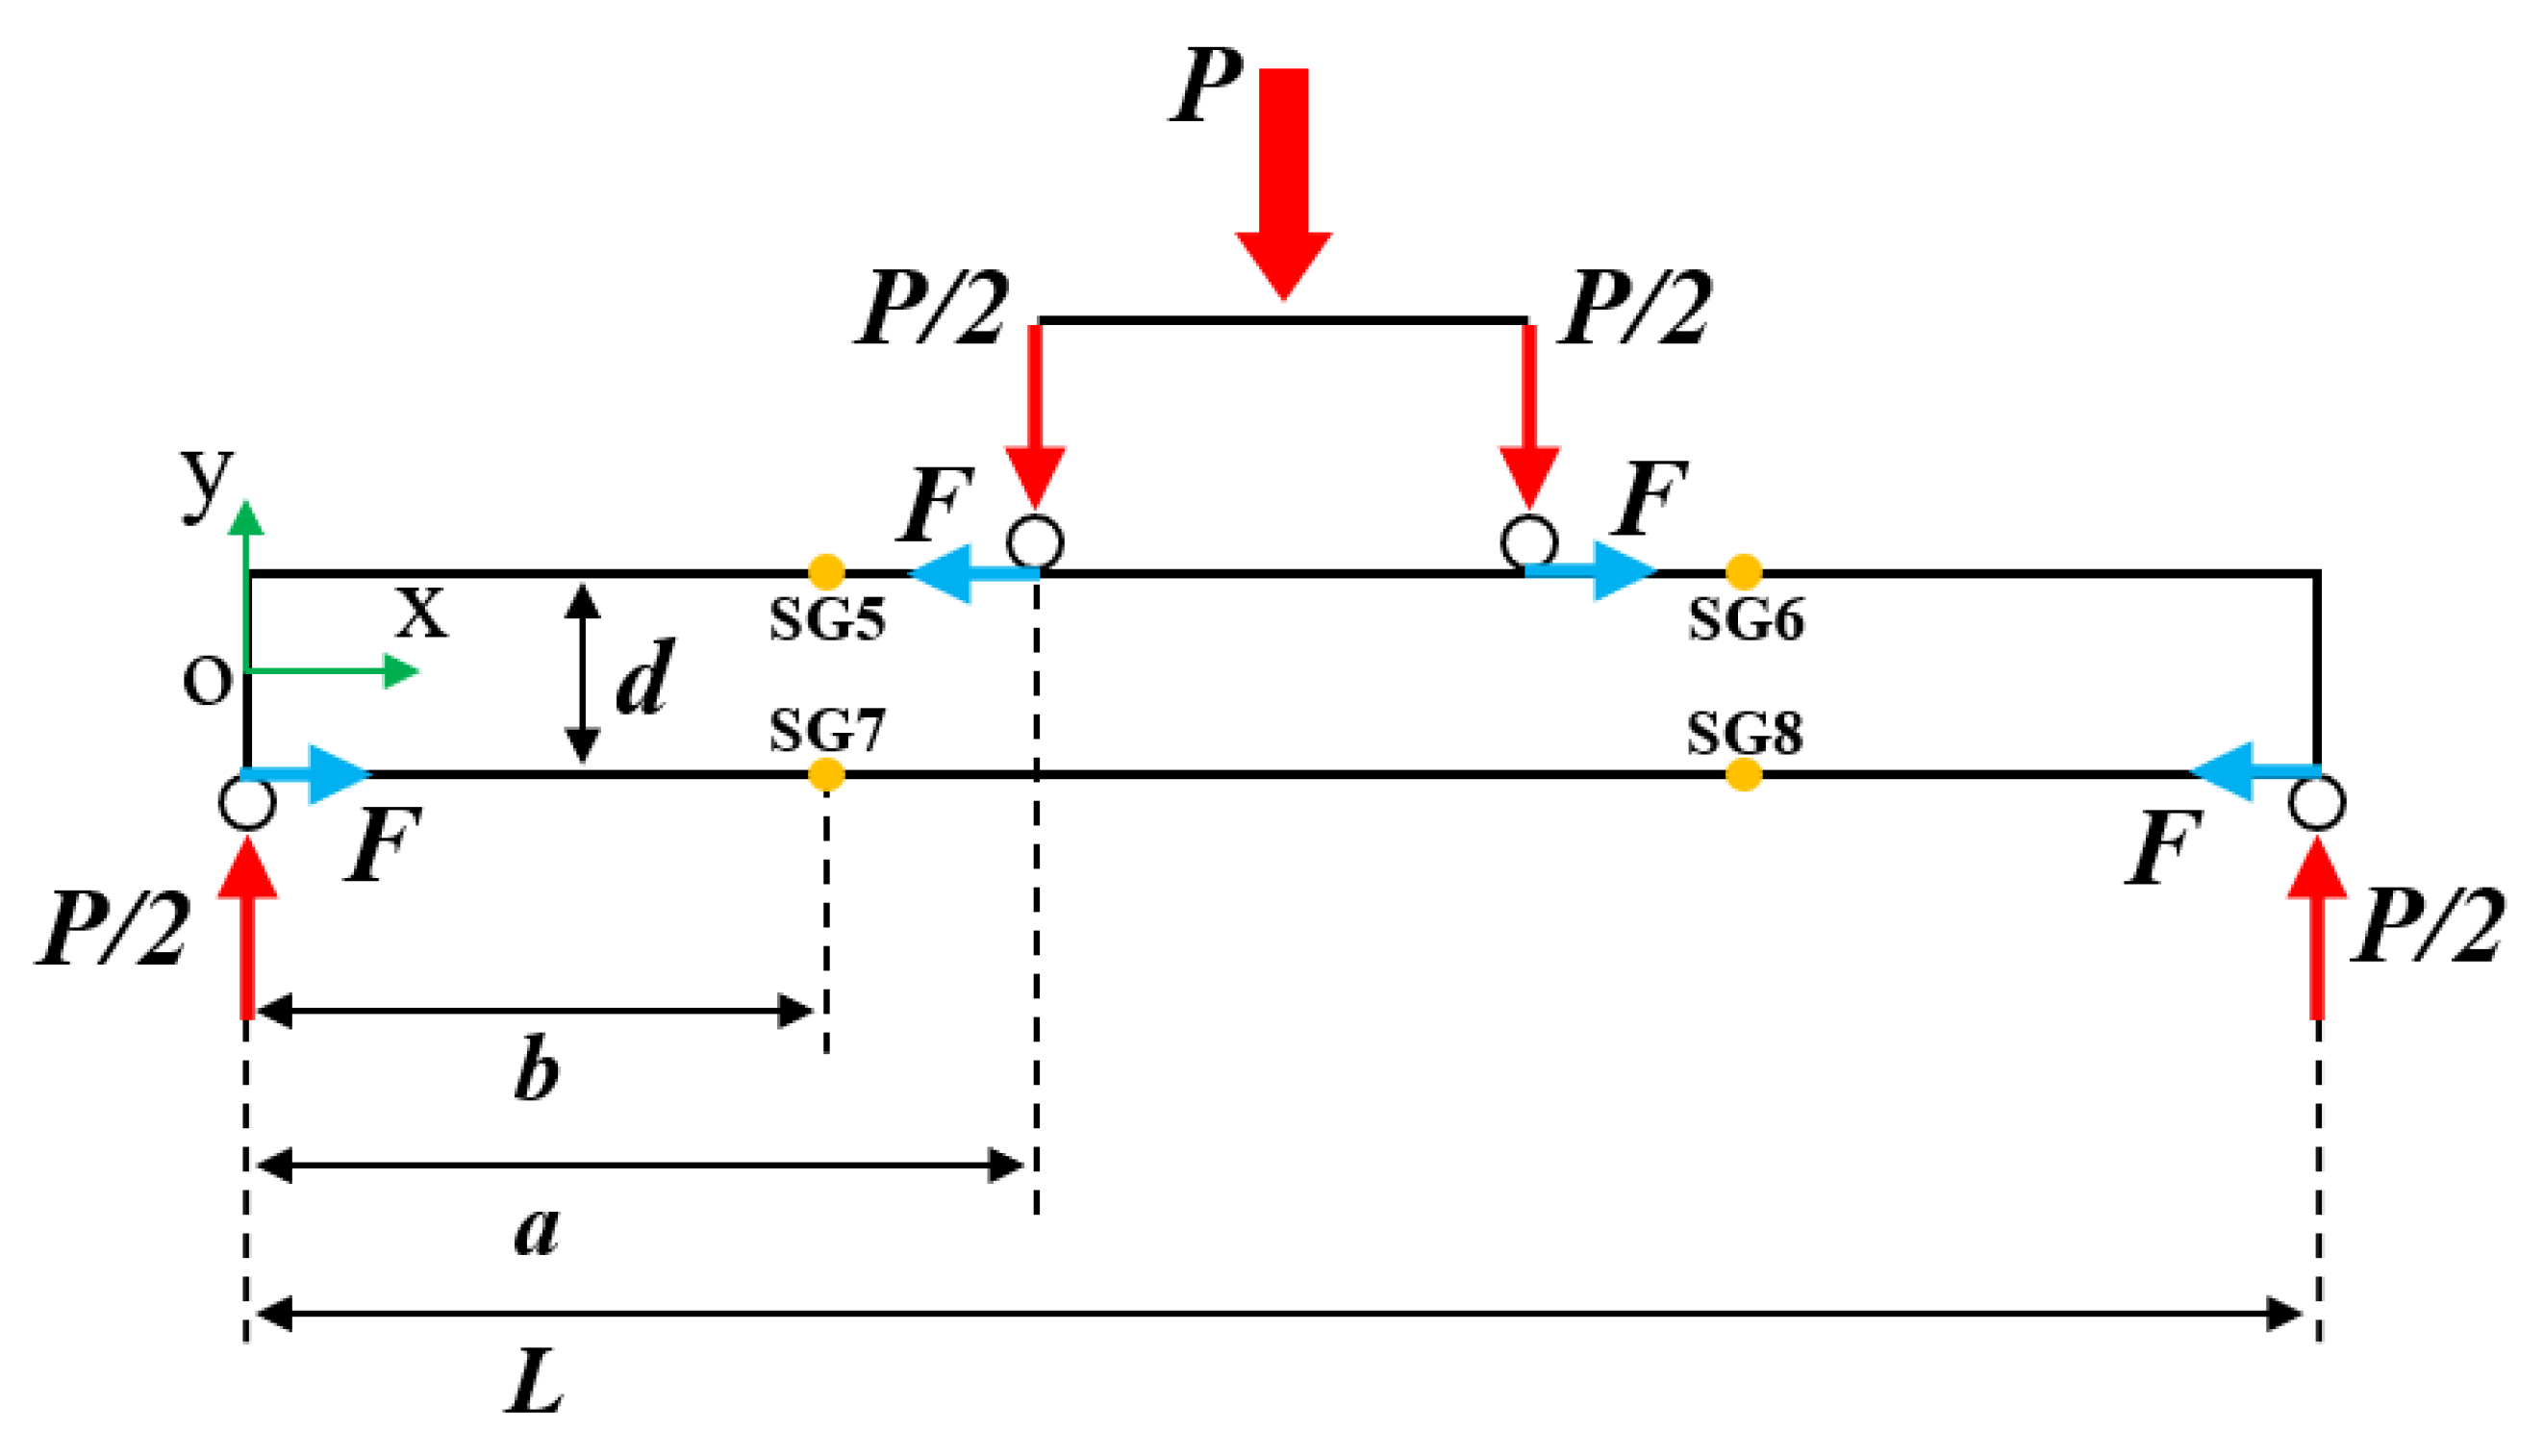
4.1. The Experimental Setup
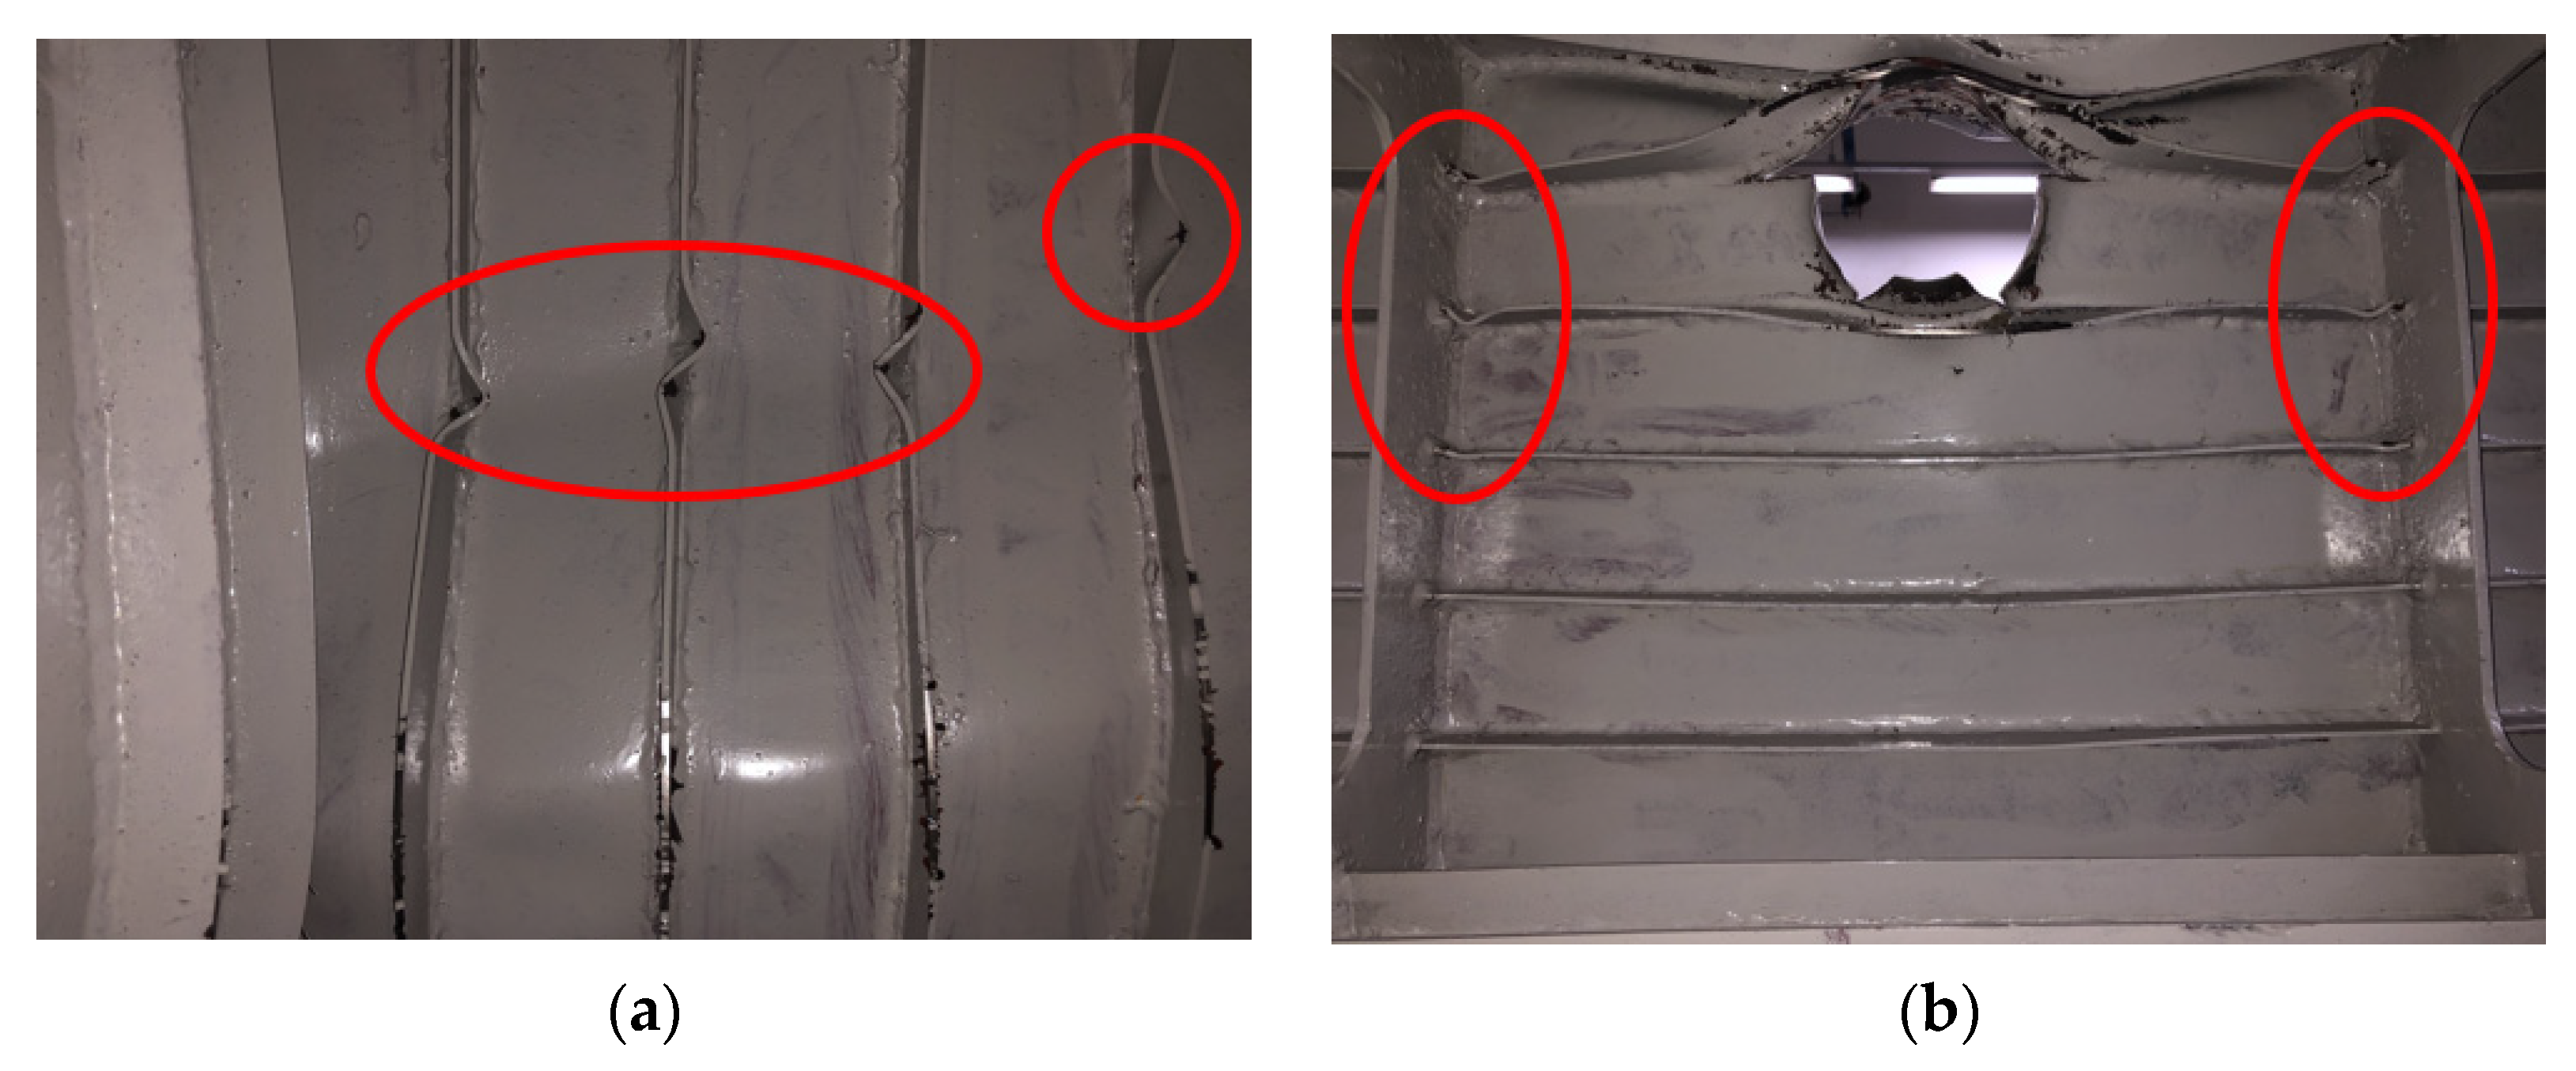
For the bending test, the model was installed on a test jig. Figure 9 shows the four-point bending-test setup with a model in position. A lateral force was applied at the middle of the load-dividing beam using a hand-driven hydraulic pump. The applied load was then divided by the beam. The divided loads were transmitted through the round bars to the inner ends of the extension structures. The test model and extension structures were supported by two round bars at the outer ends of the extension structures. The load applied at the middle of the load-dividing beam was measured by a load cell. The overall dimensions of the test jig are presented in Figure 10. As shown, the distance between each set of round bars was 1350 mm. To measure the model deflection, the distance between the VICON camera and a marker was measured using an infrared sensor (Cho et al. [27]), as shown in Figure 11.

4.2. Bending Tests

Longitudinal bending tests were performed to investigate the effects of the collision damage on the ultimate longitudinal strength. Experiments were conducted on ten models: two were intact, four were dented, and four were fractured. During the bending tests, the rate of loading to the ultimate state was divided into three stages: the first 20% involved loading with 2 tons, from 20–80% involved loading with 3 tons, and from 80% to the predicted collapse load involved loading with 1 ton. The collapse load was predicted via numerical analyses. In the post-ultimate regime, further deflections of the hydraulic jack were determined from the observations of the model collapse-shapes.
In the bending tests, eight strain gauges were used for each model to measure the strains. Four gauges (SG1-SG4) were attached on the test model, and the other four (SG5-SG8) were on the extension structures, as shown in Figure 12. In this Figure, SG3 is on the collision-damaged side, and SG4 is on the undamaged side. In a four-point bending test, friction occurred at the four supporting points. To estimate the frictional forces exerted on the round bars, four strain gauges SG5, SG6, SG7, and SG8 were attached to the extension structures.

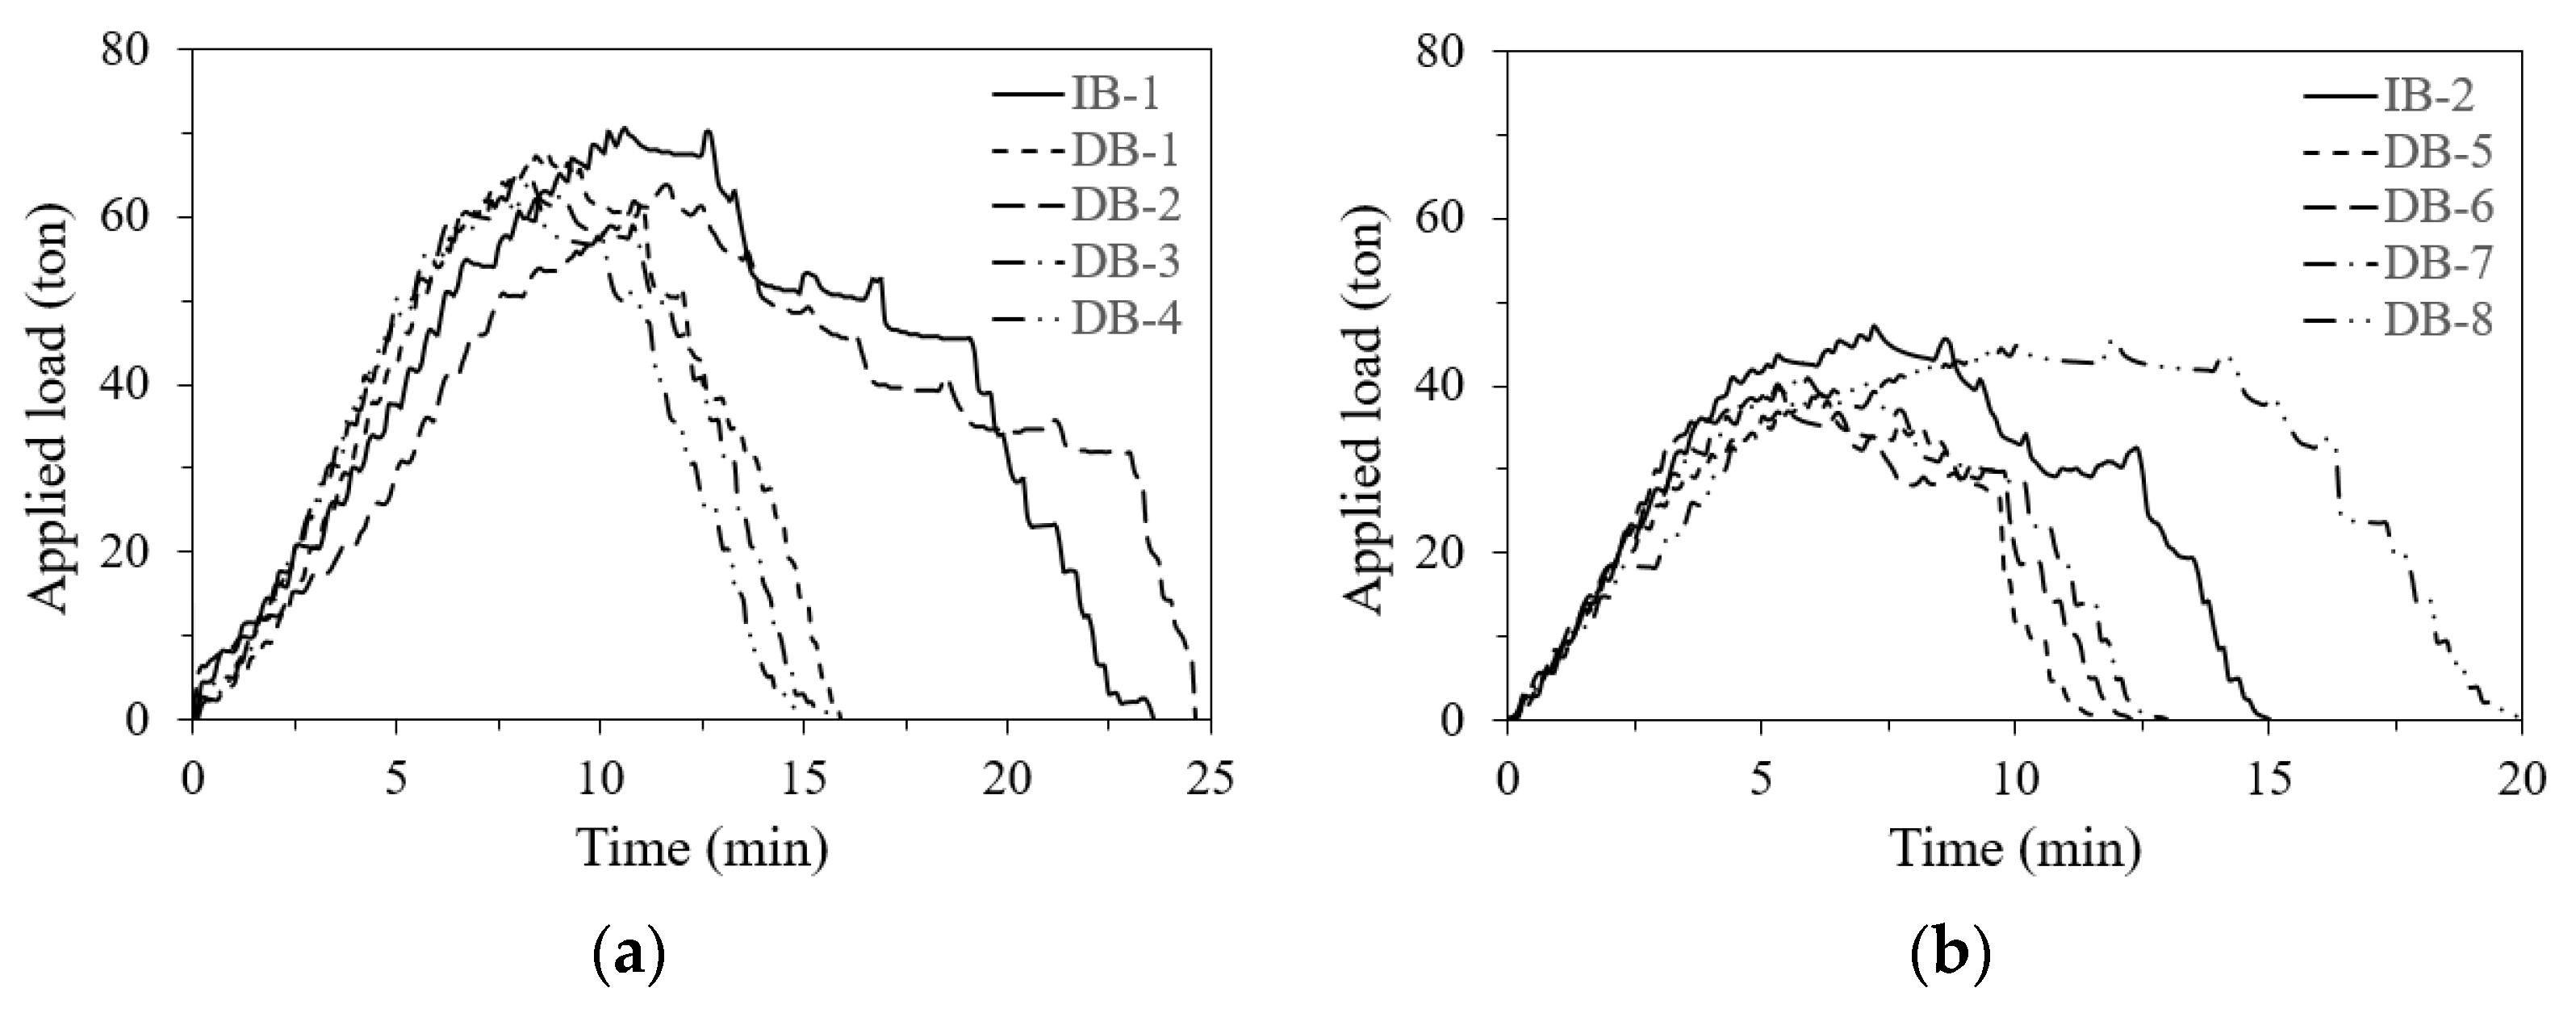
4.3. Bending Test Results

The ultimate strength was reached when buckling occurred at the mid-bay of the box girder models as shown in Figure 13. Figure 13a,b show the collapsed shapes of intact models IB-1 and IB-2, respectively. Figure 13c–f show the collapsed shapes of damaged models DB-2, DB-4, DB-5, and DB-7, respectively. In Figure 14 the deformed shape of the longitudinal stiffener can be seen. The local tripping occurs in the longitudinal stiffeners of the deck. It is also noteworthy that local tripping of the longitudinal stiffeners was apparent at the junctions with transverse frames. The applied load and strain history curves are shown in Figure 15 and Figure 16, respectively. From the load and strain data, the ultimate bending moment and the frictional force were derived. In Table 5, the maximum applied loads obtained from the load-cell are summarized. As the permanent dent depth and fracture damage (diagonal length) increase, the rate of load reduction increases. In the case of Group A, the load reductions of models DB-3 and DB-4, collided at the corner, were greater than models DB-1 and DB-2, collided at the center. In the case of Group B, the load reductions of models DB-5 and DB-6, collided at ‘Impact location 1′, were greater than models DB-7 and DB-8, collided at ‘Impact location 2′. The maximum load of Group A, having higher stiffener web height and stronger yield strength, was greater than that of Group B.

5. Numerical Analysis
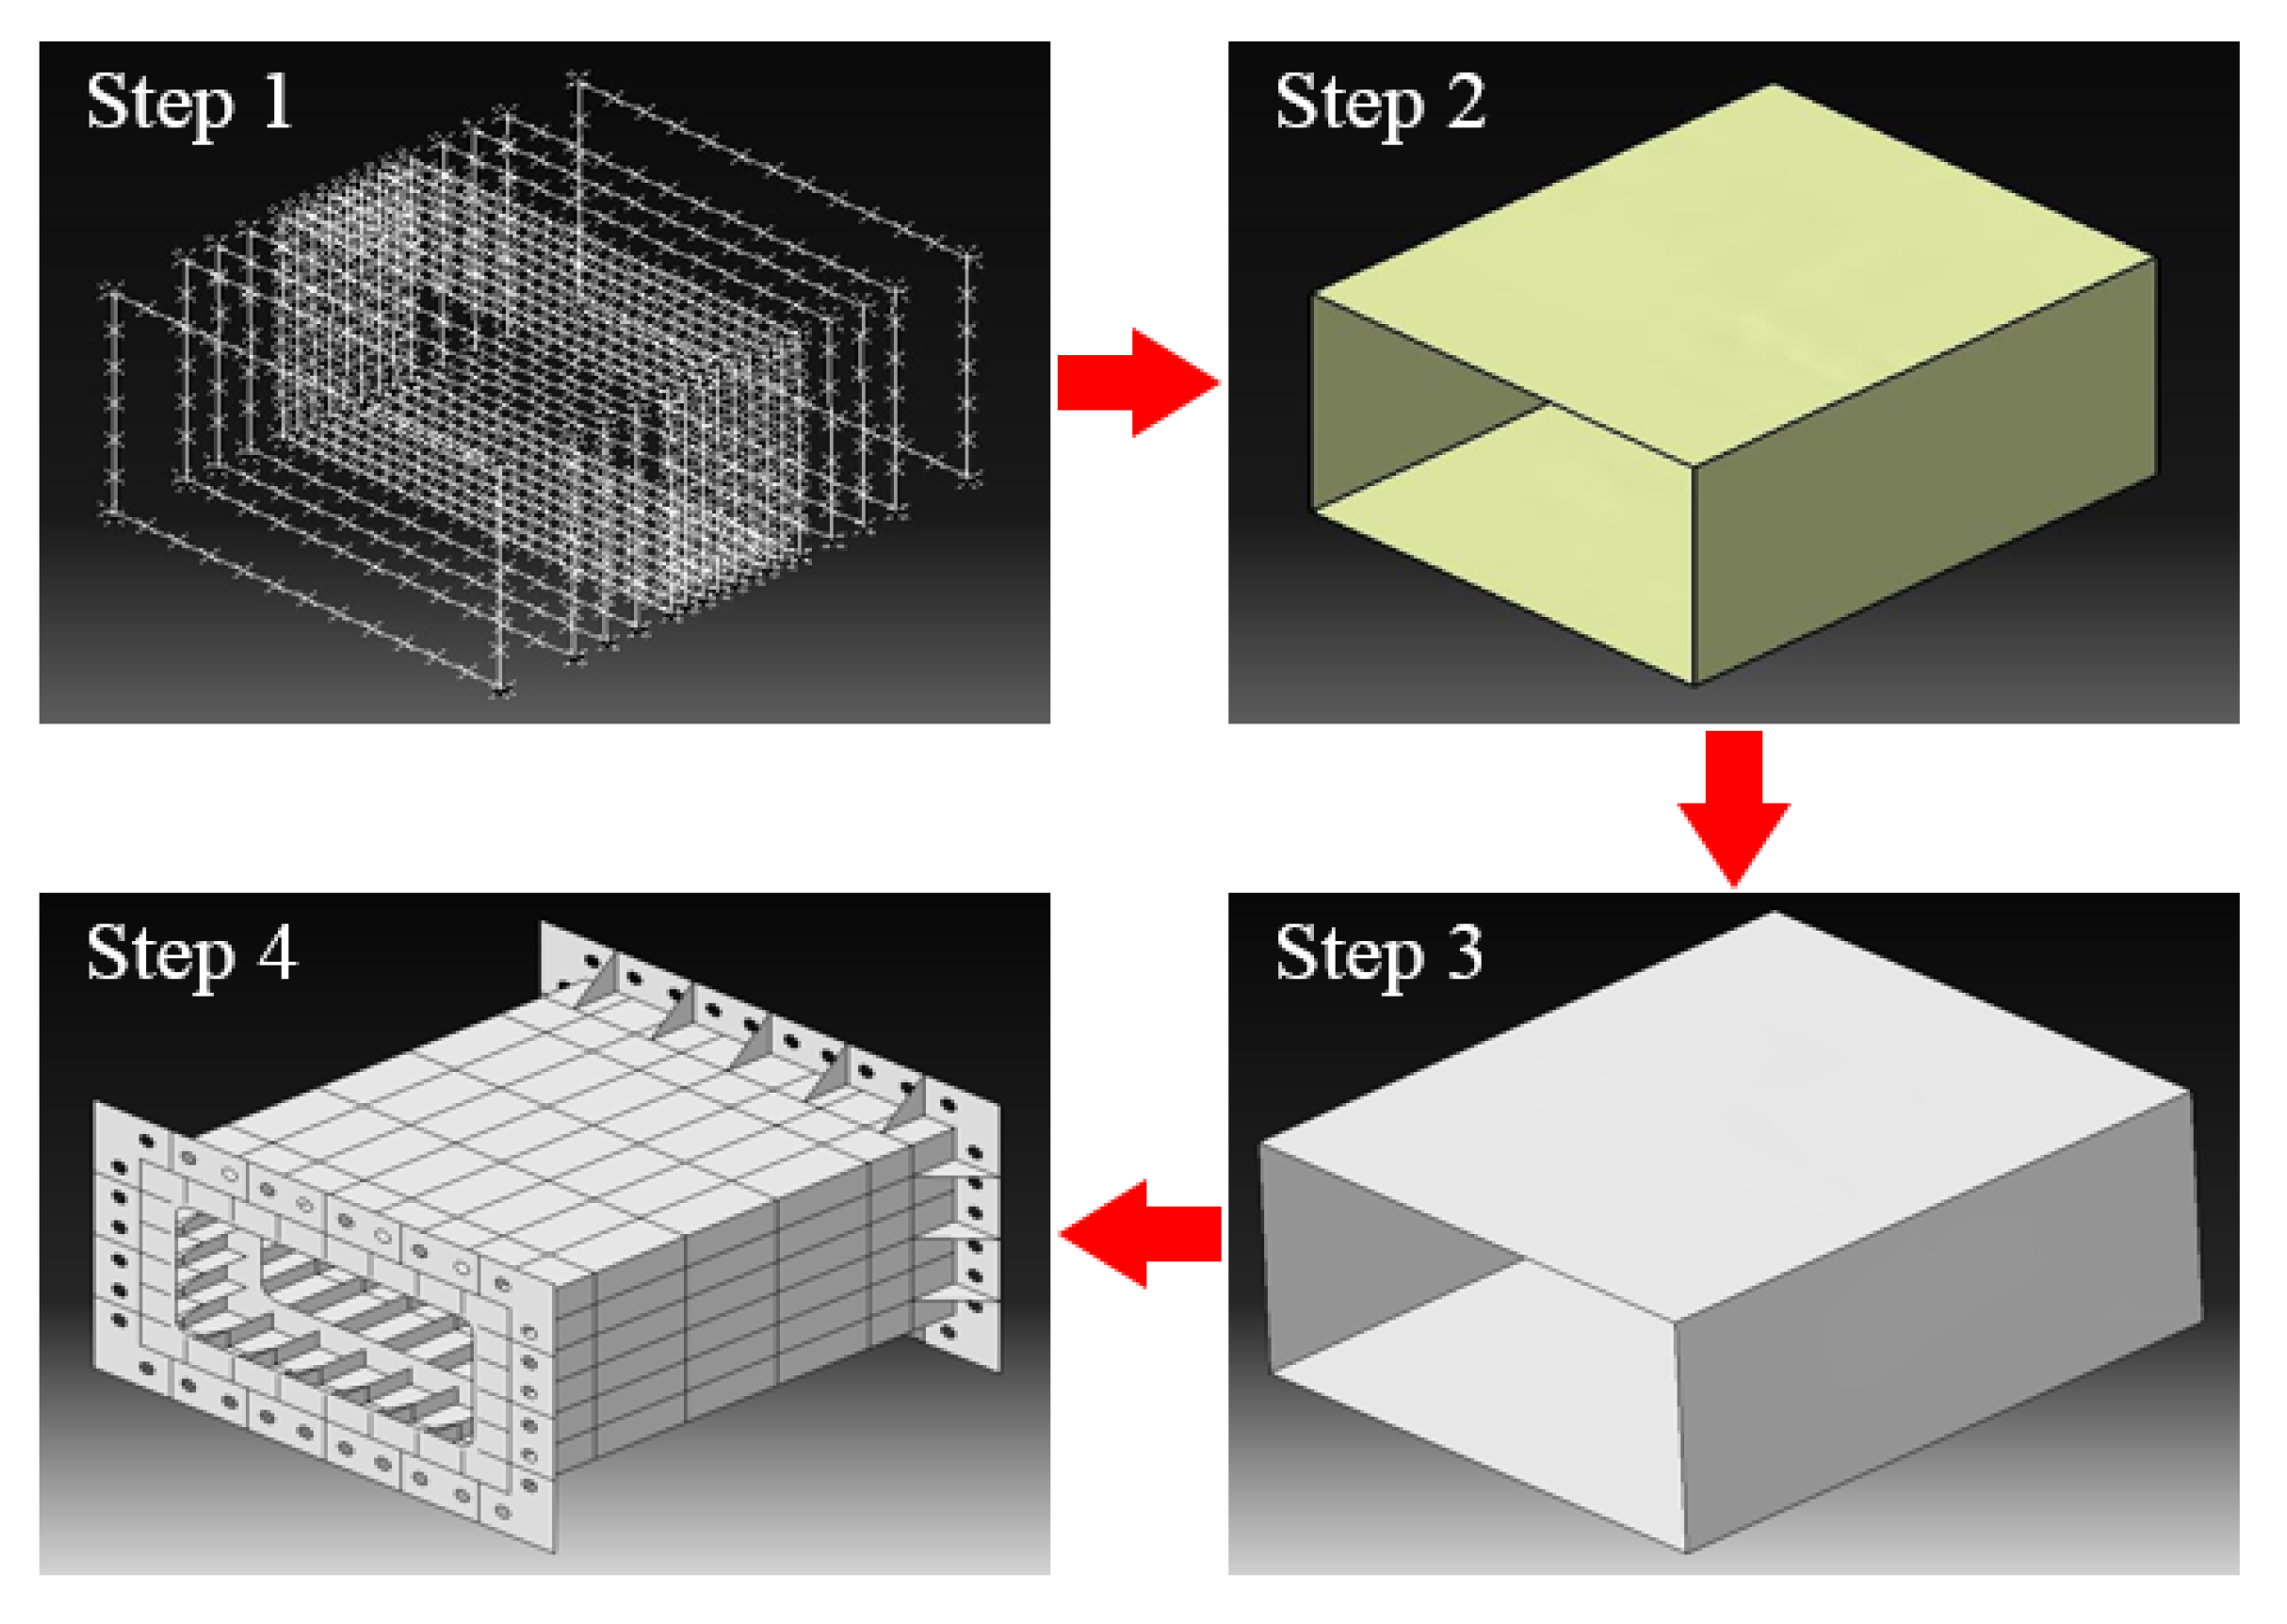
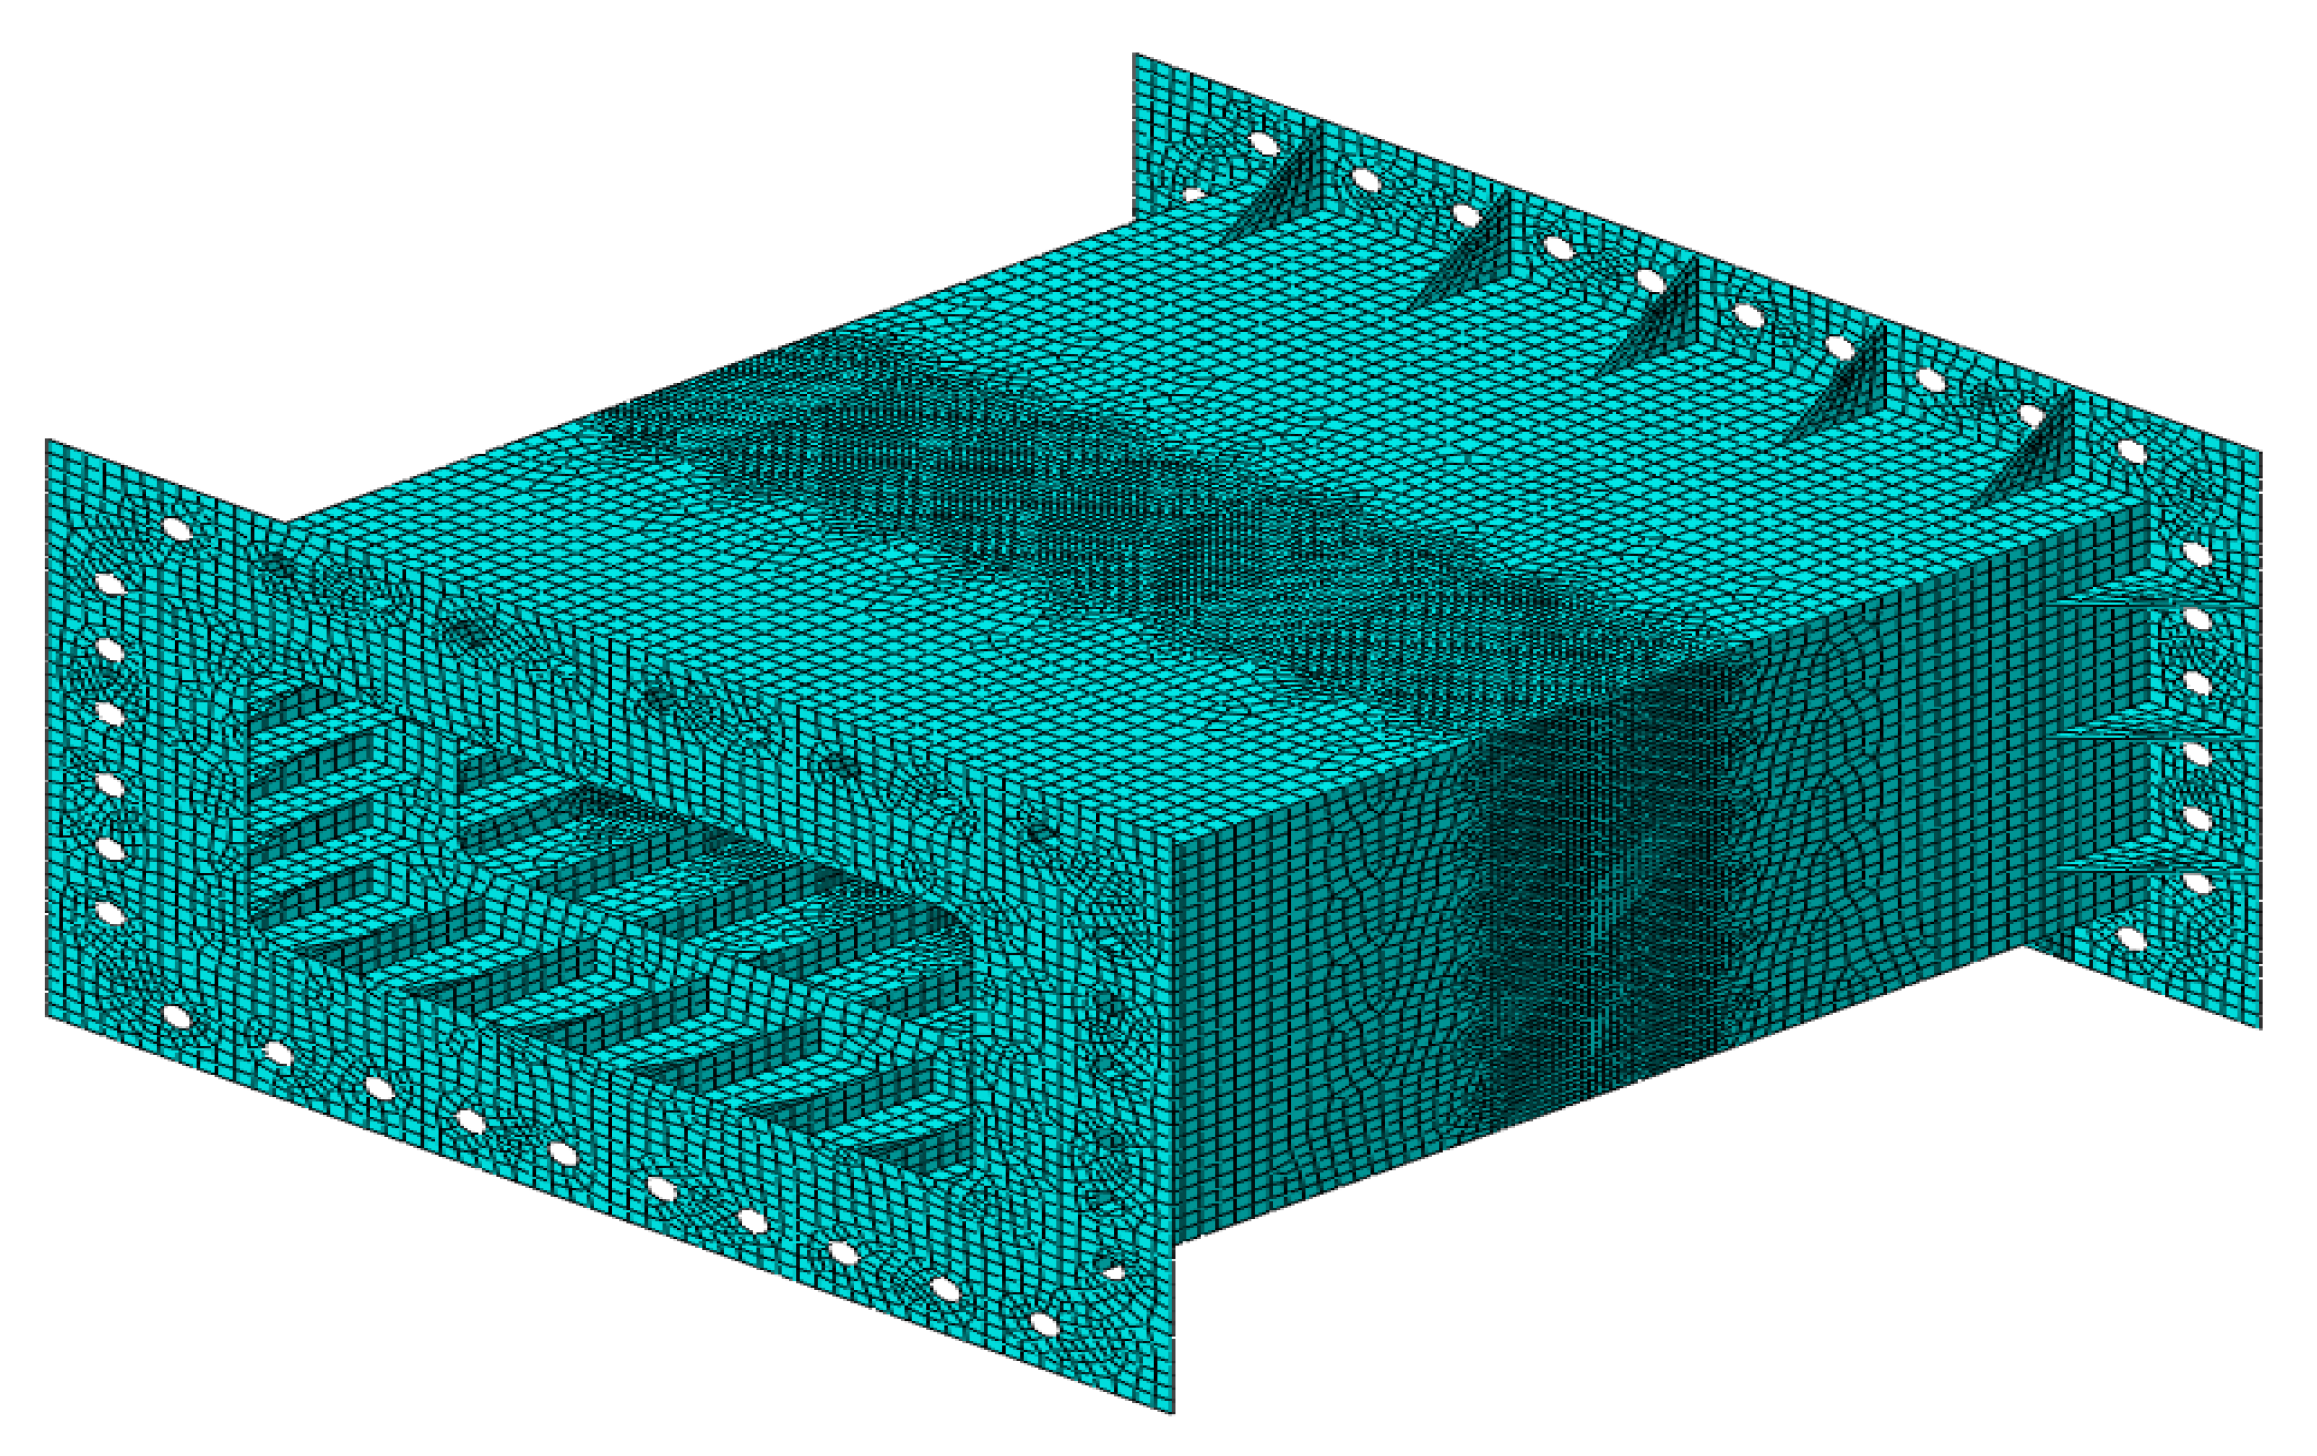
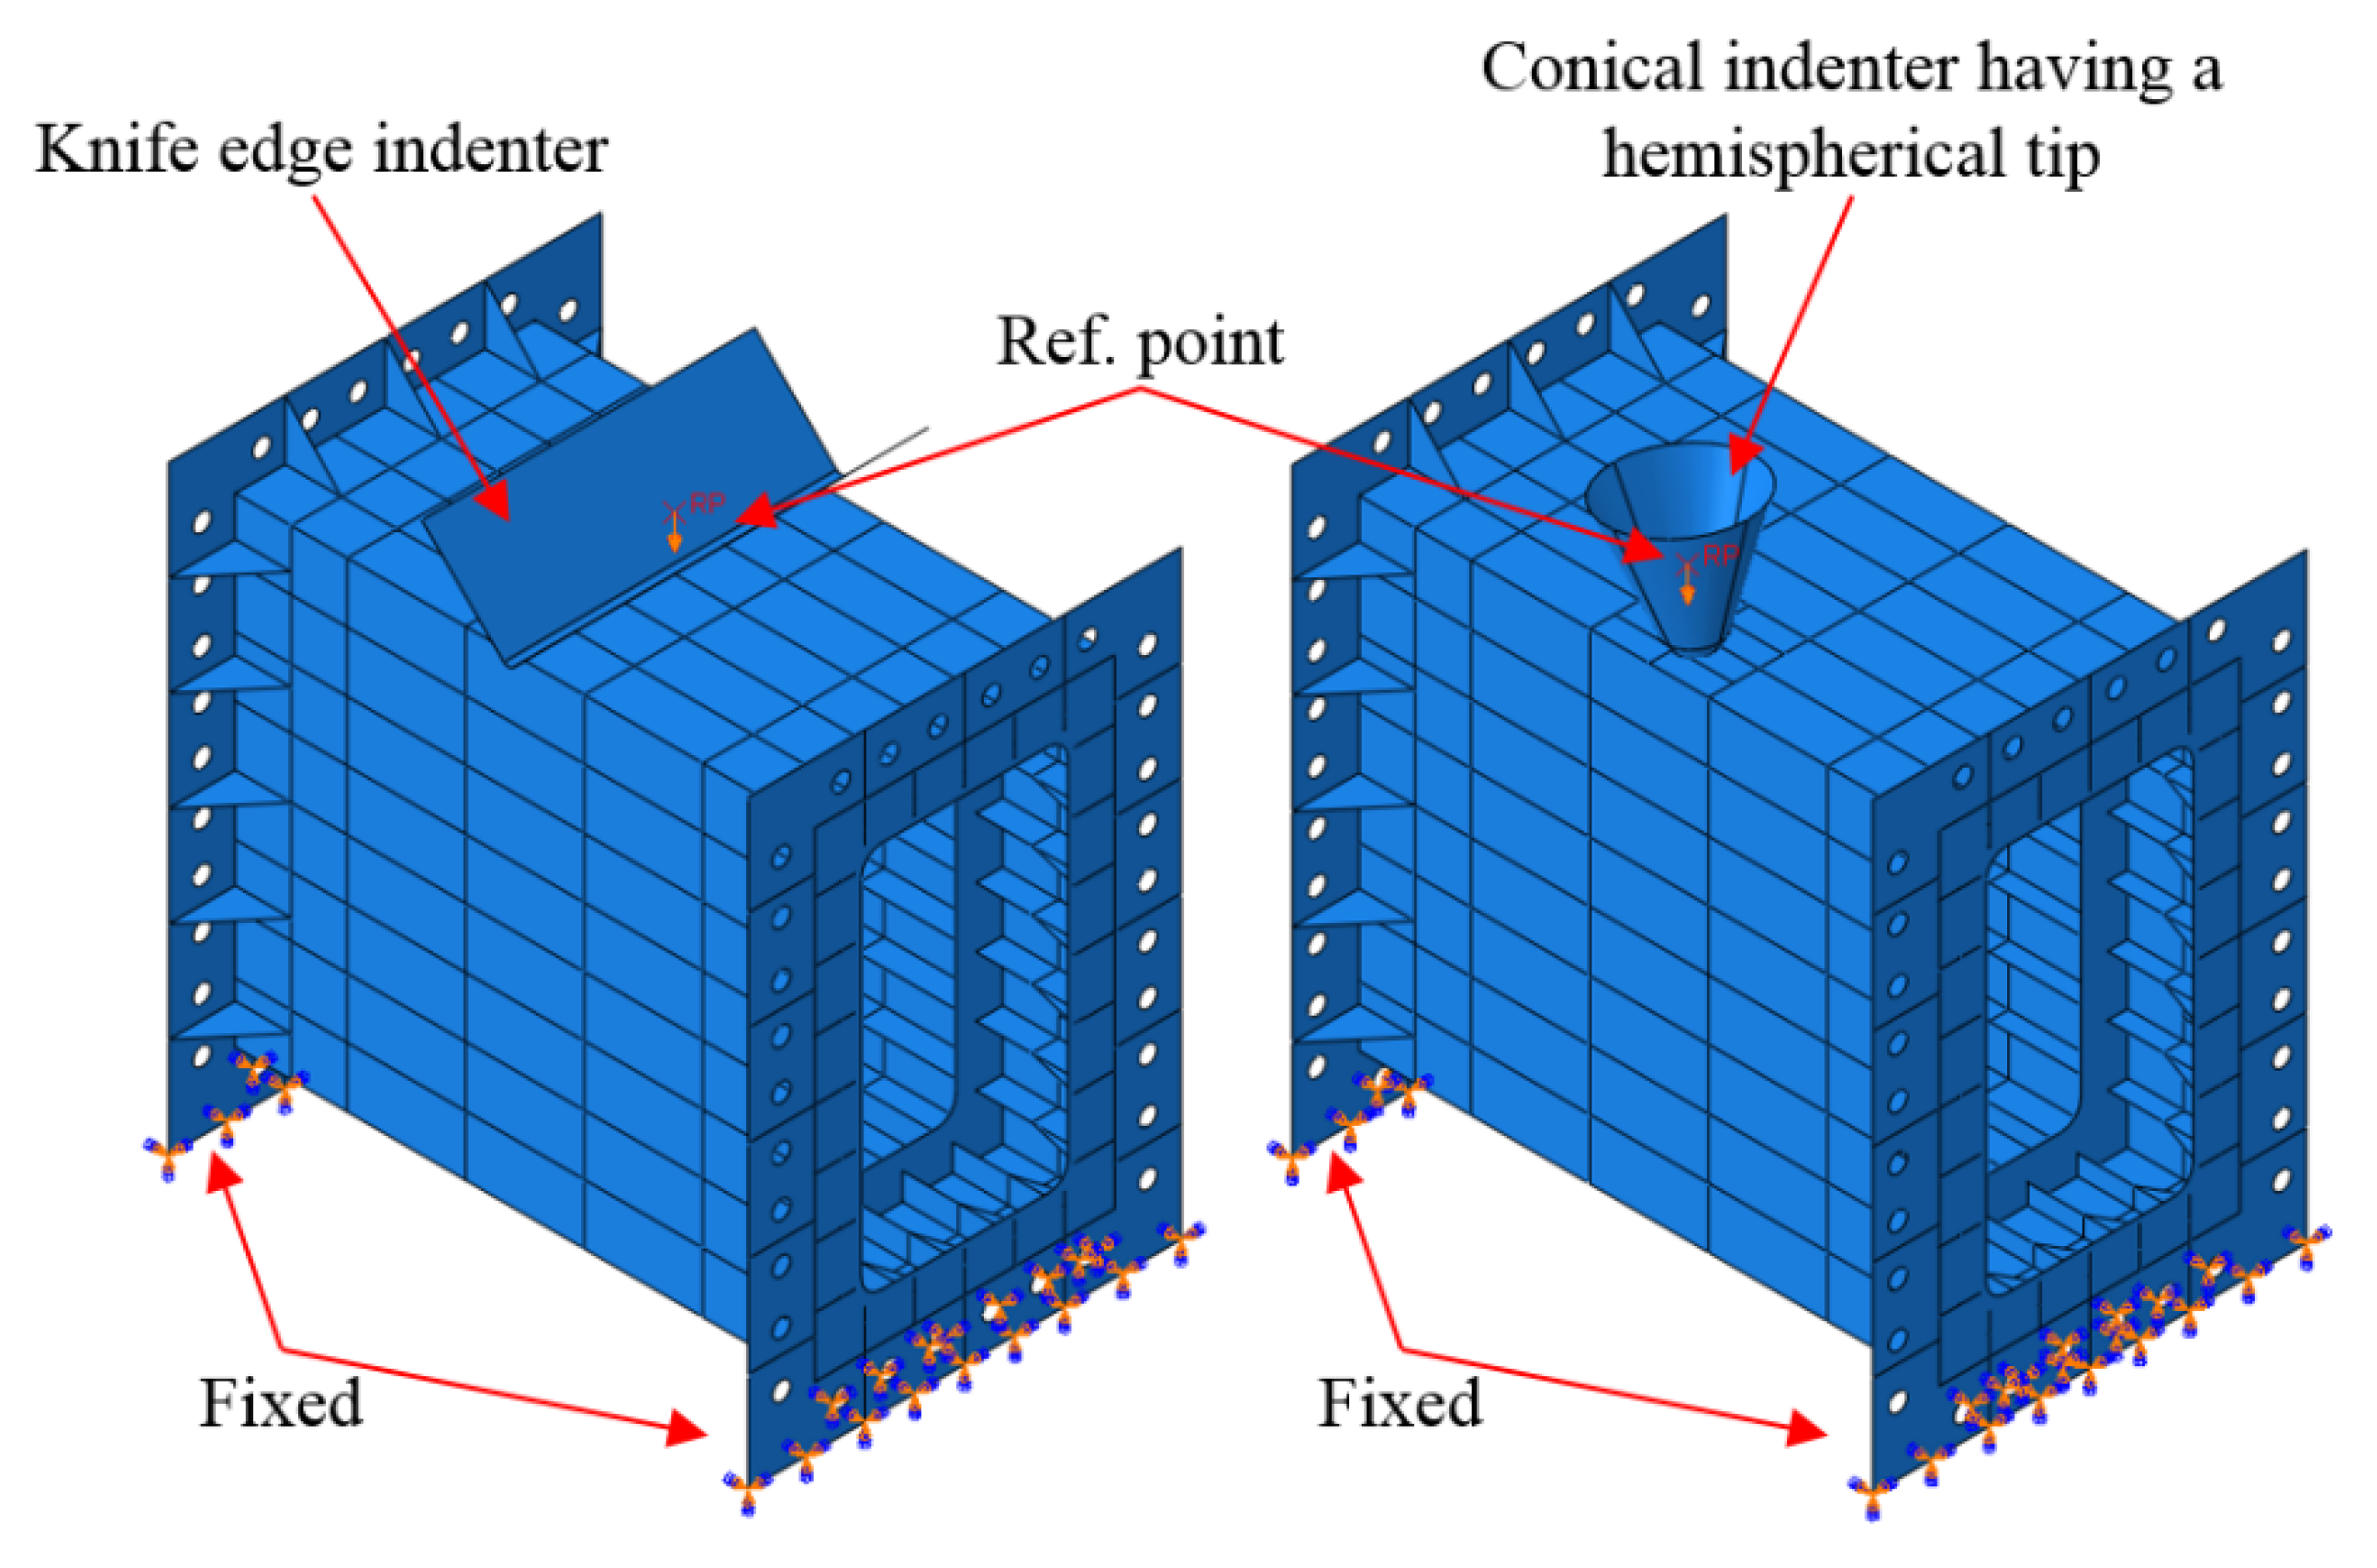
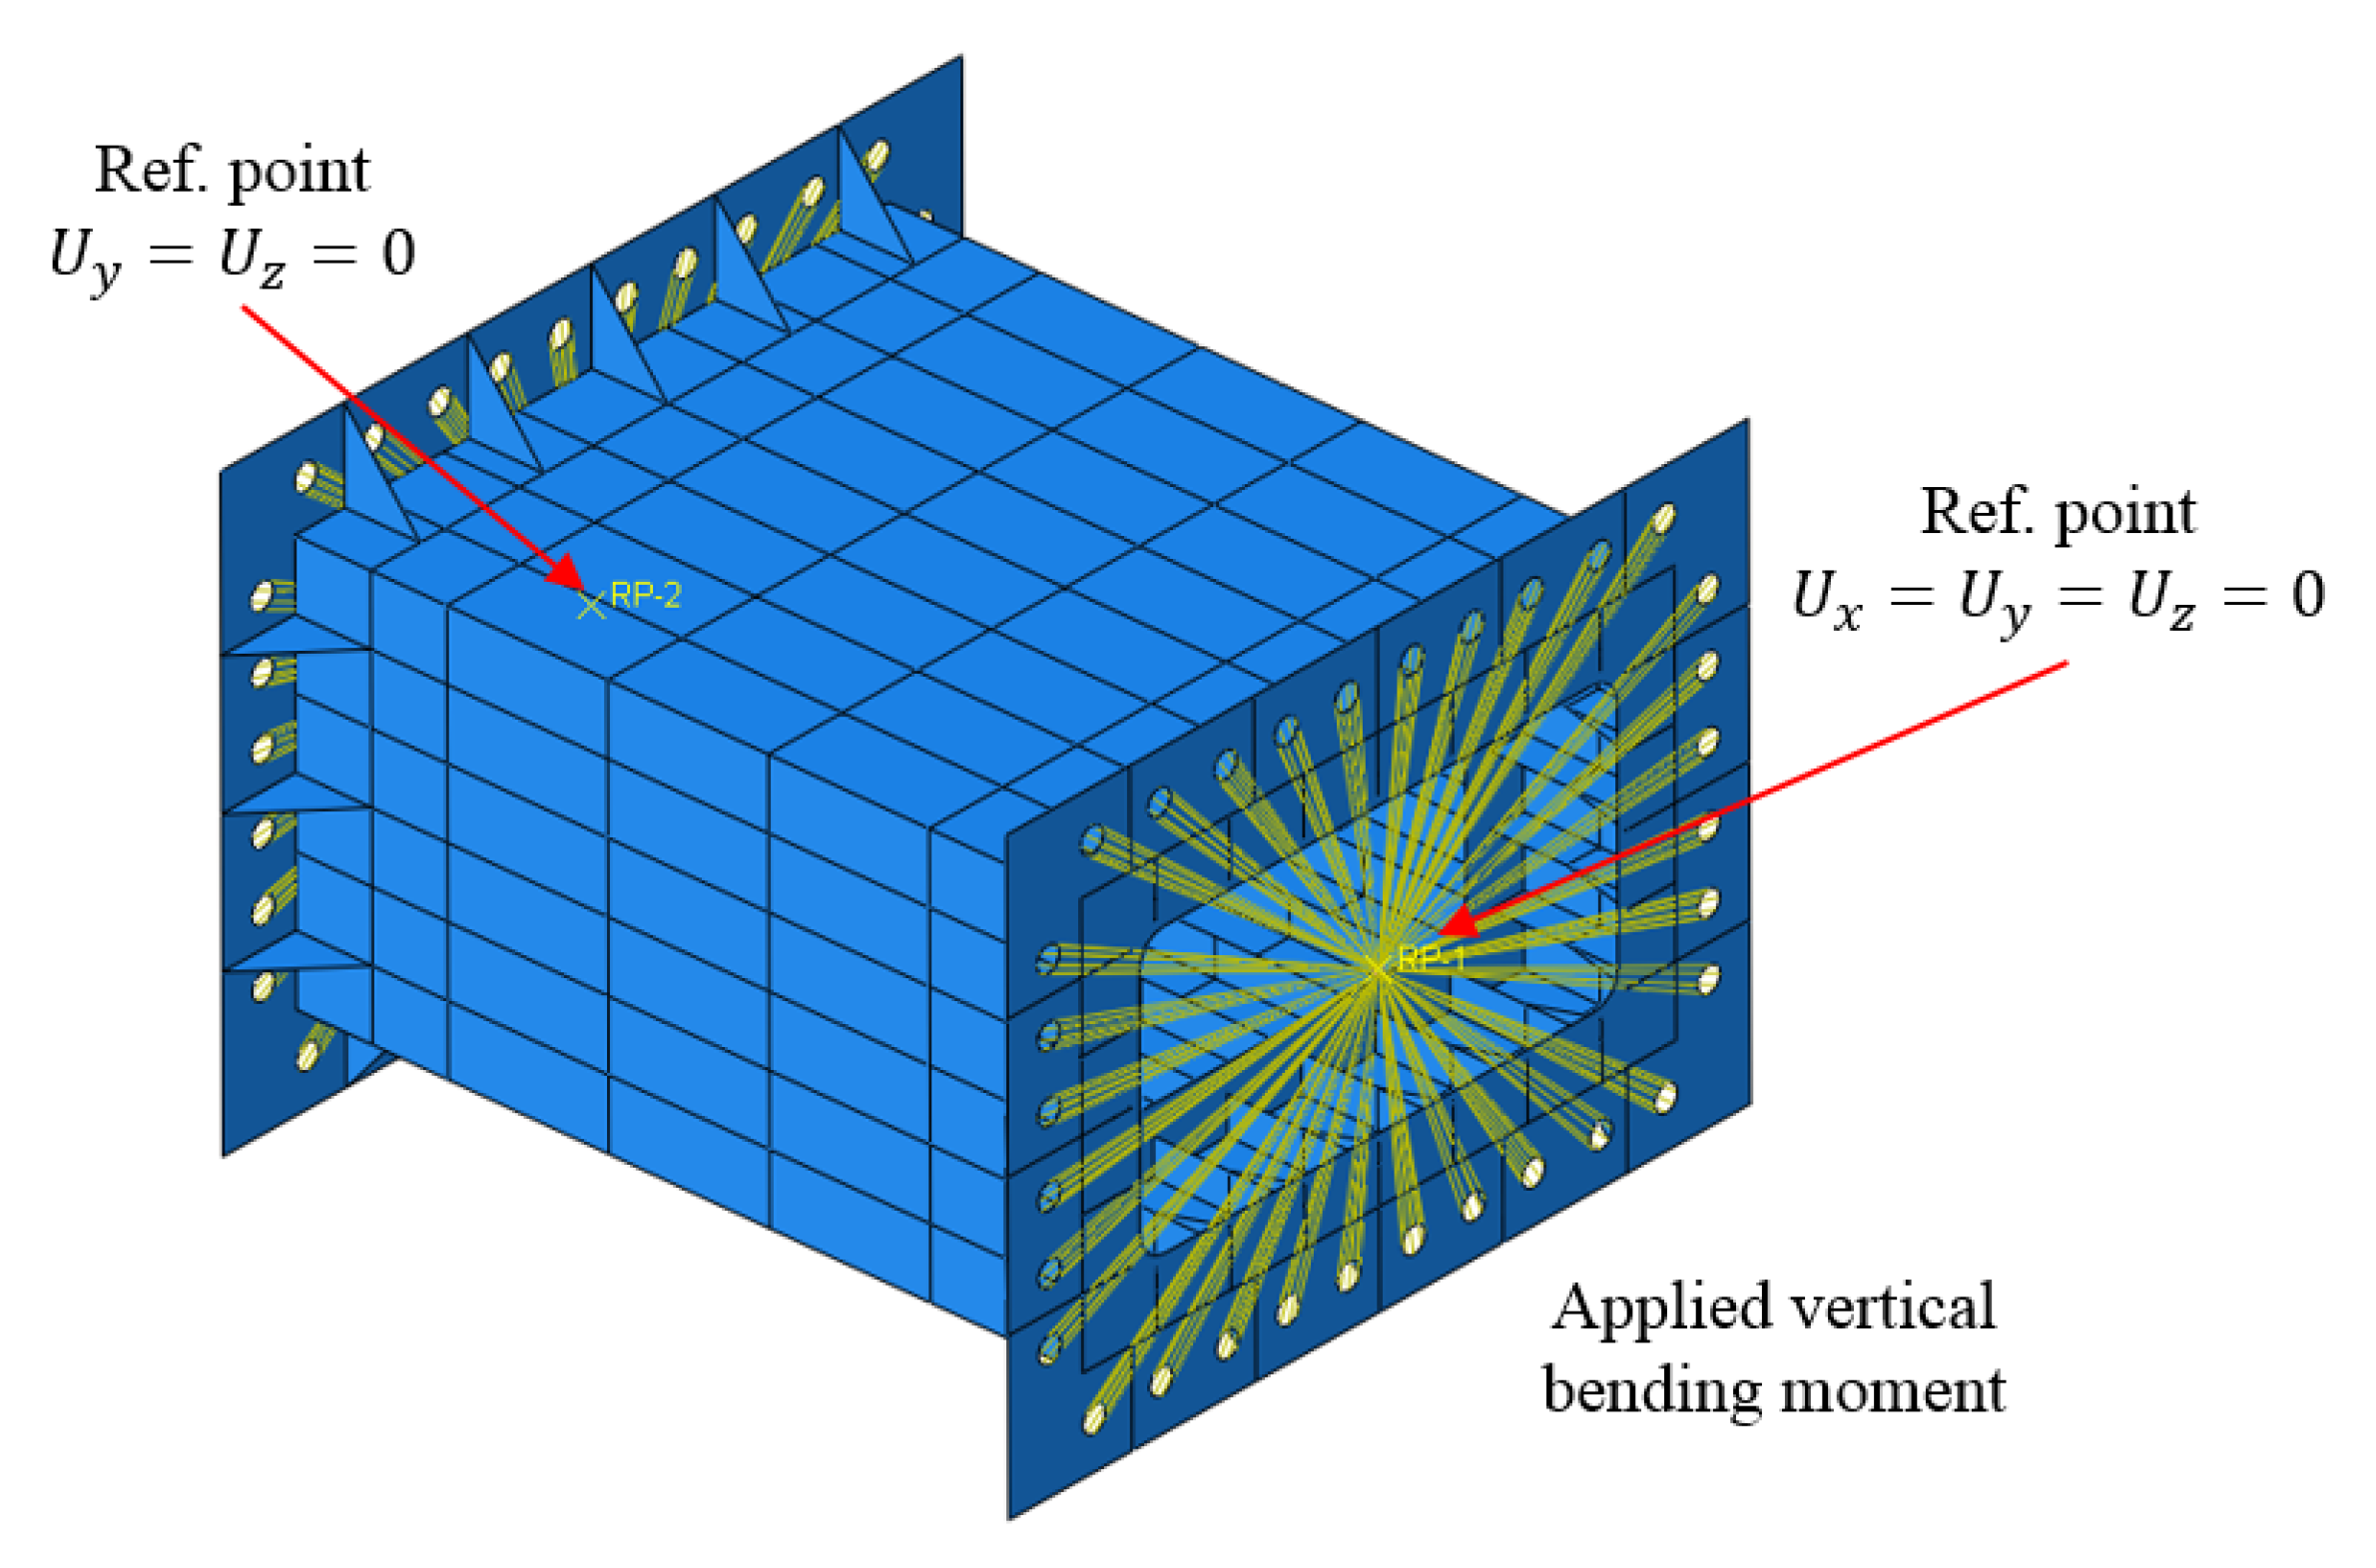
Nonlinear FE analyses were performed using the commercial software ABAQUS. The collision process was simulated using a dynamic/explicit method, and the bending process was simulated using a static general method.

5.1. FE Modeling

Figure 17 illustrates the FE modeling process. To numerically analyze the experimental model, the initial imperfections were considered. After the measured coordinates of the initial imperfection data were exported to CATIA, the points were connected by the spline function to create a curve (Step 1). Consequently, the surface was created using each curve (Step 2), and the surface of the generated model was exported to ABAQUS (Step 3), where the remaining members were modeled (Step 4). This modeling process was validated by Do et al. [30,31]. The model comprised a four-node shell element (S4R) accompanied with an hourglass regulation and reduced integration, as shown in Figure 18. Five integration points through the thickness were used. To obtain reasonable numerical results and reduce the analysis time, mesh convergence tests were performed. Figure 19 presents the convergence test results. The element size was approximately two times the shell thickness. The impact region of the model was modeled with fine meshes (6×6 mm), and the element size of the coarse mesh far from the impact region was 15 × 15 mm. The total number of nodes and elements were 37,806 and 37,707, respectively.
The welding residual stress due to fabrication remains in the stiffened plates. This kind of stress can decrease the ultimate strength of the plate. The effect of welding residual strength has been assigned in this study. The contribution of welding along the attachment of stiffeners and transverse girders to the plates was predicted using Equation (1) proposed by Faulkner [32]. The width of the tension block was determined by Equations (2)–(4) [33]:
σ r σ Y = 2 η ( b t p 2 η )
η = ( t w 2 + 0.26 Q t w + 2 t p ) / t p
Q = 78.8 l 2
l = { 0.7 t w   ( mm )   for   0.7 t w < 7.0   mm 7.0   ( mm )   for   0.7 t w 7.0   mm
where, σ r is the compressive residual stress; σ Y is the yield stress of material; b is the stiffener spacing; t p is the plate thickness; η is the width of tension block (residual stress parameter).

5.2. Definitions of Material Properties

The properties of the strain and strain-rate hardenings of the material were investigated. The tensile-test results were used for defining the material strain-hardening properties. The formula reflecting the dynamic hardening proposed by Cho et al. [34] was obtained using the formula for estimating the yield strength, ultimate tensile strength, hardening start strain, and ultimate tensile strain. The true stress–strain dynamic material curves obtained with the strain rate ε ˙ ( s 1 ) set as 0 (static tensile), 0.01, 0.1, 1, 30, 80, and 100 (dynamic tensile) are plotted in Figure 20.
The selection of the fracture criterion and the determination of the related critical value were the most important tasks for the fracture analysis of the impacted structures. The shear-fracture criterion was adopted to monitor the occurrence of the fracture.

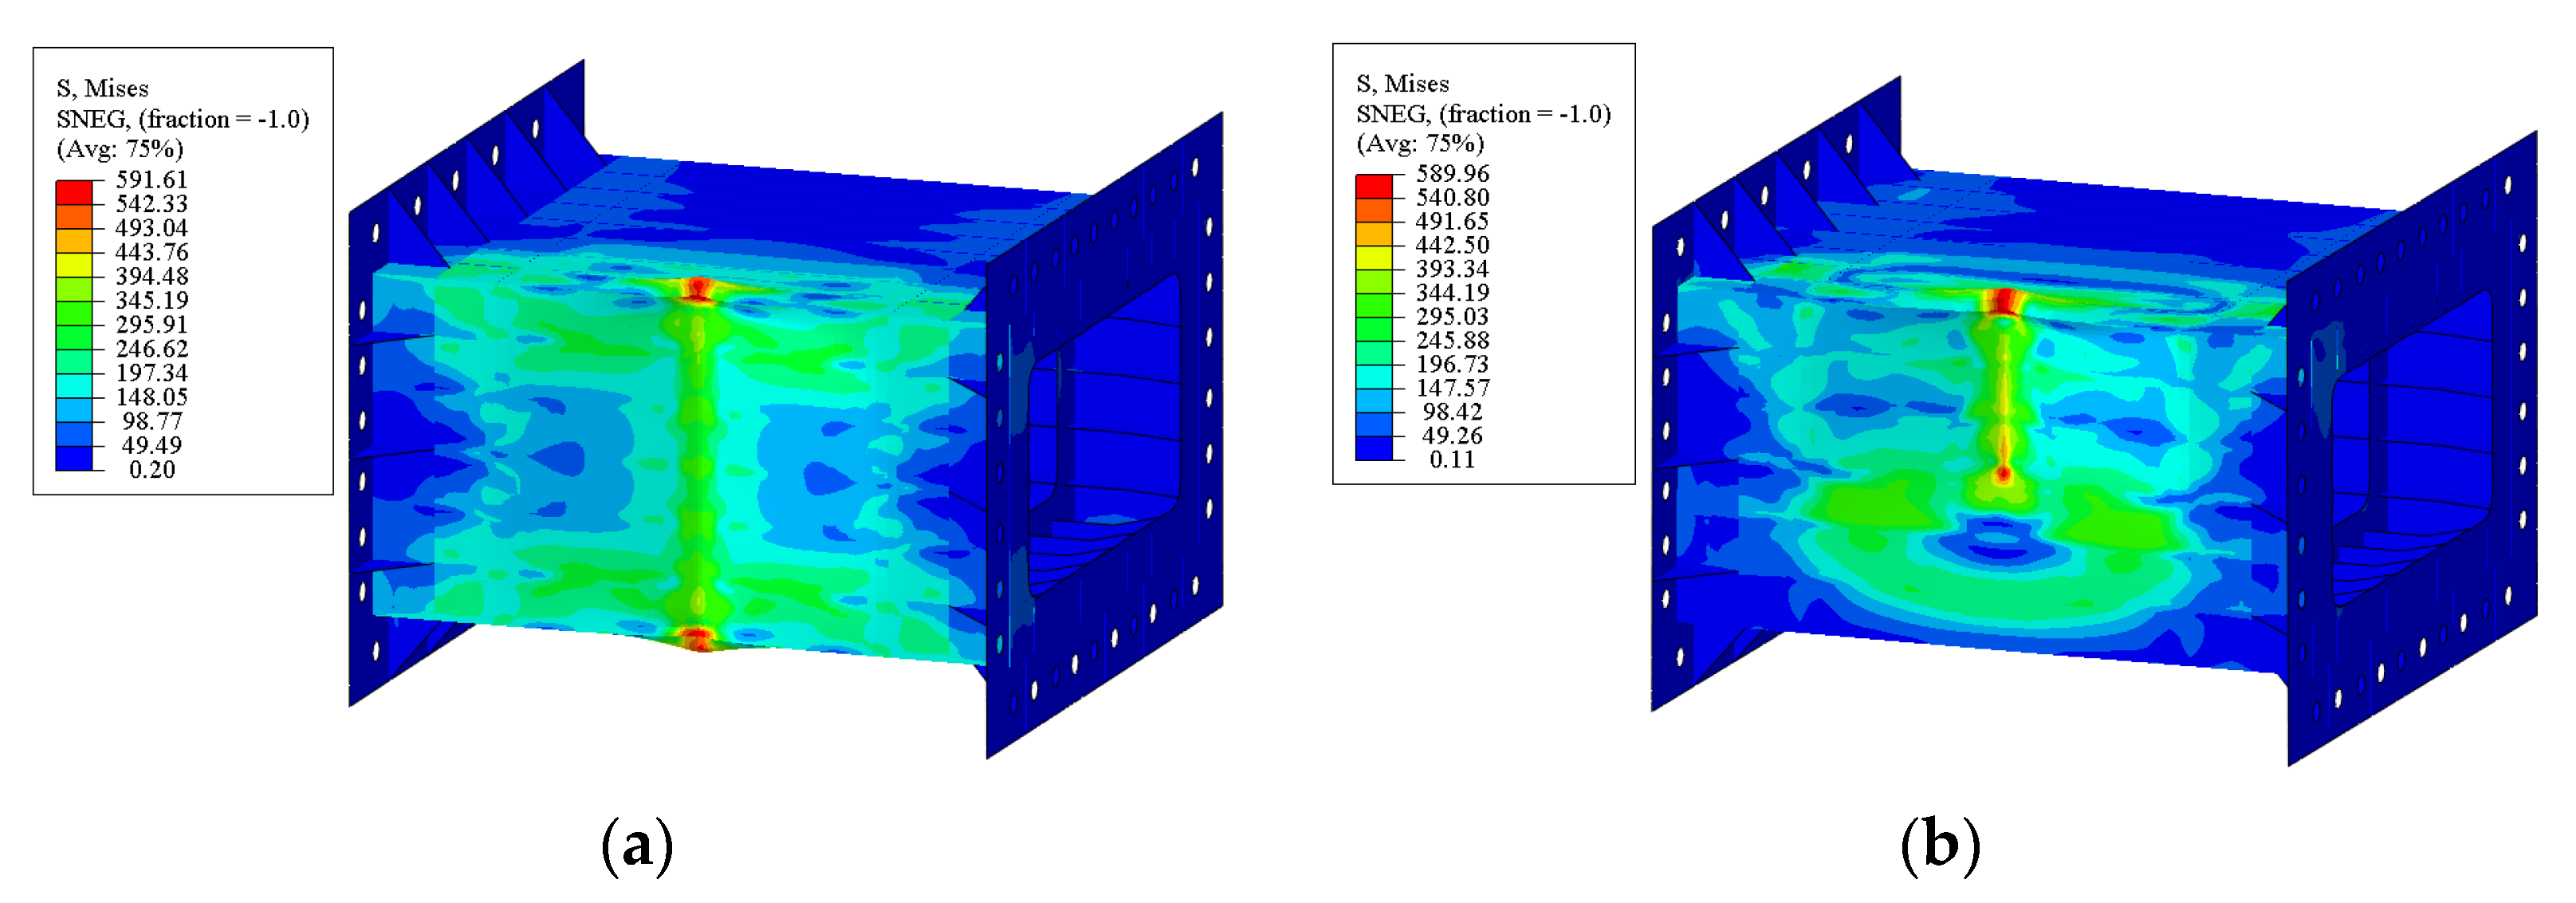
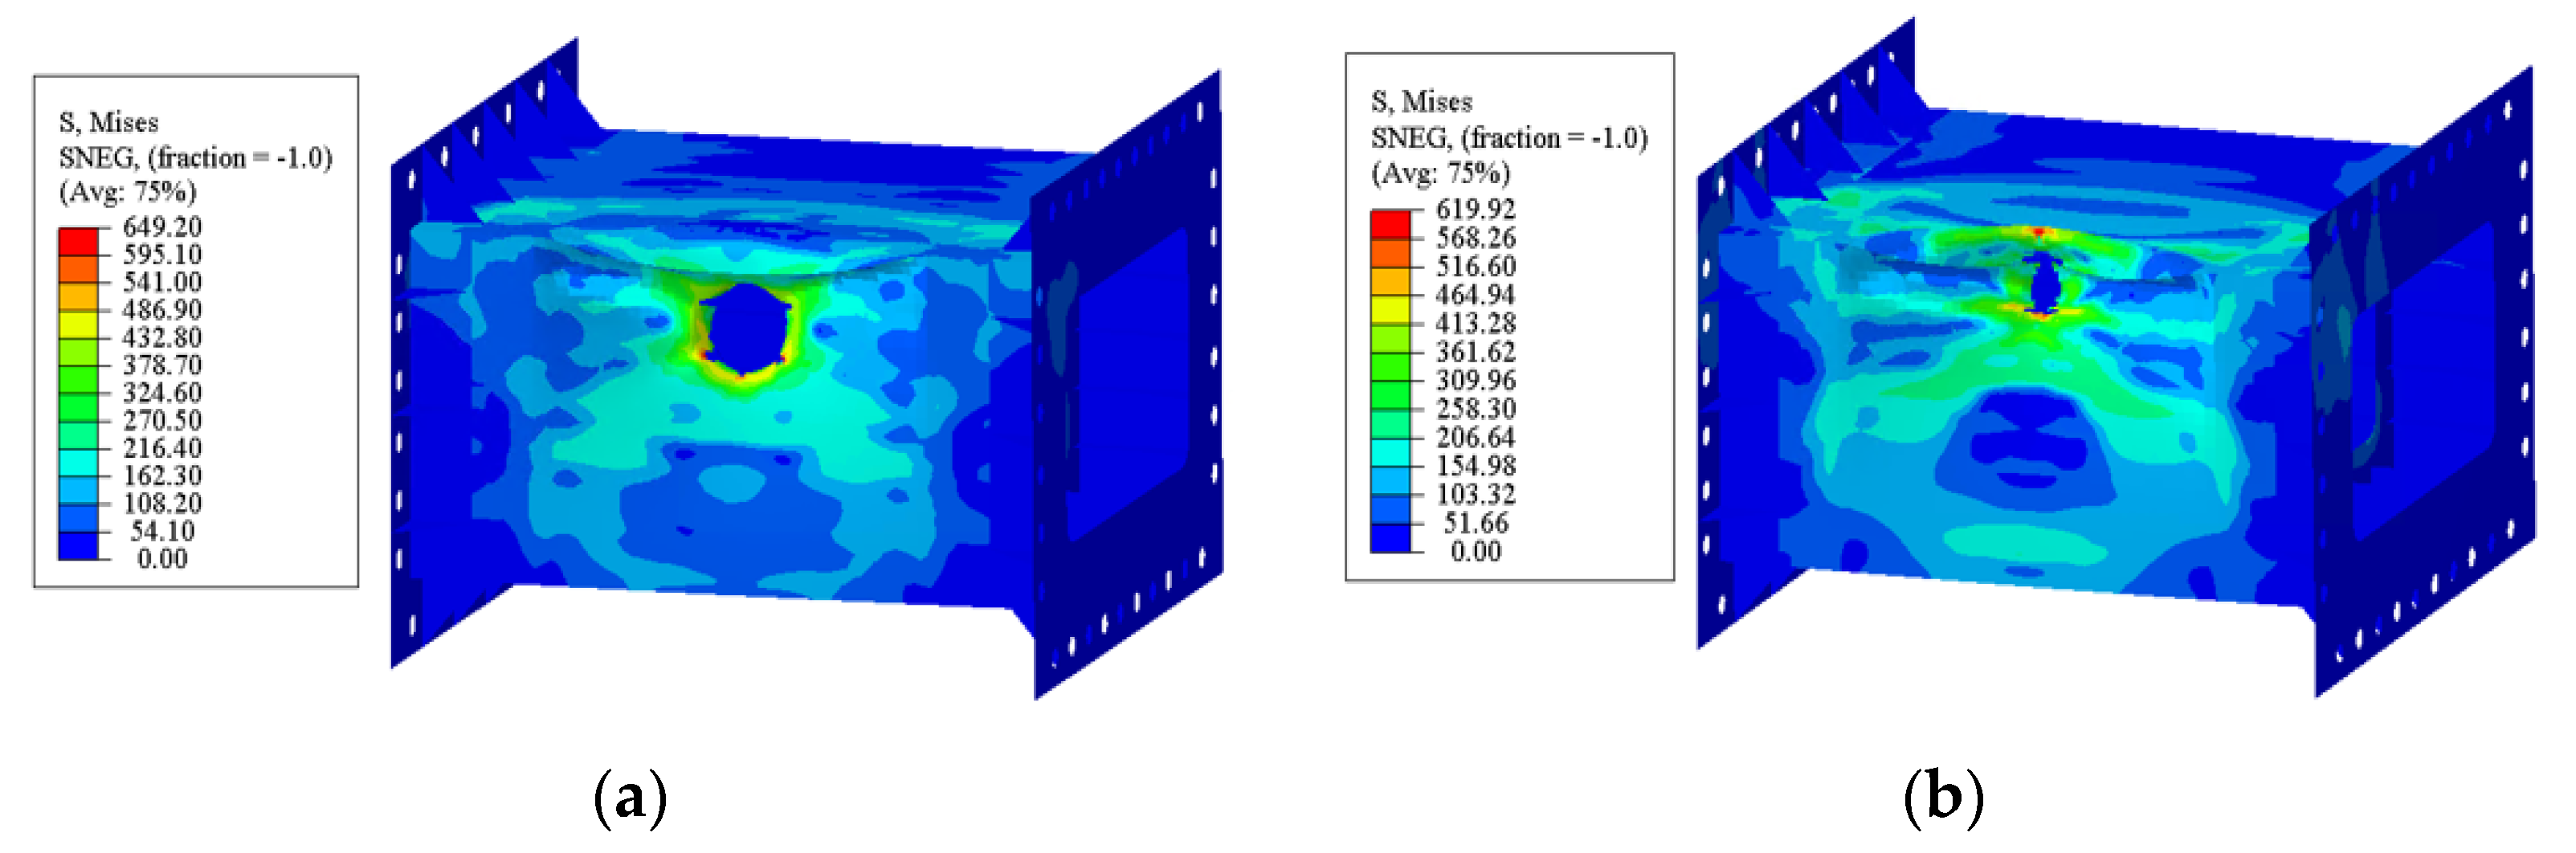
5.3. Collision Simulations

The objective of the collision analysis was to obtain the damaged shapes of the models for the subsequent bending analysis. The simulations were performed by using the nonlinear FE-dynamic explicit tools in ABAQUS. The striker was modeled as a simple rigid body. The mass and impact velocity were given through representative points. Additionally, the modeling was performed with consideration of the actual impact location and tilted striker angle. The boundary condition constrained both the displacement and rotation of the bolts that fixed the model in the actual experiment, as shown in Figure 21.
By performing numerical analyses, the collision tests were simulated, and the permanent dent depths were obtained. A comparison of the numerically predicted damage extents with those of the experiments is presented in Table 6. The ratios of the predicted-to-actual damage extents (Xm) exhibited a mean value of 1.07 and a coefficient of variation (COV) of 3.6%. The means and COVs of the ratios of the predicted-to-actual damage were in the acceptable range. Figure 22 shows a comparison between the denting-damage model from the numerical analysis and the experimental results.
Via the fracture analysis, the appropriate fracture criterion was determined for each experimental mode. The results are presented in Table 7. For the box girder model used in this study, when the element size was twice the model thickness, the shear fracture criteria were selected to be 0.23 and 0.27, in accordance with the parametric-study results. The fracture strain obtained in this study shows almost similar results to that of Ringsberg et al. [35]. Many researchers performed benchmark studies based on the results of the collision experiment and suggested a fracture strain of 0.26. The shapes of the fracture damage of the models are shown in Figure 23. A comparison of the numerically predicted fracture damage with those of the experiments is presented in Table 8. The ratios of the predicted-to-actual fracture damage exhibited a mean value of 1.04 and a coefficient of variation of 1.23%.

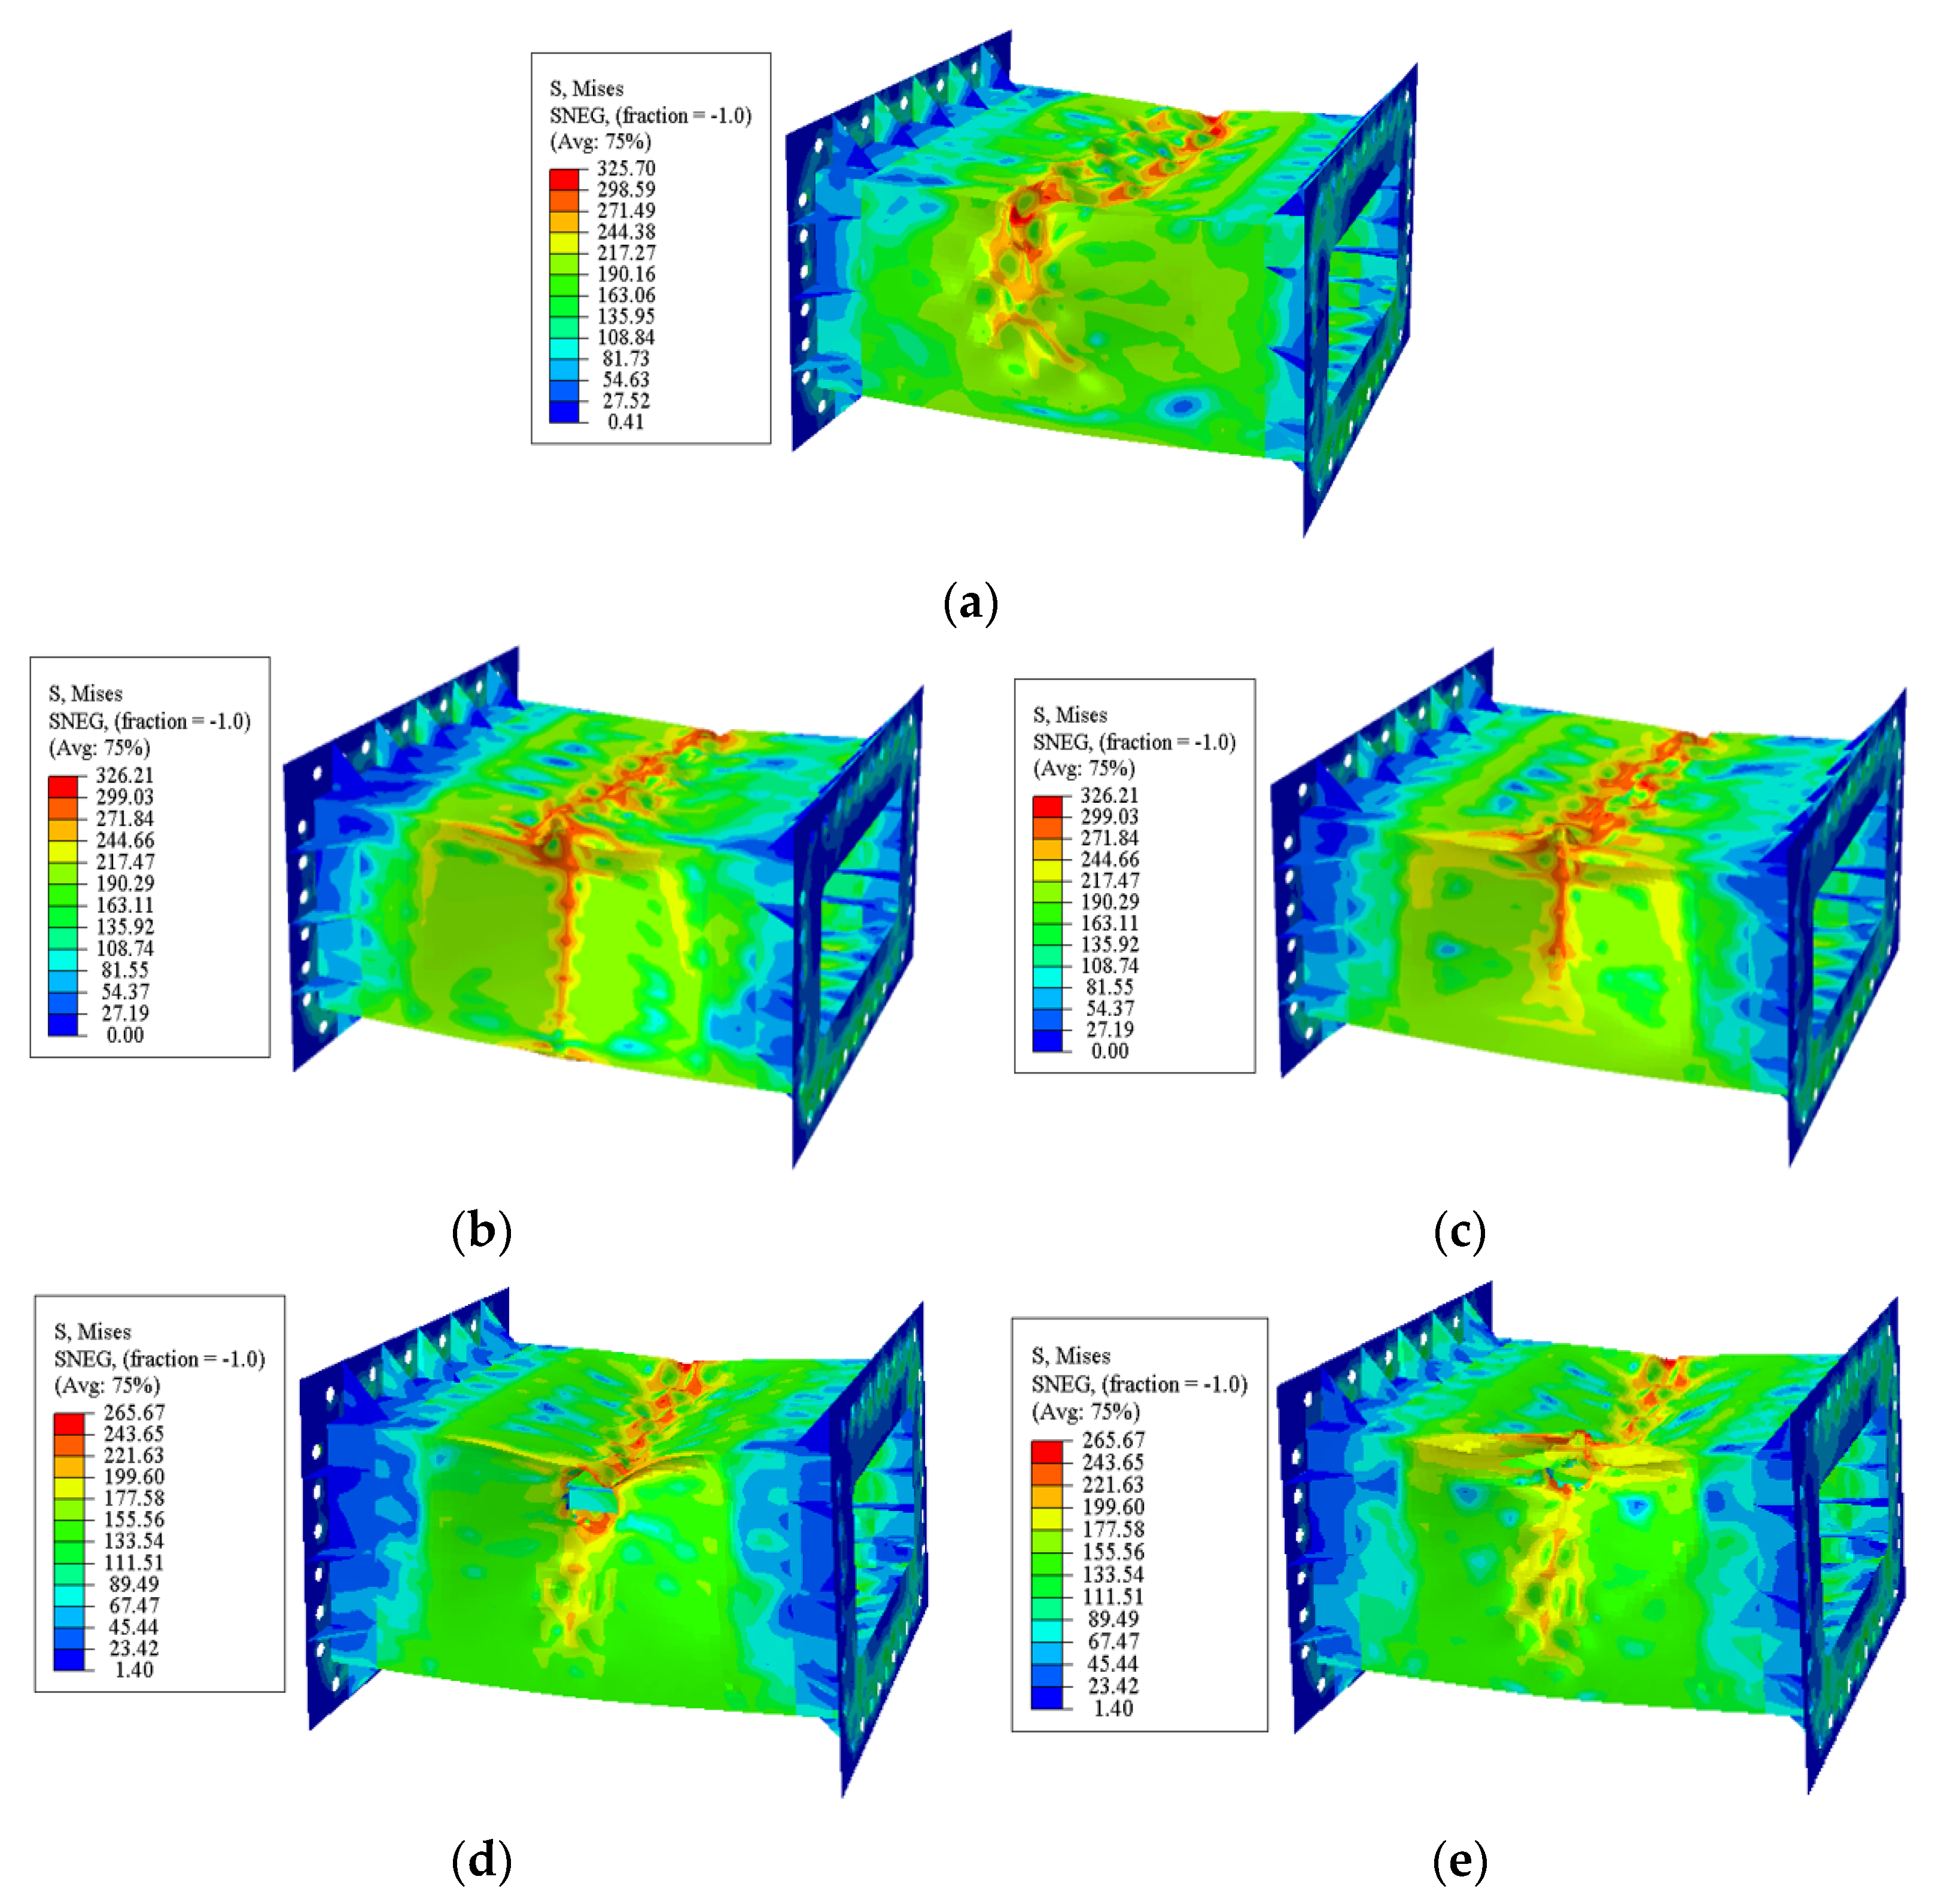
5.4. Bending Simulations

ISSC [36] and ISSC [37] reported the benchmark study results of the validation on FEM analyses to predict the ultimate strength of box girders under a pure bending moment, through comparison with model tests performed by Gordo and Guedes Soares [14]. In ISSC [36] all FEM analyses were modeled with the test section only. The bending moment was induced in these models using rigid-body multi-point constraints and incremental rotation. The simulation results show good agreement between the benchmark participants, but significant differences between the FEM and experimental results. The report concluded that in the test section model it is difficult to properly replicate the real boundary conditions from the experiment in a pure bending moment analysis applied to a prismatic section. Several researchers have also adopted this method to estimate the ultimate strength [12,38,39,40,41,42,43].
In the ISSC [37] all FEM analyses were modeled with the entire test rig represented. This allowed the actual boundary conditions used in the experiment to be represented. These analyses provide a more direct comparison to the experimental results. The results predicted a lower ultimate strength compared to the equivalent test results. The initial imperfection, material models, and boundary conditions assumed for the FEM analyses between participants may have a significant role in this discrepancy. Results from the ISSC [36], where the setup of the FEM model was more tightly controlled between participants showed much better agreement than the ISSC [37]. The report concluded that the modeling parameters and options chosen by each participant, including the exact degrees of freedom, mesh size, solver method, imperfections, residual stresses, and material model, can significantly affect the ultimate strength results using FEM. Benson et al. [38] also conducted a comparison of numerical methods to predict the collapse analysis on the box girder model using test data performed by Gordo and Guedes Soares [14]. The results showed that the differences between the numerical analysis from modeling a four-point bending test to the extended area and that from modeling only a test-section model were not significant.
In this study, the bending simulations were performed by modeling the test section only, and the vertical-bending moment was applied to two reference points at the two end sides, as shown in Figure 24. Those reference points were connected to the nodes at the boundary using kinematic coupling so that the section remained flat during rotation. In the bending analyses of the damaged box girder, the damaged model was set as an initial state to consider the residual stress caused by the collision. Figure 25 shows the results of the bending analyses of the box girder model. Figure 25a shows the collapsed shape of the Intact model IB-1. Figure 25b,c show the collapsed shape of the denting-damaged models DB-2 and DB-4, respectively. Figure 25d,e show the collapsed shape of the fracture-damaged models DB-5 and DB-7, respectively. The overall bending mode of the upper deck was observed with the plate buckling. The area initially damaged by collision on the damaged model deepened. This is consistent with the test results.

6. Discussion

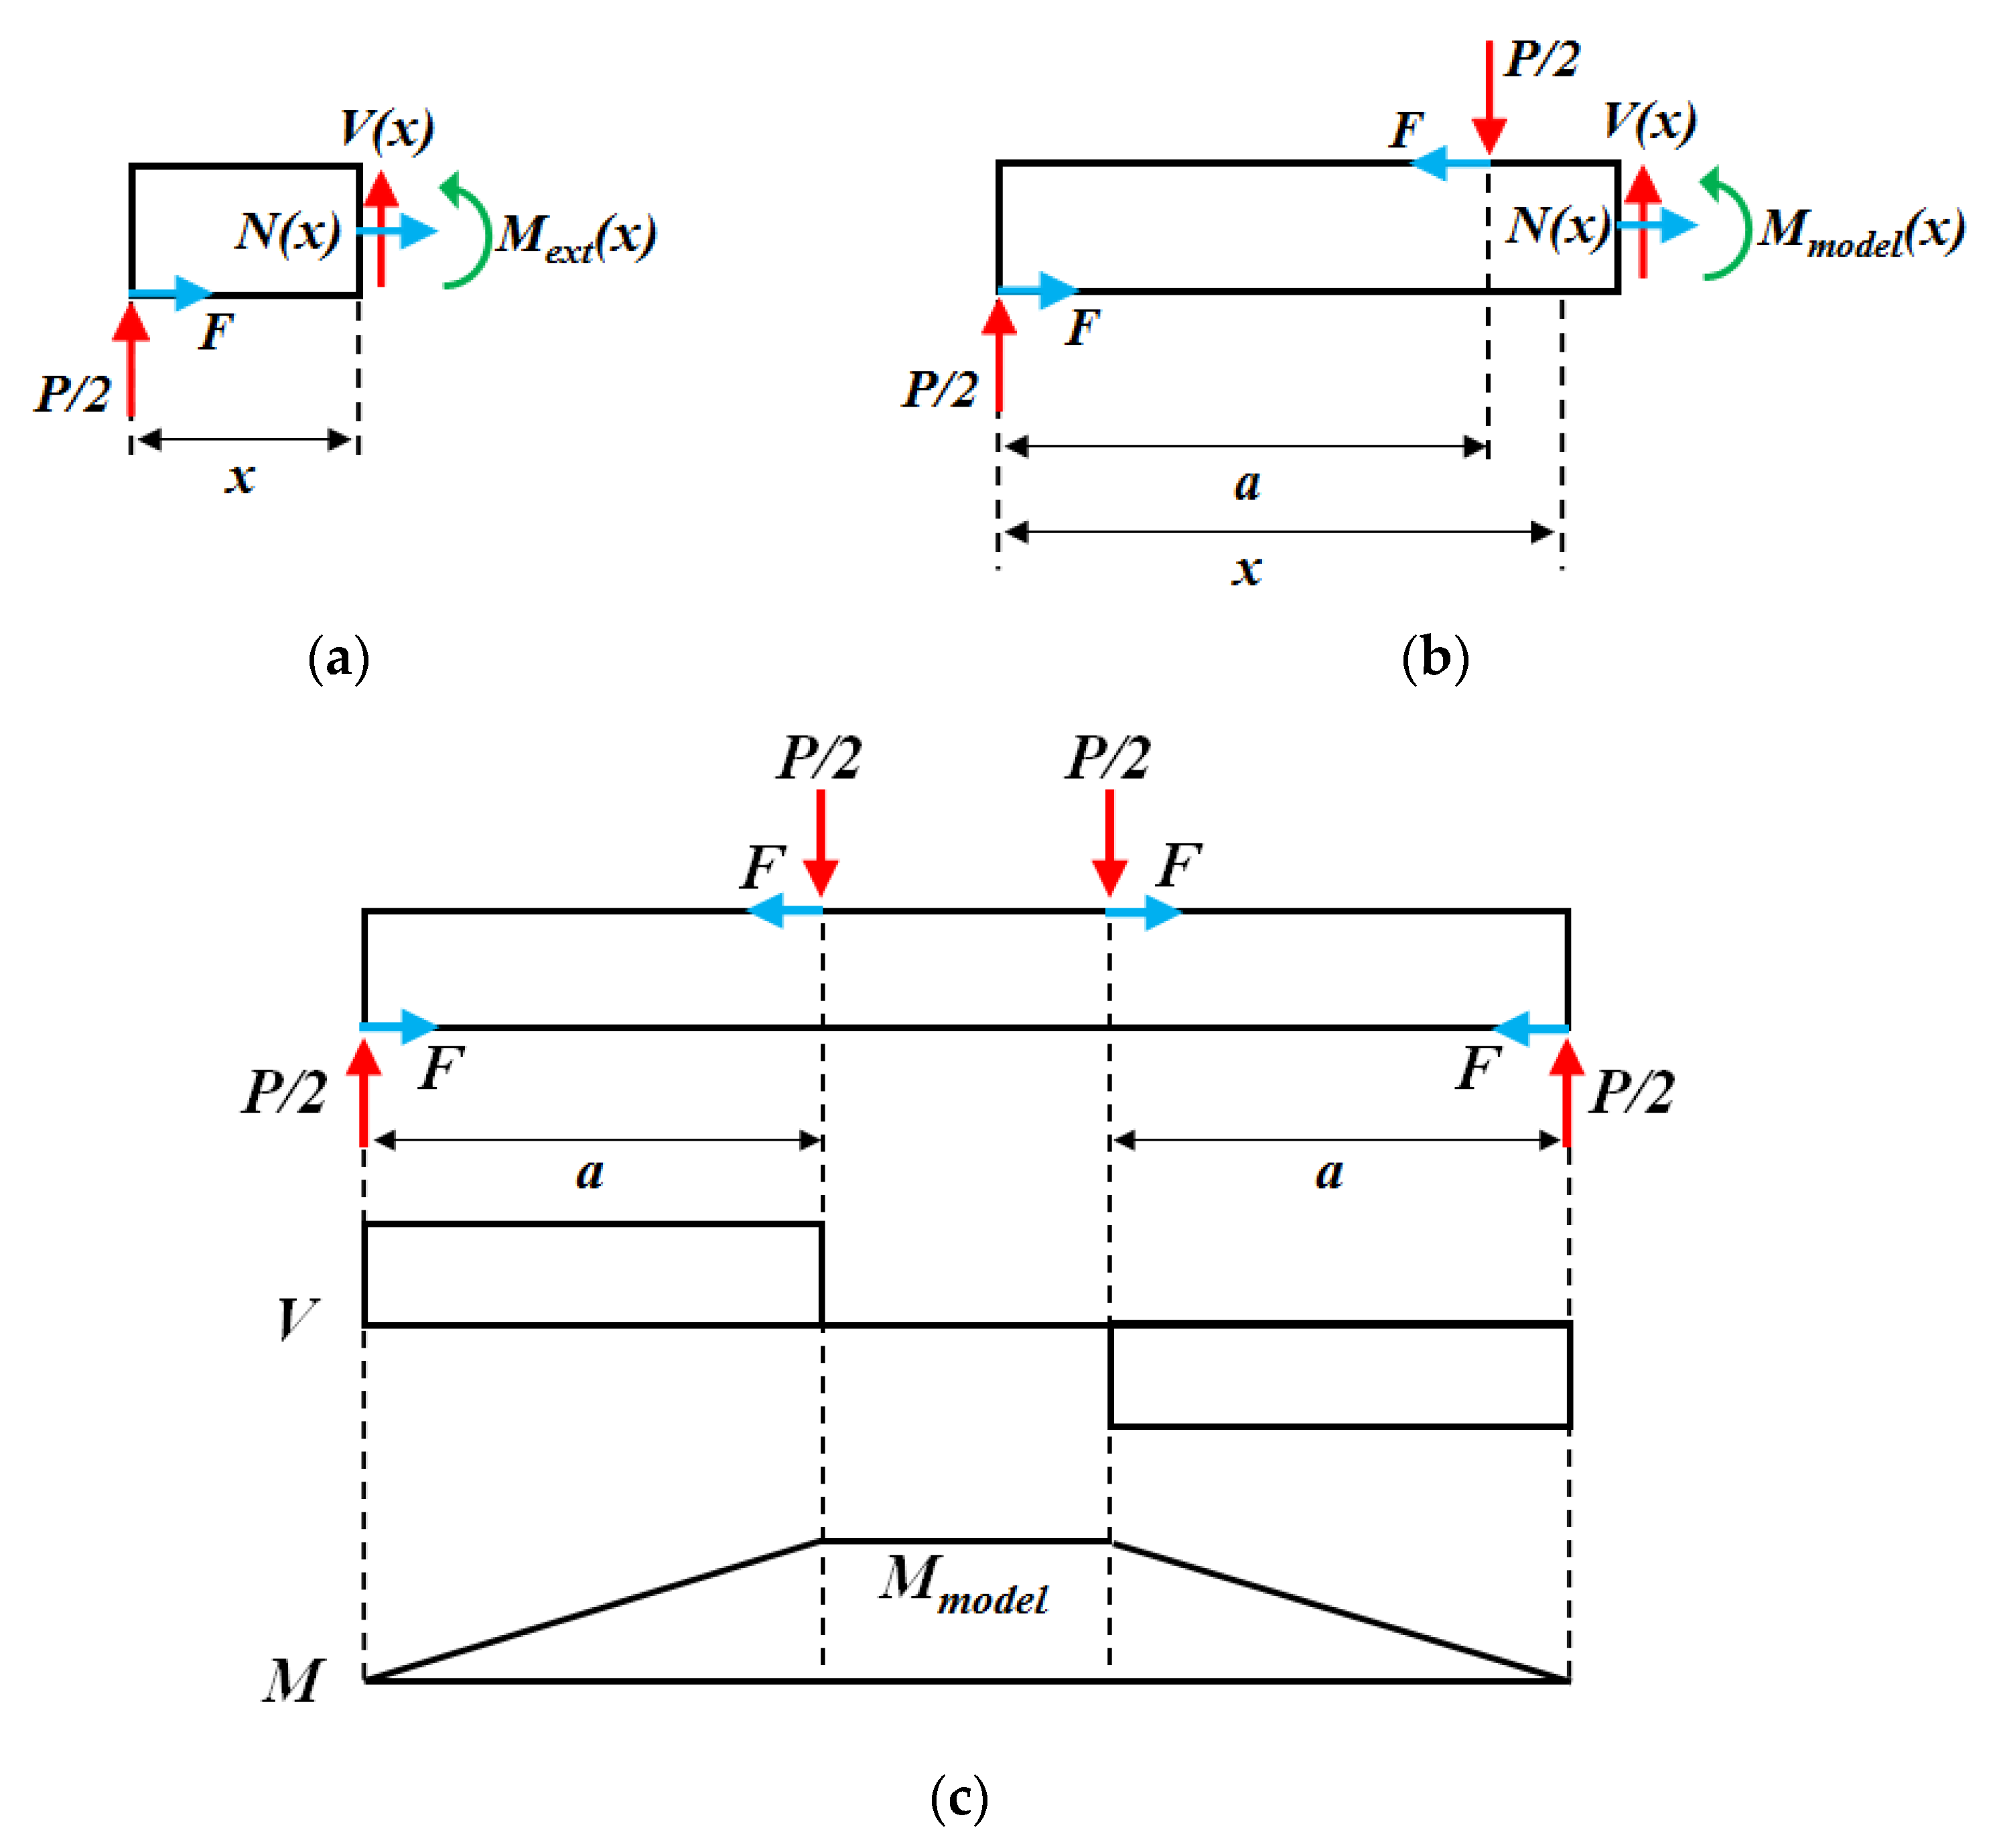
6.1. Frictional Force Estimation

Frictional forces are generated between the model and the supporting structure under a large lateral load. Therefore, the frictional forces were estimated using the strain data. The loading schematic diagram, including the frictional forces between the roller supports and extension structures, is presented in Figure 26, where P represents the applied load at the middle of the load-dividing beam; F represents the frictional force exerted on the roller; a represents the distance between a pair of rollers; b represents the distance between the outer roller and the strain gauge; d represents the web depth of the extension structure; and L represents the distance between the outer rollers.
When the frictional forces are neglected, the bending moment ( M m o d e l ) applied to the model can be calculated using Equation (5):
M m o d e l = P 2 a
However, when the frictional forces are considered, the bending moment can be estimated using Equation (6):
M m o d e l = P 2 a F d
The bending behavior of the extension structures was elastic during the experiments, as shown in Figure 16; therefore, the frictional force (F) can be estimated using Equation (7):
F = P b 2 M e x t d
where, M e x t is the bending moment applied to the extension structure.
The bending moment of the extension structures, M e x t , can be estimated using the flexure formula, as defined by Equation (8):
M e x t = E ε I y
where, E is the Young’s modulus; ε is the strain; I is the second moment of the cross-section area of the extension structure; and y is the distance from the neutral axis.
Equations (6) and (7) were obtained using Equations (9)–(14). Figure 27a shows a free-body diagram (FBD) for 0 < x < a . The equilibrium equations for the FBD are as follows. The frictional force (Equation (7)) can be obtained from Equation (11) by substituting x = b:
Σ F x = 0 : F + N ( x ) = 0   or   F = N ( x )
Σ F y = 0 : P 2 + V ( x ) = 0     o r     V ( x ) = P 2
Σ M z ,     a t   x = 0 = 0 : V ( x ) · x N ( x ) · d 2 + M e x t ( x ) = 0   or   P 2 x + F d 2 + M e x t ( x ) = 0
Figure 27b shows the FBD for a < x < L / 2 . The equilibrium equations for the FBD are as follows. The ultimate bending moment considering the frictional force (Equation (6)) can be obtained using Equation (14):
Σ F x = 0 : F F + N ( x ) = 0   or   N ( x ) = 0
Σ F y = 0 : P 2 P 2 + V ( x ) = 0   o r   V ( x ) = 0
Σ M z ,     a t   x = 0 = 0 : P 2 a + F d V ( x ) · x N ( x ) · d 2 + M m o d e l ( x ) = 0 or   M m o d e l ( x ) = P 2 a F d
In Table 9, the ultimate bending moments obtained by neglecting the frictional forces are compared with those obtained by considering the frictional forces. When the frictional forces were considered, the ultimate bending moments were reduced from 4% to 18%. Hence, the frictional forces of the round bars must be considered. When performing the bending tests, the frictional force of the round bar must be measured, or a Teflon plate must be inserted above and below the round bar to reduce the frictional force. If the frictional force of the round bar is not considered, the strength of the hull girder will be overestimated.

6.2. The Comparison of the Predicted Ultimate Bending Moment

The results of the bending analysis were compared with the test results and are presented in Table 10. The comparative analysis indicated that the average difference (Xm1) between the bending analysis results and the test results neglecting the frictional force was 0.96, with a COV of 2.31%. A reasonable agreement between the numerical prediction and test results was observed. However, when the frictional force was considered, the mean (Xm2) of the ultimate bending moment for the experimental and numerical results was 0.85, with a COV of 6.44%. The two results were significantly different because the frictional force was not considered in the bending simulation.

6.3. The Residual Strength of the Damaged Model

The deteriorating effects of the denting and fracture damages are presented in Table 11 and Table 12, respectively. For the denting and fracture damages, the strength reductions are in the ranges of 1.6–12.9% and 5.4–14.9%, respectively. In the case of model DB-8, the impact energy is about 40% larger than those of models DB-2 and DB-4, but the reduction of strength is smaller. The reductions of ultimate strength show a significant difference depending on the impact energy and impact location of the striker, and the deformation shape of the model.

7. Conclusions

The objective of this study was to analyze the effect of denting and fracture damages on the ultimate longitudinal strength and to investigate the frictional forces exerted to the roller supports between the load-dividing beam and the extension structures. A series of collapse tests were performed on ten box girder models under a pure bending moment using a four-point bending jig. Additionally, numerical analyses were conducted to predict the extent of the damage to the box girder models due to a side collision and the residual longitudinal strengths of these models. According to the results, the following conclusions are drawn.
Compared with the central collision tests, the denting damage to the box girder models in eccentric collision tests was 41–56% larger. However, the reductions in the residual strengths were minimal. There were only 6–9% further reductions in the residual strengths. Similarly, the further reductions of the residual strength were only 2–4%, even though the fracture damage of the models at ‘Impact location 1′ was 17–58% greater than that at ‘Impact location 2’.
In the NLFEA conducted in this study, the numerical models predicted the denting and fracture damage and the ultimate bending moment. The results of the numerical calculations are compared with those of the experiment, and they concur. The difference between the collision simulation and the experimental results is 7% and 4% on average for denting and fracture damage, respectively, and the difference between the bending simulation and the test results is 4% on average.
When considering the frictional force between the round bars and the girder model, the ultimate longitudinal moments were reduced by 12% (on average) compared with those obtained by neglecting the frictional forces. If the frictional force of the round bar is not considered, the bending strength of the hull girder will be overestimated.
Residual strength tests of the damaged box girder structure whose damages were generated by dynamic mass impacts, which are rarely reported in the open literature, were successfully performed. In particular, the results of the collision tests include the initial plastic deformation and residual stress caused by the dynamic impact, unlike the experiments conducted by other researchers [24,25,26]. Thus, the test results of this study can be valuable to researchers for the validation of numerical techniques and analytical methods to develop design guidelines.
From the outcomes of these experimental and numerical investigations, the following recommendations are provided:
-
The numerical analysis technique adopted in this study can be a reference for future simulations predicting the collision damage and residual bending strength;
-
When performing longitudinal bending tests, it is necessary to experimentally obtain frictional forces between the test model and the supports.

Author Contributions

Conceptualization, S.-H.P. and S.-R.C.; methodology, S.-H.Y., T.M. and Q.T.D.; software, S.-H.P.; validation, S.-H.Y., T.M. and Q.T.D.; formal analysis, S.-H.P.; investigation, S.-H.P., S.-H.Y., T.M. and Q.T.D.; resources, S.-H.P., S.-H.Y., T.M. and Q.T.D.; data curation, S.-H.Y., T.M. and Q.T.D.; writing—original draft preparation, S.-H.P. and S.-R.C.; writing—review and editing, S.-H.P. and S.-R.C.; visualization, S.-H.P.; supervision, S.-R.C.; project administration, S.-R.C.; funding acquisition, S.-R.C. All authors have read and agreed to the published version of the manuscript.

Funding

This research received no external funding.

Institutional Review Board Statement

Not applicable.

Informed Consent Statement

Not applicable.

Conflicts of Interest

The authors declare no conflict of interest.

References

  1. International Association of Classification Societies (IACS). Common Structural Rules for Bulk Carriers and Oil Tankers; International Association of Classification Societies (IACS): London, UK, 2022. [Google Scholar]
  2. Sugimura, T.; Nozaki, M.; Suzuki, T. Destructive experiment of ship hull model under longitudinal bending. J. Soc. Nav. Archit. Jpn. 1966, 119, 209–220. [Google Scholar] [CrossRef]
  3. Dowling, P.J.; Moolani, F.M.; Frieze, P.A. The effect of shear lag on the Ultimate strength of Box girders. In Proceedings of the International Congress on Steel Plated Structures, London, UK, 20–21 July 1976; Imperial College: London, UK; pp. 108–147. [Google Scholar]
  4. Reckling, K.A. Behaviour of box girders under bending and shear. In Proceedings of the 7th International Ship and Offshore Structures Congress (ISSC), Paris, France, August 1979; pp. 46–49. [Google Scholar]
  5. Nishihara, S. Analysis of ultimate strength of stiffened rectangular plate. J. Soc. Nav. Archit. Jpn. 1983, 154, 367–375. [Google Scholar] [CrossRef] [PubMed]
  6. Mansour, A.E.; Yang, J.M.; Thayamballi, A. An Experimental Investigation of Ship Hull Ultimate Strength. Trans. SNAME 1990, 98, 411–439. [Google Scholar]
  7. Dow, R.S. Testing and analysis of 1/3-scale welded steel frigate model. In Proceedings of the 2nd International Conference on Advances in Marine Structures, Dunfermline, Scotland, UK, 21–24 May 1991; pp. 749–773. [Google Scholar]
  8. Paik, J.K.; Amlashi, H.; Boon, B.; Branner, K.; Caridis, P.; Das, P.; Fujikubo, M.; Huang, C.-H.; Josefson, L.; Kaeding, P.; et al. Committee III.1 Ultimate strength. In Proceedings of the 18th International Ship and Offshore Structures Congress (ISSC), Rostock, Germany, 10–13 September 2012; Volume 1, pp. 285–363. [Google Scholar]
  9. Akhras, G.; Gibson, S.; Yang, S.; Morchat, R. Ultimate strength of a box girder simulating the hull of a ship. Can. J. Civ. Eng. 1998, 25, 829–843. [Google Scholar] [CrossRef]
  10. Qi, E.R.; Cui, W.C.; Wan, Z.Q. Comparative study of ultimate hull girder strength of large double hull tankers. Mar. Struct. 2005, 18, 227–249. [Google Scholar] [CrossRef]
  11. Yao, T.; Fujikubo, M.; Yanagihara, D.; Fujii, I.; Matrui, R.; Furui, N.; Kuwamura, Y. Buckling collapse strength of chip carrier under longitudinal bending (1st Report)-collapse test on 1/10-scale hull girder model under pure bending. J. Soc. Nav. Archit. Jpn. 2002, 191, 265–274. [Google Scholar]
  12. Wu, Y.-j.; Wan, Q.; Guo, J.-j. Study on the model of double hull tank for hull ultimate strength experiment. In Proceedings of the 3rd International Conference on Safety and Reliability of Ship, Offshore and Subsea Structures (SAROSS), Wuhan, China, 23–25 May 2018. [Google Scholar]
  13. Gordo, J.M.; Soares, C.G. Experimental Evaluation of the Ultimate Bending Moment of a Box Girder. Mar. Syst. Ocean Technol. 2004, 1, 33–46. [Google Scholar] [CrossRef]
  14. Gordo, J.M.; Soares, C.G. Tests on ultimate strength of hull box girders made of high tensile steel. Mar. Struct. 2009, 22, 770–790. [Google Scholar] [CrossRef]
  15. Gordo, J.M.; Soares, C.G. Experimental analysis of the effect of frame spacing variation on the ultimate bending moment of box girders. Mar. Struct. 2014, 37, 111–134. [Google Scholar] [CrossRef]
  16. Wang, C.; Wu, J.; Wang, D. Experimental and numerical investigations on the ultimate longitudinal strength of an ultra large container ship. Ocean Eng. 2019, 192, 106546. [Google Scholar] [CrossRef]
  17. Chen, X.W.; Yuan, H.X.; Real, E.; Du, X.X.; Schafer, B.W. Experimental behaviour of stainless steel plate girders under combined bending and shear. J. Constr. Steel Res. 2020, 166, 105900. [Google Scholar] [CrossRef]
  18. Zhao, N.; Chen, B.Q.; Zhou, Y.Q.; Li, Z.J.; Hu, J.J.; Soares, C.G. Experimental and numerical investigation on the ultimate strength of a ship hull girder model with deck openings. Mar. Struct. 2022, 83, 103175. [Google Scholar] [CrossRef]
  19. Saad-Eldeen, S.; Garbatov, Y.; Soares, C.G. Experimental assessment of the ultimate strength of a box girder subjected to severe corrosion. Mar. Struct. 2011, 24, 338–357. [Google Scholar] [CrossRef]
  20. Saad-Eldeen, S.; Garbatov, Y.; Soares, C.G. Analysis of plate deflections during ultimate strength experiments of corroded box girders. Thin-Walled Struct. 2012, 54, 164–176. [Google Scholar] [CrossRef]
  21. Saad-Eldeen, S.; Garbatov, Y.; Soares, C.G. Effect of corrosion severity on the ultimate strength of a steel box girder. Eng. Struct. 2013, 49, 560–571. [Google Scholar] [CrossRef]
  22. Saad-Eldeen, S.; Garbatov, Y.; Soares, C.G. Ultimate strength assessment of corroded box girders. Ocean Eng. 2013, 58, 35–47. [Google Scholar] [CrossRef]
  23. Saad-Eldeen, S.; Garbatov, Y.; Soares, C.G. Strength assessment of a severely corroded box girder subjected to bending moment. J. Constr. Steel Res. 2014, 92, 90–102. [Google Scholar] [CrossRef]
  24. Lee, T.K.; Rim, C.W. An experimental study on the ultimate longitudinal strength of ship structures damaged due to side collision. J. Korean Soc. Mar. Environ. Eng. 2008, 22, 85–90. [Google Scholar]
  25. Rim, C.W.; Lee, T.K.; Han, D.S.; Kim, B.H.; Lee, J.M.; Kim, K.S. The effect of bottom damage size of stranded ship on ultimate strength. In Proceedings of the 27th International Conference on Ocean, Offshore and Arctic Engineering (OMAE), Estoril, Portugal, 15–20 June 2008. [Google Scholar]
  26. Yamada, Y.; Takami, T. Model test on the ultimate longitudinal strength of a damaged box girder. In Analysis and Design of Marine Structures; CRC Press: Boca Raton, FL, USA, 2015. [Google Scholar]
  27. Cho, S.-R.; Yoon, S.-H.; Park, S.-H.; Song, S.-U. Collision damage and residual strength of box girder structures. In Proceedings of the 7th International Conference on Collision and Grounding of Ships and Offshore Structures (ICCGS), Ulsan, Republic of Korea, 21–23 October 2016. [Google Scholar]
  28. Cho, S.-R.; Park, S.-H.; Cho, M.T.; Shin, H.K. Residual longitudinal strength of damaged box girder structures. In Proceedings of the 37th International Conference on Ocean, Offshore and Arctic Engineering (OMAE), Madrid, Spain, 17–22 June 2018. [Google Scholar]
  29. KS B 0801; Test Pieces for Tensile Test for Metallic Materials. Korean Standards Association: Seoul, Republic of Korea, 2007.
  30. Do, Q.T.; Muttaqie, T.; Park, S.-H.; Shin, H.K.; Cho, S.R. Predicting the collision damage of steel ring-stiffened cylinders and their residual strength under hydrostatic pressure. Ocean Eng. 2018, 169, 326–343. [Google Scholar] [CrossRef]
  31. Do, Q.T.; Muttaqie, T.; Park, S.-H.; Shin, H.K.; Cho, S.-R. Ultimate strength of intact and dented steel stringer-stiffened cylinders under hydrostatic pressure. Thin-Walled Struct. 2018, 132, 442–460. [Google Scholar]
  32. Faulkner, D. Chapter 21 in Ship structural design concepts. In Compression Strength of Welded Grillage; Evans, J.H., Ed.; Cornell Maritime Press: Cambridge, MD, USA, 1975; pp. 633–712. [Google Scholar]
  33. Yao, T.; Astrup, O.C.; Caridis, P.; Chen, Y.N.; Cho, S.-R.; Dow, R.S.; Niho, O.; Rigo, P. Special Task Committee VI.2 Ultimate hull girder strength. In Proceedings of the 4th International Ship and Offshore Structures Congress (ISSC), Nagasaki, Japan, 2–6 October 2000. [Google Scholar]
  34. Cho, S.-R.; Choi, S.I.; Son, S.K. Dynamic material properties of marine steels under impact loadings. In Proceedings of the World Congress on Advances in Structural Engineering and Mechanics (ASEM15), Incheon, Republic of Korea, 25–29 August 2015. [Google Scholar]
  35. Ringsberg, J.W.; Amdahl, J.; Chen, B.Q.; Cho, S.R.; Ehlers, S.; Hu, Z.; Kubiczek, J.M.; Kõrgesaar, M.; Liu, Q.; Marinatos, J.M.; et al. MARSTRUCT benchmark study on nonlinear FE simulation of an experiment of an indenter impact with a ship side-shell structure. Mar. Struct. 2018, 59, 142–157. [Google Scholar] [CrossRef] [Green Version]
  36. Yoshikawa, T.; Bayatfar, A.; Kim, B.J.; Chen, C.P.; Wang, D.; Boulares, J.; Gordo, J.M.; Josefson, L.; Smith, M.; Kaeding, P.; et al. Committee III.1 Ultimate strength. In Proceedings of the 19th International Ship and Offshore Structures Congress (ISSC), Lisbon, Portugal, 7–10 September 2015; Volume 1, pp. 279–349. [Google Scholar]
  37. Czujko, J.; Bayatfar, A.; Smith, M.; Xu, M.C.; Wang, D.; Lützen, M.; Saad-Eldeen, S.; Yanagihara, D.; Notaro, G.; Qian, X.; et al. Committee III.1 Ultimate strength. In Proceedings of the 20th International Ship and Offshore Structures Congress (ISSC), Amsterdam, The Netherlands, 9–14 September 2018; Volume 1, pp. 335–439. [Google Scholar]
  38. Benson, S.; AbuBakar, A.; Dow, R.S. A comparison of computational methods to predict the progressive collapse behavior of a damaged box girder. Eng. Struct. 2013, 48, 266–280. [Google Scholar] [CrossRef] [Green Version]
  39. Morshedsoluk, F.; Khedmati, M.R. Ultimate strength of composite ships’ hull girders in the presence of composite superstructures. Thin-Walled Struct. 2016, 102, 122–138. [Google Scholar] [CrossRef]
  40. Ao, L.; Wang, D.Y. Ultimate torsional strength of cracked stiffened box girders with a large deck opening. Int. J. Nav. Archit. Ocean Eng. 2016, 8, 360–374. [Google Scholar] [CrossRef]
  41. Underwood, J.M.; Sobey, A.J.; Blake, J.I.R.; Shenoi, R.A. Compartment level progressive collapse strength as a method for analysing damaged steel box girders. Thin-Walled Struct. 2016, 106, 346–357. [Google Scholar] [CrossRef] [Green Version]
  42. Putranto, T.; Kõrgesaar, M.; Tabri, K. Application of Equivalent Single Layer Approach for Ultimate Strength Analyses of Ship Hull Girder. J. Mar. Sci. Eng. 2022, 10, 1530. [Google Scholar] [CrossRef]
  43. Li, S.; Kim, D.K. A comparison of numerical methods for damage index based residual ultimate limit state assessment of grounded ship hulls. Thin-Walled Struct. 2022, 172, 108854. [Google Scholar] [CrossRef]
Figure 1. Dimensions of the box girder: (a) deck plan; (b) side plan and longitudinal stiffener; (c) cross section; (d) transverse frame; (e) end plate (unit: mm).
Jmse 11 00076 g001aJmse 11 00076 g001b
Figure 2. Measurements of the initial shape imperfection of the model.
Jmse 11 00076 g002
Figure 3. Plots of the initial imperfection measurement: (a) IB-2; (b) DB-8 (dotted line represents the longitudinal stiffeners and transverse frame).
Jmse 11 00076 g003
Figure 4. The experimental setup for the dynamic collision tests.
Jmse 11 00076 g004
Figure 5. Striker dimensions: (a) knife-edge striker; (b) conical striker with a hemispherical tip.
Jmse 11 00076 g005aJmse 11 00076 g005b
Figure 6. Impact locations of the collision test: (a) denting damage; (b) fracture damage.
Jmse 11 00076 g006
Figure 7. The deformed shape of the model: (a) DB-2: exterior view (showing locations A and B where the dent depth were measured); (b) DB-2: interior view; (c) DB-4: exterior view; (d) DB-4: interior view.
Jmse 11 00076 g007
Figure 8. The deformed shape of the model: (a) DB-5: exterior view; (b) DB-5: interior view; (c) DB-7: exterior view; (d) DB-7: interior view.
Jmse 11 00076 g008aJmse 11 00076 g008b
Figure 9. The four-point bending-test setup.
Jmse 11 00076 g009
Figure 10. Overall dimensions of the four-point bending-test jig.
Jmse 11 00076 g010
Figure 11. The VICON motion system measuring the lateral deflections of the model.
Jmse 11 00076 g011
Figure 12. The strain gauge arrangement.
Jmse 11 00076 g012
Figure 13. Collapsed shapes of the models: (a) IB-1; (b) IB-2; (c) DB-2; (d) DB-4; (e) DB-5; (f) DB-7.
Jmse 11 00076 g013aJmse 11 00076 g013b
Figure 14. Deformed shapes of the longitudinal stiffeners—model DB-7: (a) deck; (b) damaged area.
Jmse 11 00076 g014
Figure 15. Loading and unloading histories: (a) Group A; (b) Group B.
Jmse 11 00076 g015
Figure 16. Strain histories of the extension structures (SG7): (a) Group A; (b) Group B.
Jmse 11 00076 g016
Figure 17. The process of FE modeling considering the initial shape imperfection.
Jmse 11 00076 g017
Figure 18. Numerical modeling of the experimental model.
Jmse 11 00076 g018
Figure 19. Results of the mesh convergence tests with tendency line.
Jmse 11 00076 g019
Figure 20. A typical true stress–strain curve applied for the FE analysis.
Jmse 11 00076 g020
Figure 21. Numerical modeling and boundary condition for the collision simulation.
Jmse 11 00076 g021
Figure 22. Denting-damaged models after the side collision: (a) DB-2; (b) DB-4.
Jmse 11 00076 g022
Figure 23. Fracture-damaged models after the side collision: (a) DB-5; (b) DB-7.
Jmse 11 00076 g023
Figure 24. The numerical modeling and boundary condition for the bending simulation.
Jmse 11 00076 g024
Figure 25. Collapsed shapes of the box girder models: (a) IB-1; (b) DB-2; (c) DB-4; (d) DB-5; (e) DB-7.
Jmse 11 00076 g025
Figure 26. The loading schematic of the four-point bending test.
Jmse 11 00076 g026
Figure 27. The free-body, shear-force, and bending-moment diagrams: (a) FBD when 0 < x < a ; (b) FBD when a < x < L / 2 ; (c) The shear-force and bending-moment diagrams.
Jmse 11 00076 g027
Table 1. Material properties of the test models.
Parent PlateActual Thick. (mm)Young’s Modulus
(MPa)
Yield Strength
(MPa)
Ultimate Tensile
Strength (MPa)
MeanCOV (%)MeanCOV (%)MeanCOV (%)
Group A2.91205,0002.76325.70.28399.20.15
5.88207,0001.25234.81.84353.40.52
Group B2.84208,0002.52222.90.74329.20.23
5.74210,0000.21269.00.81408.90.66
Table 2. Initial imperfection measurement results for the deck plates.
ModelMax. Positive Imperfection (mm)Max. Negative Imperfection (mm)
IB-12.5130.737
DB-12.4582.525
DB-22.9520.000
DB-32.2590.156
DB-43.0791.717
IB-22.6931.789
DB-53.0960.983
DB-61.6961.403
DB-71.8101.620
DB-81.4922.005
Table 3. Conditions of the collision tests: denting damage.
ModelDB-1DB-2DB-3DB-4
Impact locationCenterCenterCornerCorner
Striker mass (kg)400400400400
Drop height (m)1.21.61.21.6
Collision velocity (m/s)4.855.604.855.60
Impact energy (kJ)4.716.284.716.28
Permanent dent depth (mm)1 A: 22.4
B: 20.0
A: 28.8
B: 23.6
31.644.9
1 Locations of points A and B can be found in Figure 7a.
Table 4. Conditions of the collision tests: fracture damage.
ModelDB-5DB-6DB-7DB-8
Impact location1122
Striker mass (kg)570570570570
Drop height (m)1.91.61.91.6
Collision velocity (m/s)6.115.606.115.60
Impact energy (kJ)10.628.9510.628.95
Diagonal length (mm)137.687.378.174.4
Table 5. The maximum applied load of each model.
Group A
Stiffened Web Height = 40 mm
Yield Strength = 325.7 MPa
Group B
Stiffened Web Height = 30 mm
Yield Strength = 222.9 MPa
ModelPermanent Dent Depth (mm)Max. Load
(ton)
ModelDiagonal Fracture Length (mm)Max. Load (ton)
IB-1-70.5IB-2-47.0
DB-122.467.5DB-5137.638.6
DB-228.863.8DB-687.340.2
DB-331.664.8DB-778.141.0
DB-444.962.3DB-874.445.4
Table 6. Comparison of the numerical predictions with the experiment results: Denting damage.
ModelPermanent Dent Depth (mm)Xm (Num./Exp.)
ExperimentNumerical
DB-122.425.31.13
DB-228.830.41.06
DB-331.633.01.04
DB-444.947.61.06
Mean1.07
COV3.60%
Table 7. The shear criteria for the fracture damage.
ModelMesh Size/ThicknessShear Criterion
DB-520.23
DB-60.27
DB-70.27
DB-80.23
Table 8. The comparison of the numerical predictions with the experiment results: Fracture damage.
ModelDiagonal Length (mm)Xm (Num./Exp.)
ExperimentNumerical
DB-5137.6144.51.05
DB-687.390.81.04
DB-778.179.71.02
DB-874.477.51.04
Mean1.04
COV1.23%
Table 9. Effects of the frictional force on the ultimate bending-moment estimations.
ModelUltimate Bending Moment, Mult (kN·m)Xm (2)/(1)
Neglecting Friction (1)Considering Friction (2)
IB-1466.8397.20.85
DB-1447.0390.80.87
DB-2422.1368.50.87
DB-3430.6353.10.82
DB-4416.6346.00.83
IB-2313.1283.00.90
DB-5257.4240.80.94
DB-6267.4256.80.96
DB-7273.1245.20.90
DB-8301.0267.60.89
Mean0.88
COV4.97%
Table 10. The comparison of the numerical predictions with the test results: bending simulation.
ModelUltimate Bending Moment (kN·m)Xm1
(Exp. (1)/Num.)
Xm2
(Exp. (2)/Num.)
Exp. (1) 1Exp. (2) 2Num.3
IB-1466.8397.2501.60.930.79
DB-1447.0390.8446.61.000.88
DB-2422.1368.5438.90.960.84
DB-3430.6353.1457.50.940.77
DB-4416.6346.0441.70.940.78
IB-2313.1283.0319.20.980.89
DB-5257.4240.8267.10.960.90
DB-6267.4256.8273.90.980.94
DB-7273.1245.2286.20.950.86
DB-8301.0267.6305.10.990.88
Mean0.960.85
COV2.31%6.44%
1 Experimental results neglecting the frictional force. 2 Experimental results considering the frictional force. 3 Numerical simulation results.
Table 11. The results of the longitudinal-bending tests: denting damage.
ModelImpact Energy
(kJ)
Dent Depth
(mm)
Mult (kN·m)Reduction of Mult (kN·m)
IB-1--397.2-
DB-14.7122.4390.86.4 (1.6%)
DB-26.2828.8368.528.7 (7.2%)
DB-34.7131.6353.144.1 (11.1%)
DB-46.2844.9346.051.2 (12.9%)
Table 12. The results of the longitudinal-bending tests: fracture damage.
ModelImpact Energy
(kJ)
Diagonal Length
(mm)
Mult (kN·m)Reduction of Mult (kN·m)
IB-2--283.0-
DB-510.62137.6240.842.2 (14.9%)
DB-68.9587.3256.826.2 (9.3%)
DB-710.6278.1245.237.8 (13.4%)
DB-88.9574.4267.615.4 (5.4%)
Disclaimer/Publisher’s Note: The statements, opinions and data contained in all publications are solely those of the individual author(s) and contributor(s) and not of MDPI and/or the editor(s). MDPI and/or the editor(s) disclaim responsibility for any injury to people or property resulting from any ideas, methods, instructions or products referred to in the content.

