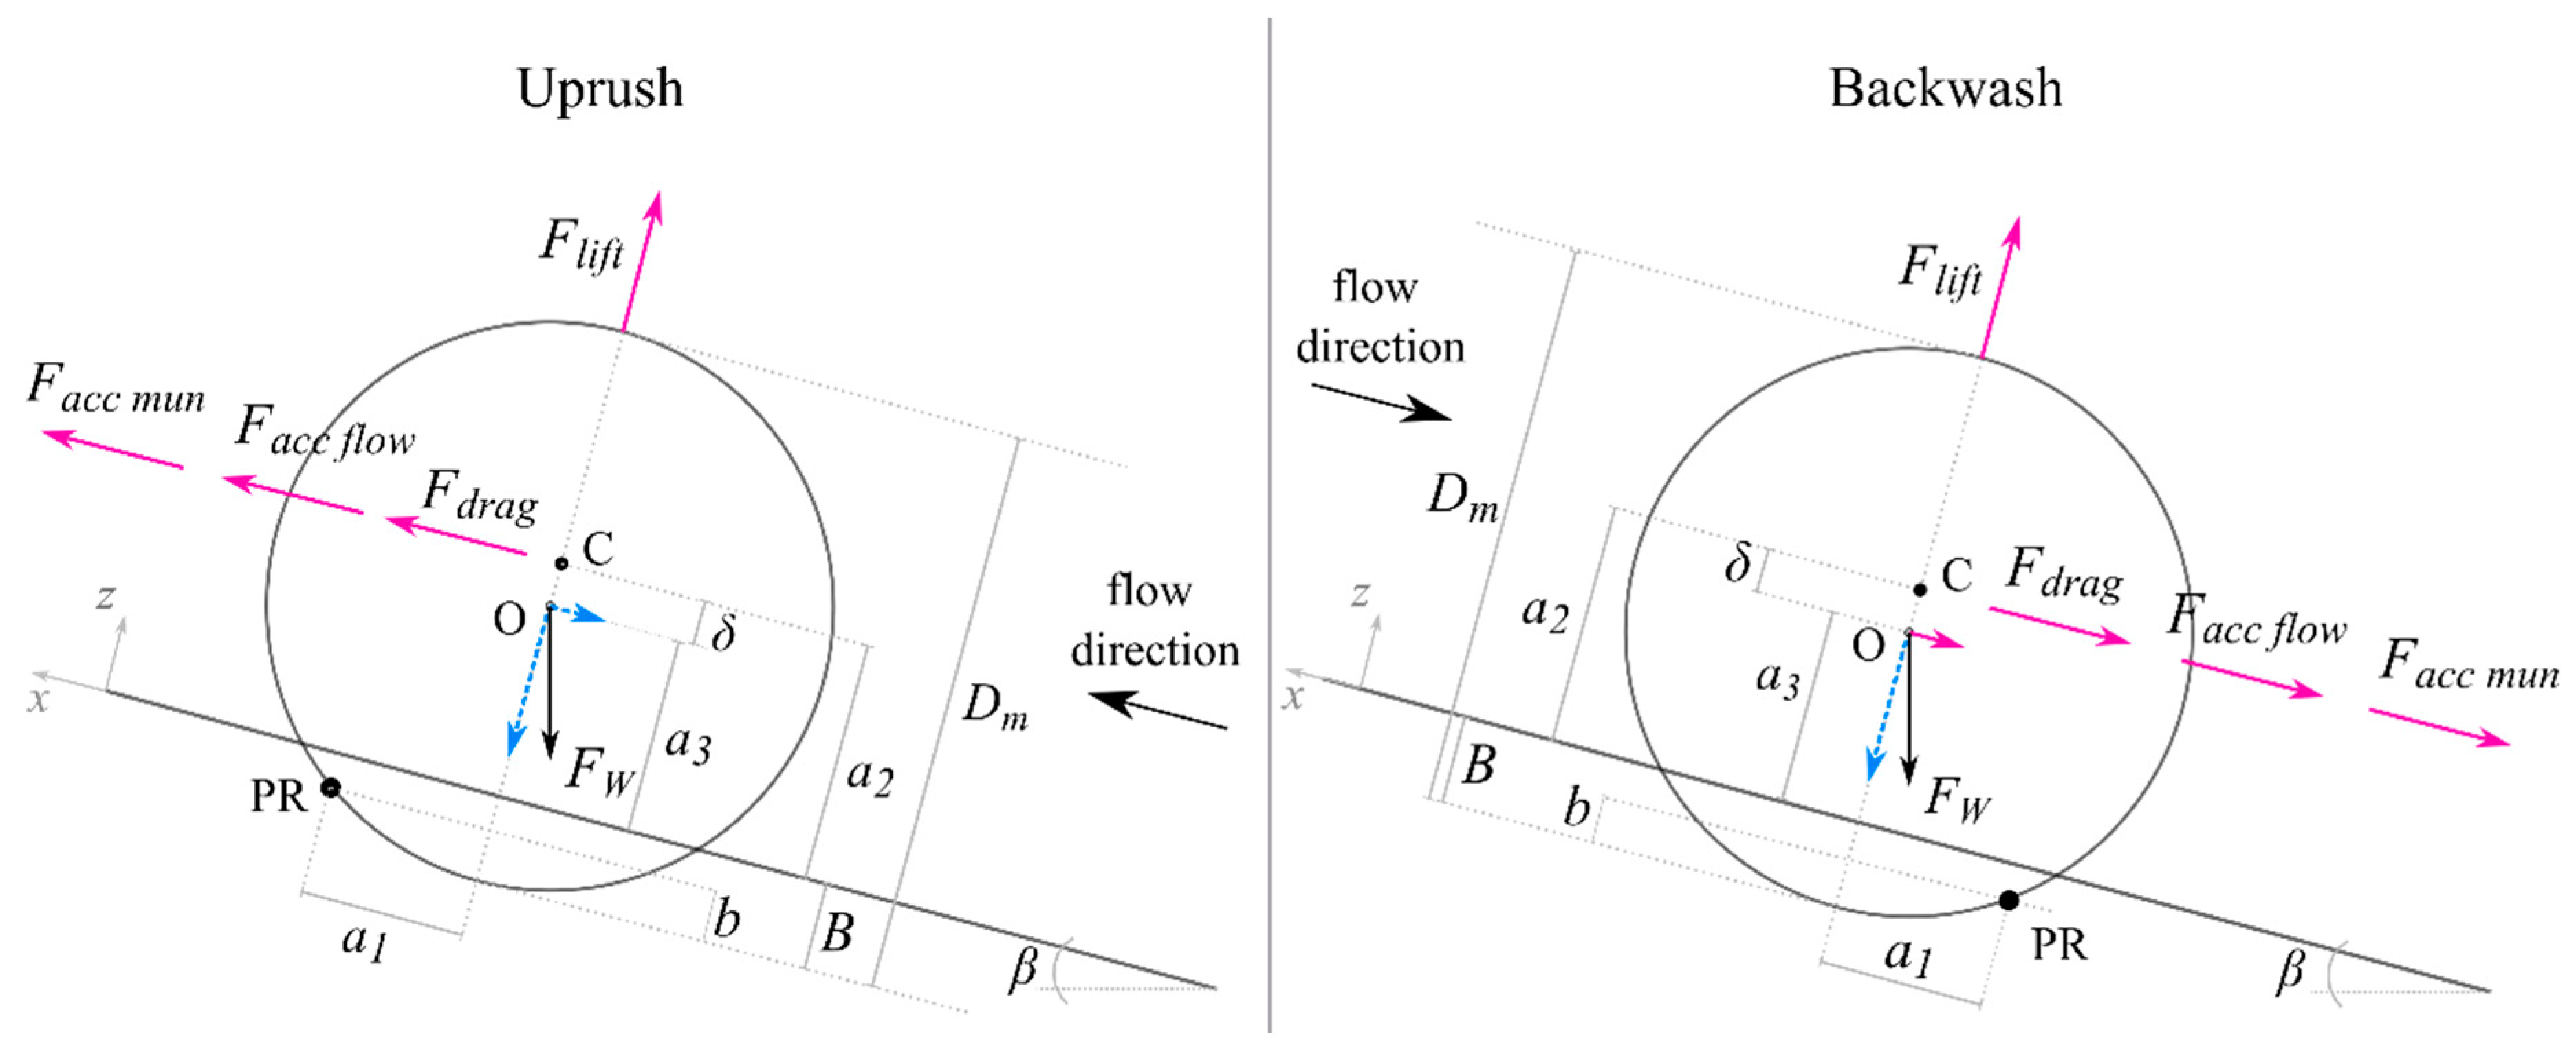
Figure 1.
Schematic of the forces acting on an object resting on a sloping beach face and moment arms for uprush and backwash. In magenta (blue) the forces that act as destabilizing (stabilizing) in the momentum balance equation.
Figure 1.
Schematic of the forces acting on an object resting on a sloping beach face and moment arms for uprush and backwash. In magenta (blue) the forces that act as destabilizing (stabilizing) in the momentum balance equation.
Figure 2.
Schematic of the Center for Applied Coastal Research (CACR) flume located at the University of Delaware (Newark, NJ, USA) with sensor configurations and object deployment positions outlined.
Figure 2.
Schematic of the Center for Applied Coastal Research (CACR) flume located at the University of Delaware (Newark, NJ, USA) with sensor configurations and object deployment positions outlined.
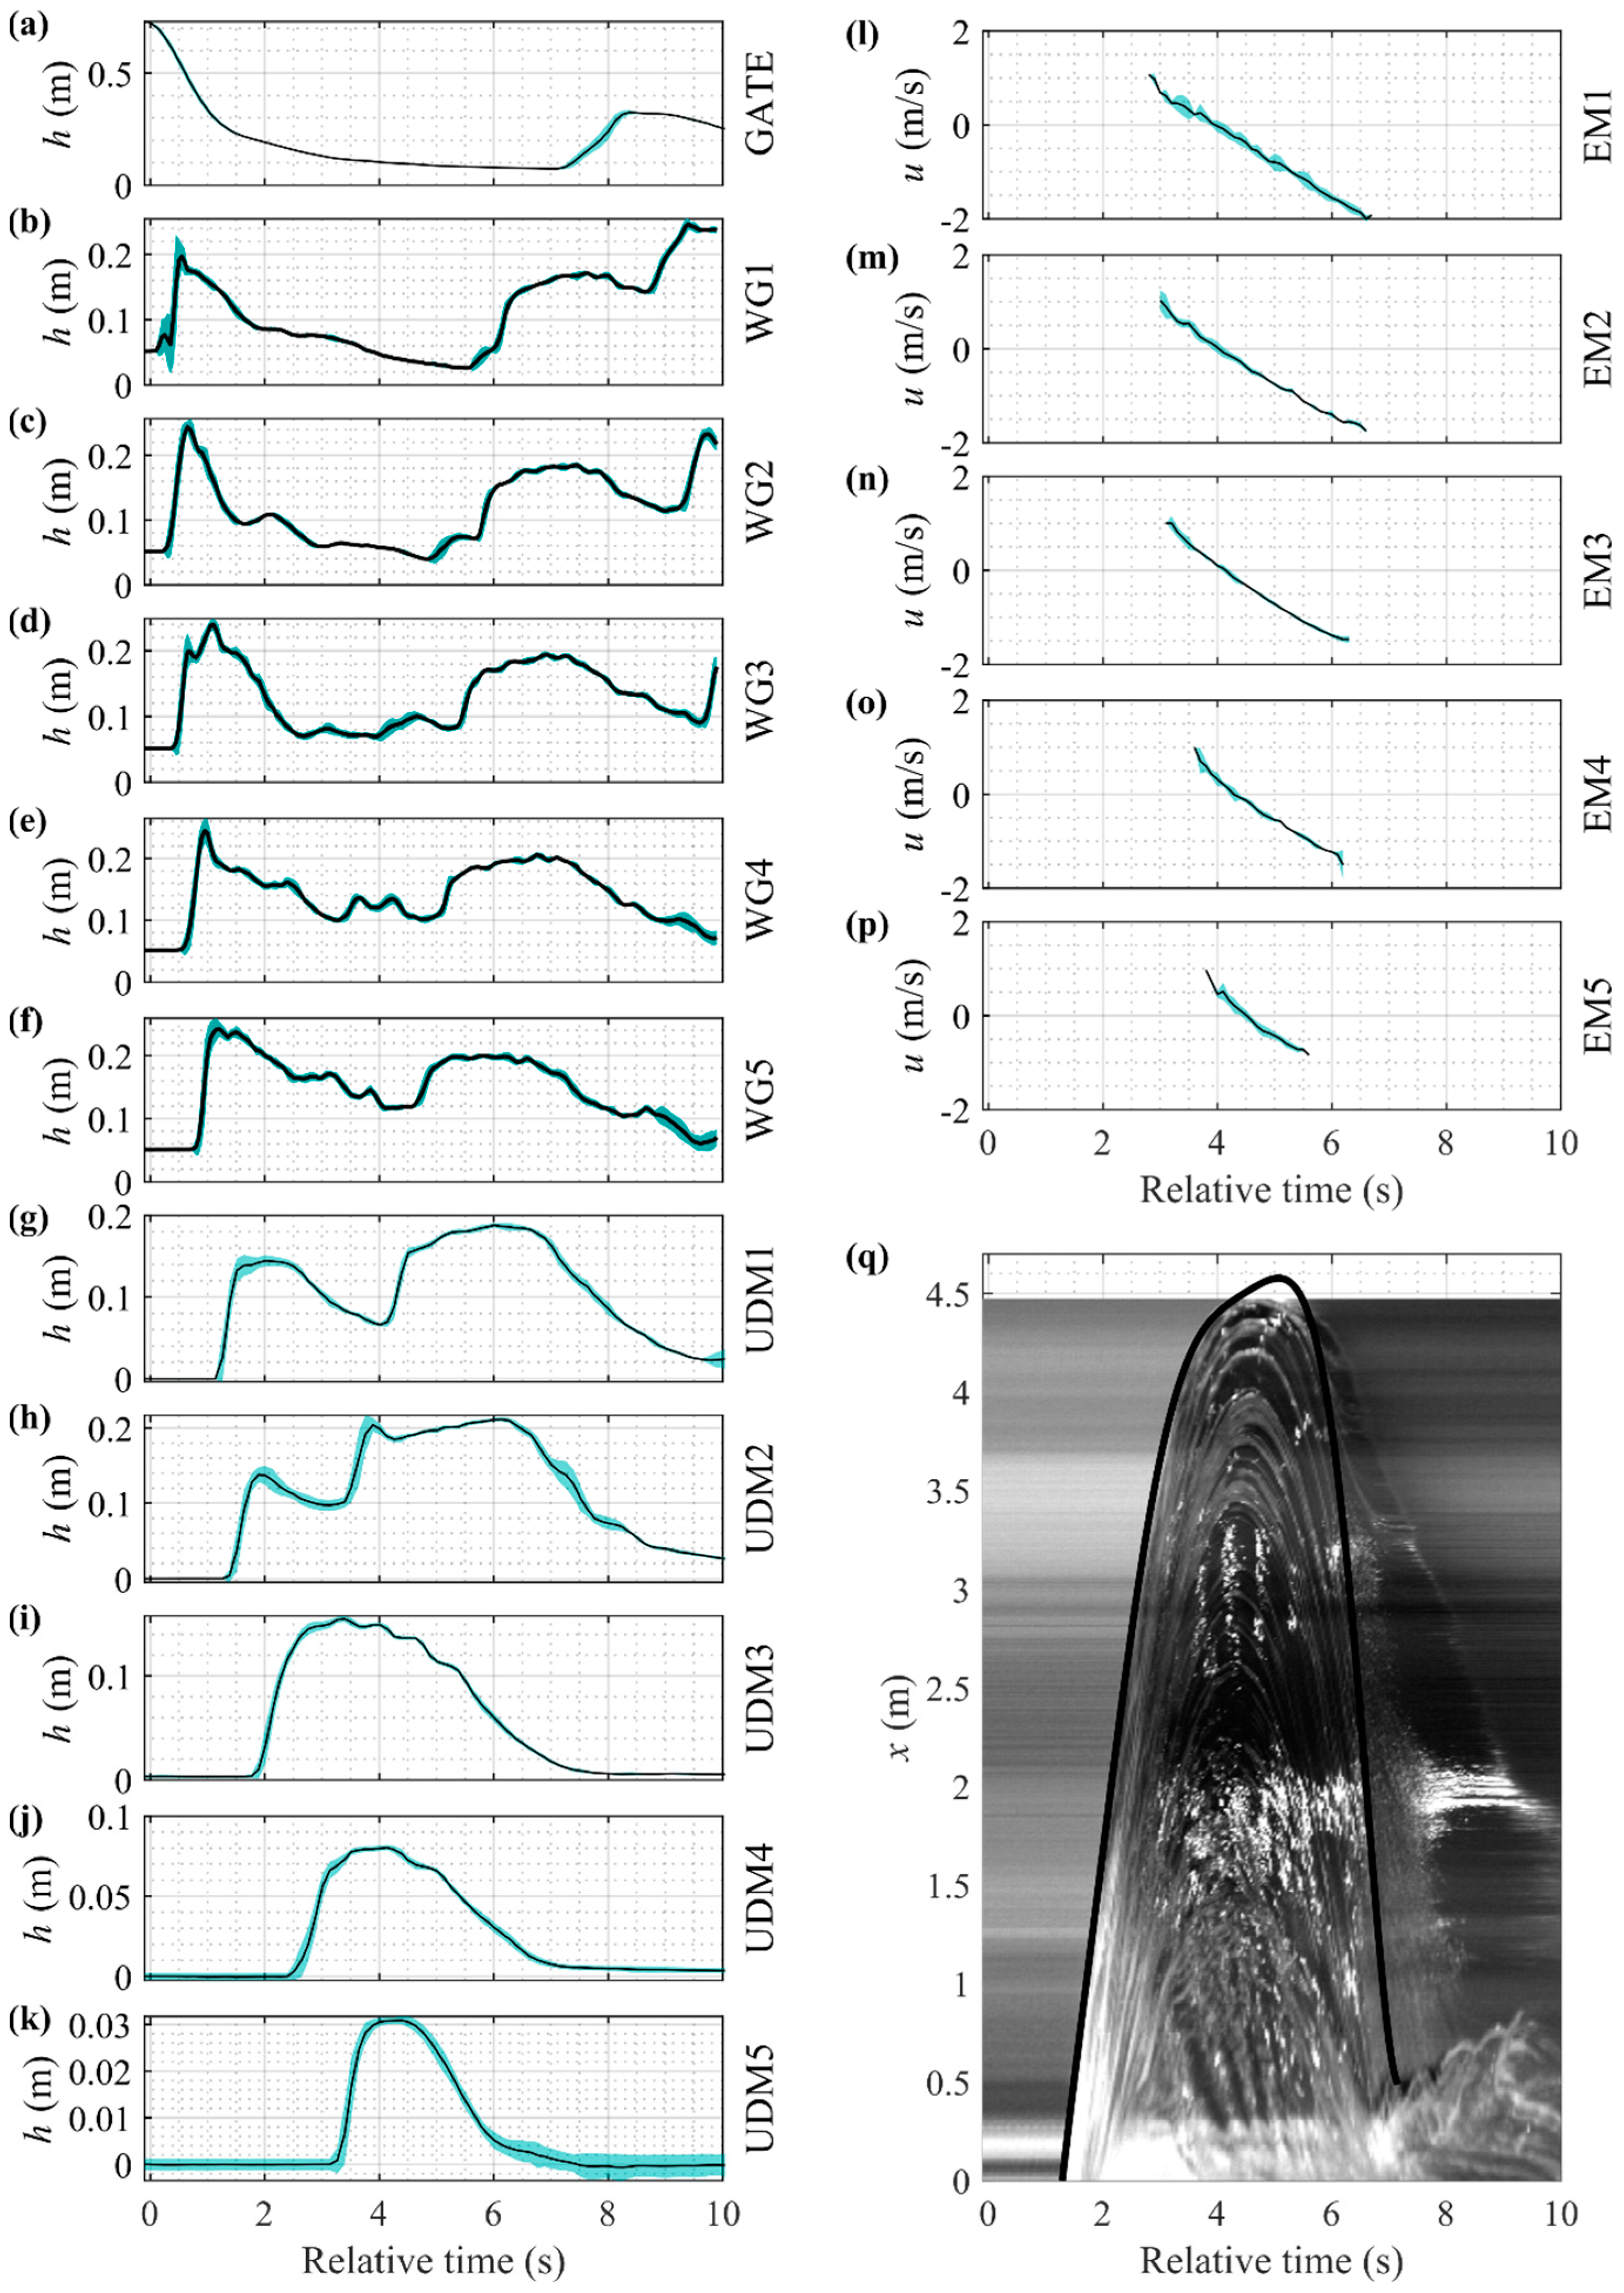
Figure 3.
Ensemble-averaged time series (solid line) and +/−1 standard deviation (shaded area) from the 10 hydrodynamic test repetitions for water level (a–k) and velocity (l–p), and a typical cross-shore time stack and corresponding runup curve (note that the runup exceeded the field of view and was fit by cubic spline) (q).
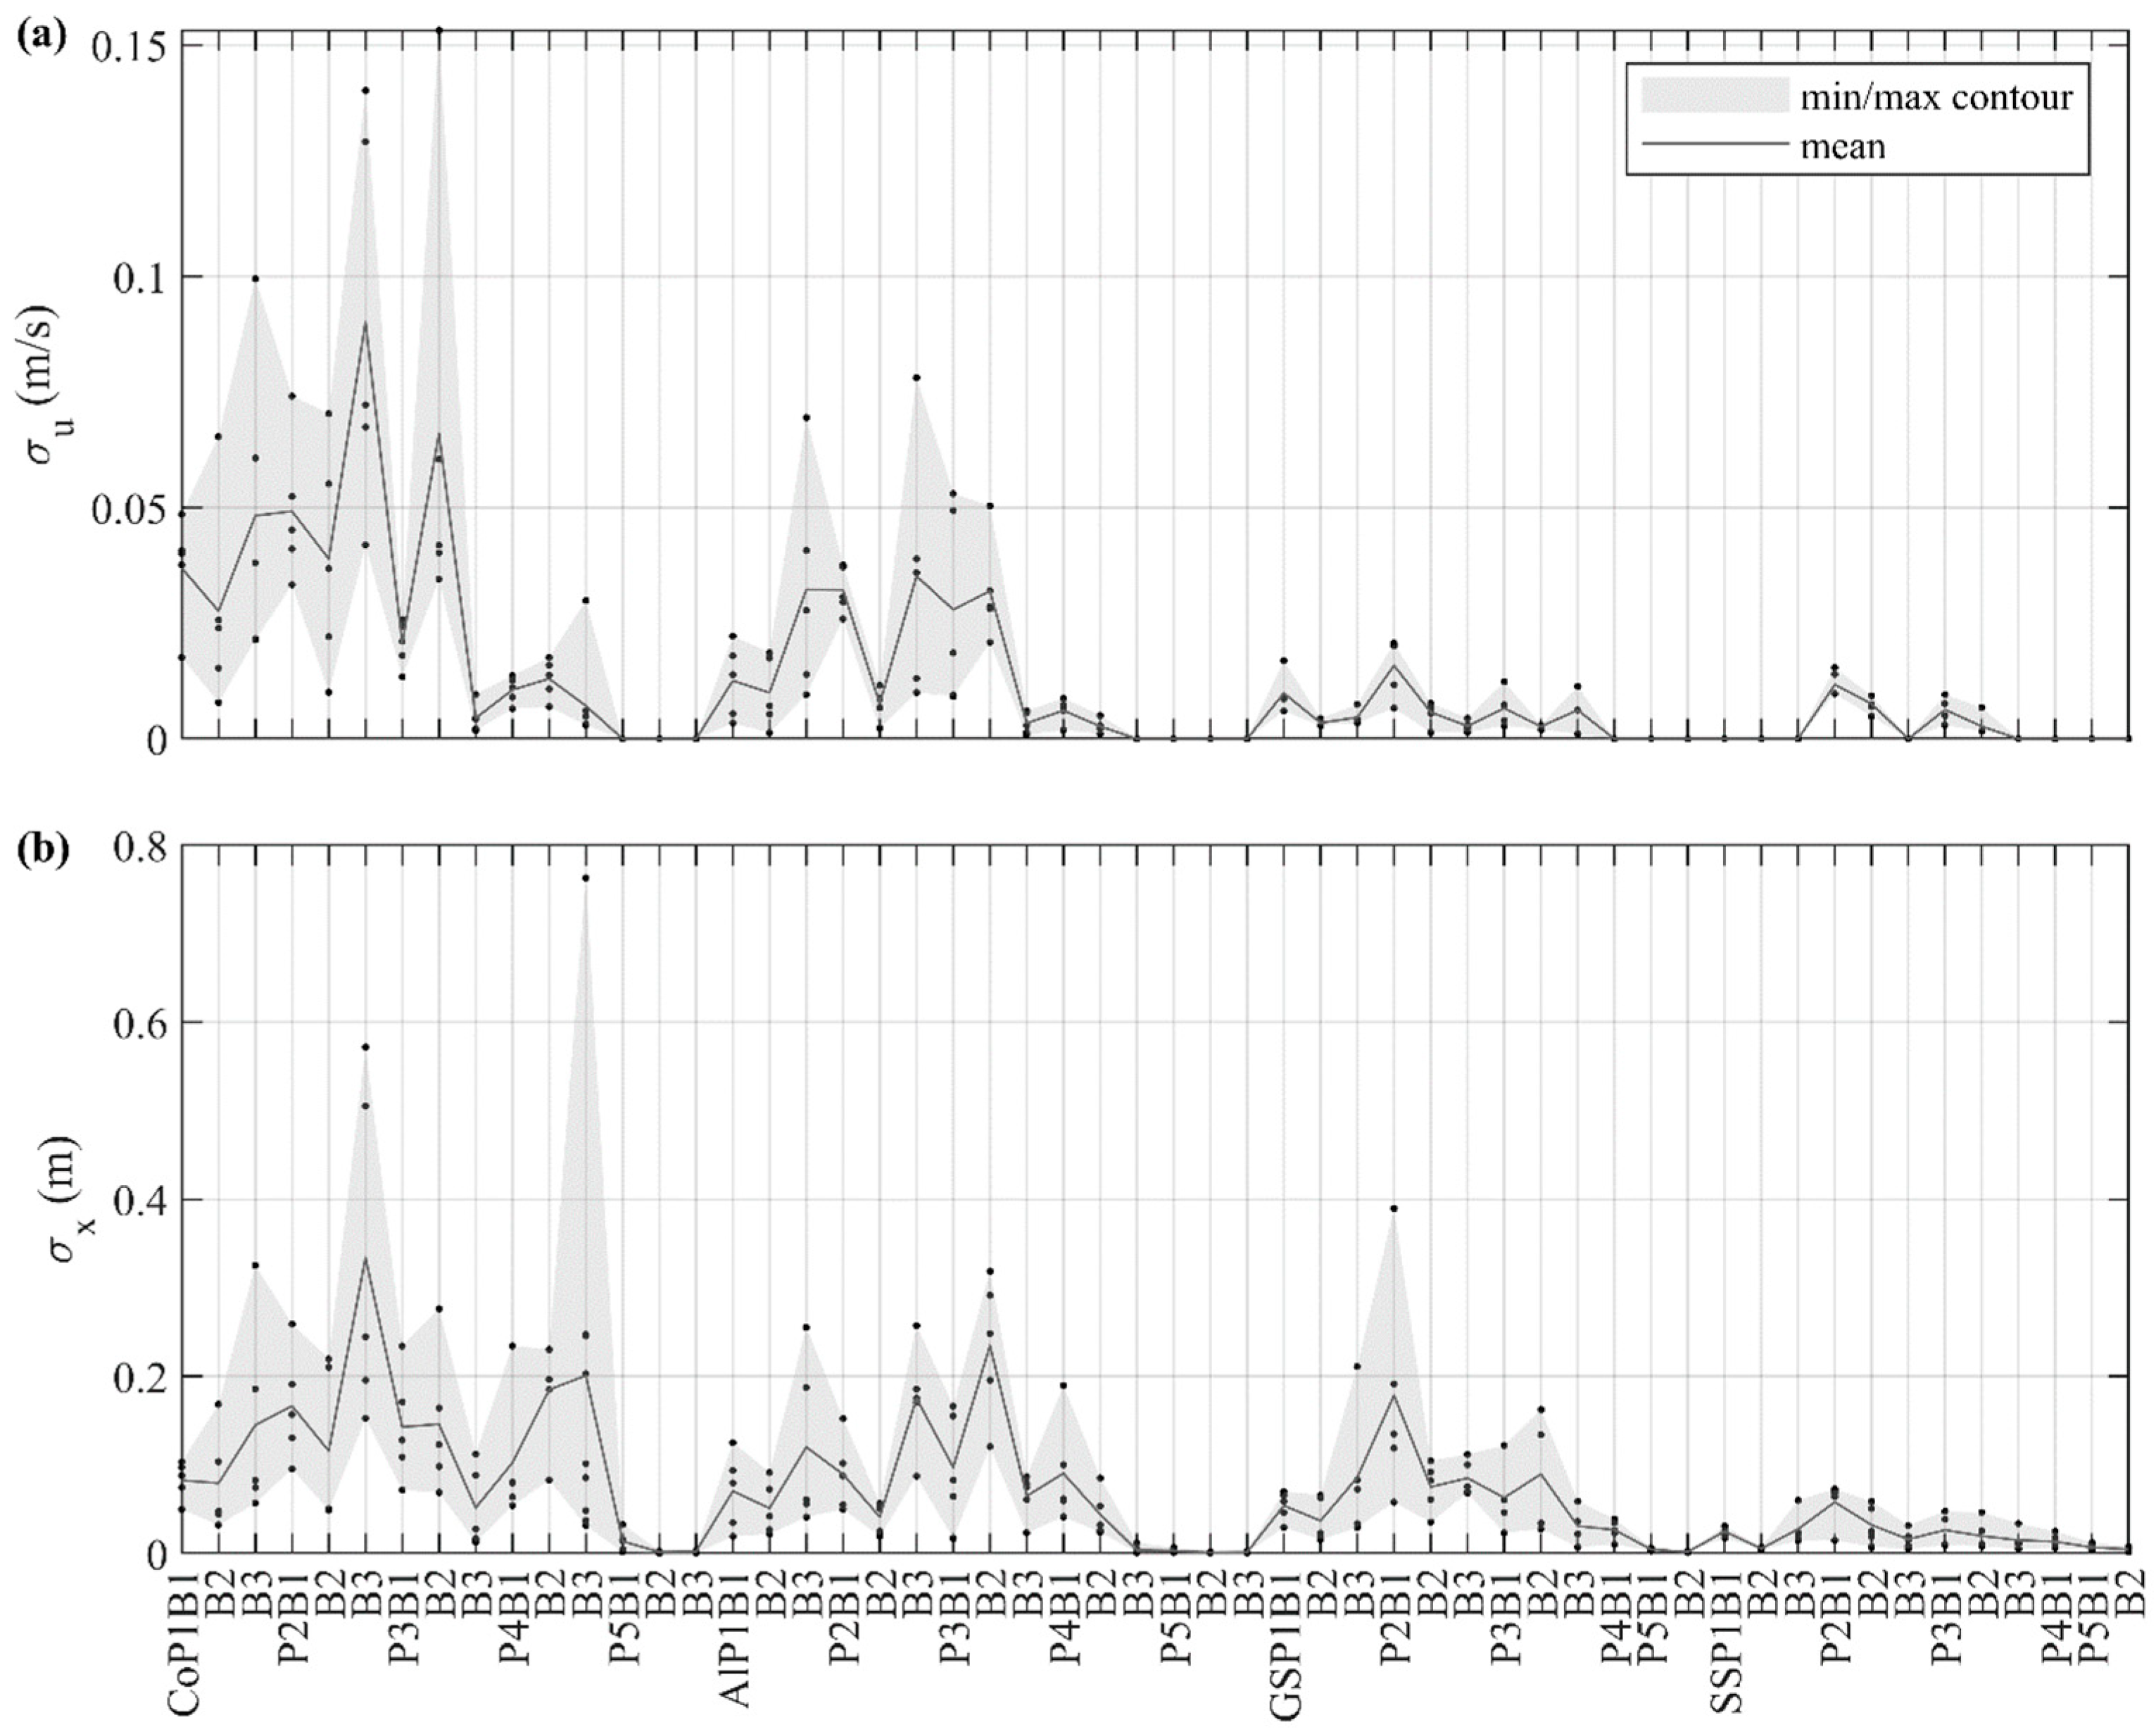
Figure 4.
Standard deviations of velocity (a) and distance travelled (b) for each scenario. Black circles indicate the standard deviations for individual runs.
Figure 4.
Standard deviations of velocity (a) and distance travelled (b) for each scenario. Black circles indicate the standard deviations for individual runs.
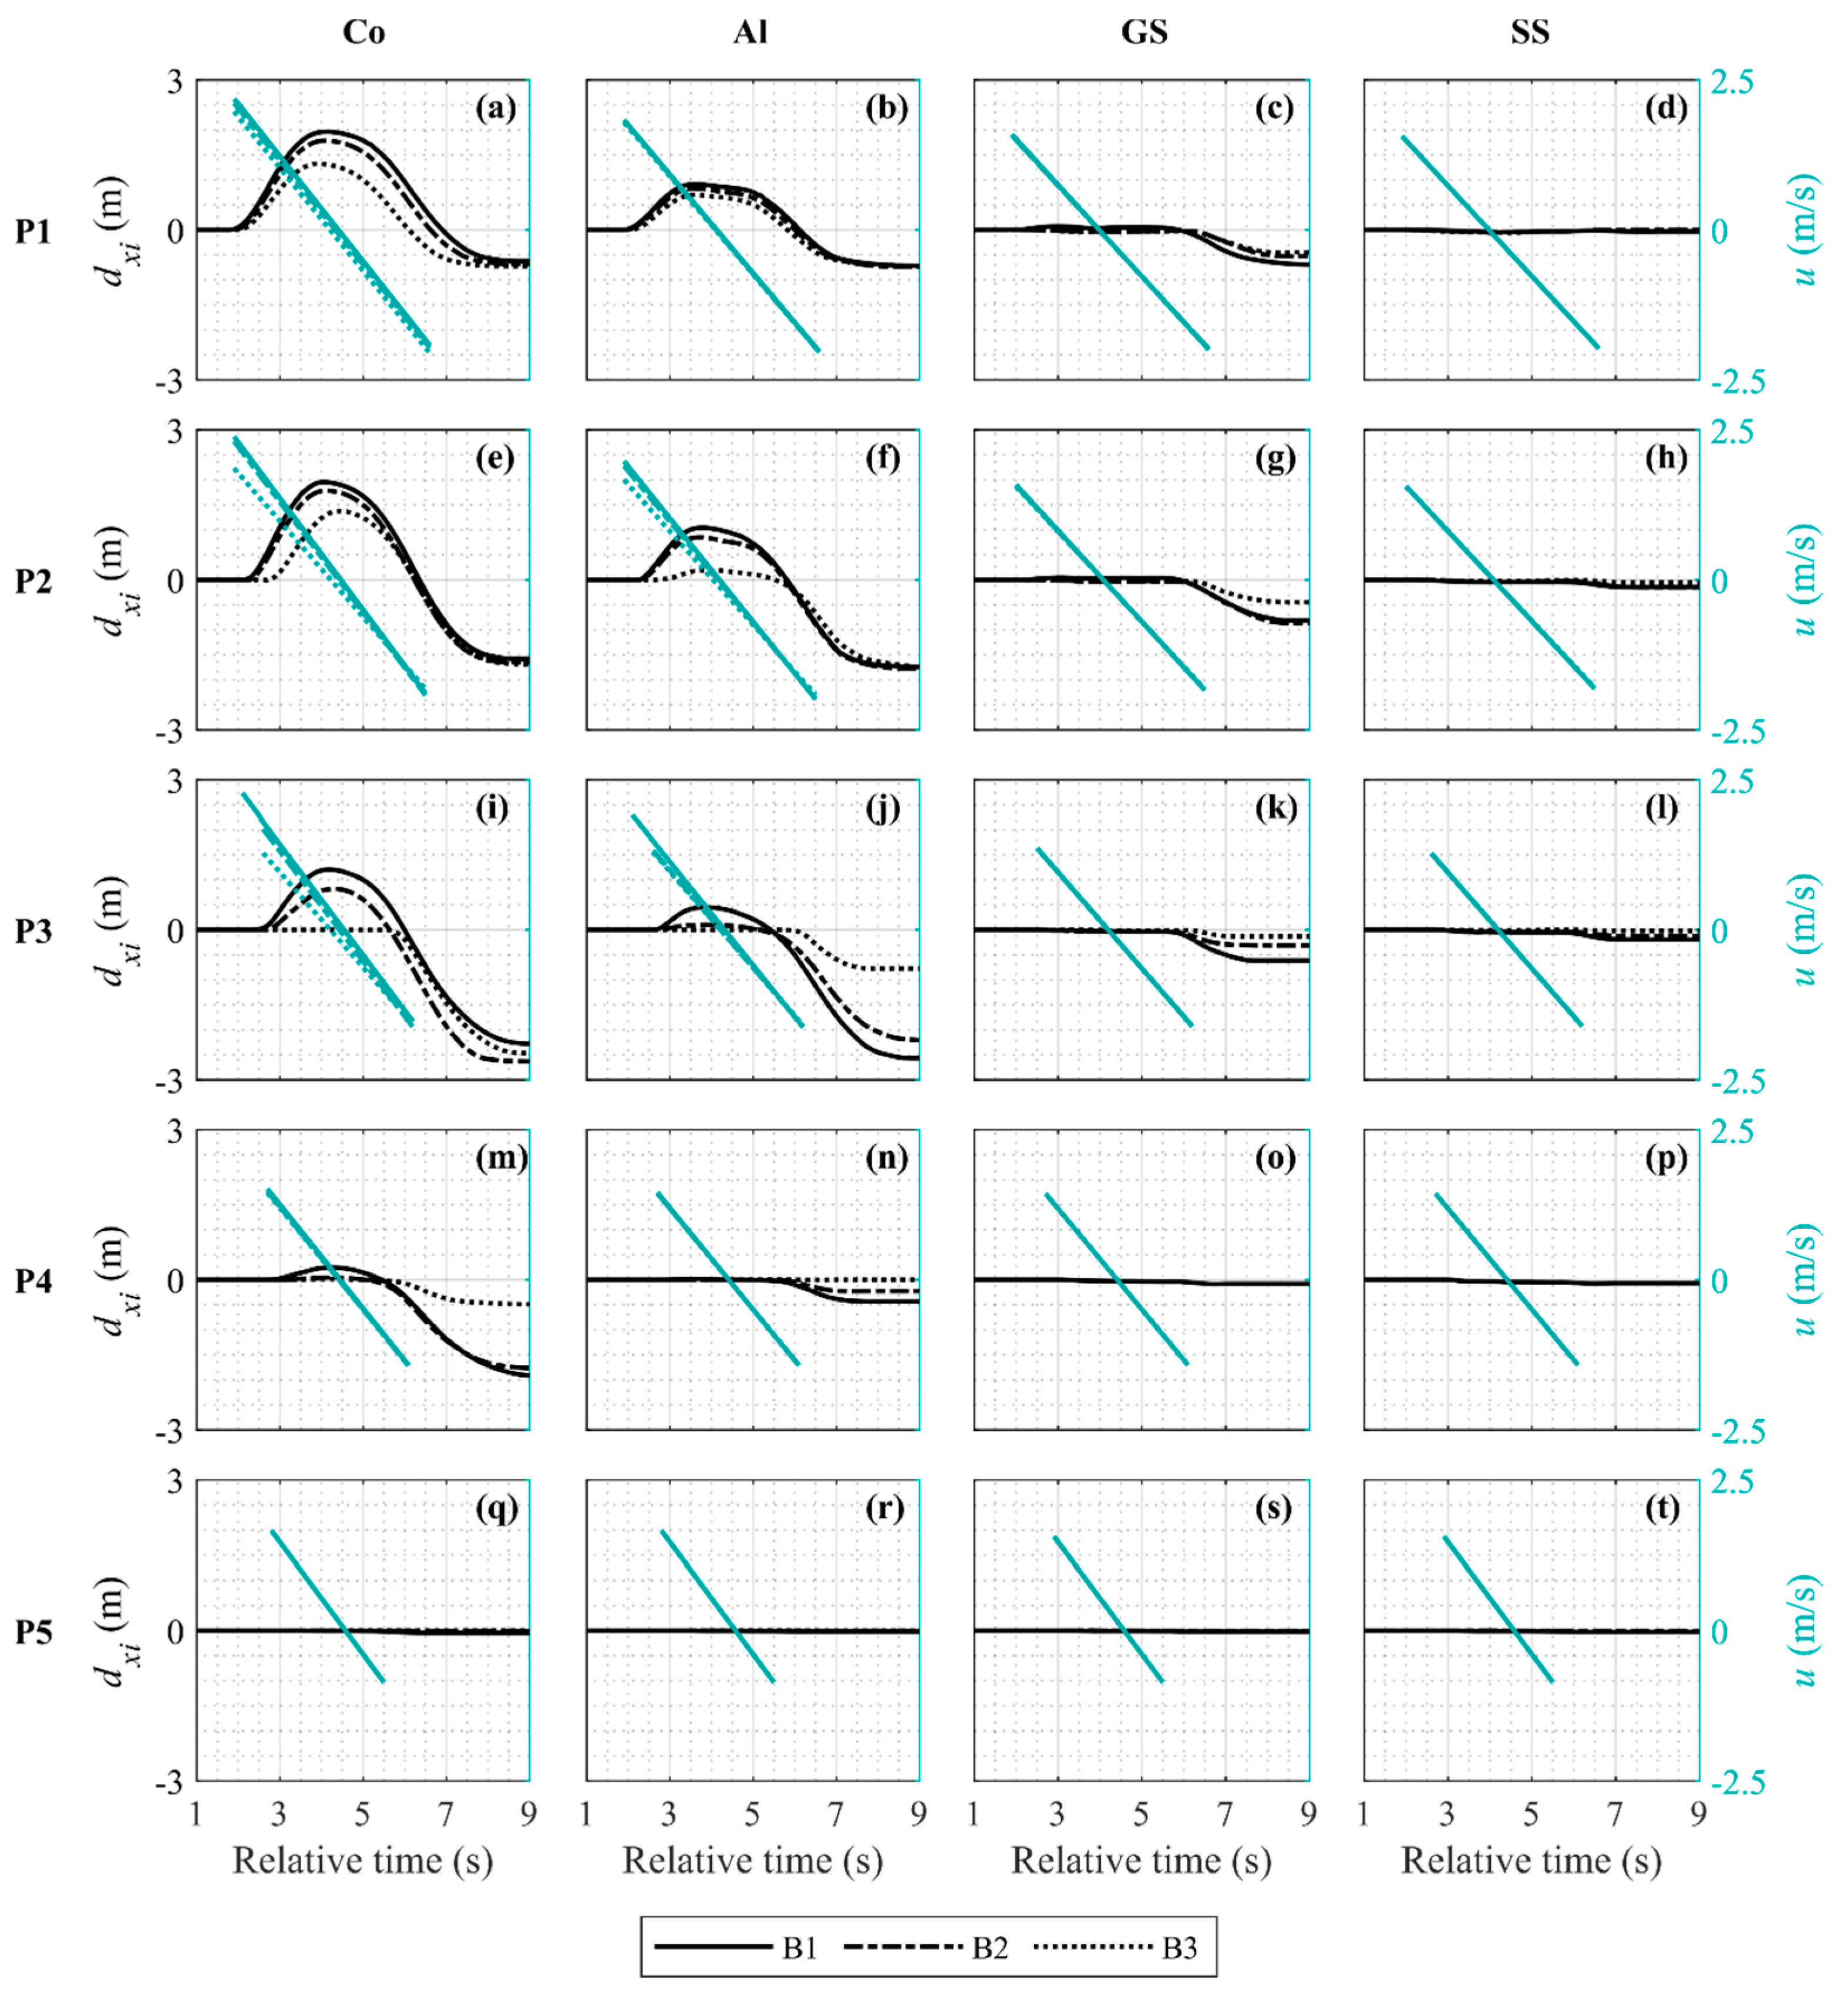
Figure 5.
Averaged distance travelled and averaged interpolated cross-shore flow velocity for each scenario tested. (a) CoP1. (b) AlP1. (c) GSP1. (d) SSP1. (e) CoP2. (f) AlP2. (g) GSP2. (h) SSP2. (i) CoP3. (j) AlP3. (k) GSP3. (l) SSP3. (m) CoP4. (n) AlP4. (o) GSP4. (p) SSP4. (q) CoP5. (r) AlP5. (s) GSP5. (t) SSP5.
Figure 6.
Example of hydrodynamics, object response, and moment for the AlP1B1 scenario. (a) Measured water depth, flow velocity and computed object velocity. (b) Measured object migration and estimated moment.
Figure 6.
Example of hydrodynamics, object response, and moment for the AlP1B1 scenario. (a) Measured water depth, flow velocity and computed object velocity. (b) Measured object migration and estimated moment.
Figure 7.
(a) Moment—cross-shore flow velocity relationship; observed data (gray circles), Equation (23) fitted for each event (black lines) and Equation (23) with mean coefficients c1m, c2m, and c3m (blue line). (b) Comparison between observed and predicted moment dimensionless group using Equation (23) with mean coefficients.
Figure 8.
Uprush cross-shore distance travelled—moment relationship and coefficients. Lines correspond to Equation (24) fitted for each averaged event for objects with concrete (a) and aluminum (c) densities. Markers indicate the coefficients k1, k2, and k3, of Equation (24) varying as a function of the scenario and for objects with concrete (b) and aluminum (d) densities.
Figure 9.
Backwash cross-shore distance travelled—moment relationship and coefficients. Lines correspond to Equation (24) fitted for each averaged event for objects with concrete (a) and aluminum (c) densities. Markers indicate the coefficients k1, k2, and k3, of Equation (24) (e) varying as a function of the scenario and for objects with concrete (b) and aluminum (d,f) densities.
Figure 10.
Map representing the Delmarva region (a) and a picture of the field site (b). Significant wave height (c), peak wave period (d) and mean wave direction (e) during the study. Direction units are degrees from true North, increasing clockwise, with North as 0° and East as 90°. Solid straight line in panel E indicates the shore normal direction (133°). Shaded time windows represent Hurricane Florence and the force balance munition testing time, respectively. Data are provided by the NOAA National Data Buoy Center; station 44089—Wallops Island (VA).
Figure 11.
Field setup. (a) 2D map of deployed infrastructure and instrumentation in the local reference system. (b) Schematic of a generic instrumentation station (stations 1–9 only) with pipe and sensors configuration. (c) Photo of the frame scaffolding pipes holding instrumentation (offshore into page).
Figure 12.
(a) Munition variety used during the study for both long term and force analysis munitions. (b) Long term munition initial deployment. Color-coding is related to munition instrumentation, brown = PT; turquoise = IMU; gold = IMU and PT and black = not instrumented.
Figure 12.
(a) Munition variety used during the study for both long term and force analysis munitions. (b) Long term munition initial deployment. Color-coding is related to munition instrumentation, brown = PT; turquoise = IMU; gold = IMU and PT and black = not instrumented.
Figure 13.
Example hydrodynamics, water depths and near-bed cross-shore velocities observed during the experiment in calm conditions (a,b), storm event (c,d) and during the period the force balance analysis was carried out (e,f).
Figure 13.
Example hydrodynamics, water depths and near-bed cross-shore velocities observed during the experiment in calm conditions (a,b), storm event (c,d) and during the period the force balance analysis was carried out (e,f).
Figure 14.
Beach profile evolution over the experiment duration. The profiles are the transect surveyed on the left (north) side of the frame looking seaward (yf approximately −5 m).
Figure 14.
Beach profile evolution over the experiment duration. The profiles are the transect surveyed on the left (north) side of the frame looking seaward (yf approximately −5 m).
Figure 15.
Long term deployed munitions observations. (a) Migration distances in xf and yf from initial (xf,yf) position. (b,c) Rate of change of the dimensionless burial depth as a function of the rate of change of the dimensionless beach morphology change for munitions that remained in place (b) or moved (c). Migration distances and rate of change of burial depth of each symbol are evaluated as the difference between the position or the burial depth between adjacent surveys. The color scheme is associated with munition diameter with darker colors for larger munition calibers.
Figure 16.
Long term field deployed munition observations. Comparison between migration distance components and object mobility number: (a) Offshore, (b) South, (c) Offshore, (d) North. Markers are color coded to indicate munition density. Marker symbols indicate the initial dimensionless burial depth.
Figure 17.
Mobility of the instrumented RKT deployed at xf = 27.1 m and yf = 8.2 m on 24 August. (a) IMU cross-shore trajectory of relative distance (solid black line) and cross-shore locations of measuring stations 4–8 (circles, the color scheme follows panel b legend) referenced to 27.1 m. (b) Water depth measurements (RBR) at stations 4–8 and at the munition location (PT). (c) Cross-shore flow velocities relative to stations 4–8 (Vectrino and JFE).
Figure 18.
Example of hydrodynamics and munition (81-mm-nf) response to a swash event. (a) Measured water level and flow velocity at station 2. (b) IMU derived munition migration and final GPS munition position. (c) Frames of the munition response at times T1–T9 collected by the UC video imagery.
Figure 18.
Example of hydrodynamics and munition (81-mm-nf) response to a swash event. (a) Measured water level and flow velocity at station 2. (b) IMU derived munition migration and final GPS munition position. (c) Frames of the munition response at times T1–T9 collected by the UC video imagery.
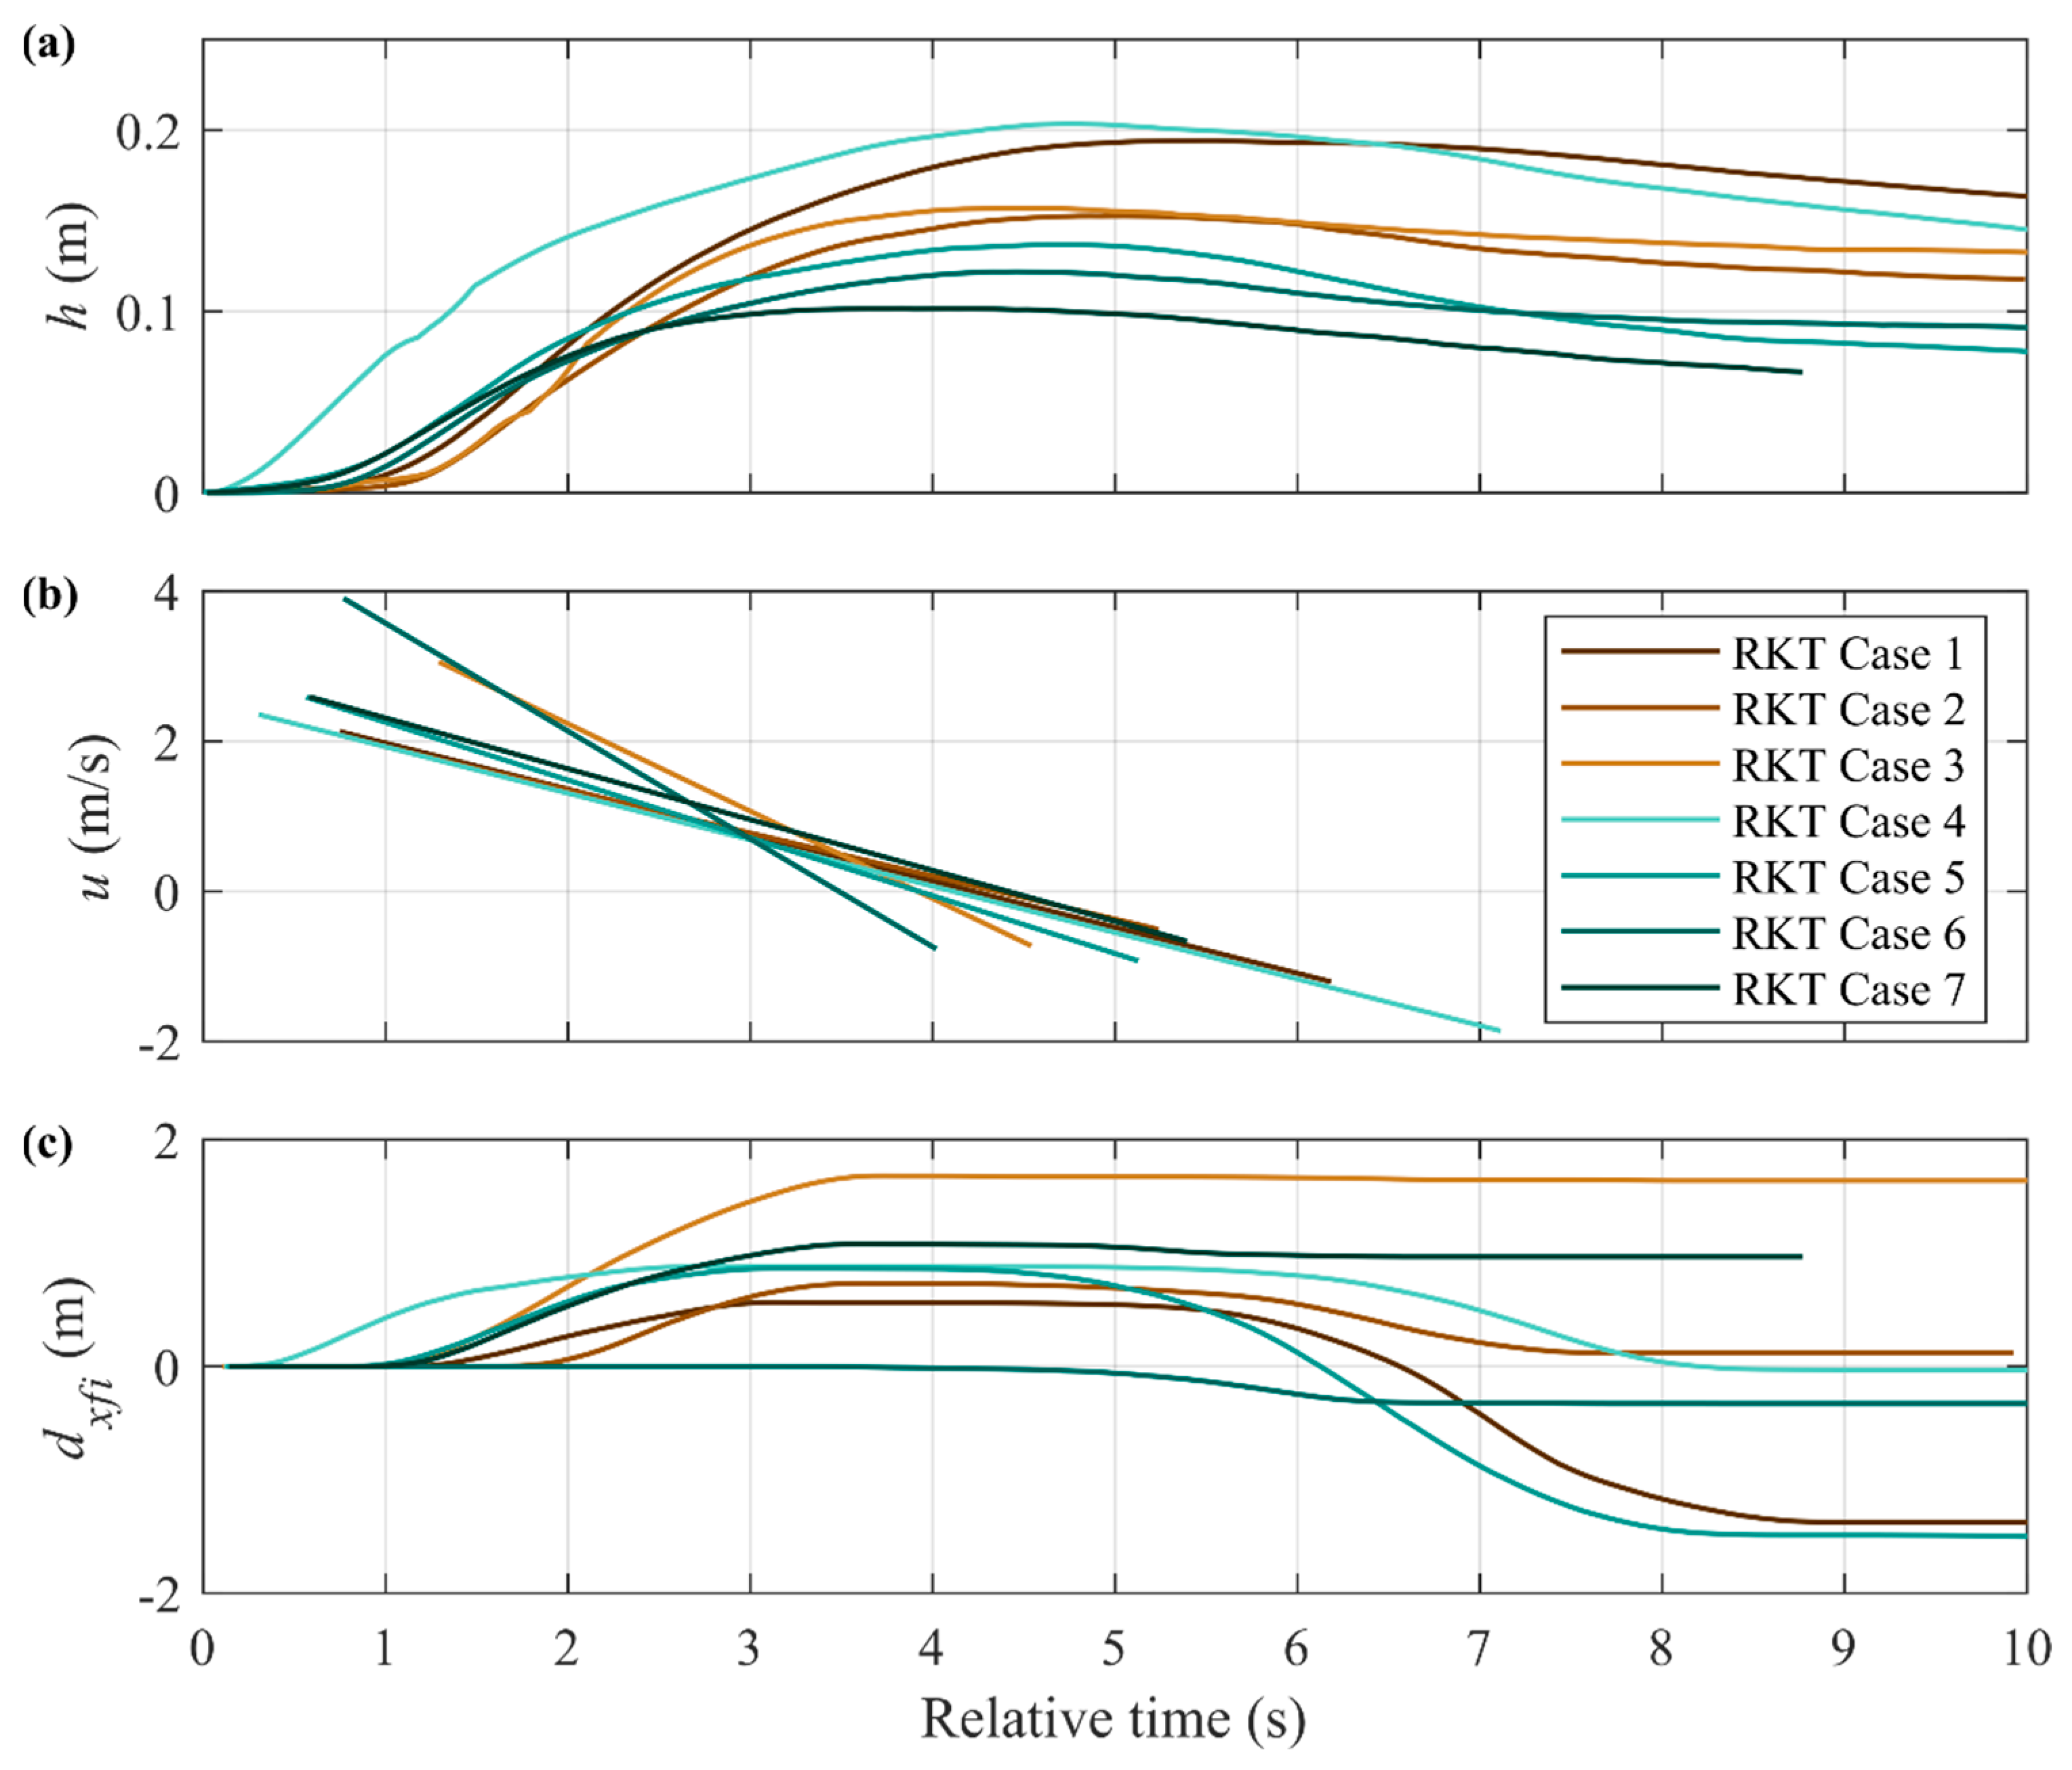
Figure 19.
RKT single swash event field responses. (a) Measured water level at station 2. (b) Flow velocity at station 2 (c) IMU derived munition migration and final GPS munition position.
Figure 19.
RKT single swash event field responses. (a) Measured water level at station 2. (b) Flow velocity at station 2 (c) IMU derived munition migration and final GPS munition position.
Figure 20.
Comparison between the flume and field cross-shore distance travelled and moment dimensionless groups for uprush (a) and backwash (b). Only field munitions that were mobilized are reported in this figure.
Figure 20.
Comparison between the flume and field cross-shore distance travelled and moment dimensionless groups for uprush (a) and backwash (b). Only field munitions that were mobilized are reported in this figure.
Table 1.
Drag, lift, added mass and friction coefficients adopted by several studies investigating the mobility of objects on a sloping bed.
Table 1.
Drag, lift, added mass and friction coefficients adopted by several studies investigating the mobility of objects on a sloping bed.
| Coefficient | Study | Value |
|---|
| Cd | Luccio, 1998 [3] | 1.000 |
| Nott, 2003 [10] | 2.000 |
| Imamura et al., 2008 [7] | 1.050 |
| Nandasena and Tanaka, 2013 [8] | 1.950 |
| Cl | Luccio, 1998 [3] | 1.000 |
| Nott, 2003 [10] | 0.178 |
| Imamura et al., 2008 [7] | - |
| Nandasena and Tanaka, 2013 [8] | 0.178 |
| Cm | Luccio, 1998 [3] | 1.000 |
| Nott, 2003 [10] | 2.000 |
| Imamura et al., 2008 [7] | 1.670 |
| Nandasena and Tanaka, 2013 [8] | 1.000 |
| Cf | Luccio, 1998 [3] | 0.1, 0.4 (smooth, rough bed) |
| Nott, 2003 [10] | 0.875 |
| Imamura et al., 2008 | Variable |
| Nandasena and Tanaka, 2013 | Variable |
Table 2.
Specifications of the objects deployed during the laboratory study and the options of initial position and burial depth.
Table 2.
Specifications of the objects deployed during the laboratory study and the options of initial position and burial depth.
| Initial Position | Initial Burial Depth | Density |
|---|
| Acronym | xi (m) | Acronym | Bi/Dm | Acronym | ρm (kg/m3) |
|---|
| P1 | 1.4 | B1 | 0 | Co (concrete) | 1800 |
| P2 | 2.0 | B2 | 0.3 | Al (aluminum) | 2700 |
| P3 | 2.6 | GS (galvanized steel shell) | 4200 |
| P4 | 3.2 | B3 | 0.5 | SS (stainless steel) | 7700 |
| P5 | 3.8 |
Table 3.
Scenarios tested during the laboratory study (56 in total). Acronyms are defined in
Table 2.
Table 3.
Scenarios tested during the laboratory study (56 in total). Acronyms are defined in
Table 2.
| | Co | Al | GS | SS |
|---|
| P1 | B1 B2 B3 | B1 B2 B3 | B1 B2 B3 | B1 B2 B3 |
| P2 | B1 B2 B3 | B1 B2 B3 | B1 B2 B3 | B1 B2 B3 |
| P3 | B1 B2 B3 | B1 B2 B3 | B1 B2 B3 | B1 B2 B3 |
| P4 | B1 B2 B3 | B1 B2 B3 | B1 | B1 |
| P5 | B1 B2 B3 | B1 B2 B3 | B1 B2 | B1 B2 |
Table 4.
Statistics of the coefficients c1, c2, and c3 (Equation (23)).
Table 4.
Statistics of the coefficients c1, c2, and c3 (Equation (23)).
| | Minimum | Maximum | Mean | Standard Deviation |
|---|
| c1 | 0.0001 | 0.0021 | 0.0011 | 0.0004 |
| c2 | −0.0542 | 0.0289 | −0.0048 | 0.0138 |
| c3 | −2.1678 | 0.9574 | −0.7702 | 0.5749 |
Table 5.
Coefficients k1, k2, and k3 (Equation (24)) obtained for different scenarios.
Table 5.
Coefficients k1, k2, and k3 (Equation (24)) obtained for different scenarios.
| | Co | Al | GS | SS |
|---|
| k1 | k2 | k3 | k1 | k2 | k3 | k1 | k2 | k3 | |
|---|
| U | B | U | B | U | B | U | B | U | B | U | B | U | B | U | B | U | B | |
|---|
| P1 | B1 | 0.0004 | −0.0004 | −0.0363 | −0.0302 | 0.5170 | −0.0028 | −0.0025 | 0.0001 | −0.0058 | −0.0284 | 0.2295 | 0.0010 | | −0.0034 | | 0.0043 | | 0.0047 | |
| B2 | 0.0006 | 0.0010 | −0.0382 | −0.0458 | 0.4589 | −0.0232 | −0.0025 | 0.0012 | −0.0079 | −0.0389 | 0.2030 | −0.0128 | | | | | | |
| B3 | 0.0008 | 0.0019 | −0.0377 | −0.0533 | 0.3310 | −0.0302 | 0.0002 | 0.0014 | −0.0246 | −0.0372 | 0.1482 | −0.0537 | | | | | | |
| P2 | B1 | 0.0007 | 0.0010 | −0.0418 | −0.0528 | 0.5320 | −0.0042 | 0.0016 | 0.0017 | −0.0455 | −0.0568 | 0.2892 | −0.0084 | | −0.0043 | | 0.0023 | | 0.0019 |
| B2 | 0.0010 | 0.0014 | −0.0434 | −0.0561 | 0.4603 | −0.0284 | 0.0008 | 0.0016 | −0.0332 | −0.0498 | 0.2082 | −0.0230 | | −0.0031 | | −0.0016 | | 0.0029 |
| B3 | 0.0042 | 0.0016 | −0.0679 | −0.0507 | 0.2756 | −0.0338 | 0.0012 | 0.0002 | −0.0141 | −0.0194 | 0.0282 | −0.0245 | | | | | | |
| P3 | B1 | 0.0009 | −0.0011 | −0.0354 | −0.0364 | 0.3219 | −0.0136 | 0.0010 | 0.0009 | −0.0263 | −0.0481 | 0.1150 | −0.0191 | | | | | | |
| B2 | 0.0011 | 0.0007 | −0.0338 | −0.0508 | 0.2010 | −0.0272 | | −0.0013 | | −0.0192 | | −0.0167 | | | | | | |
| B3 | | −0.0028 | | 0.0026 | | 0.0027 | | | | | | | | | | | | |
| P4 | B1 | 0.0005 | 0.0001 | −0.0130 | −0.0218 | 0.0603 | −0.0105 | | | | | | | | | | | | |
| B2 | | −0.0013 | | −0.0096 | | −0.0106 | | | | | | | | | | | | |
| B3 | | | | | | | | | | | | | | | | | | |
| P5 | B1 | | | | | | | | No motion observed | |
| B2 | | | | | | | | | | | | | | | | | | |
| B3 | | | | | | | | | | | | | | | | | | |
Table 6.
Specifications of long term deployed munitions and force analysis munitions and physical munition parameters.
Table 6.
Specifications of long term deployed munitions and force analysis munitions and physical munition parameters.
| Long Term Munitions | Force Analysis Munitions |
|---|
| Munition ID | Dm (m) | Lm (m) | ρm (kg.m3) | No
Sensors | Sensors | Munition ID | Date | Sensors | Cases |
|---|
| 20-mm | 0.02 | 0.075 | 7990 | 8 | - | RKT | 2 October | IMU, PT | 7 |
| 40-mm | 0.040 | 0.200 | 5720 | 12 | - |
| BLU-26 | 0.065 | 0.065 | 2939 | 3 | - | BLU-61 | 3 October | IMU | 7 |
| BLU-61 | 0.099 | 0.099 | 4460 | 3 | 1 |
| BLU-61-Ss | 0.099 | 0.099 | 7999 | 1 | - | 81-mm | 9 October | IMU | 13 |
| BLU-61-Al | 0.099 | 0.099 | 2700 | 1 | - |
| 81-mm | 0.081 | 0.481 | 4180 | 6 | 1 | 81-mm-nf | 4 October | IMU | 7 |
| 81-mm-nf | 0.081 | 0.481 | 4180 | 1 | 1 |
| RKT | 0.070 | 0.405 | 3320 | 3 | 4 | 155-mm | 10 October | IMU, PH, PT | 24 |
| 155-mm | 0.155 | 0.754 | 4230 | 2 | 3 |
| TOT | | | | 40 | 10 | TOT | | | 58 |


