Article

Numerical Method for Predicting Emissions from Biodiesel Blend Fuels in Diesel Engines of Inland Waterway Vessels

College of Merchant Marine, Shanghai Maritime University, Shanghai 201306, China
*
Author to whom correspondence should be addressed.
J. Mar. Sci. Eng. 2023, 11(1), 86; https://doi.org/10.3390/jmse11010086
Submission received: 24 November 2022 / Revised: 19 December 2022 / Accepted: 22 December 2022 / Published: 3 January 2023
(This article belongs to the Section Marine Environmental Science)

Abstract

:
The use of alternative fuels in ships faces the dual challenge of emission regulations and cost of use. In this paper, the impact of biodiesel blends from cooking waste as a carbon-neutral fuel for inland waterway vessels was investigated. The software AVL FIRE was used to simulate the detailed chemical combustion process of a marine diesel engine running on D100 (pure diesel), B5 (5% biodiesel by volume), B10 (10% biodiesel by volume), and B15 (15% biodiesel by volume). The results showed that B5, B10, and B15 all provided a better air-fuel mixture and significantly reduced soot production. Based on the performance and emission values, B5, B10, and B15 cause relatively small differences in engine performance compared to diesel and are readily applicable in practice. Optimizing exhaust gas recirculation (EGR) and varying injection timing can further optimize biodiesel fuel combustion while reducing NOx and soot emissions. The results of this study are helpful for the application of waste cooking oil biodiesel fuel and reducing exhaust gas emissions from ships.

1. Introduction

Diesel engines are widely used in transportation, industry and agriculture because of their high reliability and thermal efficiency [1]. This is especially the case now they serve as the main power plants for marine ships and ground vehicles. Marine vessels account for more than 80% of the global transportation industry and have a major impact on the world economy. Normally, the long voyage distances of ships requires a long running time for marine diesel engines, while the large size and weight of ships require a large amount of power for marine diesel engines, which leads to high fuel consumption and harmful emissions. At the same time, the widespread use of poor-quality fuel oil has also led to a wide range of pollutants being emitted from ships. Therefore, marine diesel engine power units have the typical characteristics of high pollutant emissions, high fuel consumption rate, and long operating time. In actual operation, the quality of atomization and spray affects soot and greenhouse gas (GHG) emissions, and the combustion temperature in the cylinder and the ambient oxygen content also determine the release of nitrogen oxides (NOx), resulting in a serious threat to the environment and human health [2]. Therefore, it is necessary to find a clean and efficient renewable alternative energy for ships.
Biodiesel is a carbon-neutral fuel that is an ideal alternative to achieve medium- to long-term carbon neutrality and carbon peak goals. Generally, biodiesel fuels can be made by the transesterification of vegetable or animal oils and can be mixed with diesel in any proportion [3,4,5]. Several past studies have demonstrated the effects of biodiesel and other carbon-neutral fuels on diesel engine combustion and emission characteristics through experimental and modeling approaches [6,7,8,9,10,11]. However, once a particular diesel engine prototype is considered for development, the selection of the optimal fuel requires a combination of complex combustion processes in the engine, a time-consuming and costly process. Many researchers have developed mathematical models using simulation software to study the combustion process of diesel engines considering the efficiency and cost of experiments [6,12,13,14,15,16]. A key issue is how to decide the biodiesel-diesel blend ratio, which therefore has an important impact on engine performance. In Ref. [17], it was found that increasing the blending ratio of biodiesel-diesel fuel improves the combustion and emission characteristics of diesel engines, but also increases the undesirable effects of fuel consumption. However, the optimal blend ratio of biodiesel and diesel is influenced not only by engine emissions, but also by the price of biodiesel, which in turn plays an important role in the large-scale application and promotion of biodiesel. Particularly in recent years, the price of biodiesel has continued to rise with the change of CO2-neutral policies in various countries around the world. The market price has increased from about 1200 dollars per tonne in the past to about $2000 now. Therefore, a too high blending ratio of biodiesel and diesel will inevitably lead to an increase in fuel prices, which means a higher economic burden for shipowners.
In addition, the detailed chemical combustion processes of biodiesel under the thermodynamic conditions of marine engines and their effects on emissions should be further explored by numerical simulations. In Ref. [18], the emission reduction of diesel engine performance by different biodiesel blends was investigated based on multiparameter optimization theory. The results showed that the high oxygen content of biodiesel contributes to the improvement of engine performance and emission characteristics, and the use of exhaust gas recirculation (EGR) technology can effectively reduce NOx emissions. In addition, adjusting the engine injection strategy has a significant impact on engine emissions [19]. The use of a pilot injection strategy [20] significantly reduced both NOx and soot emissions. In the past, a number of studies have been conducted on numerical simulations and optimizations of engine combustion using the software AVL FIRE. For example, in [21], the software AVL FIRE was used to perform combustion analysis of a four-cylinder diesel engine and determine the optimal injection strategy using an artificial neural network model. Ref. [17] combined the AVL FIRE software with the CHEMKIN code to simulate the combustion process of biodiesel in a four-stroke diesel engine and determine the effects of the fuel’s calorific value on fuel consumption. Similar studies have also further investigated premixed combustion in diesel engines with premixed combustion chambers using AVL FIRE software [22]. Other studies have extended to the emission characteristics of methane, ethane, propane, butane, and dimethyl ether using AVL FIRE and further investigated NO emissions by adjusting the injection timing [23]. Although these extensive studies have focused on land vehicles, research on specific marine engine types and combustion conditions is still limited. In particular, marine engines have very different characteristic combustion and emission effects on combustion and atomization within the engine due to the larger injection volume and nozzle hole size. Our previous research [24] has confirmed biodiesel to be a safe, reliable, and low-emission fuel for ships through a 100-h endurance test on a marine engine test bed. Therefore, it is necessary to further investigate the effects of biodiesel on diesel engine emissions and combustion characteristics under specific thermodynamic conditions at sea.
From the above, it is clear that the use of blends of biodiesel from waste cooking oil and diesel can reduce most gas emissions from four-stroke engines except NOx. In order to achieve good economic results with a low biodiesel-diesel blend ratio while achieving clean ship emissions with good engine emission reduction, this paper investigates the effect of the biodiesel blend ratio on the emissions of the four-stroke main engine of an inland waterway vessel and predicts the performance and emissions using AVL Fire software. The objective is to investigate the effects of a low biodiesel-diesel blend ratio on engine combustion and emissions. To further optimize the combustion of this marine diesel engine and reduce NOx and soot emissions, the effects of different EGR rates and injection times on NOx and soot emissions were focused on B10. The results of this study are useful to promote the use of waste cooking oil for biodiesel production on a large scale and to promote biodiesel as a carbon-neutral fuel for ships while reducing exhaust emissions from ships.

2. Materials and Methods

2.1. Vessel Engine

An inland garbage removal vessel travelling on the Huangpu River in China was used to study the effects of biodiesel blends on the combustion and emission characteristics of a diesel engine. The engine is an inline 6-cylinder mechanically pumped supercharged marine diesel engine. Figure 1 shows the schematic diagram of the diesel engine test equipment for this vessel. A portable exhaust gas analyzer testo 338 and HORIBA PG-350 were used for the emission tests. Emission tests were conducted for this emission test of this vessel, and the corresponding results were published in a previous study [24]. In this study, the numerical simulations for testing this marine diesel engine with biodiesels are further validated.

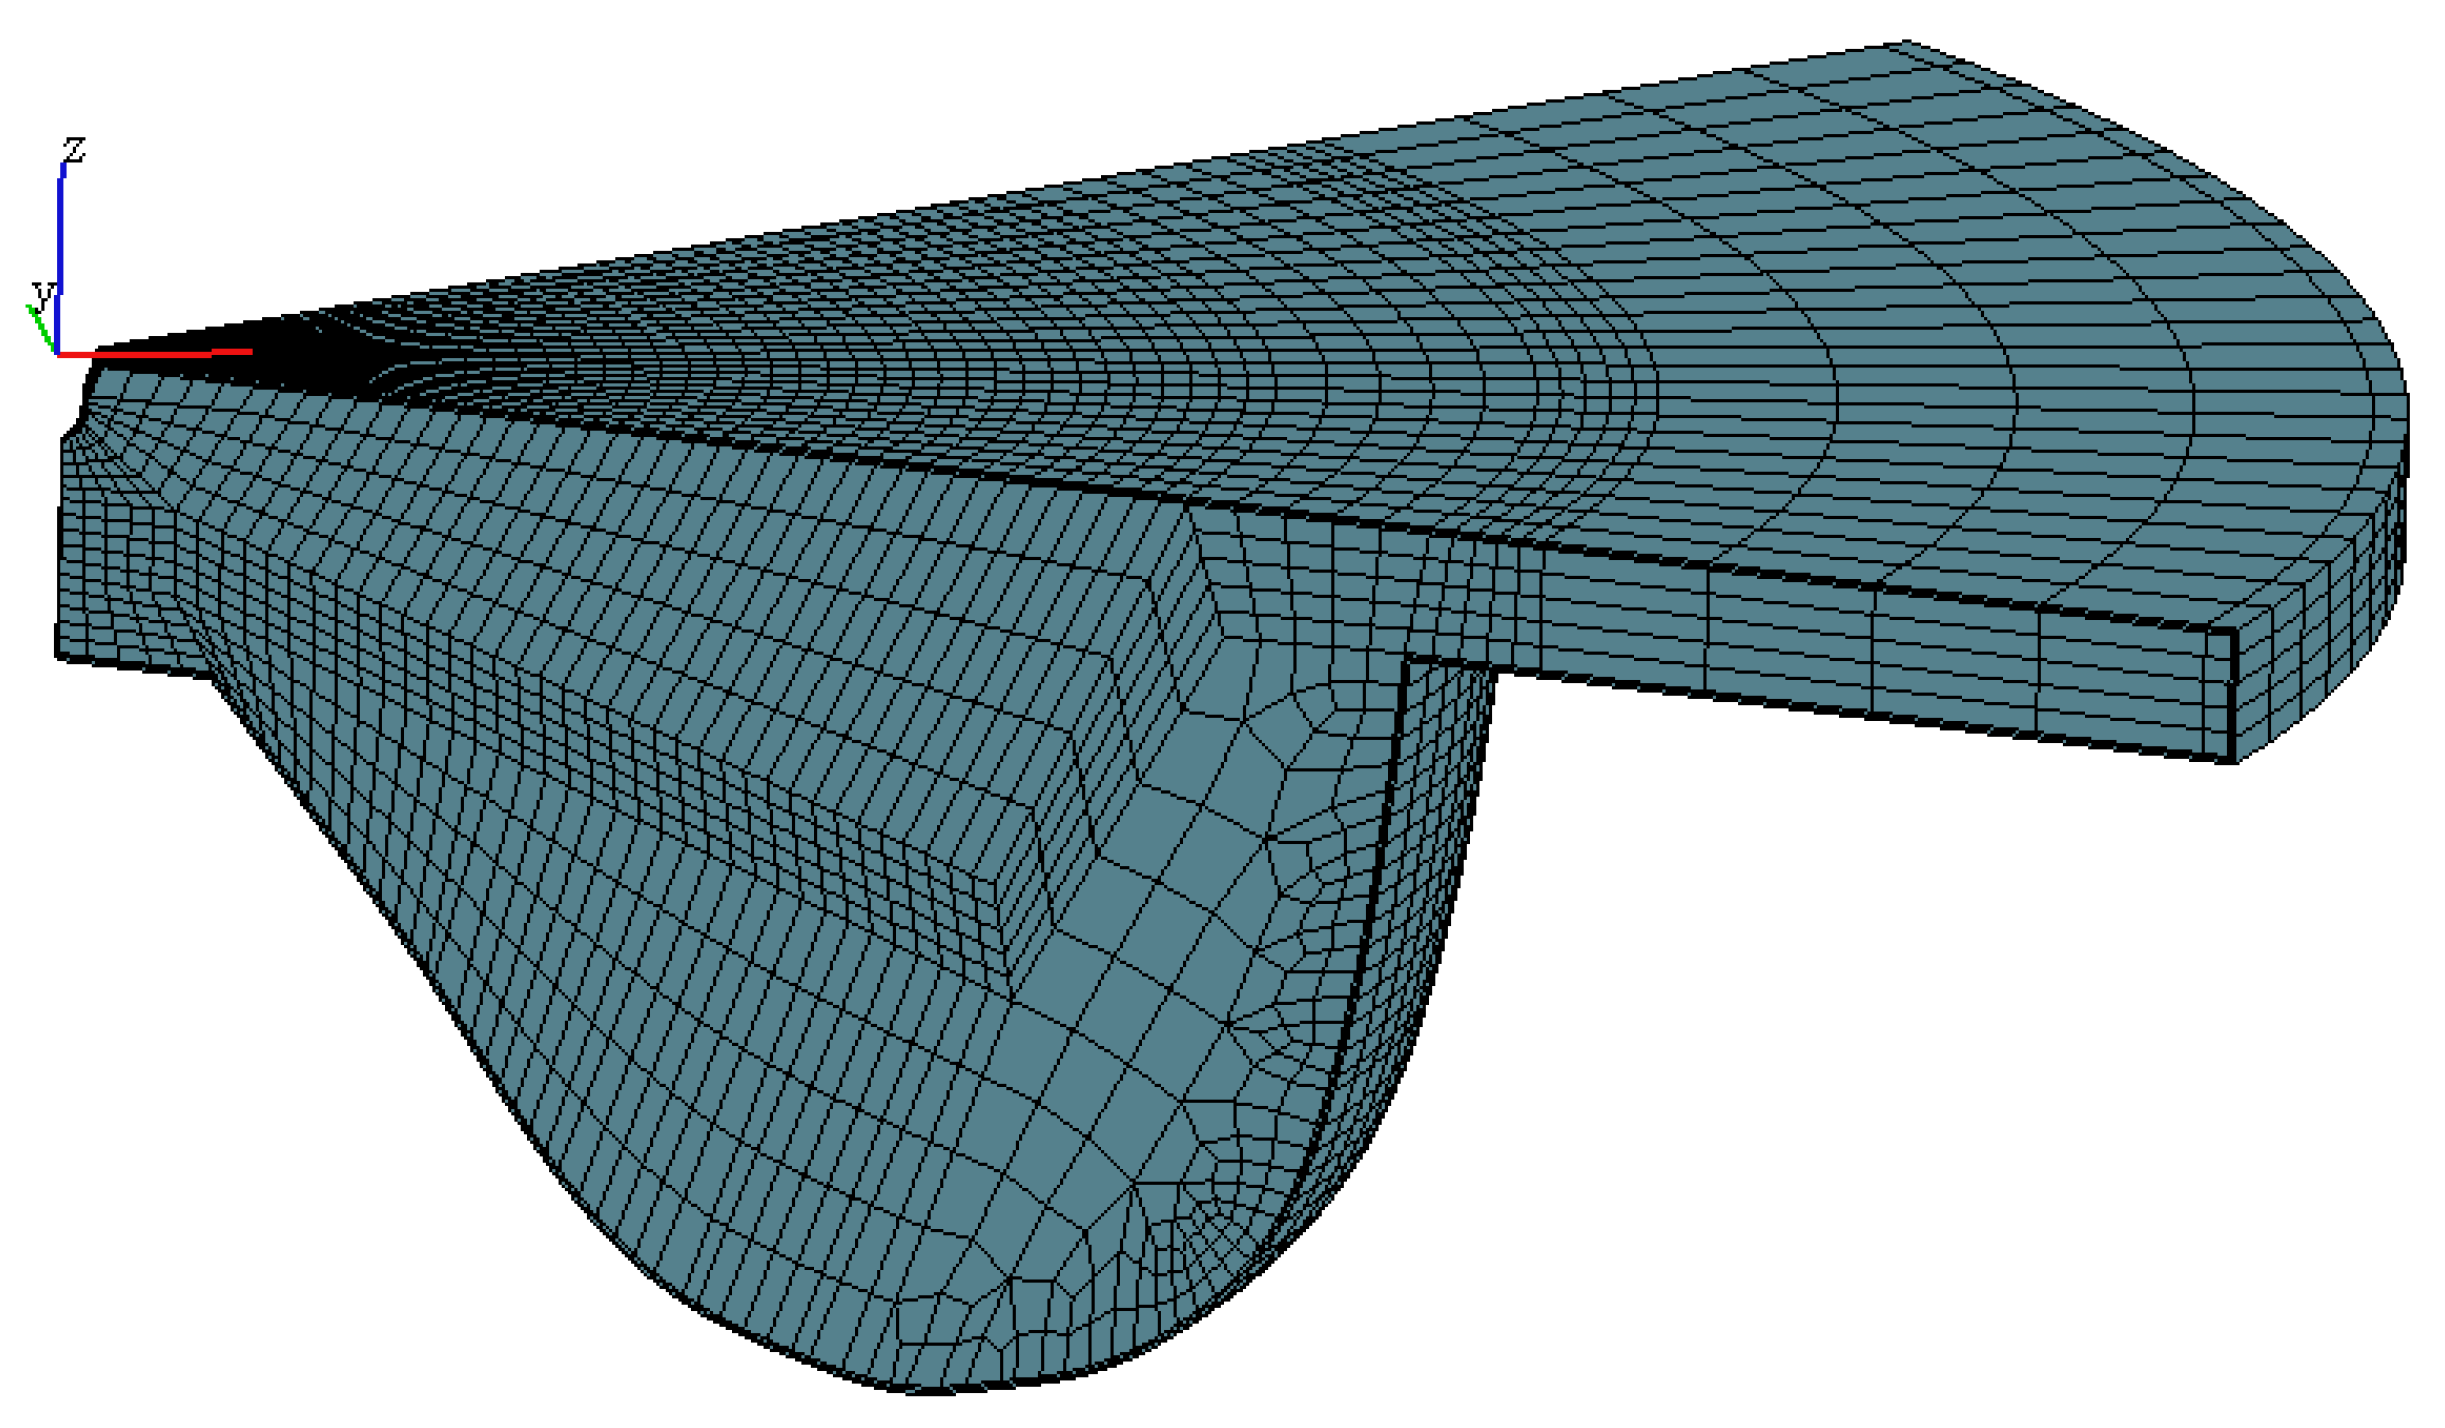
2.2. Computational Mesh

By using AVL Fire simulation software, the dynamic performance, combustion and emission characteristics were studied. The engine parameter is the same as the vessel engine above. The detailed specifications of the diesel engine are shown in Table 1.
In this case, only the ESE Diesel module was used for the in-cylinder combustion calculation. Based on the operating range of the crank angle of the four-stroke engine, the start of a cycle was set to 720 °CA at top dead center, and then the entire operation was calculated according to the parameters of the simulation prototype manual. The calculation area is set to start at the moment of intake valve closing (590 °CA) and end at the moment of exhaust valve opening (850 °CA). The boundary and initial engine conditions are listed in Table 2. In addition, the combustion chamber is treated as a closed system and the boundary conditions are chosen as a wall (wall boundary). According to the engine conditions, the cylinder head, piston top, and cylinder wall temperatures are set to 550 K, 575 K, and 353 K. The speed for the cylinder head and cylinder wall are both 0.
The initial conditions generally contain initial cylinder pressure, cylinder temperature, cylinder turbulence kinetic energy (TKE) and cylinder turbulence size (TLS). In this simulation, the initial cylinder pressure was set to 1.46 bar and the initial cylinder temperature was set to 350 K.
For TKE and TLS, the corresponding equations are required as follows:
T K E = 1.5 u 2
u = 0.5 C m
C m = h n 30
where, u: turbulence pulsation velocity; n: diesel engine speed; C m : average piston speed; h: cylinder stroke.
The turbulence dimension length is 1/2 of the maximum valve lift of the diesel engine and is calculated as follows:
T L S = h v 2
where, h v : the maximum valve lift of the engine.
By bringing the technical parameters of the diesel engine into the above formula, it is calculated that the initial turbulent kinetic energy in the cylinder of the diesel engine is 21.09 m2/s2, and the initial turbulence size is 0.0125 m.
Based on the actual shape of the diesel engine, the DIESEL module in AVL Fire was used as a platform to build the 3D model using Auto CAD. In the DIESEL module, a pre-set meshing function was used to generate the grid for the computation. It automatically generates a dynamic mesh so that the number and size of the mesh vary with the movement of the piston. Due to the symmetry of the combustion chamber, the fuel nozzles of the engine have six identical spray holes. To simplify the computational model and reduce the computational time, only one-sixth of the entire combustion chamber mesh is considered, and the mesh is enriched at the boundary and nozzles, as shown in Figure 2.

2.3. Fuel Preparation

The biodiesel at different ratios (5%, 10%, and 15%, by volume of biodiesel) was mixed with pure diesel fuel (D100), defined as B5, B10, and B15, respectively. The diesel fuel used was based on the China standards GB 17930-2016, Stage 6 Limits and Measurement Methods for Emissions from heavy-duty diesel vehicles. The biodiesel used was made from waste cooking oil produced by Shanghai Zhongqi Environmental Technology Co. Ltd. (Shanghai China), according to the national and industry standards for biodiesel in China. The physical and chemical properties of these ratios of biodiesel fuel were tested according to the China Biodiesel Standard and the results are shown in Table 3.

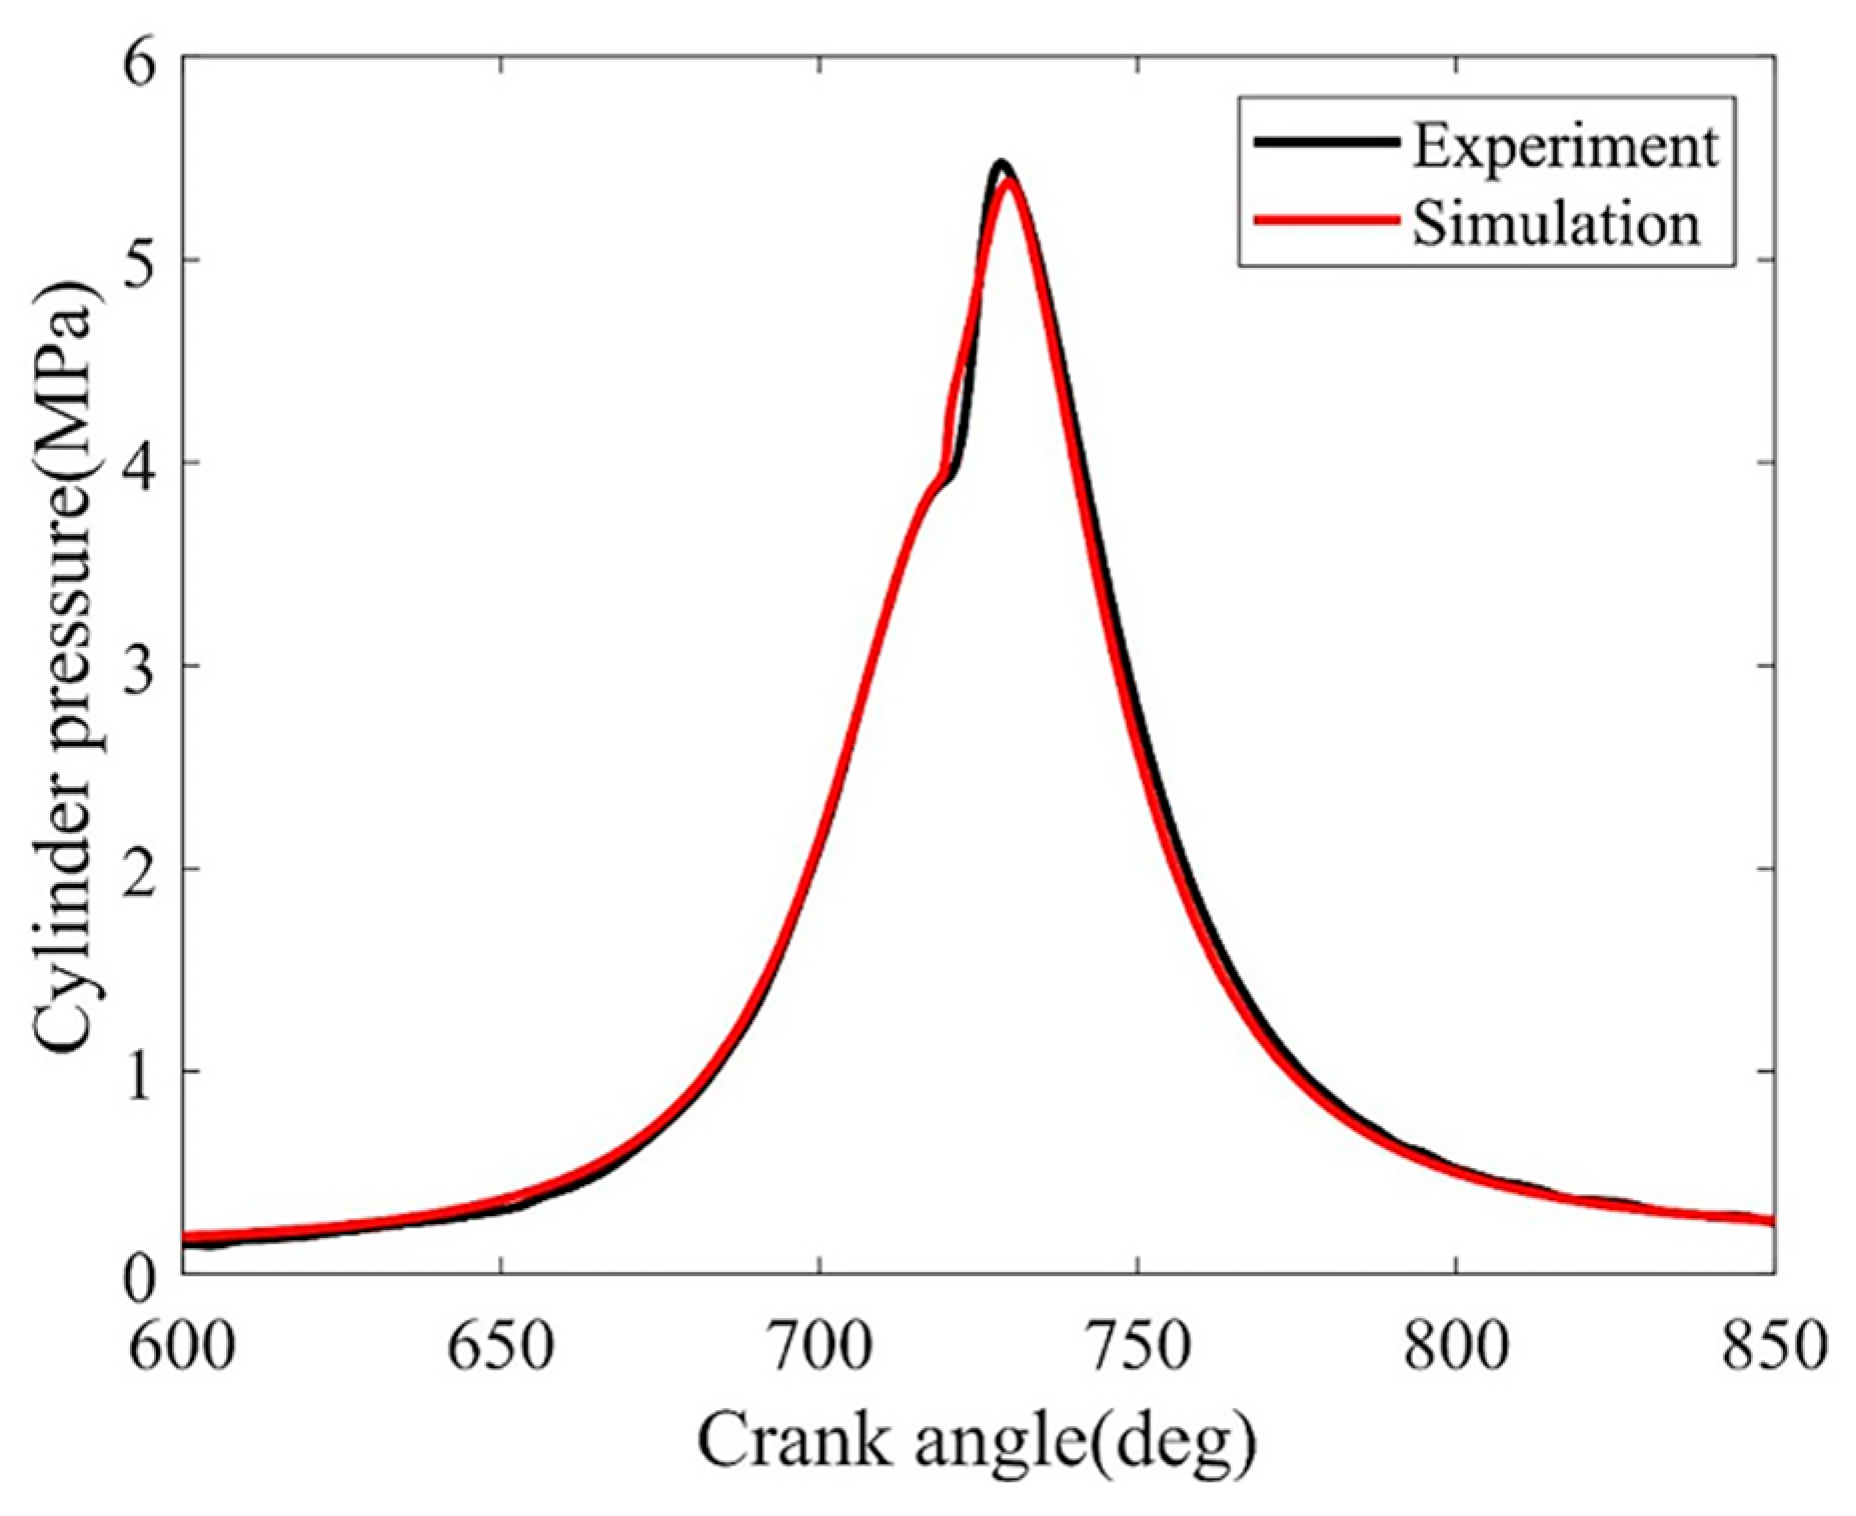
2.4. Mathematical Models and Validation

AVL Fire software has abundant turbulence models, spray models, combustion models, emission models, etc. In order to ensure the accuracy of the numerical simulation results, the model selected is shown in Table 4.
To prove the validity of the combustion chamber model established in this simulation and the accuracy of each parameter setting, after the end of the simulation calculation, each sub-model of the simulation was further calibrated after comparison with the test data, and the setting parameters were further revised. If the error between the simulated cylinder pressure and the test cylinder pressure curve is kept within a certain range, it can be verified that the diesel engine combustion chamber model is valid and reliable. This means that it can reflect the working condition of a diesel engine as accurately as possible. Figure 3 shows the comparison between the simulation and test results at 100% load. It can be seen that the changing trend of cylinder pressure is basically the same and the peak pressure of cylinder pressure data is controlled to less than 5%, which is sufficient to verify the accuracy of the model established in this study and to lay a foundation for further research.

3. Results and Discussion

3.1. Effects of Different Proportions of Biodiesel Blended Fuels on Combustion Characteristics

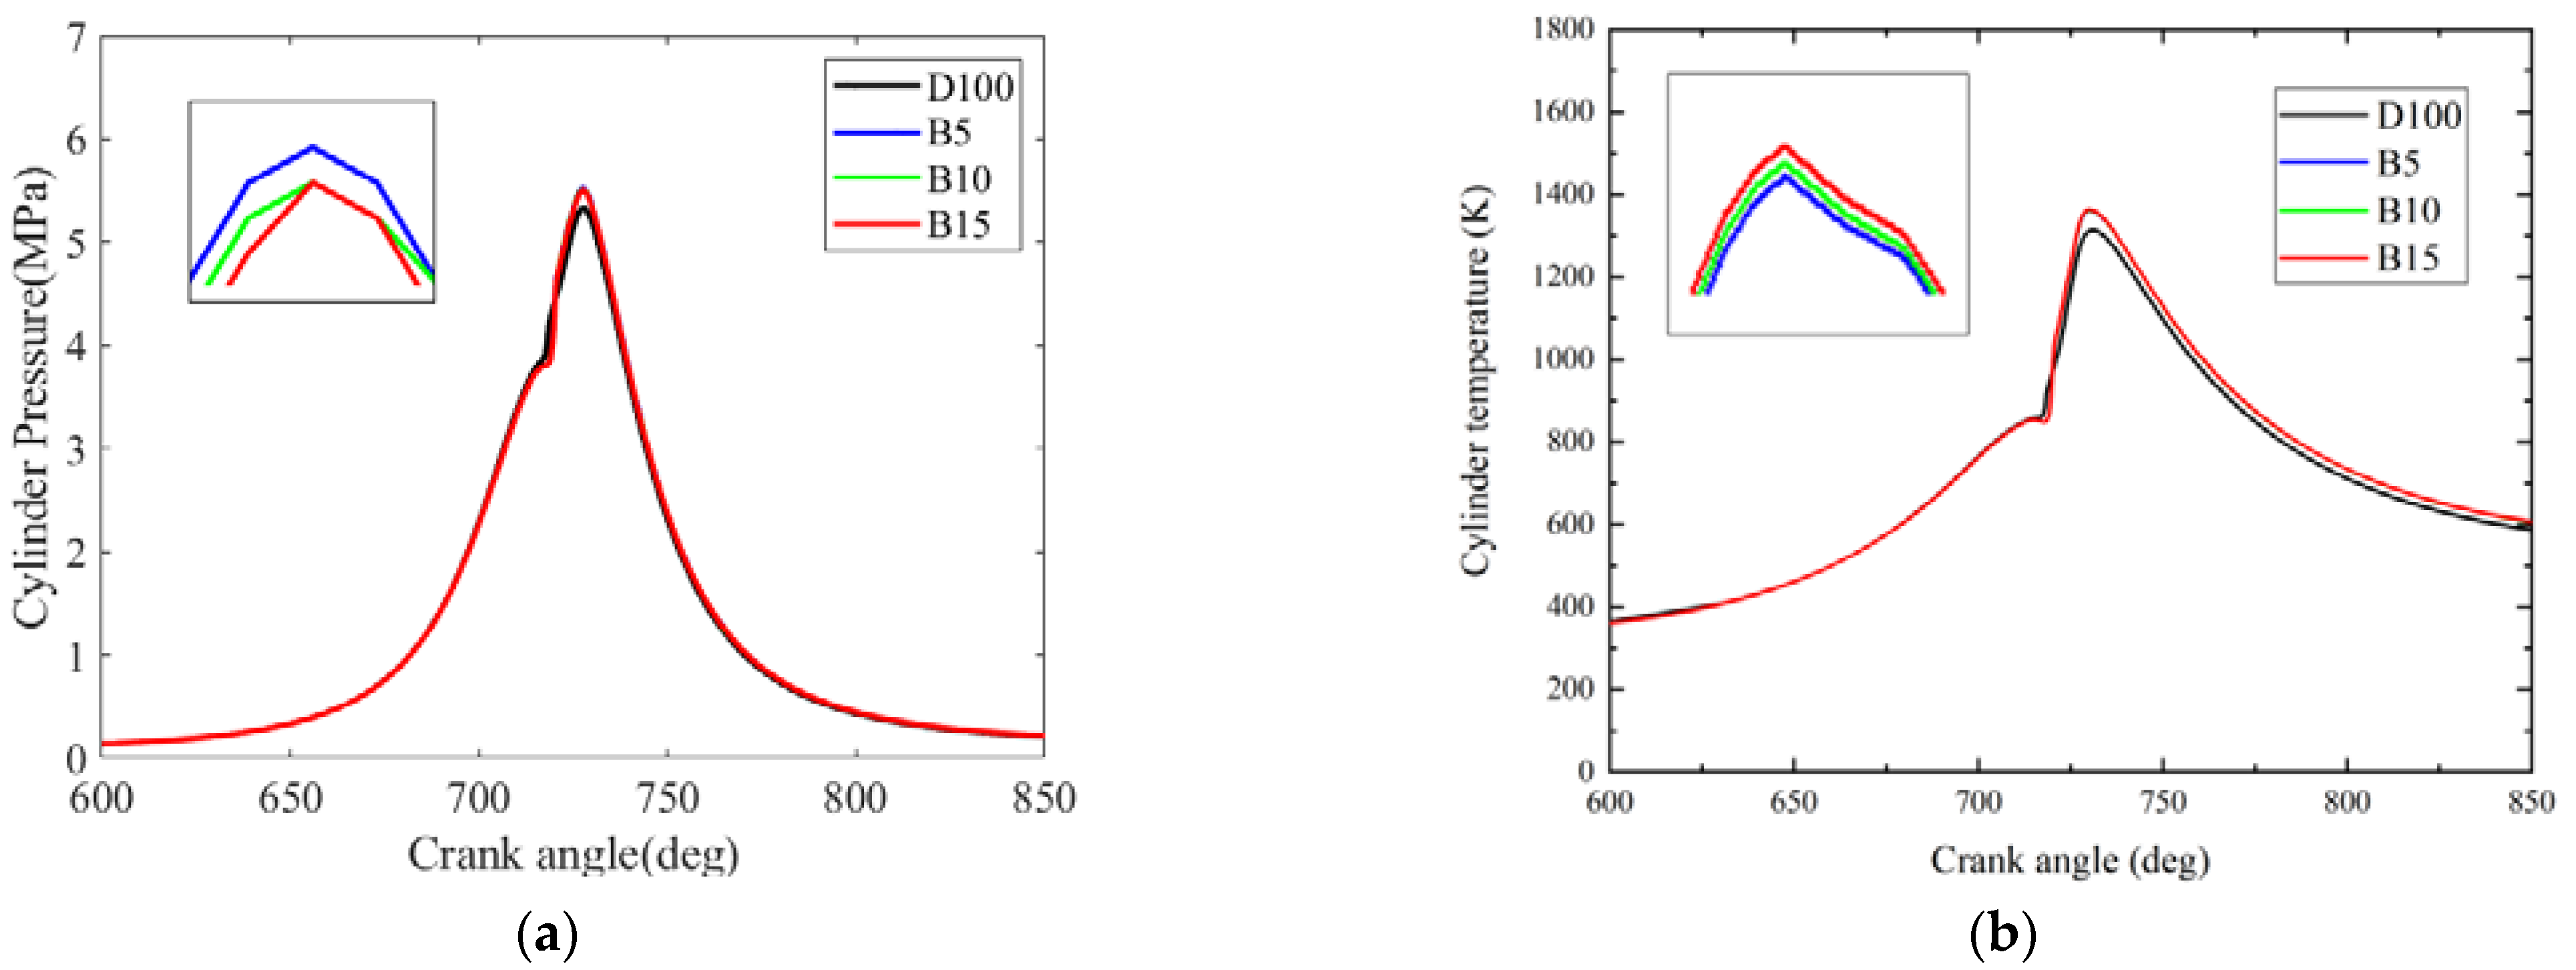
3.1.1. Cylinder Pressure

Figure 4 shows the simulated cylinder pressures and in-cylinder temperature of pure diesel and different percentages of biodiesel blended fuels with the crank angle. As can be seen in Figure 4a, the maximum cylinder pressures of the biodiesel blended fuels are close to the pure diesel fuel, implying that the refined biodiesel blended fuels can already reach power levels similar to those of pure diesel. Compared to diesel fuel, the combustion process of biodiesel blended fuels slows slightly towards the expansion stroke and the center of combustion is slightly away from the TDC (top dead center), resulting in the turbulence intensity in the combustion chamber increasing slightly and providing a better air-fuel mixture. This indicates that improving the mixture quality has a greater impact on improving combustion than the fuel calorific value itself. However, the higher viscosity and poorer atomization quality B15 fuel blends could deteriorate the formation and evaporation of the mixture in the combustion process, which led to a slight drop in the cylinder combustion pressure when compared to B5 and B10.

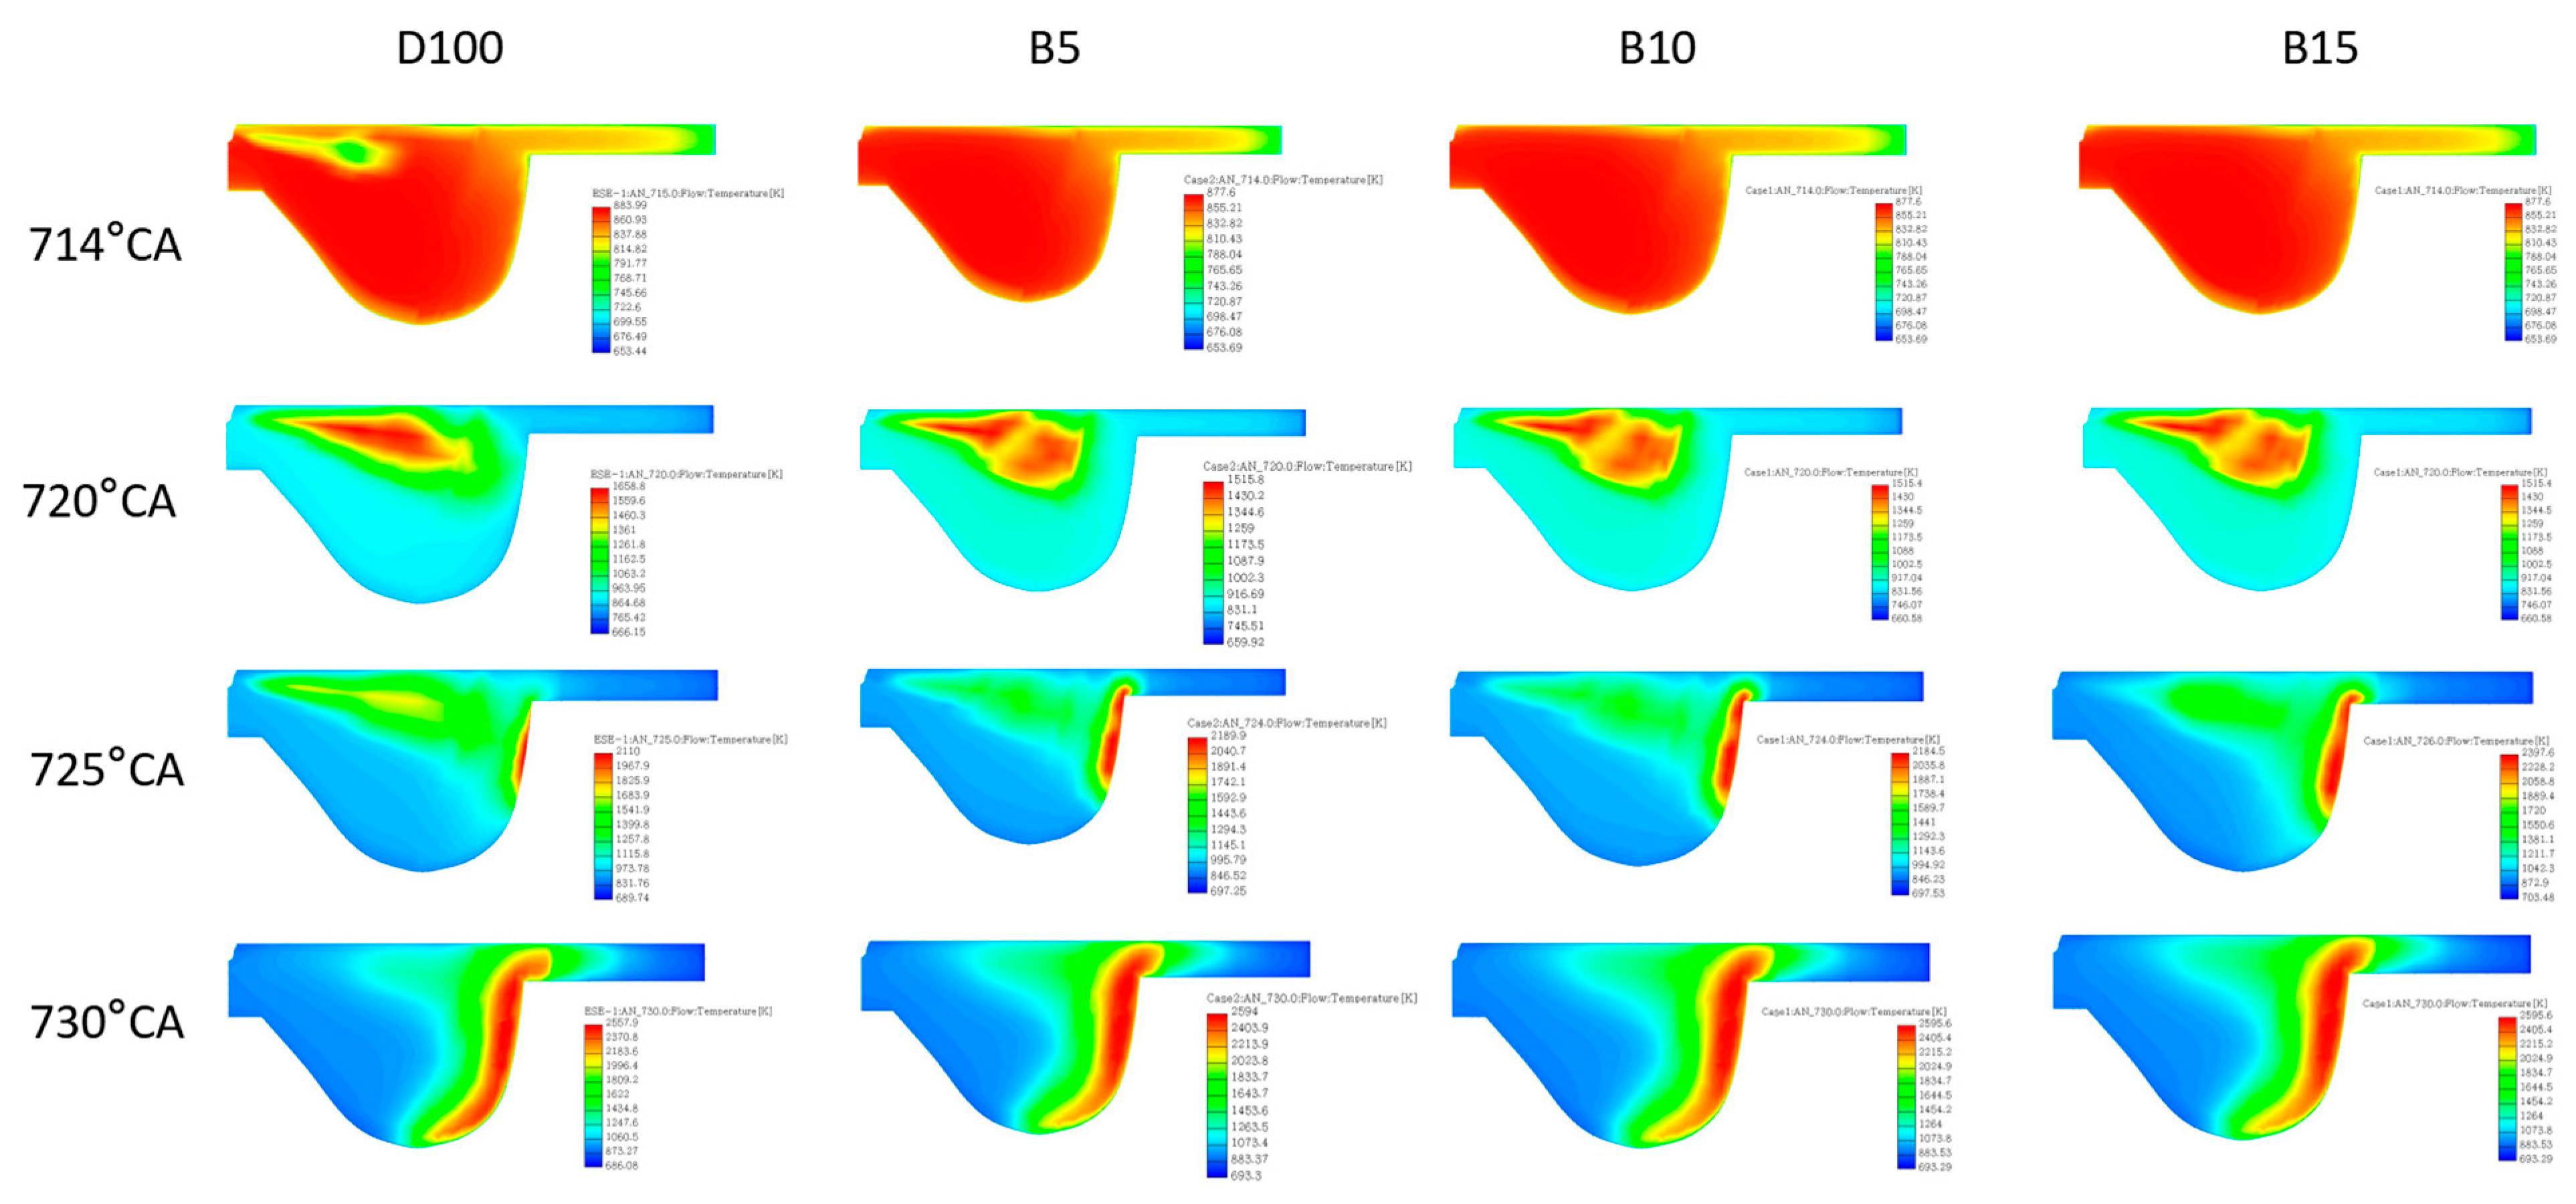
3.1.2. Cylinder Temperature

Figure 4b shows the average cylinder temperature values of different ratios of biodiesel blended fuels and diesel. It can be found that the average cylinder temperature of fuel mixed with biodiesel is higher than that of pure diesel, and the maximum cylinder temperature decreases with the increase of the biodiesel mixing ratio. The main reason for the increase in average cylinder temperature is the higher oxygen content of biodiesel blended fuels. For different biodiesel blend ratios, the calorific value of biodiesel decreases as the blending ratio increases, causing a consequent decrease in the heat of combustion of biodiesel at higher blending ratios (B15).
Figure 5 shows the distribution of the cylinder temperature field of the four fuels at different crank angles. It can be seen that the biodiesel blended fuel is more likely to generate a localized high temperature zone in the environment of the combustion chamber wall at the periphery of the injection compared to diesel, especially after the 725° cranking angle. This moment occurs during the expansion stroke after TDC, which tends to cause afterburning and an increase in cylinder temperature. Although the high oxygen content of biodiesel blended fuels itself has a great effect on the promotion of complete combustion, biodiesel blends have higher viscosity, which tends to lead to reduced spray penetration and causes a local cylinder temperature increase through injection cone angle concentration. Furthermore, the fast combustion rate of biodiesel can reduce the time of radiative heat transfer to the cylinder wall, thus contributing to the reduction of heat transfer losses and providing a higher temperature environment for NOx production. This also promoted the increase of the local high temperature area of biodiesel. However, due to the higher oxygen content, the temperature within the biodiesel blend spray is lower than that of diesel and appears to be more evenly distributed. The main reason for this phenomenon is that the higher oxygen content of biodiesel causes a lower local concentration of fuel inside the spray, which corresponds to an increase in air entrainment inside the spray, resulting in a more uniform fuel distribution. Biodiesels also have a slightly lower calorific value compared to diesel, so the actual combustion temperature in the spray is also lower than that of diesel spray.

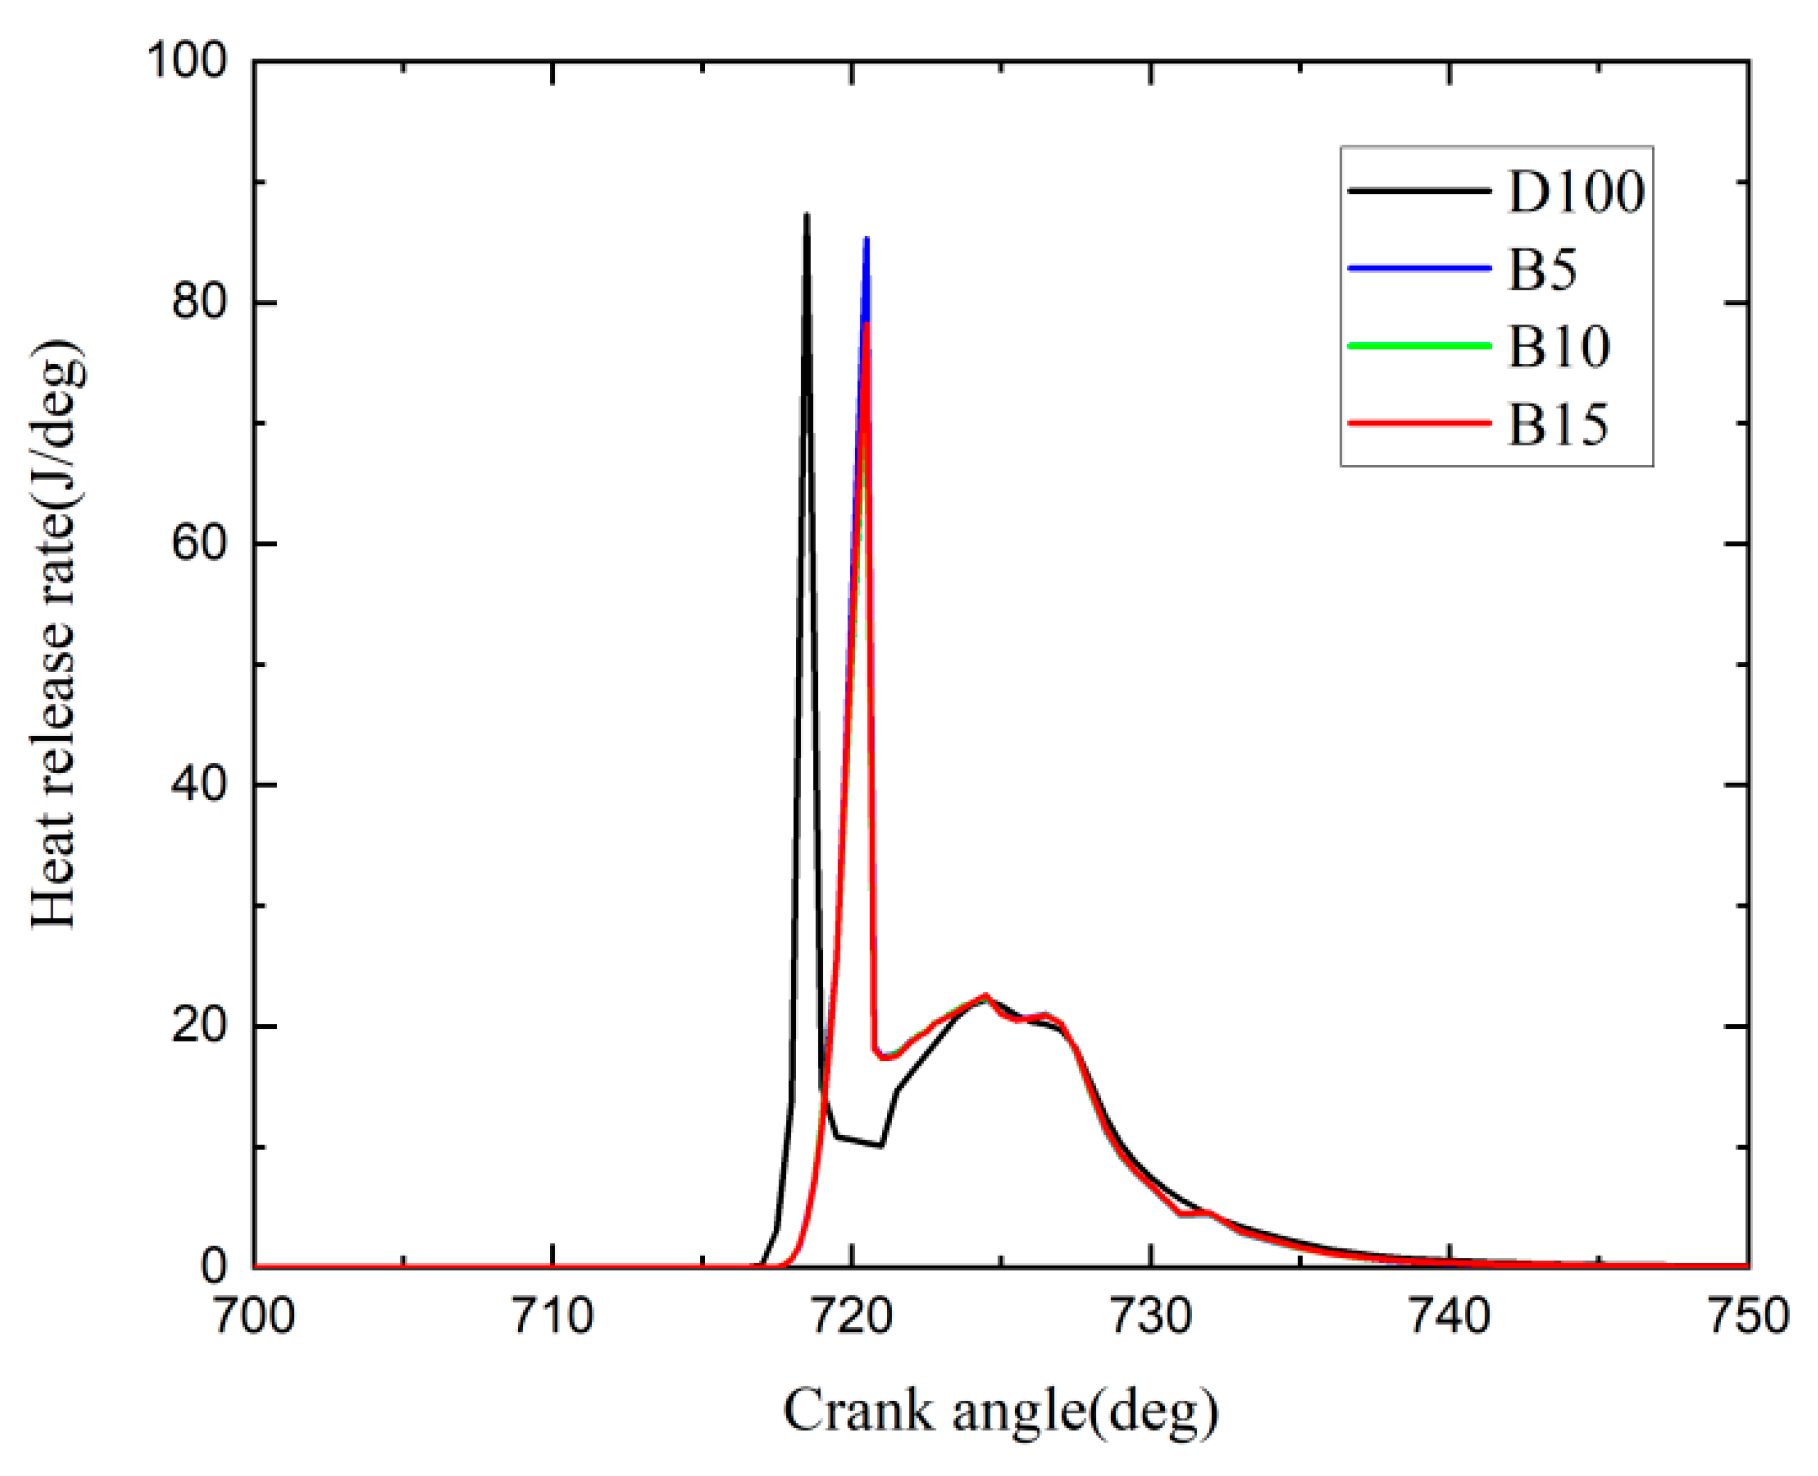
3.1.3. Heat Release Rate

Figure 6 shows the calculated transient heat release rate (HRR) for the four fuels. The detailed calculation progress of the transient heat release rate can be found in the references [25,26]. It can be seen from the result of Figure 6, for all fuels, that the transient HRR is 0 from the compression stage to the combustion reaction stage without ignition. When the ignition starts, the fuel rapidly burns and releases a large amount of heat, which is the rapid combustion stage. In this stage, the transient HRR rises sharply to the highest value, and then it drops rapidly after the fuel in the engine cylinder is completely consumed.
During the rapid combustion phase, the instantaneous HRR of B5 biodiesel blends was not much lower than that of diesel fuel. However, the onset of combustion of biodiesel blends was significantly delayed compared to diesel fuel. Although the heating value is not as high as that of diesel fuel, the higher HRR of biodiesel blends implies more efficient combustion in the cylinder. According to the results of our previous spray penetration studies [27], the gas density around the cylinder had a significant effect on the spray tip penetration rate. It can be assumed that the air-fuel mixing effect and the gas environment in the cylinder were improved by the biodiesel fuel blends. Therefore, the oxygen content in the biodiesel fuel blends promotes the rapid release of large amounts of heat at this rapid combustion stage. This also indicates that improving the blend quality by increasing the oxygen content contributes significantly to the combustion exotherm. Compared to B5, a gradual decrease in transient HRR is observed for B10 and B15 due to the lower heating value.

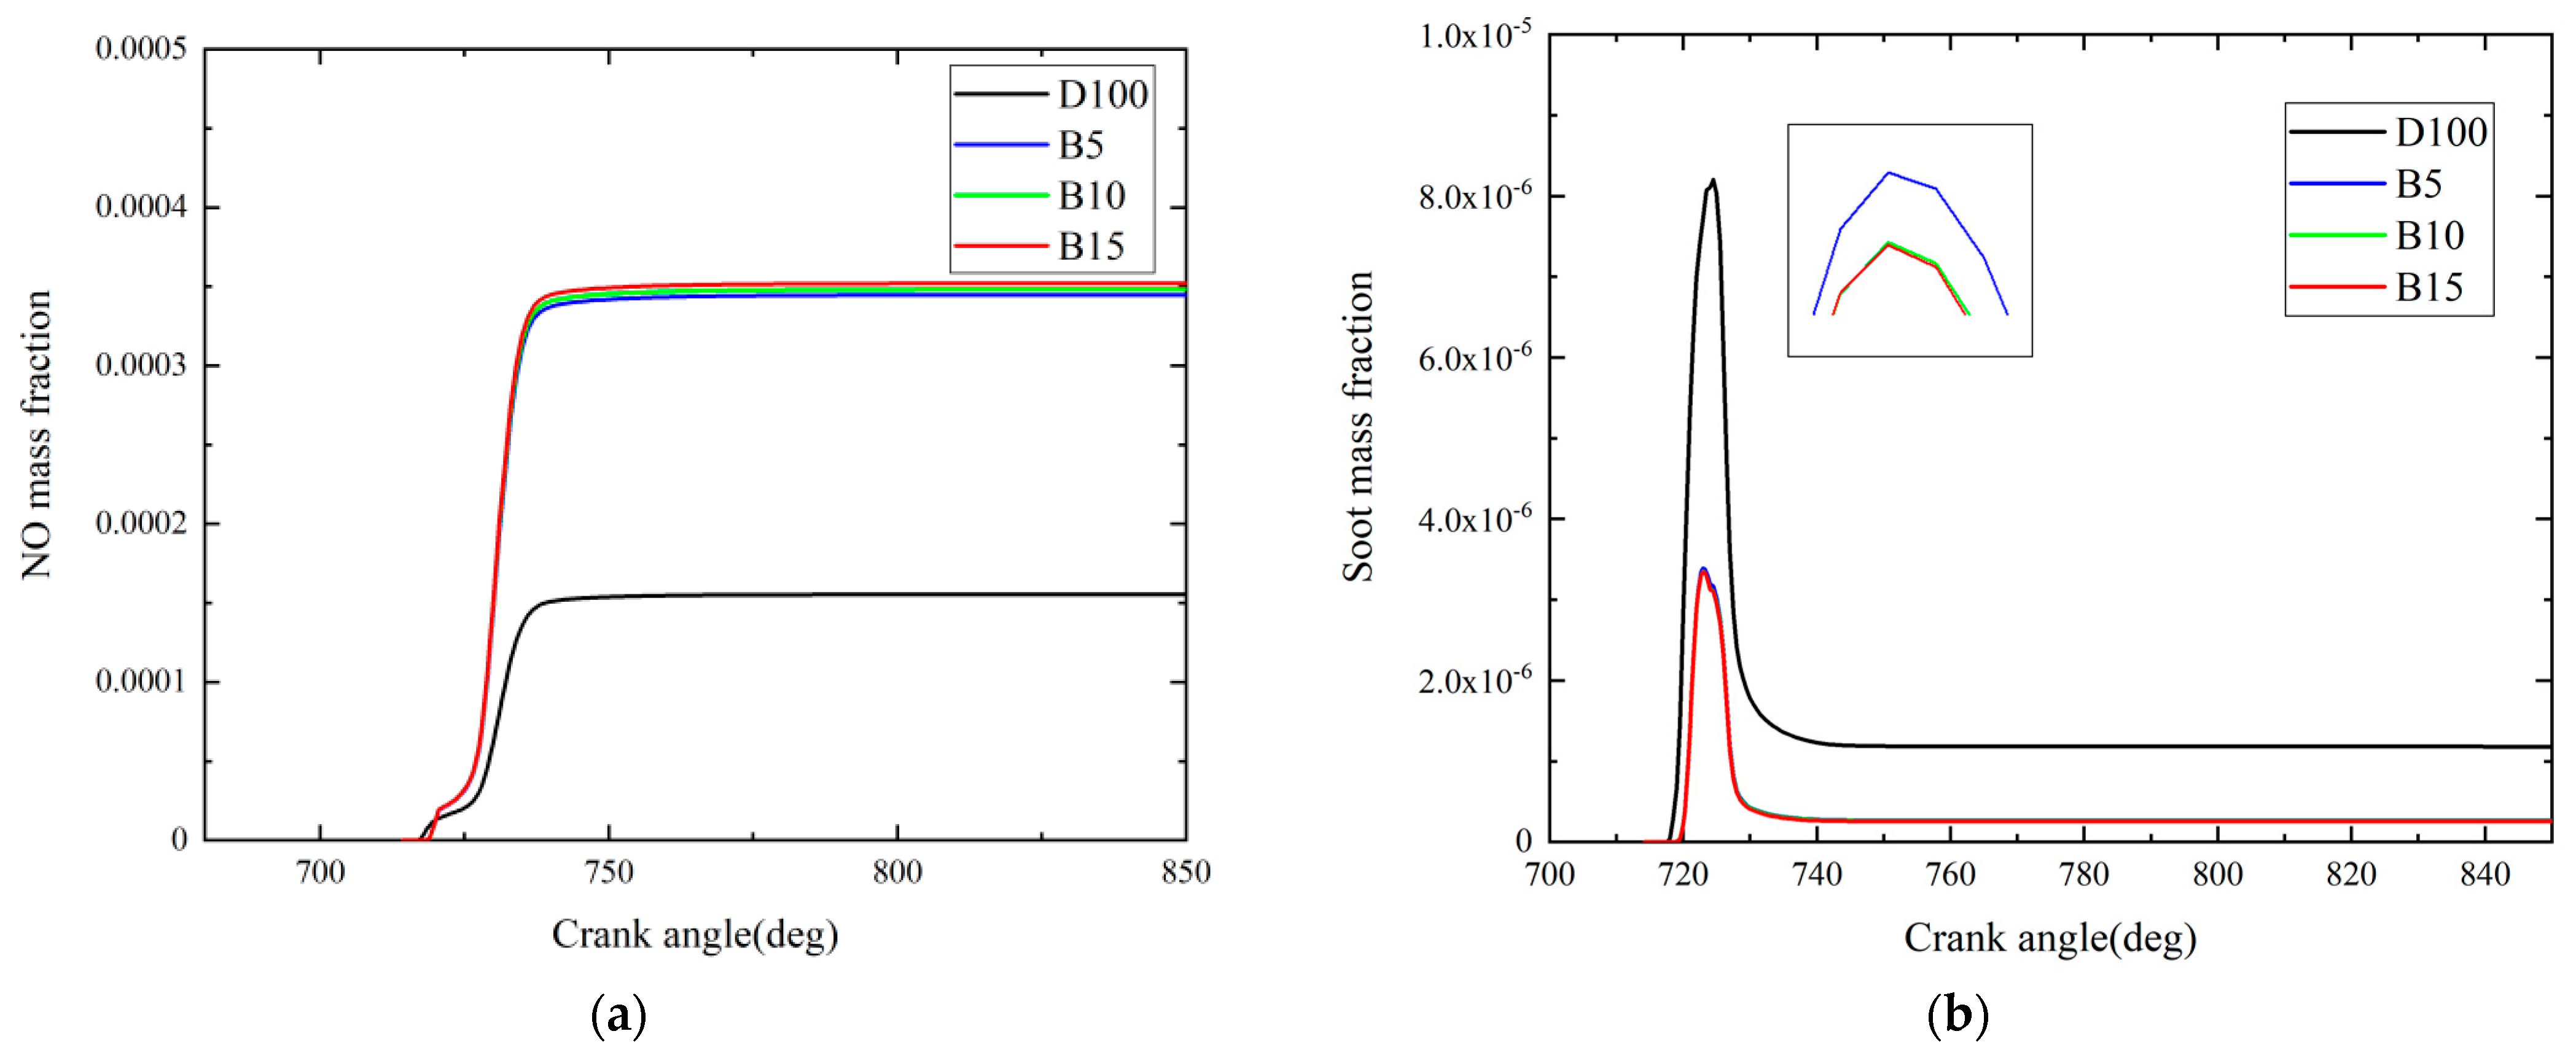
3.1.4. Nitrogen Oxides Emission

Figure 7 shows the results of NO and soot emission. The main NOx emission of diesel engines is NO and NO2. In the NOx emission, the largest proportion is NO, accounting for more than 95%. Therefore, Figure 7a shows the NO emission for the four fuels. It can be found that the biodiesel fuels have increased the NO emission. According to the NOx generation mechanism, the important factors affecting this include temperature, combustion time, and oxygen content [28]. Therefore, the higher oxygen content and the higher combustion temperature during the combustion process for the B5, B10 and B15 biodiesel fuel played a role in facilitating the NO generation. The high surface tension of biodiesel leads to the poor atomization of part fuels and prolonged spray penetration, resulting in longer ignition delays. With the amount of fuel injected into the cylinder during the ignition delay period increased, the premixed combustion time resulted in increased NO emissions for B5, B10, and B15.

3.1.5. Soot Emission

Figure 7b shows the comparison of soot emission for the three biodiesel blended fuels and the diesel fuel under the various crank angles. Under the condition of high temperature, hypoxia and rich fuel, hydrocarbon fuel generates carbonaceous particles through the reaction pathway of hydrogen extraction and acetylene addition (HACA). The separation of hydrogen atoms on the surface of soot particles leads to the formation of activated free radicals, which can be used to adsorb acetylene molecules and promote the growth of soot. The figure shows that the generation of soot is mainly concentrated near to the TDC. It was found that the biodiesel blended fuels with high oxygen content reduced soot emission. The higher oxygen content in three biodiesel blended fuels increases the oxygen content in the spray, which corresponds to an increase in the air entrainment in the lift-off length. A more uniform temperature distribution field inside the spray also provides a better environment for the oxidation of the primary carbon nuclei. However, soot emissions increased with the increase of the blend ratio. This is because the deterioration of atomization due to the increased viscosity is greater than the improvement of the fuel due to its higher oxygen content, so the soot fraction increases with the increased blend ratio.

3.2. Effects of Different EGR Rates and Injection Durations

The above results show that the biodiesel blended fuel results in a better engine emissions performance, despite a slightly higher NOx emission. Due to the influence of raw material price and yield, the following study was focused on the B10 in order to be closer to the application type on real ships. An effect of different EGR rates and injection durations on the combustion and emission was investigated to make additional optimizations of combustion and to reduce NOx emissions.

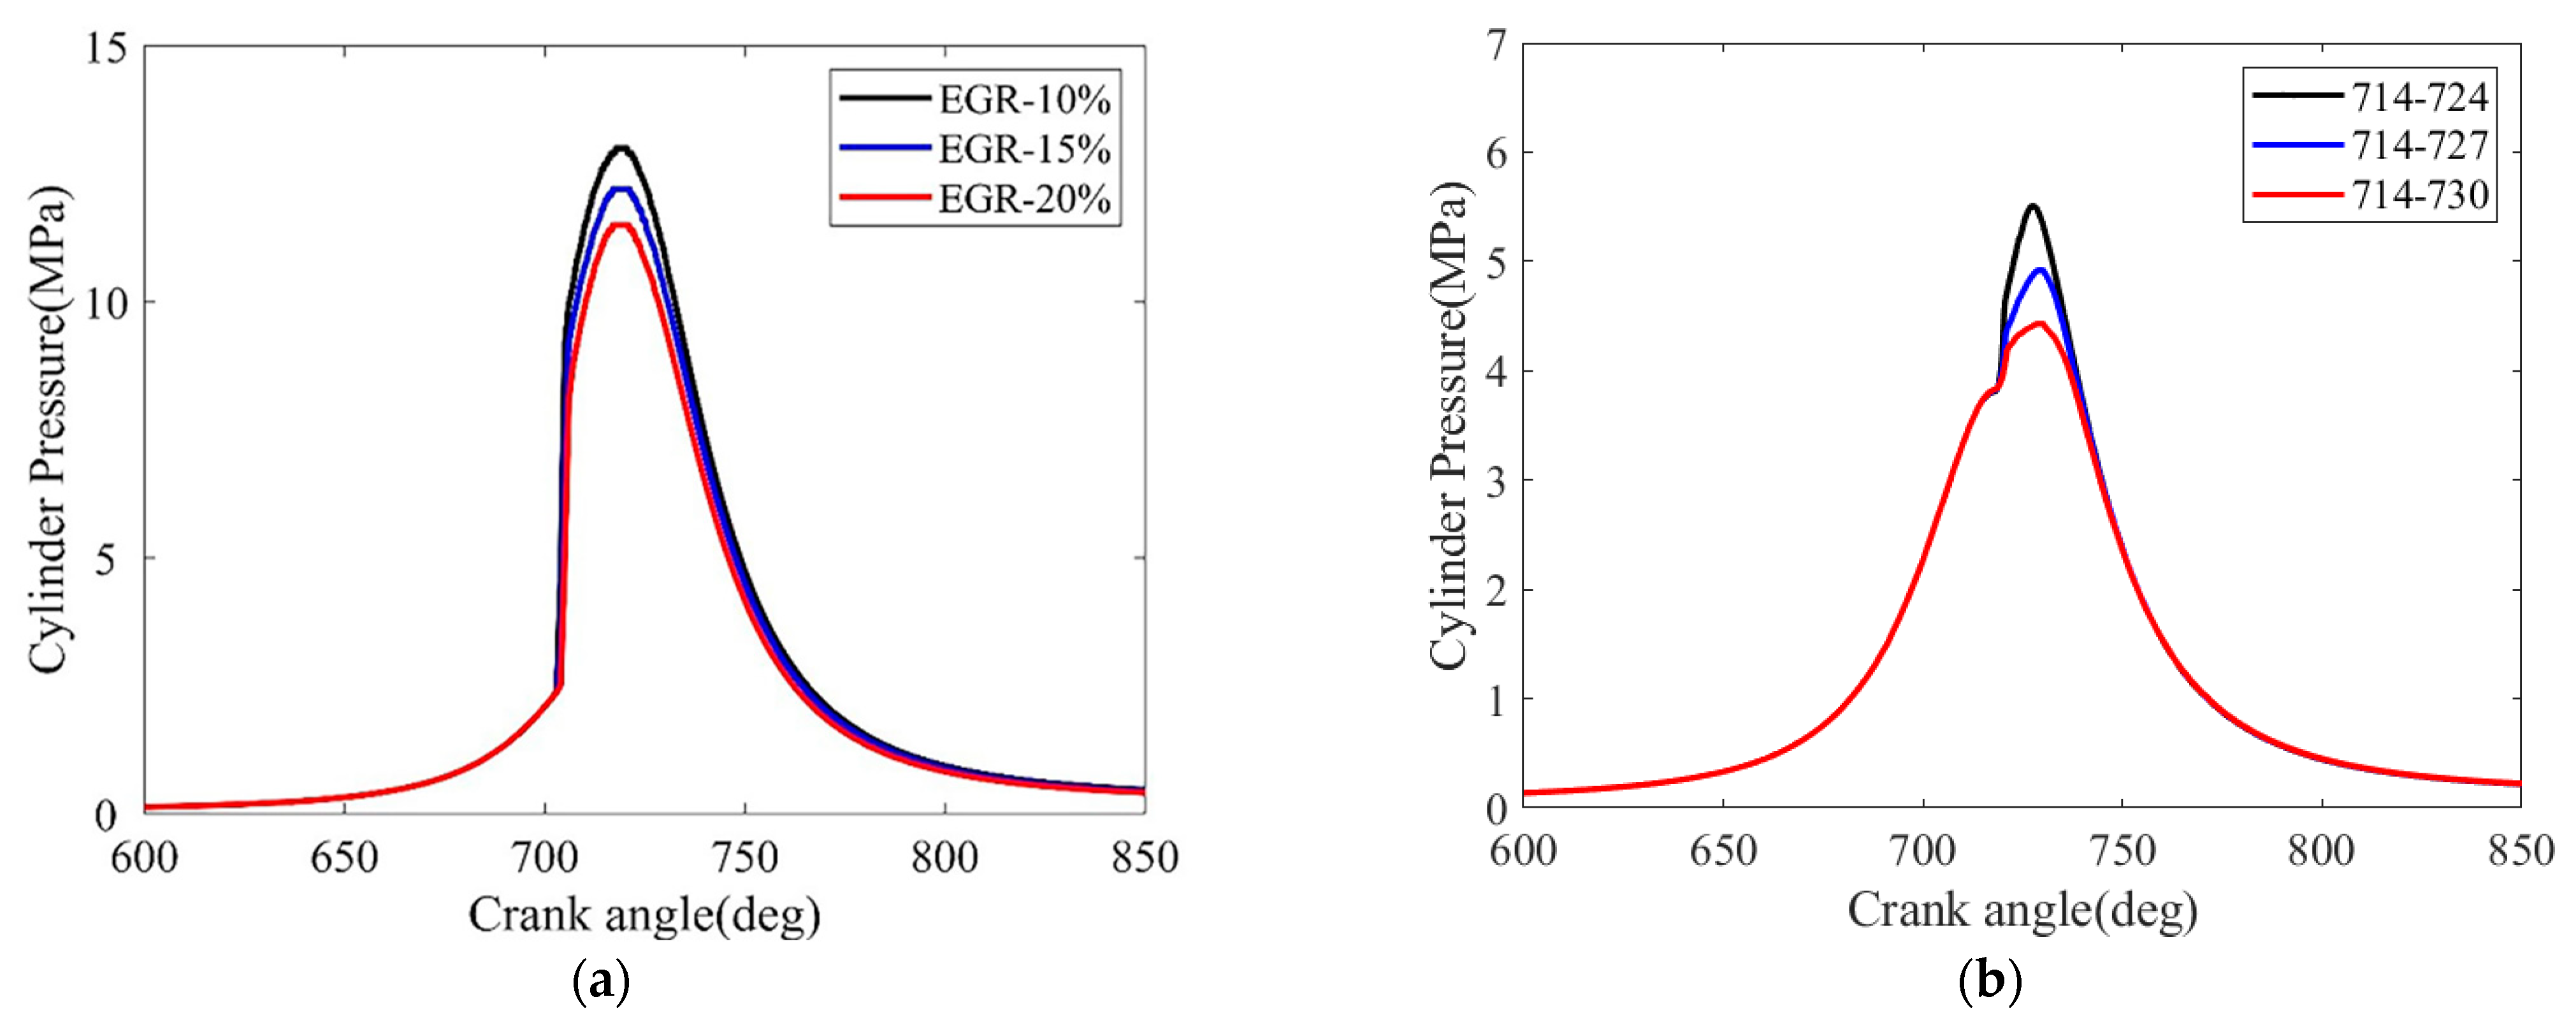
3.2.1. Cylinder Pressure

Figure 8 shows the comparison of cylinder pressures at different EGR rates and injection durations for the B10. As can be seen from Figure 8a, the cylinder pressures gradually decrease as the EGR rates increase. For example, when B10 is used in a diesel engine, the peak pressure in cylinders of 10%, 15% and 20% EGR rates are 12.9 Mpa, 12.2 Mpa and 11.4 Mpa, respectively. The main reason for this is that the elevated EGR rate increases the amount of exhaust gas that enters into the cylinder and dilutes the fresh air in the cylinder. As a result, the excess air coefficient has reduced in the cylinder, which inhibits the complete combustion in the cylinder and leads to the further reduction of cylinder pressure.
Figure 8b shows a comparison of cylinder pressures for different injection durations. It can be seen that the cylinder pressures decrease with the delay at the end of injection (EOI), in other words, with an increase in injection duration. Primarily because the prolonged injection, resulting in a loss of injection pressure and the declining injection volume, and there was not enough time for the mixture of spray and air, which is not conducive to the combustion process and eventually led to a decline in peak cylinder pressure of diesel engine combustion. In addition, since most of the combustion occurs during the expansion stroke, the downward piston movement further reduces the in-cylinder pressure and combustion temperature. And the shorter injection duration improves the mixture of spray and air. Therefore, the start of combustion is earlier than the longer fuel injection time.

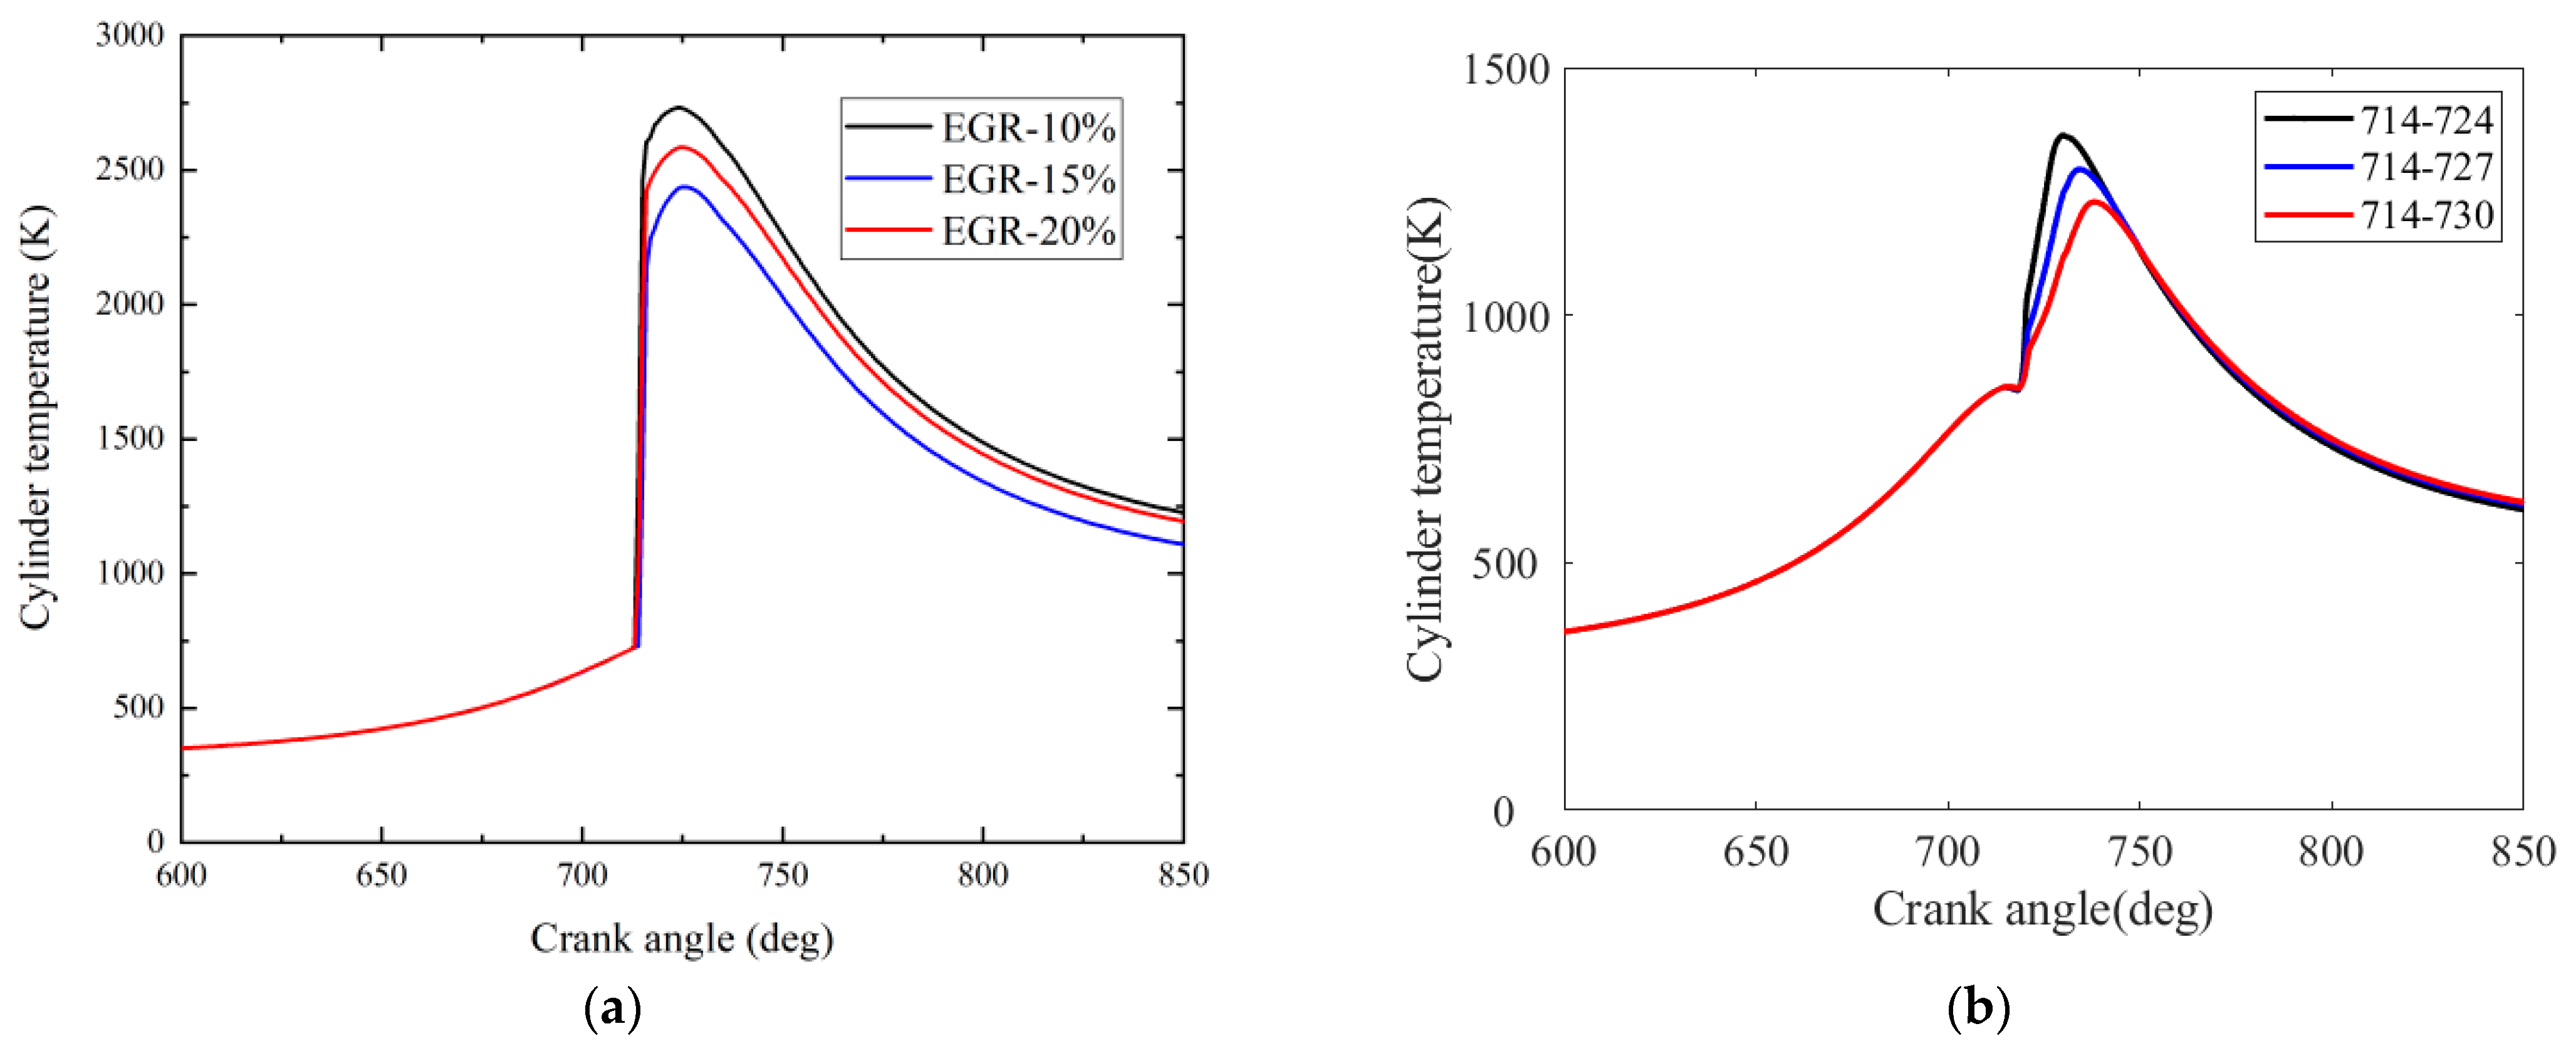
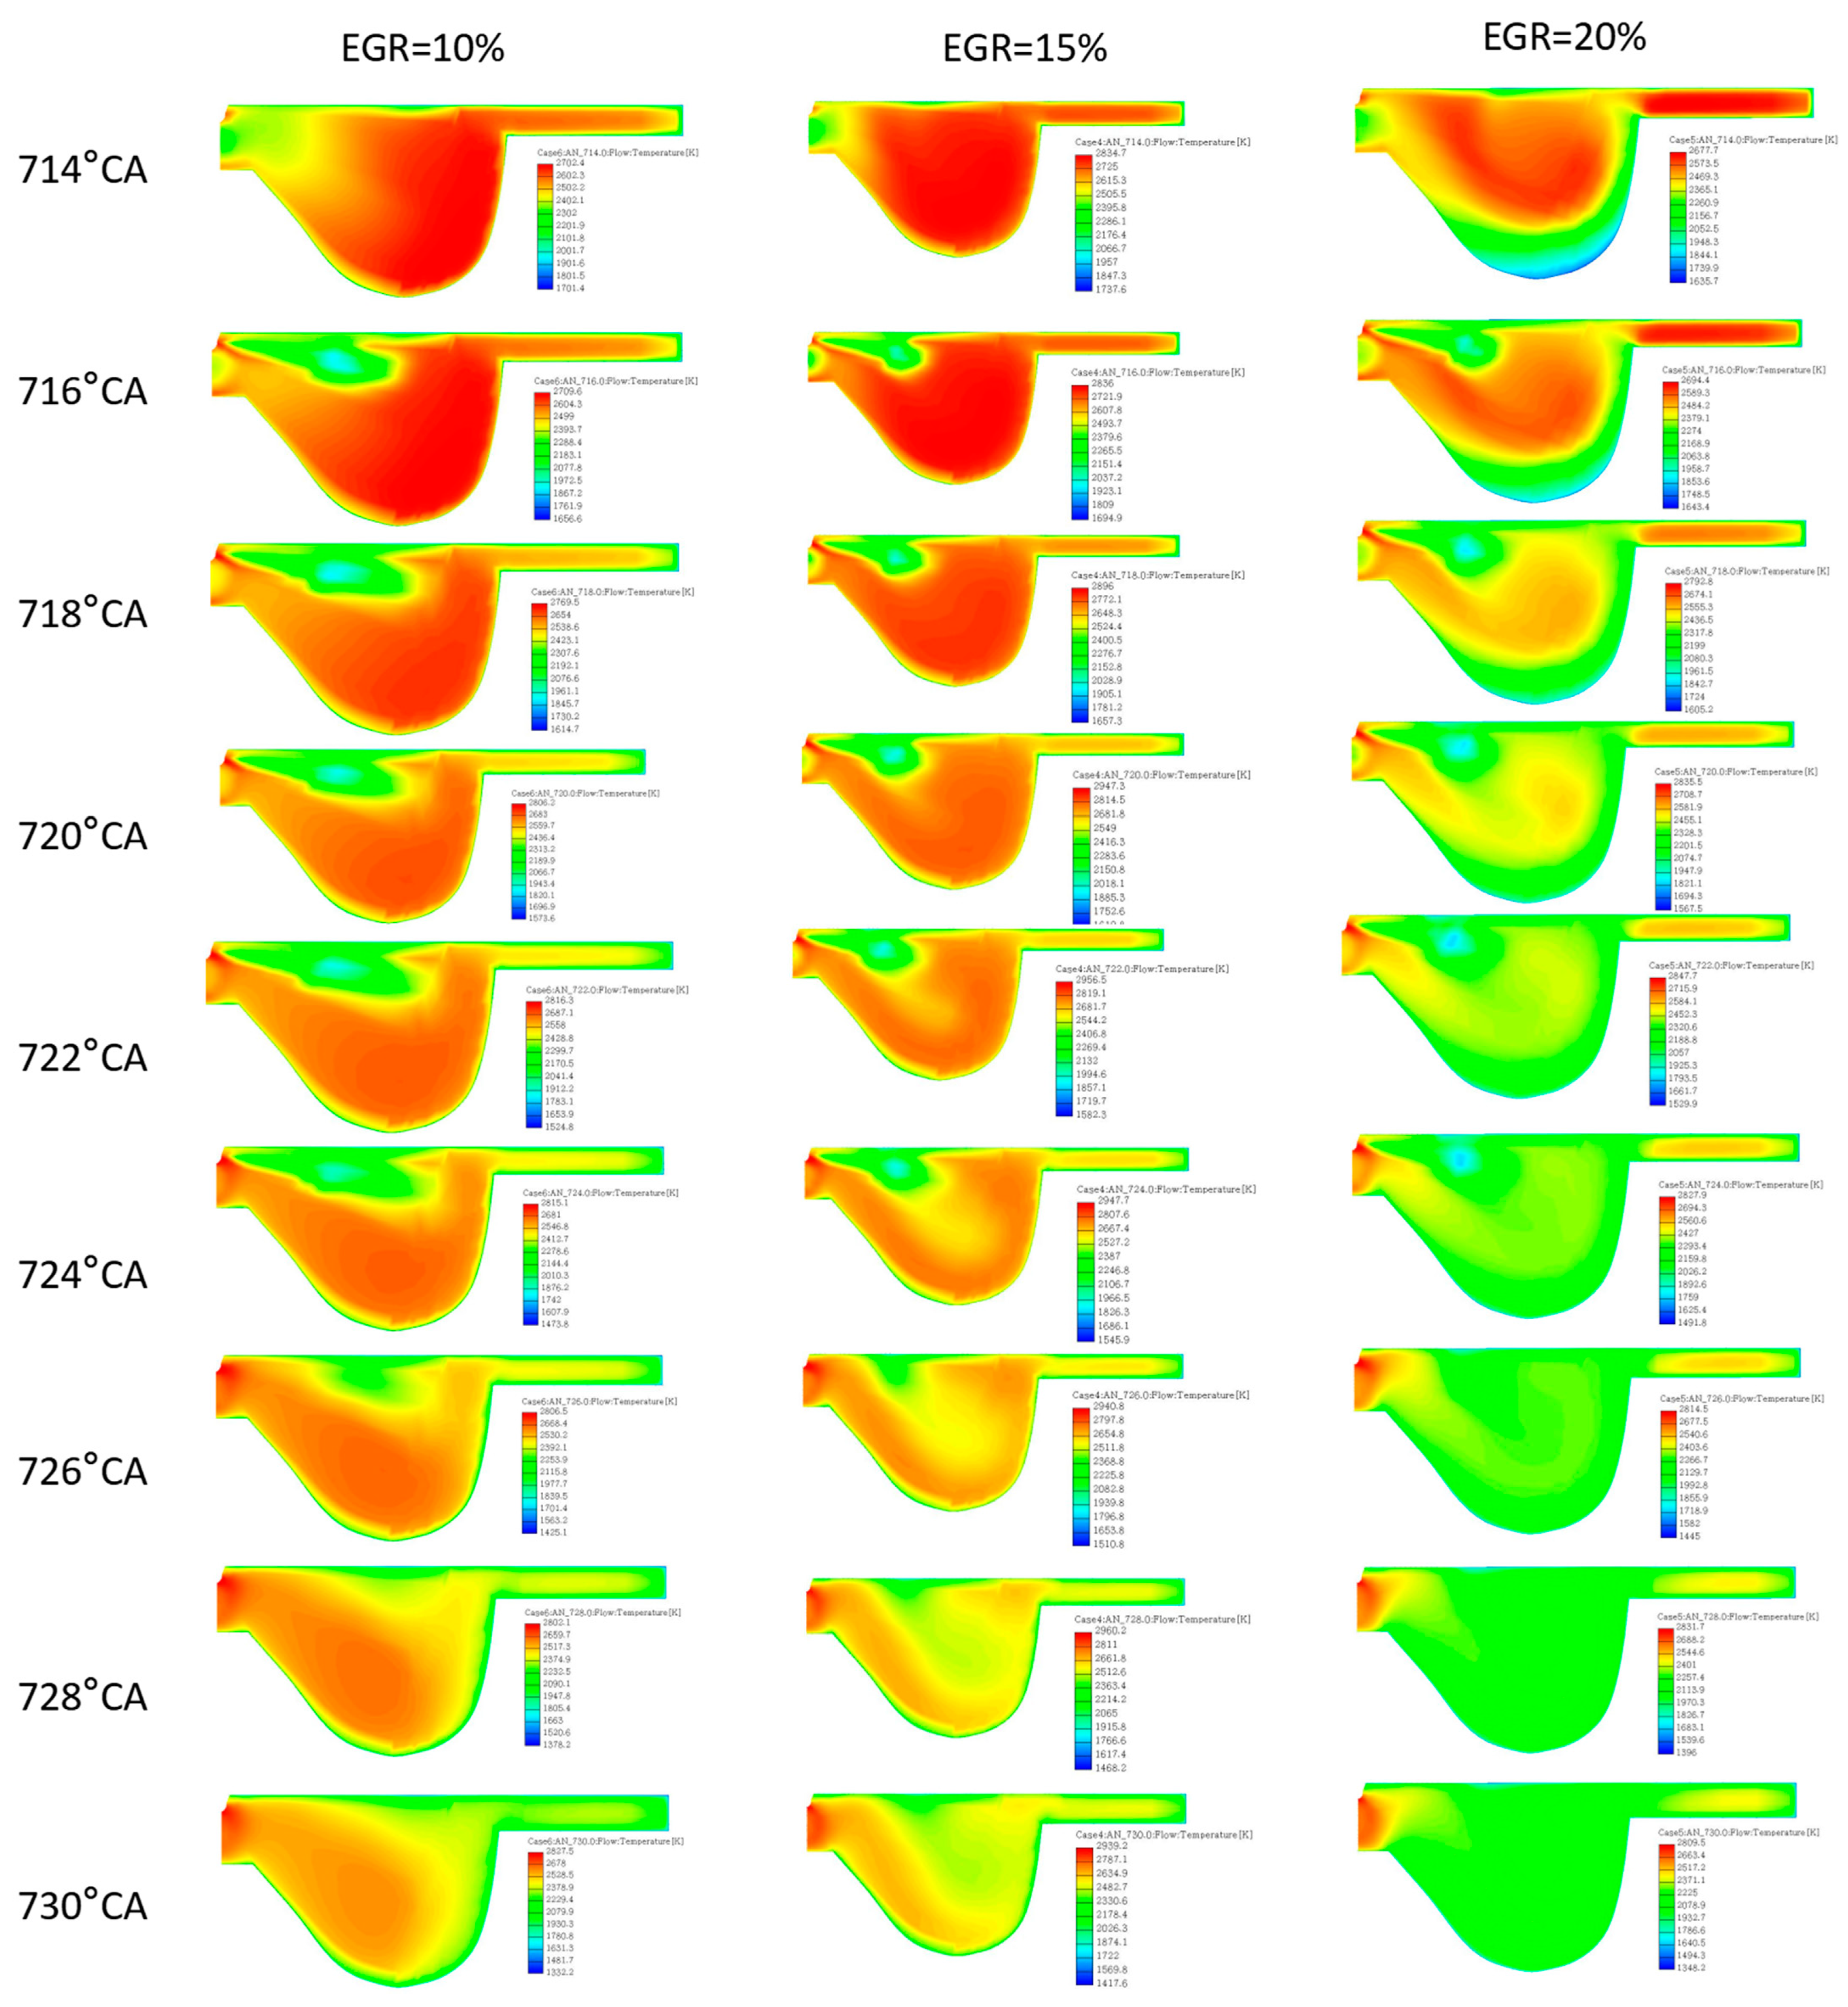
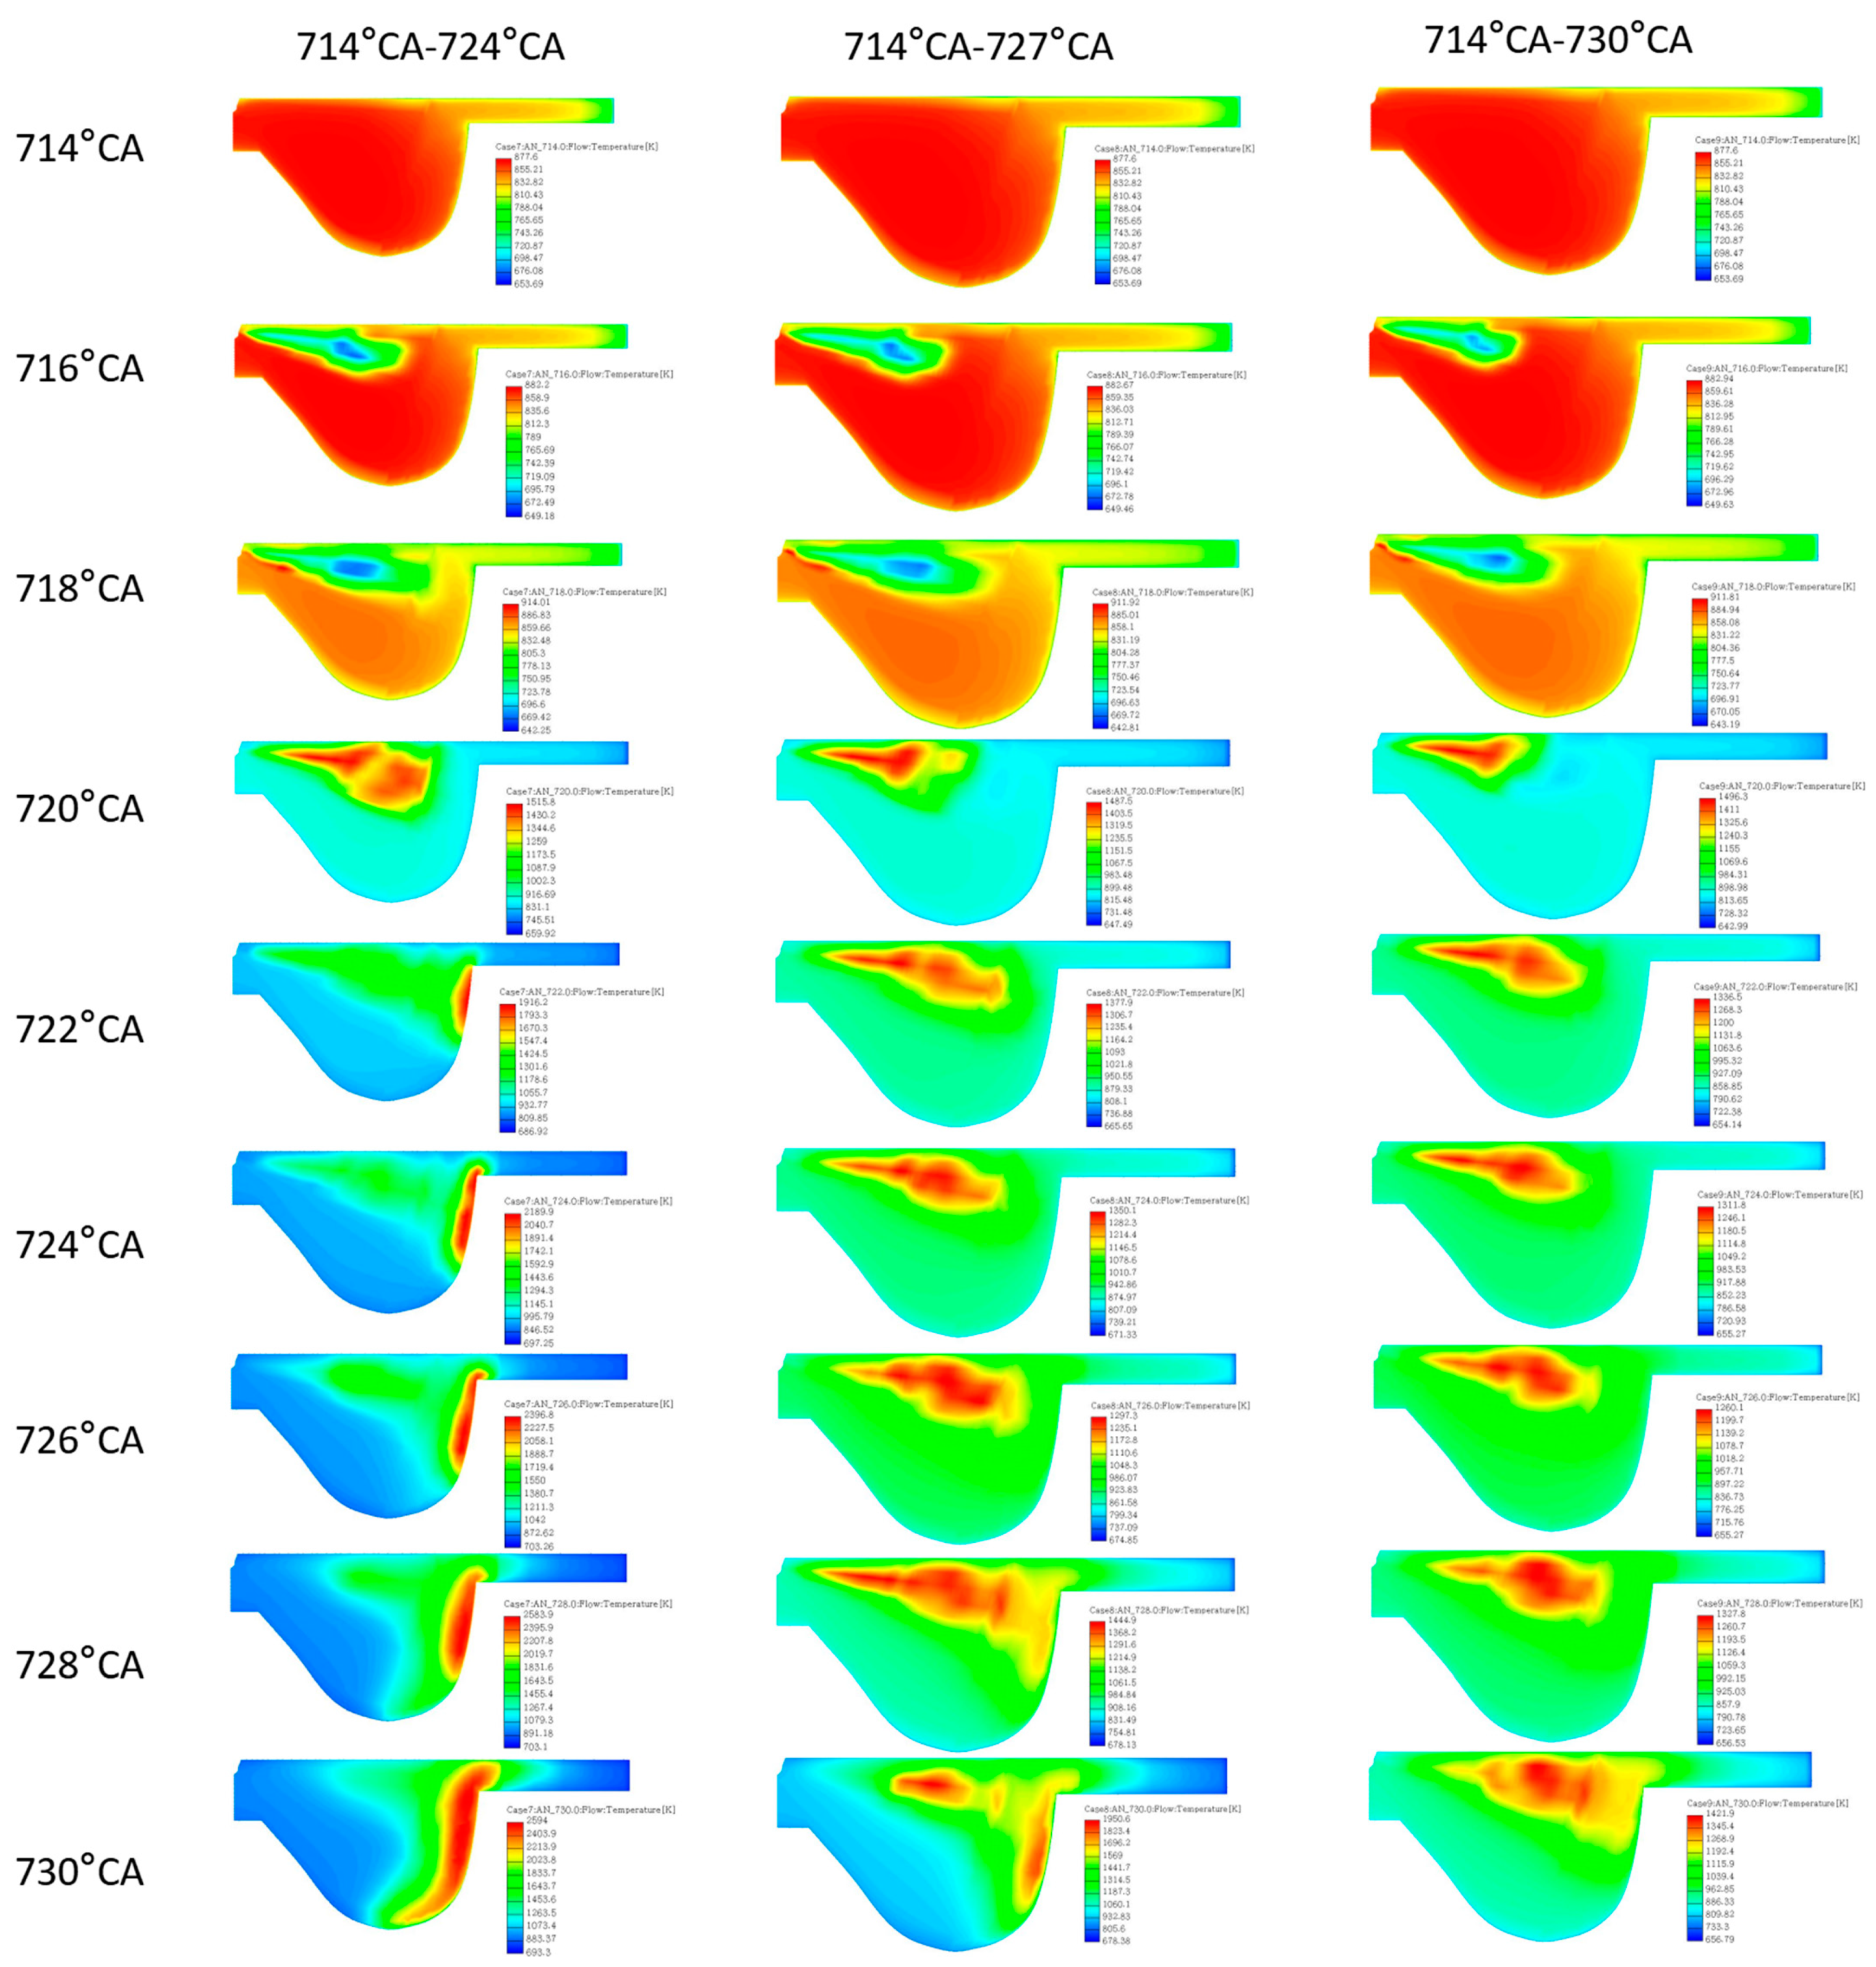
3.2.2. Cylinder Temperature

Figure 9 shows the comparison of the cylinder temperature for different EGR rates and injection durations. It can be seen from Figure 9a that the cylinder temperature decreases with the elevated EGR rate. For example, by comparing EGR results, the cylinder temperature for the 15% EGR rate and 20% EGR rate have decreased by 2.65% and 5.35%, respectively, compared to that of the 10% EGR rate. The gas dilution resulting from the increasing EGR rate will reduce the cylinder temperature and increase the possibilities of incomplete combustion, resulting in the reduction of accumulated HRR and a further decrease of the average cylinder temperature. Another significant aspect of the increasing EGR rate is the increasing opportunities for CO2 emission. This is because the increasing amount of exhaust gas has reduced the fresh air that enters into the cylinder, and the gases such as CO2 and H2O also increase accordingly.
Figure 9b shows the cylinder temperature under different injection durations. It can be seen that the postponed EOI time for 727 °CA and 730 °CA has reduced the peak of cylinder temperature by 5% and 9.8%, respectively, compared to the initial 724 °CA. This trend is consistent with the cylinder pressure trend. The injection pressure will increase when the injection duration becomes shorter. In such a situation, the short injection time makes the injection pressure increase, the increased injection speed makes the fuel quickly enter the cylinder, and the gas quickly combusted, and complete combustion increases more heat, so the cylinder temperature will be higher.
To further understand the temperature distribution and changes at different locations in the cylinder, the cylinder temperature field distribution was plotted with various crank angles and EGR rates, as shown in Figure 10. More specifically, the region temperature decreases with increasing crank angle or EGR ratio. This is basically consistent with the changing trend of cylinder combustion temperature in Figure 9. Since the introduction of EGR reduces the oxygen concentration and temperature in the combustion chamber, it will increase the ignition delay time of the fuel and will tend to cause the incomplete combustion of the fuel. At the same time, the gas flow caused by the introduction of external exhaust will also take away some of the heat in the combustion chamber. Therefore, the local temperature decreases with the increase of the EGR rate.
Figure 11 shows the distribution of the cylinder temperature field under different crank angles and injection durations. It can be seen that the local temperature in the cylinder decreases with the increase of injection duration. In the adiabatic mixing process, the longer the injection duration, the more fully the fuel and air will be mixed, and the more combustible mixture will be produced in the injection zone. The ignition delay is correspondingly prolonged. This cools the ignition site, thereby reducing the local temperature in the cylinder [27]. Therefore, the local temperature in the cylinder decreases with the increase of injection duration.

3.2.3. Heat Release Rate

Figure 12 shows the comparison of the HRR of different EGR rates and injection durations. Figure 12a shows the comparison of the change curves of cylinder HRR with the crank angle under different EGR rates. According to the results in the figure, the variation trend of the heat release rate in the cylinder is roughly the same as that of the cylinder pressure curve. The peak value of the heat release rate decreases with the increase of the EGR rate, and the time of the peak value gradually moves away from the top dead center. The main reason for this phenomenon is that with the increase of EGR, the amount of triatomic gases entering the cylinder in the exhaust gas also increases, which makes the specific heat capacity of the intake temperature increase. At the same time, the gas in the cylinder is diluted by the exhaust gas to a certain extent, and the oxygen content of the diluted gas in the cylinder is reduced, which further inhibits the combustion rate in the cylinder. Moreover, inert gases in the exhaust gas also hinder the chemical reaction, which eventually leads to the reduction of the heat release rate and the delay of the peak. Figure 13a shows the comparison of cumulative heat release curves of B10 fuel during combustion with different EGR rates. It can be seen that when the same fuel is used, the peak value of the cumulative heat release rate decreases with the increase of the EGR rate. This is mainly because the increase of EGR will increase the amount of exhaust gas entering the cylinder for combustion, and the excess exhaust gas will lead to the decrease of oxygen content in the cylinder and the increase of gas-specific heat. The cumulative heat release in the cylinder decreased significantly due to many factors, such as the negative influence on the combustion process.
Figure 12b shows the comparison of transient HRR at different crank angles at various injection durations. It can be seen that the transient HRR trend is consistent with the in-cylinder pressure. The increase of injection duration will decrease the combustion pressure, increase the spray tip permeability, and increase the injection cone angle [29]. This results in relatively poor combustion [30]. In addition, it makes the mixture of fuel and air worse [31]. This causes the HRR to decrease as the ejection duration increases, as does the final accumulated heat release, as shown in Figure 13b.

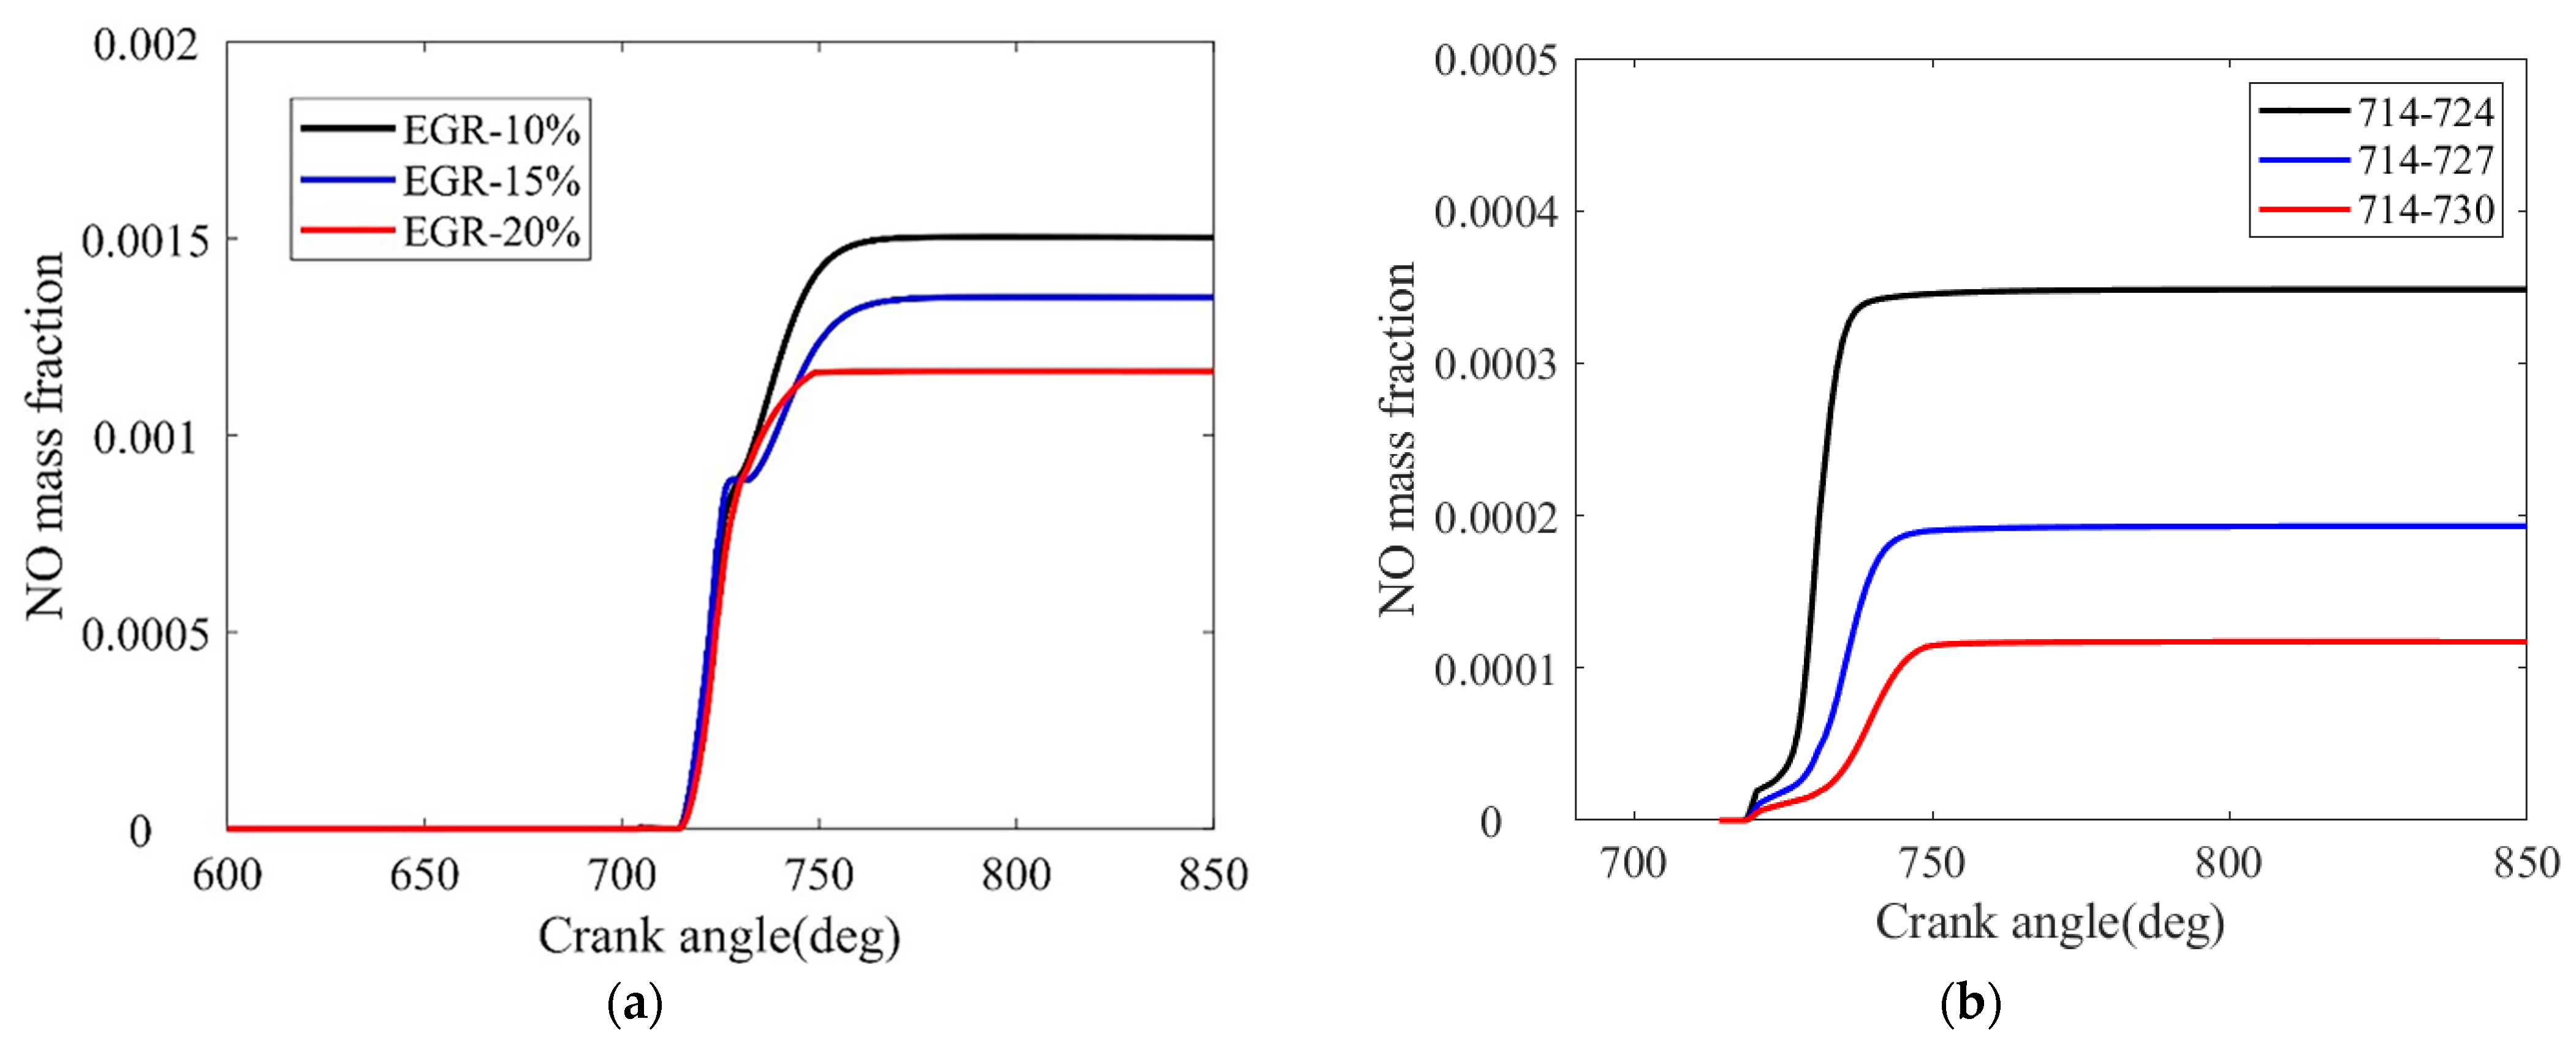
3.2.4. Nitrogen Oxides Emission

Figure 14a shows the NO emission in different EGR rates, and it can be seen that the increasing EGR rate can significantly reduce NO emissions. This is why we are considering the introduction of an EGR after-treatment unit when using biodiesel fuel based on this model engine. The result shows that a 15% EGR rate and a 20% EGR rate can reduce NO by 10% and 22.5%, respectively, when compared to the 10% EGR rate. According to the NOx generation mechanism, the reaction between N2 and O2 or free radical OH in the cylinder occur at a high temperature and oxygen-rich environment. When the cylinder temperature increases, the NO generation rate increases rapidly. According to the study results of Section 3.2.2, EGR will make the cylinder temperature decrease, which could decrease the NO generation. However, the EGR device causes the exhaust gas can get into the cylinder again to burn. When EGR rate increases, the proportion of the exhaust gas in the cylinder increases, leading to the reduction of the excess air coefficient, which reduces the proportion of N2 and O2, and brings the substances such as CO2 and O2 and incompletely burned substances into the inlet air. At the same time, the CO2 and H2O in it increases the specific heat capacity of the cylinder, which leads to the cylinder temperature decreasing and provides favorable conditions for suppressing NO generation; with the increase of CO2, the conversion process of substances to NOx is reduced. In addition, low oxygen levels prevent the formation of NO. Therefore, the EGR rates play an important role in reducing NO production.
Figure 14b represents the NO emission variation curves of the combustion process for different injection durations, which shows that NOx emission decreases significantly with longer injection durations. According to the study of Fernando et al., NOx formation depends on high temperature, sufficient oxygen content, and residence time in the cylinder [16]. Therefore, a shorter injection time promotes sufficient premixed combustion, high pressure, and temperature increase in the cylinder, which promotes NO formation.

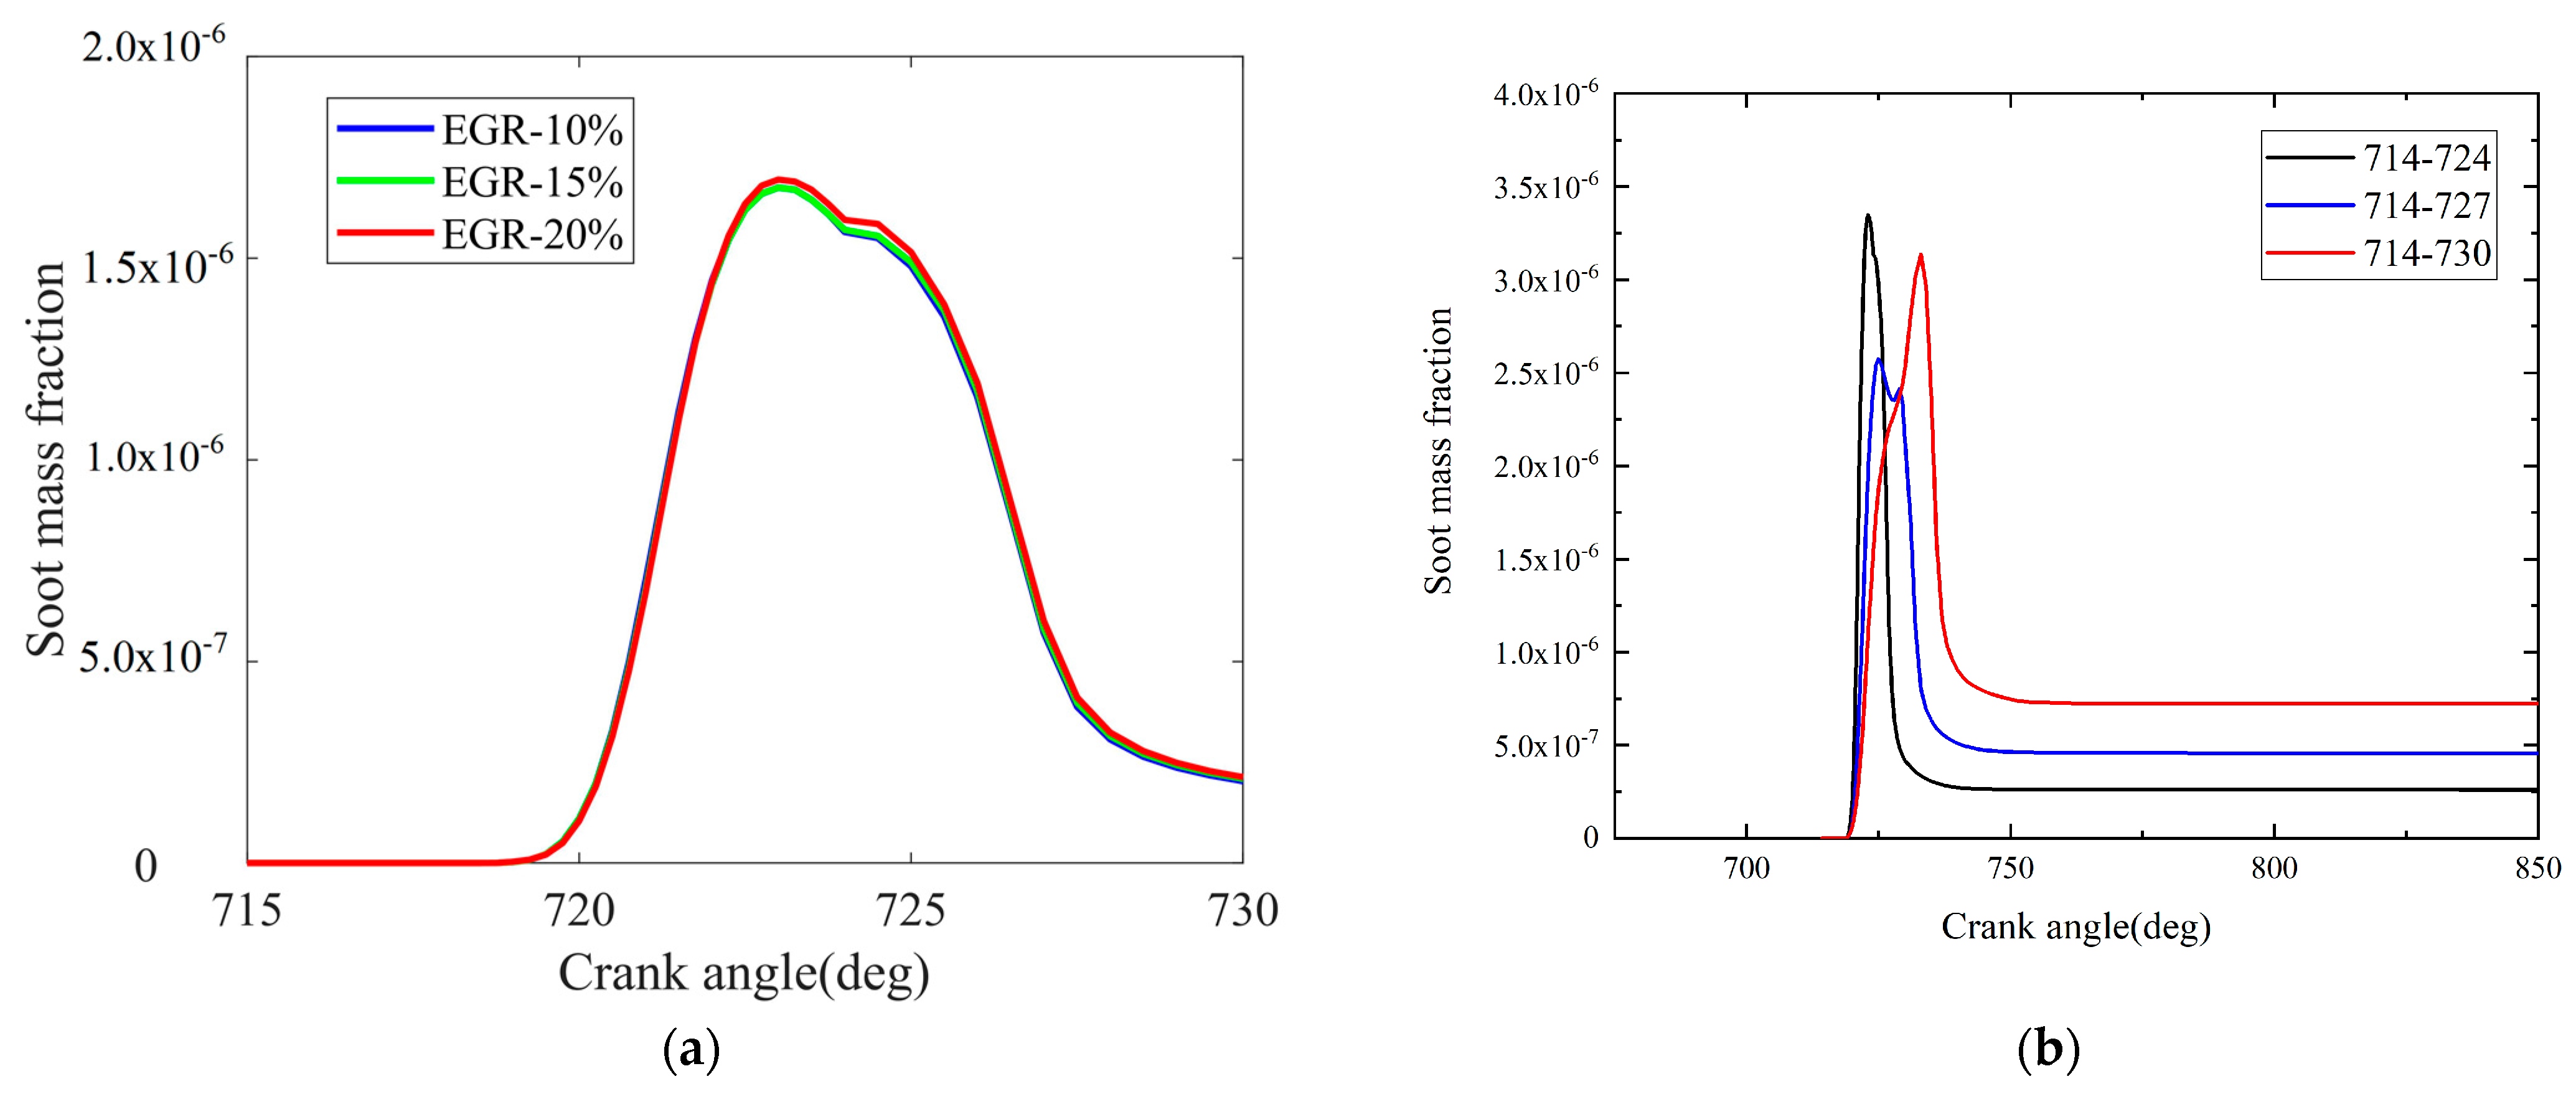
3.2.5. Soot Emission

Figure 15a shows the comparison of the soot emission curves for different EGR rates; for the three different EGR rates, the trend of the average mass fraction of carbon soot generation is the same, and the soot generation increases slightly with the increase of EGR. Although EGR contributes to a low oxygen environment and promotes the formation of carbon soot, the high oxygen content of B5, B10, and B15 itself provides a better combustible mixture, which helps to promote complete combustion and prevent soot formation. As a result of the combined action of the above two factors, when the EGR rate increases, the increase of soot emission is not obvious.
Figure 15b shows the soot mass fraction. As the time of injection end was extended, the dropped peak pressure in the cylinder and the delayed start of combustion cause that soot formation is significantly delayed. Since the fuel was injected into the cylinder for combustion at the dropped cylinder temperature and pressure, therefore it has an impact on both soot generation and burnout.

4. Conclusions

This study investigated the effect of waste cooking oil biodiesel blends on the emissions of an inland waterway four-stroke marine propulsion diesel engine in a simulation. Emphasis was placed on in-cylinder combustion processes and emissions of NOx and soot by small blend ratios. The similarity between the simulated cylinder pressure and the tested cylinder pressure from a real engine bench under 100% load with a peak error of no more than 5% verifies that the combustion model has excellent reliability. The main findings are summarized below.
(1) Small blend ratios of biodiesel, B5, B10, B15, can achieve similar cylinder pressure and performance levels as pure diesel D100. B10 achieves good economic performance with a relatively low biodiesel-diesel blend ratio while achieving relatively clean ship emissions with good engine emission reduction.
(2) As the biodiesel-diesel blend ratio increases, the increased oxygen content reduces the fuel concentration in the spray and improves the quality of combustible mixture formation, resulting in a more uniform temperature distribution field in the spray. This effect, corresponding to increased air entrainment within the lift-off length of the spray, resulted in an increase in the combustion rate during the rapid combustion phase, promoting complete combustion and reducing soot emissions.
(3) As the biodiesel-diesel blend ratio increases, the high-viscosity fuel properties of B5, B10, and B15 biodiesel affect spray characteristics, resulting in a localized increase in cylinder temperature and an increase in NOx emissions. EGR is effective in reducing NOx emissions due to the significant reduction in average cylinder temperature caused by exhaust gas entry, but the power level of the engine must be carefully considered in order to increase the EGR rate. Increasing the injection duration by lengthening the end of the injection is also effective in reducing NOx emissions, but this must be balanced against a reduction in the heat release rate due to the inadequate mixing of fuel and air.

Author Contributions

Conceptualization, G.W.; methodology, G.W.; software, X.W. and H.G.; formal analysis, J.L.; investigation, J.L.; data curation, J.L.; writing—original draft preparation, J.L. and G.W.; writing—review and editing, G.W.; supervision, G.W.; project administration, G.W.; funding acquisition, G.J. All authors have read and agreed to the published version of the manuscript.

Funding

This research was funded by [Science & Technology Commission of Shanghai Municipality and Shanghai Engineering Research Center of Ship Intelligent Maintenance and Energy Efficiency] grant number [20DZ2252300].

Institutional Review Board Statement

Not applicable.

Data Availability Statement

Data will be made available on request.

Acknowledgments

This work was supported by the Science & Technology Commission of Shanghai Municipality and Shanghai Engineering Research Center of Ship Intelligent Maintenance and Energy Efficiency under Grant 20DZ2252300.

Conflicts of Interest

The authors declare that they have no known competing financial interests or personal relationships that could have appeared to influence the work reported in this paper.

References

  1. Wallington, T.J.; Lambert, C.K.; Ruona, W.C. Diesel vehicles and sustainable mobility in the U.S. Energy Policy 2013, 54, 47–53. [Google Scholar] [CrossRef]
  2. Zhang, Z.; Jiaqiang, E.; Deng, Y.; Pham, M.; Zuo, W.; Peng, Q.; Yin, Z. Effects of fatty acid methyl esters proportion on combustion and emission characteristics of a biodiesel fueled marine diesel engine. Energy Convers. Manag. 2018, 159, 244–253. [Google Scholar] [CrossRef]
  3. Nghia, N.T.; Khoa, N.X.; Cho, W.; Lim, O. A Study the Effect of Biodiesel Blends and the Injection Timing on Performance and Emissions of Common Rail Diesel Engines. Energies 2021, 15, 242. [Google Scholar] [CrossRef]
  4. Visan, N.A.; Carlanescu, R.; Niculescu, D.C.; Chiriac, R. Study on the Cumulative Effects of Using a High-Efficiency Turbocharger and Biodiesel B20 Fuelling on Performance and Emissions of a Large Marine Diesel Engine. J. Mar. Sci. Eng. 2022, 10, 1403. [Google Scholar] [CrossRef]
  5. Yatish, K.V.; Lalithamba, H.S.; Suresh, R.; Hebbar, H.H. Optimization of bauhinia variegata biodiesel production and its performance, combustion and emission study on diesel engine. Renew. Energy 2018, 122, 561–575. [Google Scholar] [CrossRef]
  6. Zhao, X.; Jiaqiang, E.; Liao, G.; Zhang, F.; Chen, J.; Deng, Y. Numerical simulation study on soot continuous regeneration combustion model of diesel particulate filter under exhaust gas heavy load. Fuel 2021, 290, 119795. [Google Scholar] [CrossRef]
  7. Jensen, M.V.; Cordtz, R.F.; Schramm, J. Numerical analysis of methane slip source distribution in a four-stroke dual-fuel marine engine. J. Mar. Sci. Technol. 2020, 26, 606–617. [Google Scholar] [CrossRef]
  8. Su, P.H.; Geng, P.; Wei, L.; Hou, C.Y.; Li, Y.F.; Feng, D.L. PM and PAHs emissions of ship auxiliary engine fuelled with waste cooking oil biodiesel and marine gas oil. IET Intell. Transp. Syst. 2018, 13, 218–227. [Google Scholar] [CrossRef]
  9. Namitha, B.; Sathish, A.; Kumar, P.S.; Nithya, K.; Sundar, S. Micro algal biodiesel synthesized from Monoraphidium sp., and Chlorella sorokiniana: Feasibility and emission parameter studies. Fuel 2021, 301, 121063. [Google Scholar] [CrossRef]
  10. Mourad, M.; Mahmoud, K.R.M.; NourEldeen, E.S.H. Improving diesel engine performance and emissions characteristics fuelled with biodiesel. Fuel 2021, 302, 121097. [Google Scholar] [CrossRef]
  11. Mohamed, M.; Tan, C.K.; Fouda, A.; Gad, M.S.; Abu-Elyazeed, O.; Hashem, A.F. Diesel Engine Performance, Emissions and Combustion Characteristics of Biodiesel and Its Blends Derived from Catalytic Pyrolysis of Waste Cooking Oil. Energies 2020, 13, 5708. [Google Scholar] [CrossRef]
  12. Zöldy, M.; Kondor, I.P. Simulation and Injector Bench Test Validation of Different Nozzle Hole Effect on Pyrolysis Oil-Diesel Oil Mixtures. Energies 2021, 14, 2396. [Google Scholar] [CrossRef]
  13. Zareei, J.A.V.A.D.; Haseeb, M.; Ghadamkheir, K.; Farkhondeh, S.A.; Yazdani, A.; Ershov, K. The effect of hydrogen addition to compressed natural gas on performance and emissions of a DI diesel engine by a numerical study. Int. J. Hydrog. Energy 2020, 45, 34241–34253. [Google Scholar] [CrossRef]
  14. Turkcan, A.; Altinkurt, M.D.; Coskun, G.; Canakci, M. Numerical and experimental investigations of the effects of the second injection timing and alcohol-gasoline fuel blends on combustion and emissions of an HCCI-DI engine. Fuel 2018, 219, 50–61. [Google Scholar] [CrossRef]
  15. Temizer, İ.; Cihan, Ö. Analysis of different combustion chamber geometries using hydrogen/diesel fuel in a diesel engine. Energy Sources Part A Recovery Util. Environ. Eff. 2020, 43, 17–34. [Google Scholar] [CrossRef]
  16. Salehian, A.; Shirneshan, A. The Effect of Cordierite-Platinum SCR Catalyst on the NOx Removal Efficiency in an Engine Fueled with Diesel-Ethanol-Biodiesel Blends. Catal. Lett. 2020, 150, 2236–2253. [Google Scholar] [CrossRef]
  17. Zhang, Y.; Zhong, Y.; Wang, J.; Tan, D.; Zhang, Z.; Yang, D. Effects of Different Biodiesel-Diesel Blend Fuel on Combustion and Emission Characteristics of a Diesel Engine. Processes 2021, 9, 1984. [Google Scholar] [CrossRef]
  18. Huang, Z.; Huang, J.; Luo, J.; Hu, D.; Yin, Z. Performance enhancement and emission reduction of a diesel engine fueled with different biodiesel-diesel blending fuel based on the multi-parameter optimization theory. Fuel 2022, 314, 122753. [Google Scholar] [CrossRef]
  19. Imperato, M.; Kaario, O.; Larmi, M.; Sarjovaara, T. Emission reduction methods and split fuel injection in a marine four-stroke engine. J. Mar. Sci. Technol. 2017, 23, 94–103. [Google Scholar] [CrossRef]
  20. Asadi, A.; Kadijani, O.N.; Doranehgard, M.H.; Bozorg, M.V.; Xiong, Q.; Shadloo, M.S.; Li, L.K. Numerical study on the application of biodiesel and bioethanol in a multiple injection diesel engine. Renew. Energy 2020, 150, 1019–1029. [Google Scholar] [CrossRef]
  21. Karami, R.; Rasul, M.G.; Khan MM, K.; Salahi, M.M.; Anwar, M. Experimental and computational analysis of combustion characteristics of a diesel engine fueled with diesel-tomato seed oil biodiesel blends. Fuel 2021, 285, 119243. [Google Scholar] [CrossRef]
  22. Asadi, A.; Zhang, Y.; Mohammadi, H.; Khorand, H.; Rui, Z.; Doranehgard, M.H.; Bozorg, M.V. Combustion and emission characteristics of biomass derived biofuel, premixed in a diesel engine: A CFD study. Renew. Energy 2019, 138, 79–89. [Google Scholar] [CrossRef]
  23. Pham, V.C.; Rho, B.S.; Kim, J.S.; Lee, W.J.; Choi, J.H. Effects of Various Fuels on Combustion and Emission Characteristics of a Four-Stroke Dual-Fuel Marine Engine. J. Mar. Sci. Eng. 2021, 9, 1072. [Google Scholar] [CrossRef]
  24. Wu, G.; Jiang, G.; Yang, Z.; Huang, Z. Emission Characteristics for Waste Cooking Oil Biodiesel Blend in a Marine Diesel Propulsion Engine. Pol. J. Environ. Stud. 2019, 28, 2911–2921. [Google Scholar] [CrossRef]
  25. Fernando, S.; Hall, C.; Jha, S. NOx Reduction from Biodiesel Fuels. Energy Fuels 2006, 20, 376–382. [Google Scholar] [CrossRef]
  26. Temizer, I.; Cihan, O. Experimental and Numerical Evaluation of Combustion Analysis of a DI Diesel Engine. Energy Rep. 2021, 7, 5549–5561. [Google Scholar] [CrossRef]
  27. Wu, G.; Zhou, X.; Li, T. Temporal Evolution of Split-Injected Fuel Spray at Elevated Chamber Pressures. Energies 2019, 12, 4284. [Google Scholar] [CrossRef] [Green Version]
  28. Vu, D.N.; Ocktaeck, L.I.M. Ignition and combustion characteristics of gasoline-biodiesel blend in a constant volume chamber: Effects of the operation parameters. Fuel 2019, 255, 115764. [Google Scholar] [CrossRef]
  29. Gao, J.; Jiang, D.; Huang, Z. Spray properties of alternative fuels: A comparative analysis of ethanol–gasoline blends and gasoline. Fuel 2007, 86, 1645–1650. [Google Scholar] [CrossRef]
  30. Agarwal, A.K.; Chaudhury, V.H. Spray characteristics of biodiesel/blends in a high pressure constant volume spray chamber. Exp. Therm. Fluid Sci. 2012, 42, 212–218. [Google Scholar] [CrossRef]
  31. Singh, N.; Agarwal, A.; Agarwal, M. Performance evaluation of lead–free double-perovskite solar cell. Opt. Mater. 2021, 114, 110964. [Google Scholar] [CrossRef]
Figure 1. Schematics diagram of engine bench test and emission test experimental setup.
Jmse 11 00086 g001
Figure 2. 3D mesh model of engine combustion chamber.
Jmse 11 00086 g002
Figure 3. Engine validation results for cylinder pressure.
Jmse 11 00086 g003
Figure 4. (a) Cylinder pressure from different ratios of biodiesel. (b) Average cylinder temperature from different ratios of biodiesel.
Jmse 11 00086 g004
Figure 5. Cylinder temperature distribution field at different crank angles.
Jmse 11 00086 g005
Figure 6. The transient HRR of the four fuels.
Jmse 11 00086 g006
Figure 7. (a) NO emission from different ratios of biodiesel; (b) Soot emission from different ratios of biodiesel.
Jmse 11 00086 g007
Figure 8. Cylinder pressure for different EGR rates and injection durations: (a) different EGR rates; (b) different injection durations.
Jmse 11 00086 g008
Figure 9. Average cylinder temperature for different EGR rates and injection durations: (a) different EGR rates; (b) different injection durations.
Jmse 11 00086 g009
Figure 10. Cylinder temperature field distribution at various crank angles and EGR rates.
Jmse 11 00086 g010
Figure 11. Cylinder temperature field distribution at various crank angles and injection durations.
Jmse 11 00086 g011
Figure 12. HRR for different EGR rates and injection durations: (a) different EGR rates; (b) different injection durations.
Jmse 11 00086 g012
Figure 13. Accumulated heat release for different EGR rates and injection durations: (a) different EGR rates; (b) different injection durations.
Jmse 11 00086 g013
Figure 14. NO emission at different EGR rates and injection durations: (a) different EGR rates; (b) different injection durations.
Jmse 11 00086 g014
Figure 15. Soot emission for different EGR rates and injection durations: (a) different EGR rates; (b) different injection durations.
Jmse 11 00086 g015
Table 1. The detailed specifications of the engine.
ProjectParameter
Model6135G128ZCa
Weight (kg)1160
Length × width × height (mm × mm × mm)1433 × 797 × 1236
Piston stroke (mm)150
Cylinder diameter (mm)135
Compression ratio17
Total piston displacement (L)12.88
12 h power (kW)178.2
Calibration speed (r/min)1500
Overload speed (r/min)1545
The fuel consumption rate of 12 h power (g/kW·h)≤228.4
The oil consumption rate of 12 h power (g/kW·h)≤1.47
Table 2. Boundary and initial conditions according to the engine.
ParameterValue
Initial cylinder pressure (bar)1.46
Initial cylinder temperature (K)350
Initial turbulent kinetic energy (m2/s2)21.09
Initial turbulence size (m)0.0125
Cylinder head temperature (K)550
Piston top (K)575
Cylinder wall temperature (K)353
Table 3. Properties of different injection fuels.
ProjectD100B5B10B15
Standard technical nameGB 17930-2016GB T25199-2014T/SFSF000010-2020Unpublished
Density (kg/m3)825.2827.2829.6831.8
Kinematic viscosity (mm2/s)2.6042.6792.7502.775
Gross calorific value (MJ/kg)46.11045.92045.49545.360
Net calorific value (MJ/kg)43.01542.88042.54542.445
Flash point/°C68.569.069.570.5
Acidity (mg/100 mL)4.715.305.998.54
Freezing point/°C−17−17−15−14
Cetane number52.553.253.053.4
Low calorific value (MJ/kg)43.1242.8142.4942.18
Oxygen content/(%)0.760.710.620.60
Carbon content/(%)85.4685.7386.2386.40
Hydrogen content/(%)13.6913.4613.0612.90
Nitrogen content/(%)0.030.040.030.04
Table 4. Mathematical model.
TypeName
Turbulence modelK-ξ-f model
Spray crushing modelWAVE model
Bumper modelWalljet1 Bumper model
Evaporation modelMulti-component model
Turbulent diffusion modelEnable model
Combustion modelECFM-3Z model
NOx modelExtended zeldovich model
Soot modelKinetic model
Disclaimer/Publisher’s Note: The statements, opinions and data contained in all publications are solely those of the individual author(s) and contributor(s) and not of MDPI and/or the editor(s). MDPI and/or the editor(s) disclaim responsibility for any injury to people or property resulting from any ideas, methods, instructions or products referred to in the content.

