Article

Species Diversity and Community Structure of Macrobenthos in the Ulleung Basin, East Sea, Republic of Korea

Marine Ecosystem and Biological Research Centre, KIOST, 385, Haeyang-ro, Yeongdo-gu, Busan 49111, Republic of Korea
*
Author to whom correspondence should be addressed.
J. Mar. Sci. Eng. 2023, 11(1), 92; https://doi.org/10.3390/jmse11010092
Submission received: 23 November 2022 / Revised: 27 December 2022 / Accepted: 29 December 2022 / Published: 3 January 2023

Abstract

:
The Ulleung Basin of the East Sea is a biological hotspot, but studies on the macrobenthos therein are lacking. To evaluate the macrobenthos species diversity and community structure in the Ulleung Basin, we conducted a survey from 2017 to 2021. A total of 262 species of macrobenthos was detected by the survey, and the average habitat density was 243 individuals/m2. The average biomass of macrobenthos was 43.7 g/m2, and the average Shannon and Wiener’s diversity index was 2.3 (0.69–3.61). The dominant species were the polychaetes Terebellides horikoshii, Chaetozone setosa, Scalibregma inflatum, and Aglaophamus sp. and the bivalvia Axinopsida subquadrata. The community structure of macrobenthos differed according to water depth, and a correlation analysis using environmental variables showed that the community was affected by water temperature, salinity, and dissolved oxygen. The macrobenthic fauna in the Ulleung Basin was greatly influenced by water depth, the sedimentary environment was different, and the dominant species were also different. In addition, there was little seasonal change compared to the East Sea coast. Our findings will facilitate further investigation of benthic ecosystems throughout the East Sea.

1. Introduction

The East Sea is a semi-closed marginal sea composed of three deep basins (Ulleung, Japan, and Yamato) connected to the North Pacific by three straits (the Korea, Tsugaru, and Soya Straits) [1,2,3]; it produces important aquatic resources (i.e., Pacific cod, Gadus macrocephalus) in Korea and Japan [4]. The East Sea is a physically diverse and dynamic region encompassing a large-scale ocean current system [5,6], thermohaline circulation [7], coastal upwelling [8], mesoscale eddies [9], deep-water formations [10,11], and a subpolar front [12].
The Ulleung Basin, which is located in the southwestern East Sea, is a biological hotspot with high average annual primary productivity [13]. In the summer, Changjiang Diluted Water from Northeast China is transported northeastward from the East China Sea to the Ulleung Basin via the Korea Strait with Tsushima warm water, which flows through the southern Tsushima Strait (depth, 130 m) [5]. In the winter, the Ulleung warm current moves northward from the center of the Ulleung Basin along the Coast of Korea [14]. Nutrient-rich coastal waters increase microbial production in the basin [8], and anaerobic respiration and sulfate and manganese reduction rates are high in Ulleung Basin sediments [15].
The two islands in the Ulleung Basin (Ulleungdo and Dokdo), which are important centers of fishery and marine resources, have rocky gravel coasts [16]. A total of 578 marine invertebrate species inhabits the bedrock of Dokdo, and biodiversity is markedly higher in the East Sea [17]. Most studies on macrobenthos within a 10 km radius of Dokdo have been conducted on Dokdo rock substrates; few studies have focused on soft substrates in coastal waters [18]. Ulleungdo has a very similar ecosystem and habitat type to Dokdo, and warm currents usually flow between the islands [12]. The carrying capacity of Ulleungdo is larger than that of Dokdo [19]. For accurate characterization of the marine ecosystem of the East Sea, it is necessary to understand the biological and physical characteristics of these islands [20].
Macrobenthos are ecologically important food organisms [19] that participate in nutrient recycling through the resuspension of low-level, nutrient-rich sediments into water masses [21]. Macrobenthos are a major biological component of benthic ecosystems often used to assess pollution impacts on various aspects of their life cycles, such as sedentary lifestyle and lifespan [22,23]. Benthic communities can sense local stress levels and integrate recent stress histories to form a set of systems [24,25]. Macrobenthic community responses to various environmental stresses can be understood through analysis of differences in species diversity and relative abundance between control and disturbed areas [26,27]. Physical disturbances can directly alter processes such as nutrient cycling and benthic primary production [28]. Therefore, investigating macrobenthic community structure can provide insight into their biodiversity and biodistribution in response to environmental changes [29,30,31].
Most studies on macrobenthos of the Ulleung Basin have been conducted in soft and rocky subtidal zones around Ulleungdo and Dokdo [17,32]. However, information on the species diversity and community structure of sites between these two islands is sparse. In addition, the species composition of the survey area has been affected by the recent increase in water temperature and subtropical currents. We evaluated macrobenthic species diversity and community structure and examined the effects of sediment composition and water depth on macrobenthos of the Ulleung Basin.

2. Materials and Methods
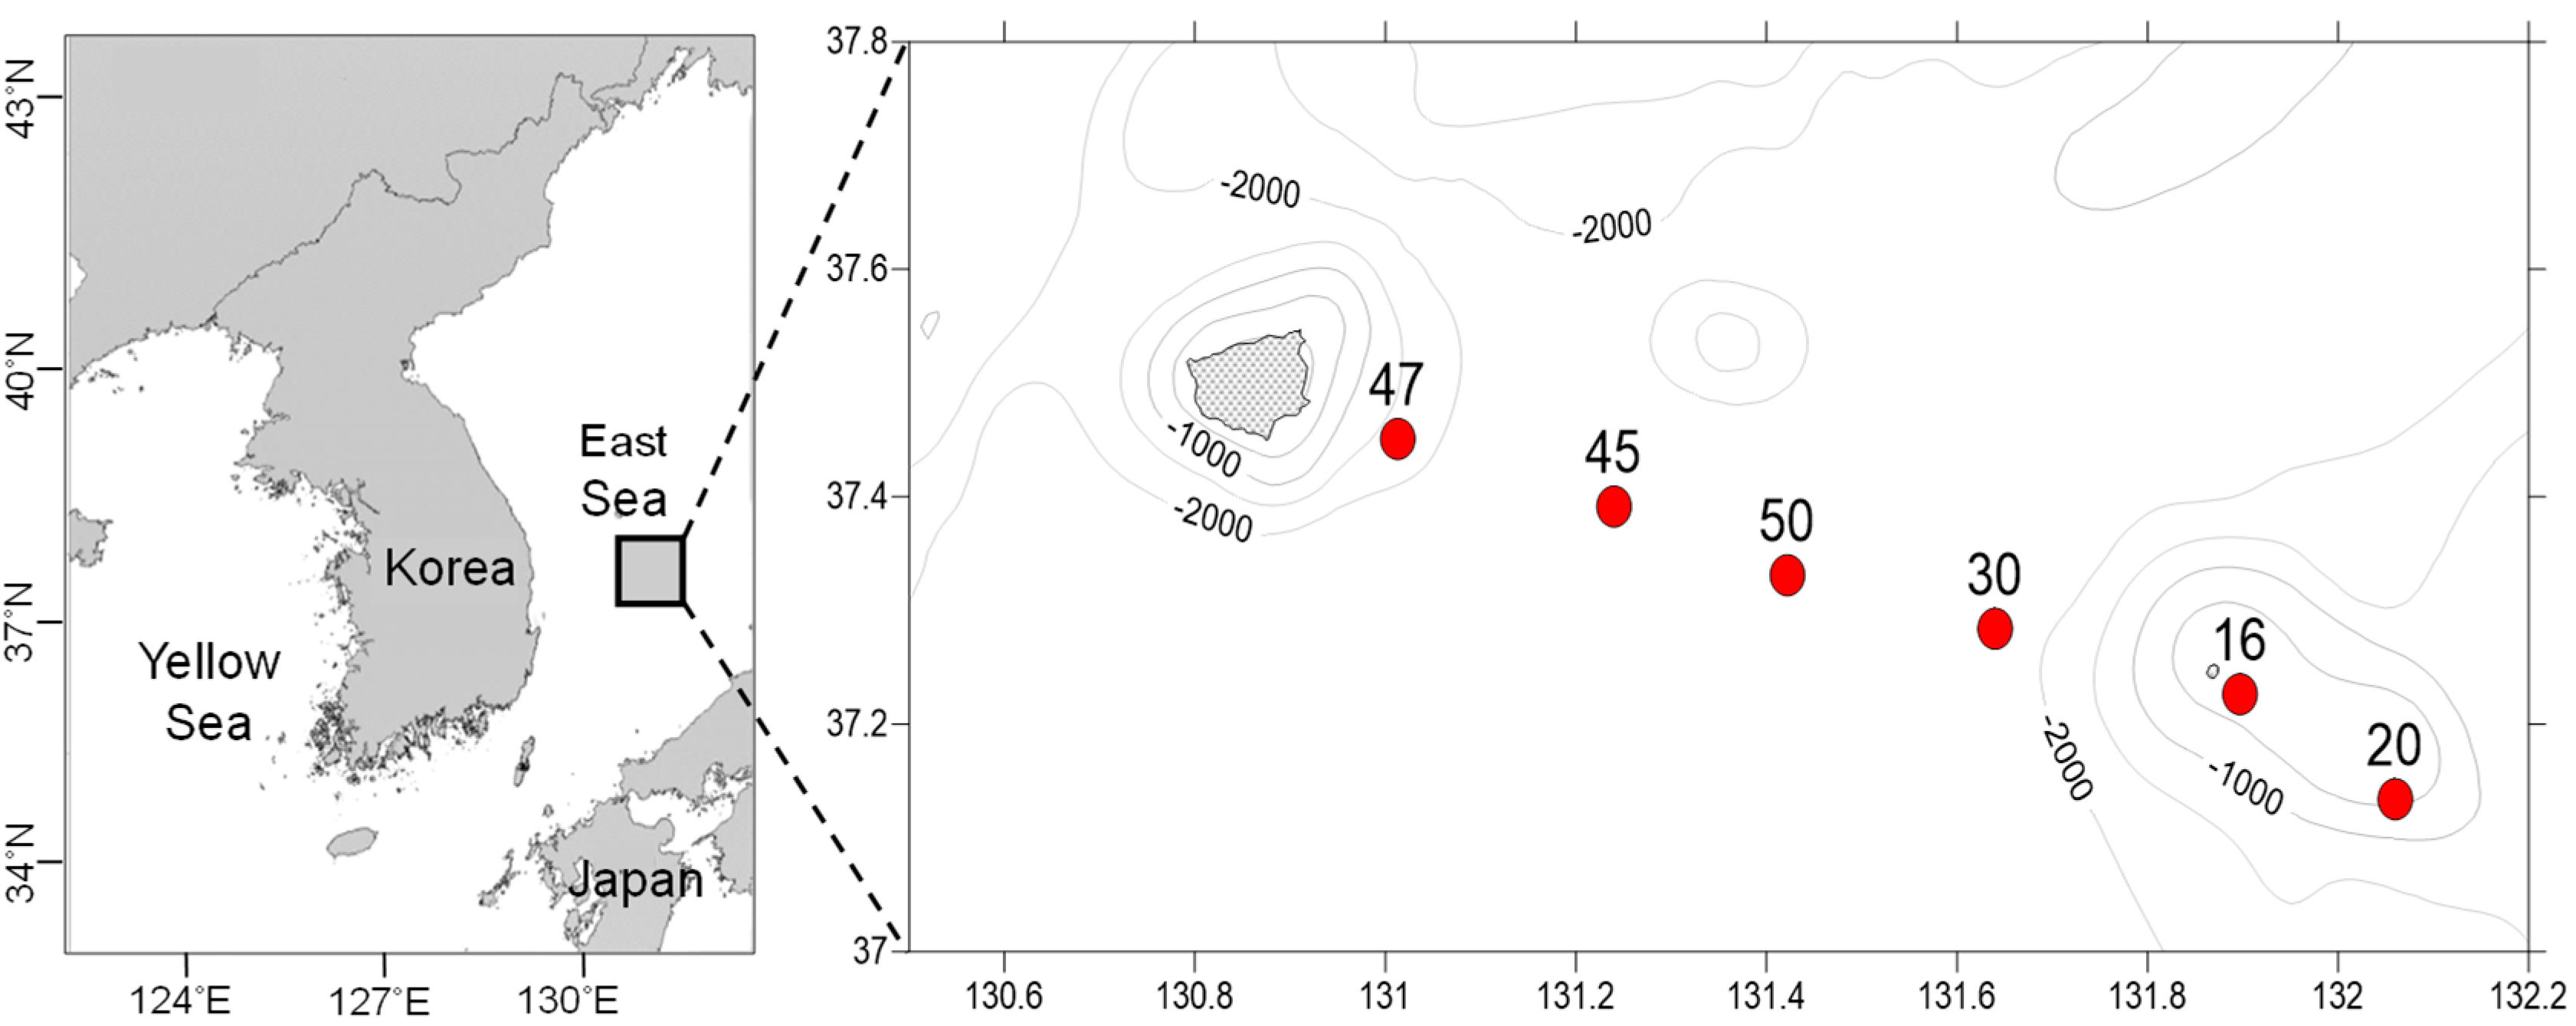
2.1. Study Area

This study was conducted in the Ulleung Basin in the East Sea off the coast of Korea (37.4450°–37.4561° N, 130.8616°–130.8737° E; Figure 1). The survey was conducted at six sites from 2017 to 2021 (May and August 2017, February and August 2018, June and October 2019, March and June 2020, and April and August 2021) (Figure 1, Table 1). The shallow-water sites (sts. 16 and 20; average depth, 182 m) are close to Dokdo, and the deep-water sites (sts. 30, 45, 47, and 50; average depth, 2189 m) are located between Ulleungdo and Dokdo (19 samples from 2 shallow-water sites and 41 samples from the deep sea). Compared to the East Sea coast, the surveyed area was relatively unaffected by anthropogenic factors.

2.2. Sample Processing

Macrobenthos (body length > 1 mm) were collected using a box corer (BC; 0.25 m2) and a Smith–McIntyre grab (0.1 m2). For areas of depth < 1000 m, the Smith–McIntyre grab was used (sts. 16 and 20; 2–3 replicates), and for areas > 1000 m depth, the BC was used (sts. 30, 45, 47, and 50; 1 replicate). The collected samples were sieved through a 1-mm sieve on board the research vessel and then fixed with 10% formalin. In the laboratory, the number and wet weight (g) of individuals were measured, and organisms were identified to the species level. Benthic organisms were fixed in 70% ethanol. Macrobenthos number and wet weight (g) were calculated per m2, and the species number, density (individuals/m2), and biomass (g/m2) were analyzed.
The water depth (m), temperature (°C), salinity (psu), and dissolved oxygen (DO: mg/L) of the bottom layer were measured using CTD (SBE−19). To analyze the particle size and total organic carbon content (TOC) of sediment, surface-sediment samples were collected in 50 mL conical tubes and stored frozen. For particle size analysis, organic matter was removed with 10% H2 O2 and carbonate was removed with 0.1 N-HCl, and the sediment sample was transferred to 4 ø sieves [29]. Below 4 ø, the percentage was calculated for each particle size grade after sieving for 15 min using a Ro-tap sieve shaker. Above 4 ø, 0.1% Calgon solution was added, the mixture was stirred, and the particle-size weight percentage was determined using an X-ray automatic particle size analyzer (SediGraph 5000 D). Variables were obtained by the inclusive graphic method of Folk and Ward (1957) [32].
The TOC of sediment (1 g) was evaluated after drying at 50 °C for 48 h. Next, carbonate was removed with 0.1 N hydrochloric acid, and TOC was assessed using a CHN analyzer.

2.3. Comparison with Previous Studies

The number, density, and dominant species obtained in this study were compared to those of 2012 studies conducted in the southern East Sea and off Ulleungdo and Dokdo [33,34], a 2013 study conducted in the northern East Sea, and a 2016 study of the Dokdo region [18,35]. All of these studies used the Smith–McIntyre grab in shallow water and BC gears in deep water. Densities were converted to m2 for comparison. Macrobenthic species were identified by the same experts to minimize error.

2.4. Data Processing

The Chao1 index was employed to estimate species richness using EstimateS v9 software [36,37]. Shannon and Wiener’s (1963) diversity index (H’), the species richness index (d), and Simpson’s evenness index (J’) were calculated for each station using species abundance [38]. The species abundances were summed and converted to density values (m2). For multivariate analysis, the species density per site was transformed to the fourth root in order to scale down the sores of the highly abundant species [39], and a cluster analysis was performed using the Bray–Curtis similarity through group average linking [40]. We used Bray–Curtis similarity because it has many properties suitable for ecological data, including independence from measurement scale and from cavity absences. Analysis of similarity (ANOSIM) was performed to determine differences among assemblages. Similarity percentage (SIMPER) analysis was performed to identify species that contributed to the similarity and dissimilarity of the clusters. A Principal Coordinate Analysis (PCO) was applied to the Euclidean distance matrix to visualize the differences. A biota–environment matching (BIO–ENV) analysis was conducted to determine the environmental factors that affect the spatial distribution of benthic animals. Univariate and multivariate analyses were performed using Primer 6 + PERMANOVA statistical software (Plymouth Marine Laboratory, Plymouth, UK) [41].

3. Results

3.1. Environmental Variability
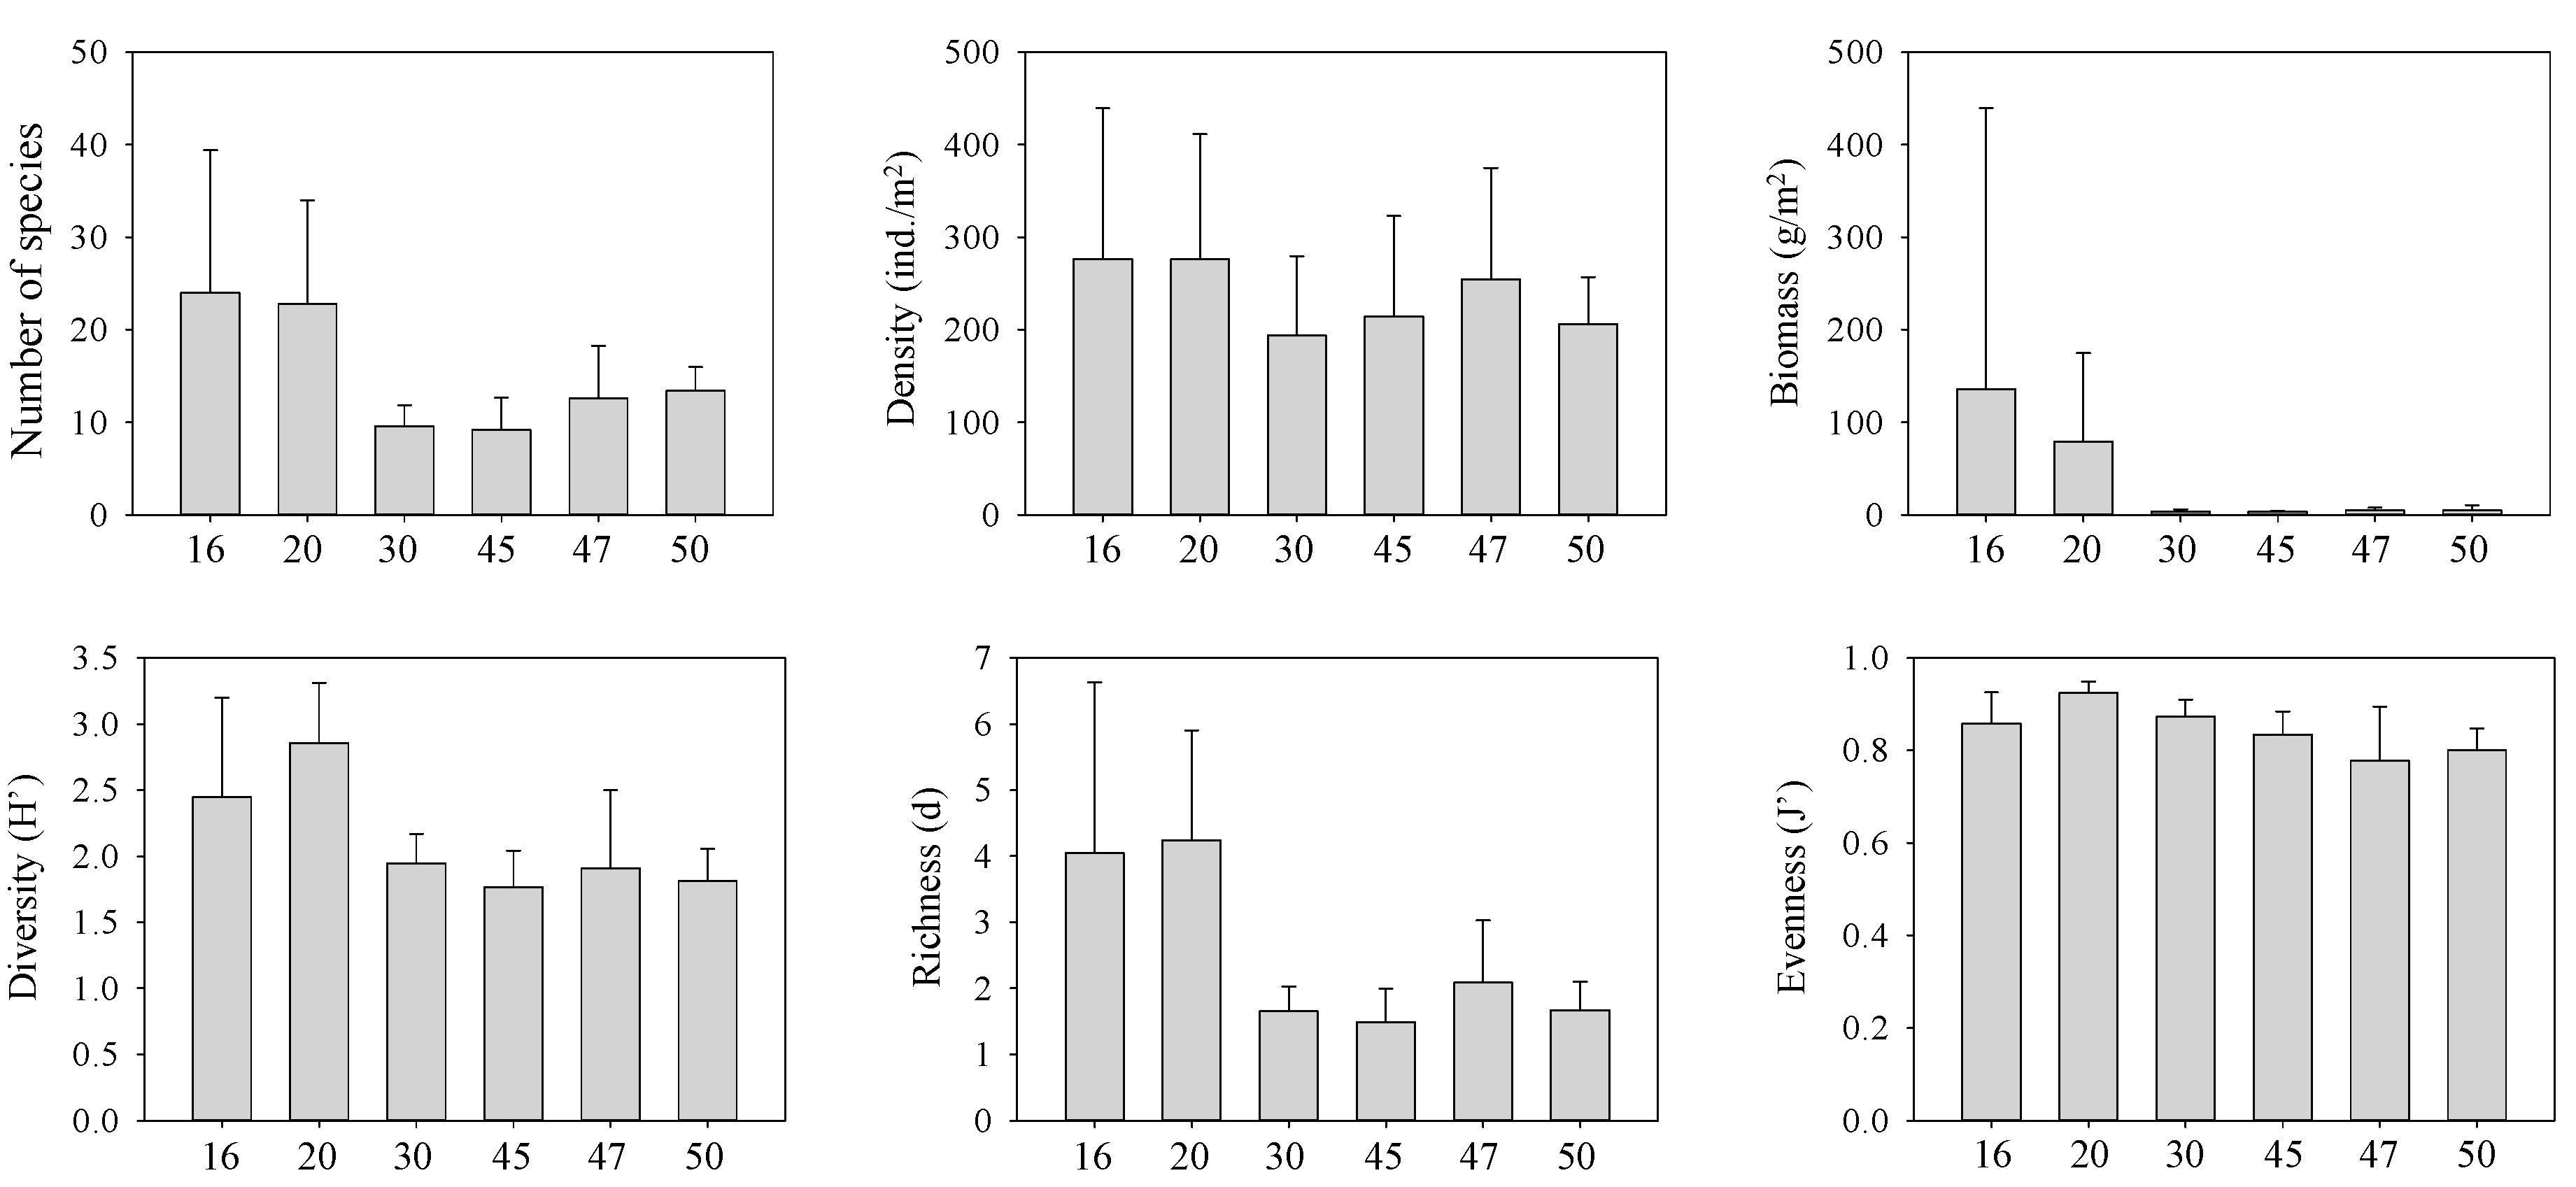
The average depth of sts. 16 and 20 (close to Dokdo) was 182 m (Figure 1). The depths of sts. 30, 45, 47, and 50 were > 1000 m (range: 1799–2344 m). The average bottom-water temperature for all survey sites was 1.3 °C, the maximum was 5.4 °C at st. 16 (range: 2.7–10.7 °C), and the minimum was 1.8 °C at st. 20 (range: 1.2–2.5 °C) (Table 1). We detected no seasonal differences, and the highest bottom-water temperature was recorded in 2021, with an average of 1.6 °C. The average water temperature at deep-water sts. 30, 45, 47, and 50 was 0.2 °C. The average salinity of the bottom layer was 34.1 psu (range: 34.0–34.3 psu), and there were no differences between sites. At the deep-water sts. 30, 45, 47, and 50, the average DO content was 4.4 mg/L (range: 4.1–6.7 mg/L) (Table 1). We confirmed that salinity and dissolved oxygen were not correlated with the season.
DO was highest in the summer (average, 4.9 mg/L) and lowest in the spring (average, 4.6 mg/L); in terms of years, it was highest in 2019 and 2020, with an average of 4.9 mg/L, and lowest in 2017, with an average of 4.7 mg/L. The average particle size of sediments in shallow-water sites was 1.6 phi except for the survey in August 2017; at the deep-water sites, the average was 8.5 phi, indicating fine-grained sediments (Table 1). The grain size of sediment at the shallow- and deep-water sites indicated sandy and clay sediments, respectively. The average TOC of sediments was 0.4% in the shallow-water sites and 2.0% in the deep-water sites and was typically higher in the latter than in the former (Table 1). Sedimentary environments differed depending on the water depth.

3.2. Macrobenthos

A total of 262 macrobenthos species were detected in the survey. We found 88 polychaete species (34%), 72 arthropod crustaceans (27%), 55 mollusks (21%), and 15 echinoderms (6%). The average number of species in the sites was 15. About 25 species were detected in shallow-water sites (e.g., sts. 16 and 20), and 9–11 species at deep-water sites (e.g., sts. 30, 45, 47, and 50) (Table 2). Summer had the highest average number of (n = 16.1), and spring had the lowest (n = 12.7). Polychaetes, arthropods, mollusks, and echinoderms had the highest numbers of species in the summer, spring, autumn, and winter, respectively.
The average density of macrobenthos was 243 individuals/m2 overall and was 277 and 253 individuals/m2 at sts. 16, and 20, respectively. At sts. 30, 45, 47, and 50 (deep water), the average densities were 201, 198, 272, and 219 individuals/m2, respectively. The average density was lower at deep-water sites than at shallow-water sites. Polychaetes predominated (57%), followed by mollusks (22%), arthropod crustaceans (10%), and echinoderms (4%). The average density was highest in the autumn and lowest in the winter. The number of species was lowest in the winter and gradually increased through spring and summer.
The average biomass of macrobenthos was 37.7 g/m2 (range, 0.6–969.7 g/m2). The average biomass was 111.4 and 3.6 g/m2 at shallow- and deep-water sites, respectively, a difference (sea cucumber and spider starfish biomass were high at sts. 16 and 20). The biomass of major macrobenthos taxa was 51% echinoderms, 10% polychaetes, 5% mollusks, and 2% arthropod crustaceans (Table 2). Biomass was highest the in spring and lowest in the summer, and higher in 2019 than in other years (average, 116.5). The biomass of echinoderms and other taxa appeared to be higher in 2019. Shallow-water sites 16 and 20 generally had the highest biomass.
The average species diversity index was 2.1 (range, 0.7–3.4) (Figure 2). The species diversity index averages for shallow- and deep-water sites were 2.6 and 1.9, respectively. The species number, biomass, and diversity index of macrobenthic animals were high at shallow-water sites. The number of macrobenthos by season and period increased during 2019 and 2020 (Figure 2). Autumn had the highest species diversity and spring had the lowest.
There were 11 dominant species (with >2% higher average density). The polychaete Chaetozone setosa predominated (11.1%) (Table 3), followed by the polychaete Terebellides horikoshii (10.2%); the bivalve Axinopsida subquadrata (6.8%); the polychaetes Aglaophamus sp. (5.4), Scalibregma inflatum (5.1%), Sigambra bassi (3.6%), and Petaloproctus dentatus (3.3); and the bivalves Yoldiella philippiana (2.7%) and Phascolosoma sp. (2.6%) (Table 3). The most dominant species, the polychaete Chaetozone setosa, had higher average density in the winter and spring and lower average density in the autumn. The bivalve Axinopsida subquadrata were present in high percentages in the autumn but not in the spring.

3.3. Community Structure

The macrobenthic community differed between the shallow- and deep-water sites (ANOSIM, global R = 0.846, p = 0.001; Figure 3). The SIMPER analysis yielded a dissimilarity between the two clusters of 91.9%. The species that contributed to the division of the community were the polychaetes Terebellides horikoshii, Chaetozone setosa, Scalibregma inflatum, Sigambra bassi, Glycera nicobarica, Aglaophamus sp., Aricidea sp., Aphelochaeta sp., and Axinopsida subquadrata (Table 4). The dominant species, the polychaetes Terebellides horikoshii and Sigambra bassis were frequently detected in deep water but were absent in shallow water. Conversely, the polychaete Glycera nicobarica was detected in shallow water but not in deep water. The macrobenthic community was not affected by season, and water depth was an important factor in community distribution. In particular, clustering was more obvious as the water depth increased. There was no difference among years.

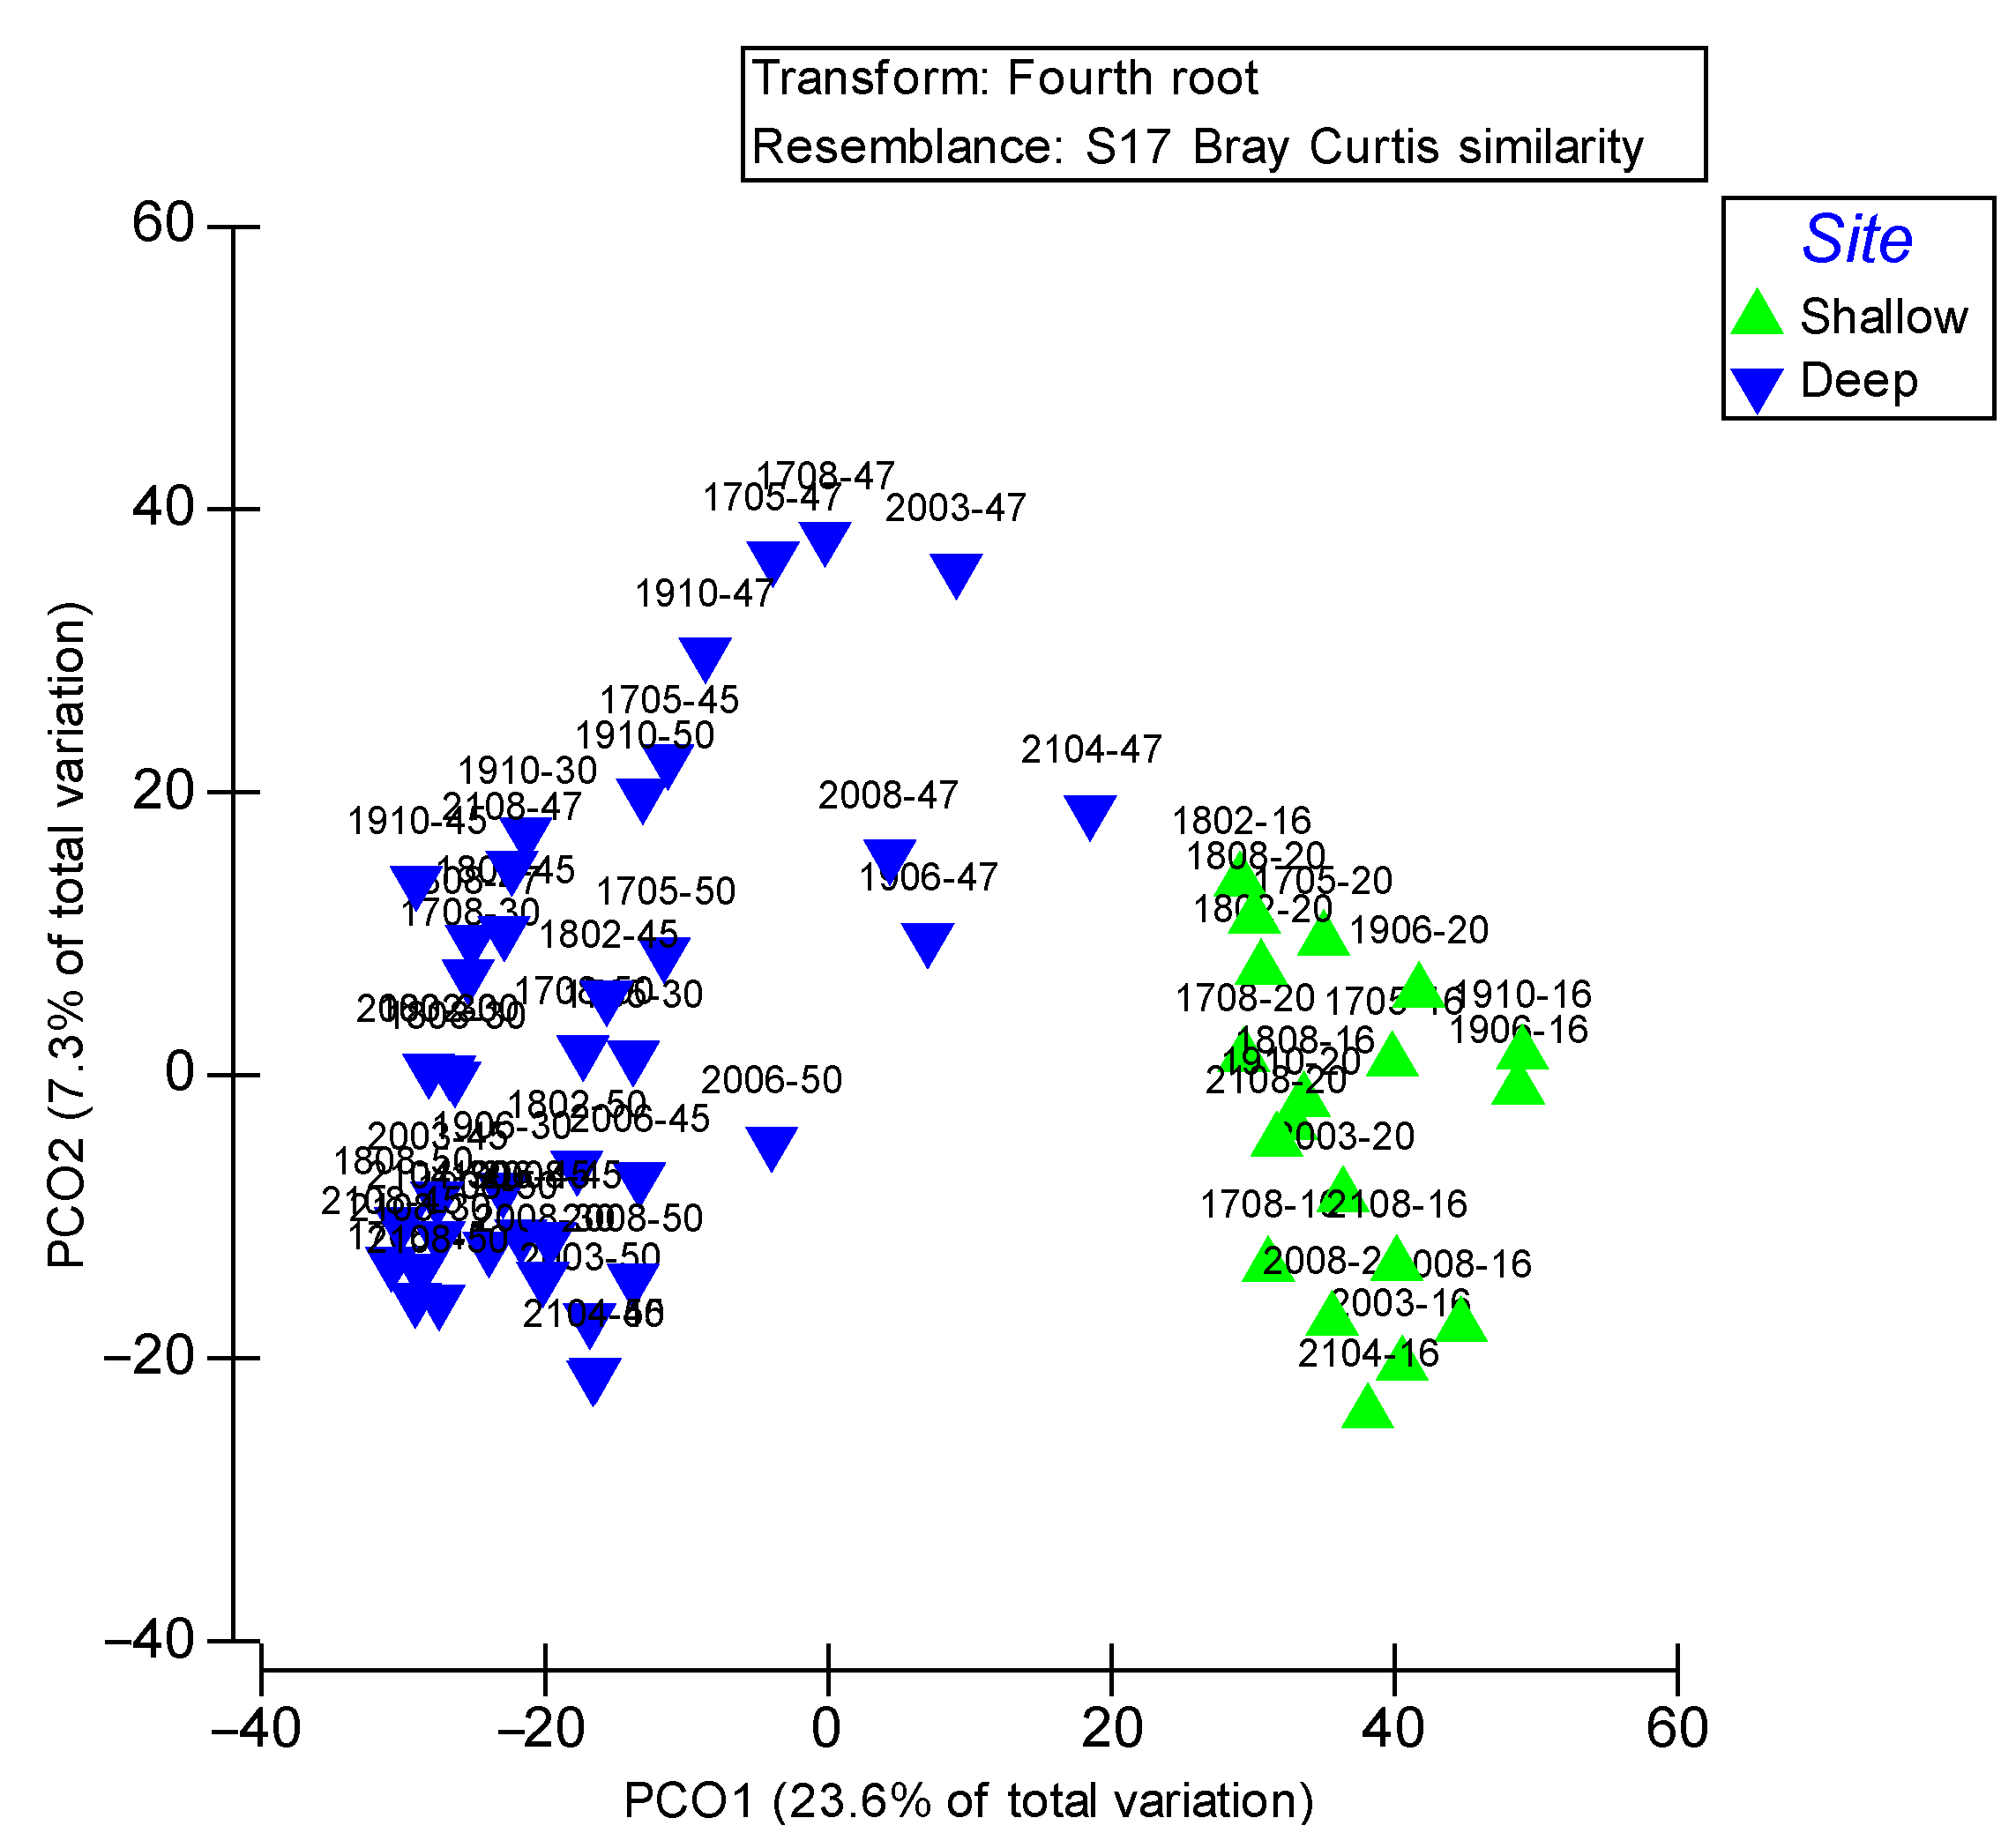
3.4. Patterns of Macrobenthos Assemblages

The first two axes of the PCO explained 23.6% and 7.3% of the variability of macrobenthos assemblages, respectively (Figure 4). The scatter plot of sampling points showed separation by water depth groups.
A biota–environment matching (BIO–ENV) analysis showed that macrobenthic community had the highest correlation with water temperature, salinity, sand, and depth (correlation: 0.809) (Table 5). Second, the correlation of the combination of water temperature, salinity, mean grain size (Mz), and depth was 0.808. Water temperature and salinity are variables related to water depth, and they play an important role in community relationships.

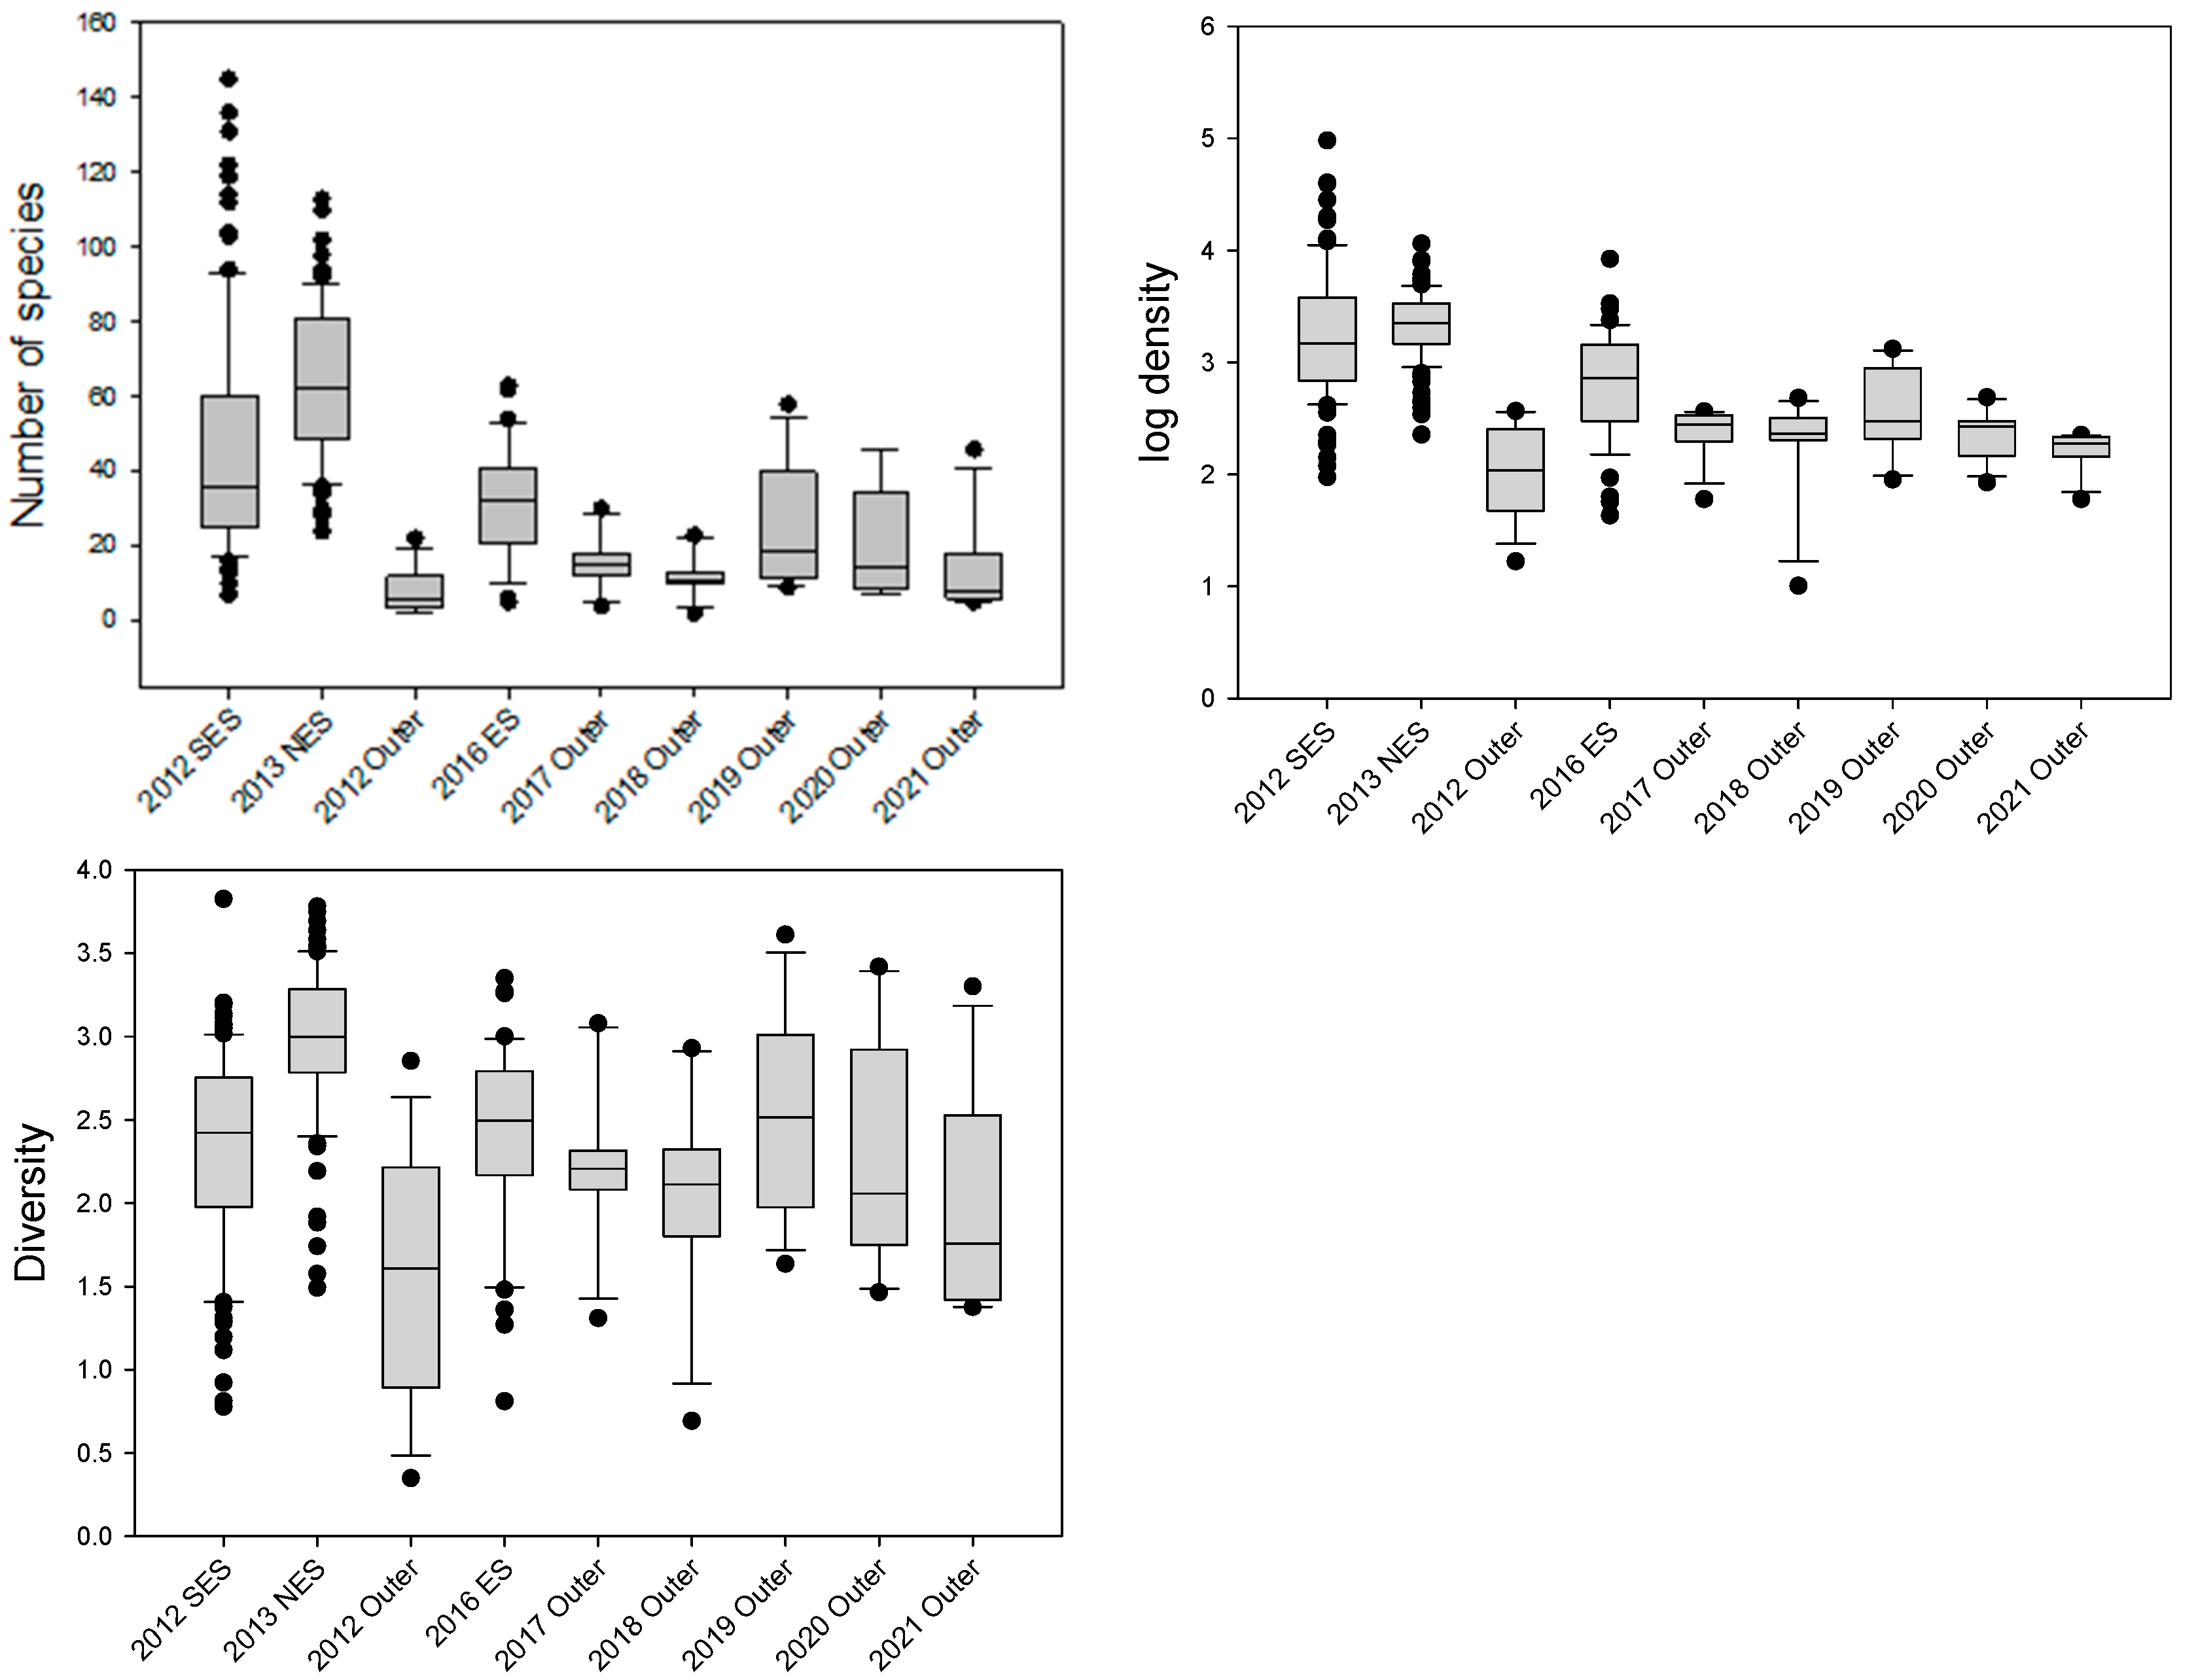
3.5. Comparison with Previous Studies

The number of species, density, and biomass data of the present study were compared with those of previous studies conducted in waters around Dokdo in 2012, 2013, and 2016 (Table 6, Figure 5). In 2012 and 2016, 135 and 177 species were recorded off Dokdo and Ulleungdo, respectively. Near the coast, the southern East Sea and East Sea had 458 and 487 species, respectively, which were higher numbers than recorded for Dokdo. Sampling was performed 27 times in the coastal area, which was more than that around Dokdo or Ulleungdo. Both Dokdo and the Ulleung Basin were surveyed in 2012, along routes that were very similar to those in the current survey. The number of species increased over time, and the species density showed a gradual increase. In Dokdo, the number of species was lower in 2016 than 2012 and 2013. The dominant species on Dokdo and Ulleungdo were the arthropods Byblis japonicus and Abludomelita denticulat, while polychaetes were dominant in both the southern East Sea and East Sea; Spiophanes bombyx was the most dominant species. In the Ulleung Basin, the species number and density were slightly lower in 2012 than in the current survey. In the Ulleung Basin, there was higher biomass in 2019 due to the predominance of echinoderms with large biomass (Figure 6). The current survey showed a lower number of species compared to the previous survey. In 2012 and 2017, it was conducted on the coast around the island with high species diversity and the water was not deep.

4. Discussion

The average depth of the deep-water sites (sts. 30, 45, 47, and 50) was 2144 m and that of the shallow-water sites (sts. 16 and 20) was 182.5 m. Sites 16 and 20 are located on the east side of Dokdo Island, which sits on a volcanic body with the Ulleung Interplain Gap (depth > 2000 m) to the west and two seamounts on the Oki bank side to the east [42]. The deep-water sites at the Ulleung Interplain Gap had low water temperature and DO content. The DO, nutrient, and chlorophyll α contents directly or indirectly [43] determine the species distributions of benthic ecosystems and communities [44,45]. Even in the shallow waters of the present survey area, species compositions differed from those of the East Sea coast because the depth exceeds 100 m. At water depths below 100 m in the East Sea, there were large seasonal differences in the dominant species, and their habitat was continually restricted by physical disturbance of the lower layer of the sedimentary bed by waves [46]. Thus, water depths of ≤200 m are more suitable for benthic organism communities [47].
Our results showed that the average habitat density did not differ between deep and shallow waters. The depths of the deep-water sites were approximately 2000 m, and environments distinct from those of the shallow-water site were formed. The density, biomass, and diversity of benthic communities in deep sea ecosystems are generally relatively low because they depend on fluxes of organic matter delivered from the upper layer [48,49]. The similar densities between water depths observed in this study may be related to the efficiency of the sampling equipment used to collect animals living in sediment at different depths. The BC had higher sampling efficiency than the Smith–McIntyre grab, especially for infaunal polychaetes that burrow deep into the sediment [50,51]. The sedimentary environment of the deep sea has a profound effect on benthic life and is an important determinant of feeding patterns [52]. The average particle size, TOC, and silt, and the clay percentages, were higher in deep water. Therefore, several dominant species have adapted to thrive in deep water with a high TOC.
Compared to previous studies, there were many new species, and the dominant species were also different. The species composition of the shallow and deep waters was not similar to that reported in previous studies, with a high percentage of polychaete taxa. The biggest difference from the previous study was the water depth. The average water depth in the current survey was 1490 m, and even the shallow water depth exceeded 170 m, which is much deeper than previous surveys. Changes in water depth appear to have affected species composition. Polychaetes accounted for >34% of the total species composition and had a lower biomass but higher species number and density than other taxa. This trend was more pronounced in deep water, where the dominant species were smaller in size. The reduction of standing stocks at depth has long been recognized on a local scale and is a very common phenomenon in the deep sea [53,54]. This trend may indicate superior environmental adaptation in polychaetes in terms of their function within the benthic ecosystem.
Feeding modes can be useful for identifying and monitoring environmental variables, such as changes in marine habitats [31,55,56], marine ecology, adaptation mechanisms, and preference mechanisms [57,58]. In the current survey, deposit feeders were predominant in the deep sea (54%), followed by suspension feeders (29%) and carnivores (15%). In shallow waters, the density of carnivores and suspension feeders increased and was higher than that of deposit feeders. The polychaete Terebellides horikoshii is a deposit feeder that was not detected in shallow water, appearing most frequently at st. 30 (deep water). The polychaete Chaetozone setosa, a surface deposit feeder, was detected at all sites, but at a higher rate in deep-water ones. Generally, suspension feeders are abundant in sandy habitats and deposit feeders are predominant in muddy sediments [59], whereas carnivores are more prevalent in habitats with coarse sand [60,61]. A deposit feeder obtains nutrients by consuming organic matter attached to sediment particles and consuming detritus [62]. Bivalves, which are the second most dominant taxon after polychaetes, are abundant in shallow waters; most are suspension feeders, with preferred habitats differing among species [63]. In particular, Axinopsida subquadrata appeared frequently in shallow waters in this survey, whereas in other areas it has been found in waters as deep as 2550 m [64]. It is necessary to study the ability of specific species to withstand extreme water depths to analyze the adaptation mechanisms associated with these environmental conditions.
Amphipods such as Byblis japonicus and Melita sp. were common in shallow water in past surveys but were rarely observed in the present one. This species is dominant in very shallow water (>100 m) and was generally found in small numbers in this study, as the water depth exceeds 100 m in the survey area. In this study, Terebellides horikoshii typically predominated in deep-water sites, with numbers recorded that were not different from those in previous studies. Thus, it was possible to predict the habitat environment simply by identifying the dominant species, which could aid aspects of marine management such as environmental impact assessments [65]. Monitoring the distribution of dominant species could allow us to detect environmental gradients across the entire habitat that occur in response to disturbances [59]. Further research is needed to evaluate the effects of environmental factors on benthic organisms in the East Sea, including the Ulleung Basin.

5. Conclusions

In this study, we detected 262 macrofaunal species in the Ulleung Basin from 2017 to 2021 (average, 243 individuals/m2). Polychaetes were the dominant taxon, accounting for 57% of all species, followed by mollusks (22%), arthropod crustaceans (10%), and echinoderms (4%). The most abundant species was the polychaete Chaetozone setosa, followed by Terebellides horikoshii. Species dominance differed according to the water depth, and the number of species and the species diversity index were higher in shallow than deep water. Community structures also differed between deep and shallow water, and community composition was related to sediment type, water temperature, and DO. The number of species, diversity index, and biomass were strongly correlated with the percentage of sand. Comparing our Dokdo and Ulleungdo data with those reported in 2013 and 2016 revealed an increase in the number of species over time but no difference in habitat density in these regions.

Author Contributions

Conceptualization, O.H.Y. and S.L.K.; methodology, S.L.K.; software, S.L.K.; validation, O.H.Y. and S.L.K.; formal analysis, S.L.K.; investigation, O.H.Y., S.L.K., H.G.L., G.H.H. and S.M.K.; writing—original draft preparation, O.H.Y. and S.L.K.; writing—review and editing, O.H.Y. and S.L.K.; and funding acquisition, O.H.Y. All authors have read and agreed to the published version of the manuscript.

Funding

This research was supported by the Korea Institute of Ocean Science and Technology (PG52911) and by the Korea Institute of Marine Science & Technology Promotion (KIMST) funded by the Ministry of Oceans and Fisheries (20210646).

Institutional Review Board Statement

Not applicable.

Informed Consent Statement

Not applicable.

Data Availability Statement

All data presented in this study are available.

Acknowledgments

We would like to thank the crew members of R/V Eardo for the sampling.

Conflicts of Interest

The authors declare no conflict of interest.

References

  1. Lee, D.K.; Niiler, P.P. The energetic surface circulation patterns of the Japan/East Sea. Deep. Res. Part II Top. Stud. Oceanogr. 2005, 52, 1547–1563. [Google Scholar] [CrossRef]
  2. Onishi, M.; Ohtani, K. Volume Transport of the Tsushima Warm Current, West of Tsugaru Strait Bifurcation Area. J. Ocean. 1997, 53, 27–34. [Google Scholar] [CrossRef]
  3. Kawabe, M. Study of Kuroshio and Tsushima Current. J. Oceanogr. 1986, 42, 319–331. [Google Scholar] [CrossRef]
  4. Jenkins, W.J. The biogeochemical consequences of changing ventilation in the Japan/East Sea. Mar. Chem. 2008, 108, 137–147. [Google Scholar] [CrossRef]
  5. Senjyu, T. The Japan sea intermediate water, its characteristics and circulation. J. Oceanogr. 1999, 55, 111–122. [Google Scholar] [CrossRef]
  6. Morimoto, A.; Yanagi, T. Variability of sea surface circulation in the Japan sea. J. Oceanogr. 2001, 57, 1–13. [Google Scholar] [CrossRef]
  7. Lee, T.-S.; Kim, I.-N. Chemical Imprints of the Upwelled Waters off the Coast of the Southern East Sea of Korea. Ocean. Sci. J. 2003, 38, 101–110. [Google Scholar]
  8. Hyun, J.H.; Kim, D.; Shin, C.W.; Noh, J.H.; Yang, E.J.; Mok, J.S.; Kim, S.H.; Kim, H.C.; Yoo, S. Enhanced phytoplankton and bacterioplankton production coupled to coastal upwelling and an anticyclonic eddy in the Ulleung basin, East Sea. Aquat. Microb. Ecol. 2009, 54, 45–54. [Google Scholar] [CrossRef]
  9. Shin, H.R.; Shin, C.W.; Kim, C.; Byun, S.K.; Hwang, S.C. Movement and structural variation of warm eddy WE92 for three years in the Western East/Japan Sea. Deep. Res. Part II Top. Stud. Oceanogr. 2005, 52, 1742–1762. [Google Scholar] [CrossRef]
  10. Kim, K.; Kim, K.R.; Min, D.H.; Volkov, Y.; Yoon, J.H.; Takematsu, M. Warming and structural changes in the east (Japan) sea: A clue to future changes in global oceans? Geophys. Res. Lett. 2001, 28, 3293–3296. [Google Scholar] [CrossRef]
  11. Postlethwaite, C.F.; Rohling, E.J.; Jenkins, W.J.; Walker, C.F. A tracer study of ventilation in the Japan/East Sea. Deep. Res. Part II Top. Stud. Oceanogr. 2005, 52, 1684–1704. [Google Scholar] [CrossRef]
  12. Mitchell, D.A.; Watts, D.R.; Wimbush, M.; Teague, W.J.; Tracey, K.L.; Book, J.W.; Chang, K.I.; Suk, M.S.; Yoon, J.H. Upper circulation patterns in the Ulleung Basin. Deep. Res. Part II Top. Stud. Oceanogr. 2005, 52, 1617–1638. [Google Scholar] [CrossRef]
  13. Kwak, J.H.; Hwang, J.S.; Choy, E.J.; Park, H.J.; Kang, D.J.; Lee, T.S.; Chang, K.I.; Kim, K.R.; Kang, C.K. High primary productivity and f-ratio in summer in the Ulleung basin of the East/Japan Sea. Deep. Res. Part I Oceanogr. Res. Pap. 2013, 79, 74–785. [Google Scholar] [CrossRef]
  14. Chang, K.I.; Teague, W.J.; Lyu, S.J.; Perkins, H.T.; Lee, D.K.; Watts, D.R.; Kim, Y.B.; Mitchell, D.A.; Lee, C.M.; Kim, K. Circulation and currents in the southwestern East/Japan Sea: Overview and review. Prog. Oceanogr. 2004, 61, 105–156. [Google Scholar] [CrossRef]
  15. Yoo, S.J.; Park, J.S. Why is the southwest the most productive region of the East Sea/Sea of Japan? J. Mar. Syst. 2009, 78, 301–315. [Google Scholar] [CrossRef]
  16. Cha, J.; Kim, M. A preliminary study for the distribution of rocky intertidal fauna in the Korean coastal areas of the East Sea including Dokdo and Ulleungdo. Korean J. Environ. Biol 2013, 31, 225–231. [Google Scholar] [CrossRef]
  17. Song, S.J.; Park, J.; Ryu, J.; Rho, H.S.; Kim, W.; Khim, J.S. Biodiversity hotspot for marine invertebrates around the Dokdo, East Sea, Korea: Ecological checklist revisited. Mar. Pollut. Bull. 2017, 119, 162–170. [Google Scholar] [CrossRef]
  18. Kang, S.M.; Lee, H.G.; Kim, S.L.; Choi, J.W.; Park, C.H.; Yu, O.H. Species composition and community structure of macrobenthos during fall on the Dokdo coast, Korea. Ocean Polar Res. 2019, 41, 47–61. [Google Scholar] [CrossRef]
  19. Kim, S.T.; Hwang, K.S.; Park, G.J.; Choi, C.G. Benthic algal community of Ulleungdo, East coast of Korea. J. Fish. Mar. Sci. Educ. 2016, 28, 83–90. [Google Scholar] [CrossRef]
  20. Kim, M.K.; Kim, K.T. Studies on the Seaweeds in the Islands of Ullungdo and Dokdo: I. Decrease of Algal Species Compositions and Changes of Marine Algal Flora. Korean Soc. Phycol. 2000, 15, 199. [Google Scholar]
  21. Snelgrove, P.; Blackburn, T.; Hutchings, P. The importance of marine sediment biodiversity in ecosystem processes. Ambio 1997, 26, 578–583. [Google Scholar]
  22. Dauer, D.M. Biological criteria, environmental health and estuarine macrobenthic community structure. Mar. Pollut. Bull. 1993, 26, 249–257. [Google Scholar] [CrossRef]
  23. Hu, C.; Dong, J.; Gao, L.; Yang, X.; Wang, Z.; Zhang, X. Macrobenthos functional trait responses to heavy metal pollution gradients in a temperate lagoon. Environ. Pollut. 2019, 253, 1107–1116. [Google Scholar] [CrossRef] [PubMed]
  24. Patrício, J.; Neto, J.M.; Teixeira, H.; Salas, F.; Marques, J.C. The robustness of ecological indicators to detect long-term changes in the macrobenthos of estuarine systems. Mar. Environ. Res. 2009, 68, 25–36. [Google Scholar] [CrossRef] [PubMed] [Green Version]
  25. Dauvin, J.C.; Ruellet, T. The estuarine quality paradox: Is it possible to define an ecological quality status for specific modified and naturally stressed estuarine ecosystems? Mar. Pollut. Bull. 2009, 59, 38–47. [Google Scholar] [CrossRef]
  26. Pearson, T.; Rosenberg, H. Macrobenthic succession in relation to organic enrichment and pollution of the marine environment. Oceanogr. Mar. Biol. Annu. Rev. 1978, 16, 229–311. [Google Scholar]
  27. Gray, J.S. Species richness of marine soft sediments. Mar. Ecol. Prog. Ser. 2002, 244, 285–297. [Google Scholar] [CrossRef] [Green Version]
  28. Rodil, I.F.; Lohrer, A.M.; Chiaroni, L.D.; Hewitt, J.E.; Thrush, S.F. Disturbance of sandflats by thin terrigenous sediment deposits: Consequences for primary production and nutrient cycling. Ecol. Appl. 2011, 21, 416–426. [Google Scholar] [CrossRef]
  29. Kim, S.L.; Yu, O.H. Benthic polychaete community structure in the Yellow Sea Bottom Cold Water zone (YSBCW): Species diversity, temporal-spatial distribution, and feeding guilds. Mar. Pollut. Bull. 2022, 183, 114071. [Google Scholar] [CrossRef]
  30. Yu, O.H.; Lee, H.G.; Lee, J.H.; Kim, K.T.; Myung, C.S.; Moon, H.T.; Byun, J.Y. Spatial variation in macrobenthic communities affected by the thermal discharge volumes of a nuclear power plant on the East Coast of Korea. Ocean Polar Res. 2013, 35, 299–312. [Google Scholar] [CrossRef] [Green Version]
  31. Kim, S.L.; Lee, H.G.; Yu, O.H. Correlation between rocky reefs and surrounding benthic habitats: Distribution and diversity patterns of polychaetes in the macrobenthic community in the East Sea of South Korea. J. Sea Res. 2021, 174, 102083. [Google Scholar] [CrossRef]
  32. Choi, J.W.; Hyun, S.M.; Kim, D.S.; Kim, W.S. Macrobenthic faunal assemblages on the soft-bottoms around Dokdo in the East Sea, Korea. Ocean Polar Res. 2002, 24, 429–442. [Google Scholar] [CrossRef] [Green Version]
  33. Folk, R.; Ward, W. Brazos River bar: A study in the significance of grain-size parameters. J. Sediment Pet. 1957, 27, 3–26. [Google Scholar] [CrossRef]
  34. KIOST. The Report on a Sustainable Research and Development of Dokdo; Report; Ministry Land, Transport and Maritime Affairs: Seoul, Republic of Korea, 2012; p. 1033. [Google Scholar]
  35. KOEM. General Investigation of Marine Ecosystem in the Southeastern Sea of Korea; BSPN11-119; Ministry of Oceans and Fisheries: Seoul, Republic of Korea, 2013; p. 600. [Google Scholar]
  36. KOEM. General Investigation of Marine Ecosystem in the Northeastern Sea of Korea; BSPN11-119; Ministry of Oceans and Fisheries: Seoul, Republic of Korea, 2014; p. 665. [Google Scholar]
  37. Gotelli, N.; Chao, A. Measuring and estimating species richness, species diversity, and biotic similarity from sampling data. In Encyclopedia of Biodiversity; Levin, S.A., Ed.; Elsevier: Amsterdam, The Netherlands, 2013. [Google Scholar]
  38. Colwell, R.K. (Ed.) EstimateS: Statistical Estimation of Species Richness and Shared Species from Samples, version 9; User’s Guide and Application; 2013. Available online: http://purl.oclc.org/estimates (accessed on 10 September 2022).
  39. Dejong, T.M. A Comparison of Three Diversity Indices Based on Their Components of Richness and Evenness. Oikos 1975, 26, 222–227. [Google Scholar] [CrossRef]
  40. Chapman, M.G. Relationships between spatial patterns of benthic assemblages in a mangrove forest using different levels of taxonomic resolution. Mar. Ecol. Prog. Ser. 1998, 162, 71–78. [Google Scholar] [CrossRef] [Green Version]
  41. Clarke, K.R.; Gorley, R.N. PRIMER V6: User Manual/Tutorial; PRIMER-E: Plymouth, UK, 2006. [Google Scholar]
  42. Hyun, S.; Kim, C.H.; Jou, H.; Kim, J.; Park, C.H. Characteristics of surface sediments distribution and submarine topography around Dokdo Island, Korea. J. Geol. Soc. Korea 2010, 46, 647–660. [Google Scholar]
  43. Manasrah, R.; Raheed, M.; Badran, M.I. Relationships between water temperature, nutrients and dissolved oxygen in the northern Gulf of Aqaba, Red Sea. Oceanologia 2006, 48, 237–253. [Google Scholar]
  44. Silva, A.C.F.; Tavares, P.; Shapouri, M.; Stigter, T.Y.; Monteiro, J.P.; Machado, M.; Cancela da Fonseca, L.; Ribeiro, L. Estuarine biodiversity as an indicator of groundwater discharge. Estuar. Coast. Shelf Sci. 2012, 97, 38–43. [Google Scholar] [CrossRef]
  45. Musale, A.S.; Desai, D.V.; Sawant, S.S.; Venkat, K.; Anil, A.C. Distribution and abundance of benthic macroorganisms in and around Visakhapatnam Harbour on the east coast of India. J. Mar. Biol. Assoc. United Kingd. 2015, 95, 215–231. [Google Scholar] [CrossRef] [Green Version]
  46. Paik, S.G.; Kang, R.S.; Jeon, J.O.; Lee, J.-H.H.; Yun, S.G. Distribution patterns of Sandy Bottom Macobenthic Community on the Hupo Coastal Area, in the East Sea of Korea. Ocean Polar Res. 2007, 29, 123–134. [Google Scholar] [CrossRef] [Green Version]
  47. Joydas, T.V.; Manokaran, S.; Borja, A.; Rabaoui, L.; Manikandan, K.P.; Ashraf, T.T.M.; Aarif, K.M.; Hussain, S.A.; Baig, M.H.; Shoeb, M.; et al. A baseline quantitative assessment of deep-sea benthic fauna of the Gulf of Aqaba (Northern Saudi Arabia, Red Sea). Mar. Pollut. Bull. 2021, 164, 112028. [Google Scholar] [CrossRef] [PubMed]
  48. Lambshead, P.J.D.; Brown, C.J.; Ferrero, T.J.; Mitchell, N.J.; Smith, C.R.; Hawkins, L.E.; Tietjen, J. Latitudinal diversity patterns of deep-sea marine nematodes and organic fluxes: A test from the central equatorial pacific. Mar. Ecol. Prog. Ser. 2002, 236, 129–135. [Google Scholar] [CrossRef]
  49. Smith, C.R.; De Leo, F.C.; Bernardino, A.F.; Sweetman, A.K.; Arbizu, P.M. Abyssal food limitation, ecosystem structure and climate change. Trends Ecol. Evol. 2008, 23, 518–528. [Google Scholar] [CrossRef] [PubMed]
  50. Jamieson, A.; Boorman, B.; Jones, D. Deep-Sea Benthic Sampling. In Methods for the Study of Marine Benthos, 4th ed.; Eleftheriou, A., Ed.; John Wiley & Sons: Chichester, UK, 2013. [Google Scholar]
  51. Hayashi, I.; Sugino, N. Some observations on the sampling efficiency of the Smith-McIntyre grab. Bull. Jpn. Soc. Sci. Fish 1993, 59, 1201–1207. [Google Scholar] [CrossRef]
  52. Vetriani, C.; Jannasch, H.W.; Macgregor, B.J.; Stahl, D.A.; Reysenbach, A.L. Population structure and phylogenetic characterization of marine benthic Archaea in deep-sea sediments. Appl. Environ. Microbiol. 1999, 65, 4375–4384. [Google Scholar] [CrossRef] [Green Version]
  53. Gage, J.; Tyler, P. Deep-Sea Biology: A Natural History of Organisms at the Deep-Sea Floor; Cambridge University Press: Cambridge, UK, 1991. [Google Scholar]
  54. Hunter, W.R.; Levin, L.A.; Kitazato, H.; Witte, U. Macrobenthic assemblage structure and organismal stoichiometry control faunal processing of particulate organic carbon and nitrogen in oxygen minimum zone sediments. Biogeosciences 2012, 9, 993–1006. [Google Scholar] [CrossRef]
  55. Domínguez Castanedo, N.; Hernández Alcántara, P.; Solís-Weiss, V.; Granados Barba, A. Distribution of polychaete feeding guilds in sedimentary environments of the Campeche Bank, Southern Gulf of Mexico. Helgol. Mar. Res. 2012, 66, 469–478. [Google Scholar] [CrossRef]
  56. Pagliosa, P.R. Another diet of worms: The applicability of polychaete feeding guilds as a useful conceptual framework and biological variable. Mar. Ecol. 2005, 26, 246–254. [Google Scholar] [CrossRef]
  57. Dolbeth, M.; Teixeira, H.; Marques, J.C.; Pardal, M.Â. Feeding guild composition of a macrobenthic subtidal community along a depth gradient. Sci. Mar. 2009, 73, 225–237. [Google Scholar] [CrossRef] [Green Version]
  58. Maurer, D.; Leathem, W.; Menzie, C. The impact of drilling fluid and well cuttings on polychaete feeding guilds from the US northeastern continental shelf. Mar. Pollut. Bull. 1981, 12, 342–347. [Google Scholar] [CrossRef]
  59. De Juan, S.; Thrush, S.F.; Demestre, M. Functional changes as indicators of trawling disturbance on a benthic community located in a fishing ground (NW Mediterranean Sea). Mar. Ecol. Prog. Ser. 2007, 334, 117–129. [Google Scholar] [CrossRef] [Green Version]
  60. Carvalho, S.; Moura, A.; Gaspar, M.B.; Pereira, P.; Cancela Da Fonseca, L.; Falcão, M.; Drago, T.; Leitão, F.; Regala, J. Spatial and inter-annual variability of the macrobenthic communities within a coastal lagoon (Óbidos lagoon) and its relationship with environmental parameters. Acta Oecologica 2005, 27, 143–159. [Google Scholar] [CrossRef]
  61. Carvalho, S.; Pereira, P.; Pereira, F.; de Pablo, H.; Vale, C.; Gaspar, M.B. Factors structuring temporal and spatial dynamics of macrobenthic communities in a eutrophic coastal lagoon (Óbidos lagoon, Portugal). Mar. Environ. Res. 2011, 71, 97–110. [Google Scholar] [CrossRef]
  62. Jumars, P.A.; Dorgan, K.M.; Lindsay, S.M. Diet of worms emended: An update of polychaete feeding guilds. Ann. Rev. Mar. Sci. 2015, 7, 497–520. [Google Scholar] [CrossRef] [Green Version]
  63. Peterson, B.J.; Heck, K.L. Positive interactions between suspension-feeding bivalves and seagrass—A facultative mutualism. Mar. Ecol. Prog. Ser. 2001, 213, 143–155. [Google Scholar] [CrossRef]
  64. Kamenev, G.M. Species composition and distribution of bivalves in bathyal and abyssal depths of the Sea of Japan. Deep. Res. Part II Top. Stud. Oceanogr. 2013, 86–87, 124–139. [Google Scholar] [CrossRef]
  65. Ellingsen, K.E. Soft-sediment benthic biodiversity on the continental shelf in relation to environmental variability. Mar. Ecol. Prog. Ser. 2002, 232, 15–27. [Google Scholar] [CrossRef]
Figure 1. Sampling area in the Ulleung Basin.
Jmse 11 00092 g001
Figure 2. Macrobenthos species number; density (/m2); biomass (g/m2); and diversity, richness, and evenness indices.
Jmse 11 00092 g002
Figure 3. Cluster analysis of fourth-root-transformed macrobenthos density.
Jmse 11 00092 g003
Figure 4. Principal components analysis (PCO) of macrobenthos.
Jmse 11 00092 g004
Figure 5. Comparison with previous studies of the East Sea (SES, south East Sea; NES, north East Sea; ES, East Sea; outer, area distant from land).
Jmse 11 00092 g005
Figure 6. Comparison of macrobenthos biomass with previous studies on Dokdo by year.
Jmse 11 00092 g006
Table 1. Regional and seasonal environmental variables in the study area.
Variablesst.16st.20st.30st.45st.47st.50SpringSummerAutumnWinter
Depth (m)1921732200223317992344
Temperature (°C)5.4 ± 2.61.7 ± 0.50.2 ± 0.10.2 ± 0.10.2 ± 0.10.8 ± 0.81.3 ± 0.81.2 ± 0.41.21.4 ± 0.4
Salinity (psu)34.1 ± 0.134.0 ± 0.134.1 ± 0.134.1 ± 0.134.1 ± 0.134.1 ± 0.134.1 ± 0.134.1 ± 0.134.134.1 ± 0.1
DO (mg/l)5.5 ± 0.85.5 ± 0.24.4 ± 0.64.5 ± 0.74.4 ± 0.44.8 ± 0.84.6 ± 0.34.9 ± 0.54.84.8 ± 0.1
Gravel (%)8.9 ± 26.67.4 ± 6.80.9 ± 2.71.6 ± 0.17.5 ± 7.70.1 ± 0.14.8 ± 8.02.8 ± 1.343.9 ± 1.6
Sand (%)80.6 ± 38.562.5 ± 21.712.4 ± 5.43.9 ± 31.316.5 ± 11.820.5 ± 31.330.1 ± 19.026.5 ± 13.829.830.5 ± 2.4
Silt (%)1.5 ± 4.110.0 ± 6.621.6 ± 12.128.2 ± 14.721.6 ± 5.719.2 ± 14.521.7 ± 16.819.5 ± 6.218.418.7 ± 7.0
Clay (%)9.0 ± 27.220.1 ± 22.665.1 ± 12.466.3 ± 24.954.4 ± 18.160.2 ± 26.043.3 ± 10.951.3 ± 17.547.846.9 ± 11.0
Mean grain size (phi)2.0 ± 3.03.6 ± 2.68.4 ± 0.88.9 ± 2.67.2 ± 1.98.0 ± 2.66.3 ± 1.97 ± 1.46.76.5 ± 0.8
TOC0.4 ± 0.50.9 ± 0.61.7 ± 0.92.0 ± 0.71.9 ± 0.61.8 ± 0.81.9 ± 0.61.4 ± 0.11.51.5 ± 0.1
Table 2. Macrobenthos species number, density (individuals/m2), and biomass (g/m2).
Taxonst.16st.20st.30st.45st.47st.50SpringSummerAutumnWinter
SpeciesPolychaete11.8 ± 7.014 ± 6.05.2 ± 0.85.4 ± 1.15.7 ± 2.15.5 ± 1.148.28.513.28
Arthropoda4.6 ± 3.74.4 ± 2.61.3 ± 1.70.4 ± 0.82.9 ± 2.21.5 ± 1.85.32.52.62.1
Mollusca3.5 ± 3.53.3 ± 2.92.4 ± 1.32 ± 1.82.6 ± 2.12.3 ± 1.71.42.94.02.9
Echinoderms1.4 ± 1.21.7 ± 1.10.5 ± 0.50.3 ± 0.50.3 ± 0.50.3 ± 0.730.81.21
Others2.6 ± 2.51.3 ± 1.30.4 ± 0.70.6 ± 0.81.6 ± 1.80.6 ± 0.70.91.252.11.4
total23.9 ± 15.524.7 ± 11.29.8 ± 2.78.7 ± 2.813.1 ± 6.010.2 ± 3.18.816.116.915.4
Density
(ind./m2)
Polychaete120 ± 70154 ± 66139 ± 57154 ± 53116 ± 64138 ± 4097131.8152.4132.9
Arthropoda50.3 ± 60.037.5 ± 28.08.2 ± 10.83.2 ± 7.720.5 ± 21.110.8 ± 14.931.619.621.211.4
Mollusca51.1 ± 56.126.8 ± 25.641.2 ± 35.930.9 ± 26.591 ± 75.963.6 ± 40.835.2554.777.851.9
Echinoderms15.8 ± 21.321.2 ± 21.410.3 ± 14.92.5 ± 4.42.9 ± 5.22.4 ± 5.444.811.617.97.9
Others40.3 ± 37.813.7 ± 16.72 ± 3.47.6 ± 11.940.9 ± 59.63.4 ± 4.46.725.424.417.0
total278 ± 163.253 ± 120.201 ± 95198 ± 81272 ± 124219 ± 72160.6243.3287.1221.3
Biomass
(g/m2)
Polychaete10.8 ± 13.22.7 ± 2.12.1 ± 1.72.4 ± 1.43.5 ± 3.12.3 ± 2.57.14.26.41.7
Arthropoda1.7 ± 3.00.2 ± 0.20.3 ± 0.80.1 ± 0.31.4 ± 3.90.1 ± 0.256.80.17.52.4
Mollusca7.4 ± 7.32.2 ± 5.20.4 ± 0.20.5 ± 0.40.5 ± 0.51.6 ± 3.61.91.91.41.1
Echinoderms28.4 ± 75.250.7 ± 88.30.7 ± 0.70.2 ± 0.50.1 ± 0.10.24 ± 0.4118.25.14.010.2
Others109 ± 29810.6 ± 17.60.3 ± 0.70.2 ± 0.40.3 ± 0.50.07 ± 0.1952.92.212.314.3
total157 ± 29666.3 ± 92.73.7 ± 2.53.5 ± 1.75.6 ± 4.24.3 ± 6.075.913.724.130.0
Table 3. Dominant species based on macrobenthos density.
TaxaSpeciesDensity
(Individuals/m2)
% of Total
Density
Frequency (%)
PolychaeteChaetozone setosa1604.411.1100.0
PolychaeteTerebellides horikoshii1469.310.213.3
BivalviaAxinopsida subquadrata982.36.886.7
PolychaeteAglaophamus sp.773.55.443.3
PolychaeteScalibregma inflatum740.15.180.0
PolychaeteSigambra bassi514.33.646.7
PolychaetePetaloproctus dentatus479.13.386.7
BivalviaYoldiella philippiana393.22.773.3
OthersPhascolosoma sp.375.02.673.3
GastropodaDecorifer matusimanus347.22.420.0
BivalviaThyasira tokunagai291.22.053.3
Table 4. Similarity percentage (Simper) analysis of macrobenthos groups.
SpeciesAverage DissimilarityContribution (%)Cumulative (%)
Terebellides horikoshii4.134.494.49
Chaetozone setosa3.013.277.76
Scalibregma inflatum33.2711.03
Sigambra bassi2.682.9213.95
Axinopsida subquadrata2.562.7916.74
Glycera nicobarica2.252.4519.19
Aglaophamus sp.2.062.2421.43
Aricidea sp.1.321.4322.86
Aphelochaeta sp.1.261.3724.23
Notomastus latericeus1.181.2825.51
Petaloproctus dentatus1.171.2726.78
Decorifer matusimanus1.141.2428.02
Scoletoma nipponica1.121.2129.24
Yoldiella philippiana1.031.1230.36
Ophiuroglypha kinbergi1.011.131.46
Synchelidium trioostegitum0.991.0832.54
Laqueus rubellus0.991.0833.62
Scoletoma fragilis0.981.0634.68
Anonyx simplex0.951.0335.71
Phascolosoma sp.0.92136.71
Table 5. Environmental and biological variables affecting the macrobenthos community as determined by a biota–environment matching (BIO–ENV) analysis (Mz = mean grain size).
Number of VariablesCorrelation (%)Best Variables
40.809Temperature, Salinity, Sand, Depth
40.808Temperature, Salinity, Mz, Depth
50.807Temperature, Salinity, Gravel, Sand, Depth
40.807Temperature, Salinity, Gravel, Depth
30.806Temperature, Salinity, Depth
50.803Temperature, Salinity, Gravel, Mz, Depth
10.799Temperature
50.798Temperature, Salinity, Sand, Mz, Depth
30.797Temperature, Salinity, Mz
40.797Salinity, Gravel, Sand, Depth
Table 6. Macrobenthos species number and density (ind./m2) and dominant species in previous studies of the East Sea.
YearAreaSampling SiteSampling NumberNumber of SpeciesDensity (ind./m2)Dominant SpeciesReference
2012Southern East SeaYeongdeok-Gijang274584859(Apo) Spiophanes bombyx
(Apo) Lumbrineris longifolia
(Apo) Tharyx spp.
(Apo) Polydora spp.
KOEM (2013) [35]
2012East SeaUllungdo-Dokdo10135413(Cam) Byblis japonicus
(Cam) Abludomelita denticulata
(Apo) Syllidae sp.
(Apo) Terebellides stroemii
KIOST (2012) [34]
2013Northern East SeaGoseong-Yeongdeok274872603(Apo) Axinopsida subquadrata
(Apo) Spiophanes bombyx
(Apo) Magelona sp.
KOEM (2014) [36]
2016East SeaDokdo151771566(Cam) Abludomelita denticulata
(Cam) Melita shimizui
(Apo) Salvatoria clavata
(MBi) Glycymeris aspersa
Kang et al., (2019) [18]
Disclaimer/Publisher’s Note: The statements, opinions and data contained in all publications are solely those of the individual author(s) and contributor(s) and not of MDPI and/or the editor(s). MDPI and/or the editor(s) disclaim responsibility for any injury to people or property resulting from any ideas, methods, instructions or products referred to in the content.

