Abstract
A seagrass meadow is one of the most important ecosystems around the world, both economically and ecologically. An important feature of this ecosystem is the presence of large coastal seagrass beds, which dominate the primary production and contribute to the secondary productivity of the ecosystem. The microbial loop (consuming bacterial biomass by grazers and using seagrass-derived detritus by bacteria) may be an important mechanism for transferring seagrass-derived organic matter to aquatic food chains. The goal of this study is to gain a better understanding of how bacterial growth and mortality (grazing and viral lysis rates) differ in unvegetated meadow habitats and seagrass habitats. According to this study, DOC levels were higher in seagrass habitats (1685 g L−1) than in unvegetated water surroundings. The instantaneous growth rate of bacteria in seagrass habitats was 2.05 d−1, higher than that of unvegetated water. In a seagrass environment during the summer, we have found that viral lysis and grazing both result in similar mortality rates of bacteria during the summer season. It has been found, however, that bacterial production is controlled by the availability of resources (bottom-up control) in adjacent unvegetated waters, and is thus cycled internally within the bacteria–virus–DOC loop within those waters.
1. Introduction
Seagrass meadows play an essential role in coastal benthic ecosystems because seagrasses produce high levels of primary production [1,2], providing habitat and food for a variety of marine organisms [3,4]. Seagrasses have been shown to play an important role in capturing and storing carbon in the ocean, as well as acting as a carbon sink [5]. The process of photosynthesis absorbs carbon dioxide from the atmosphere and transforms it into biomass by capturing it. There is no doubt that seagrass ecosystems are one of the most significant natural carbon sinks on earth, due to the fact that they are able to sequester significant amounts of carbon, store it as organic carbon for long periods, and are capable of occurring worldwide [6]. Further, seagrass meadows absorb excess carbon dioxide (blue carbon) from the atmosphere, thereby reducing ocean acidification [7].
One of the main factors limiting the growth of heterotrophic bacteria is the quality and quantity of dissolved organic carbon (DOC) in water [8]. In areas of marine grass meadows, the amount of DOC is higher than in adjacent areas of unvegetated meadows [9]. In addition, seagrass roots may directly transport organic matter to benthic bacteria via exudates, as well as supporting productive epiphytic communities [10,11]. It is nonetheless noteworthy that Boschker et al. [12] conducted stable carbon isotope experiments in eutrophic environments, and discovered that the DOC derived from seagrasses in sediments from Zostera spp. meadows played a relatively small role in bacterial growth, suggesting that benthic algae played the main role in supplying carbon to bacteria. The seagrass-exuded DOC, however, is a significant carbon source in oligotrophic seagrass beds that contributes to bacterial growth [10,13]. Seagrasses are also able to release DOC and oxygen as a result of their diel photosynthetic activity which also accounts for the amount of these substances they release [14,15,16]. Seagrass rhizospheres have been found to have twofold higher bacterial production rates during noon than at night, compared to non-vegetated sediments nearby [17]. In general, most information on bacterial biomass and production in seagrass systems is available in some studies [7,12,13,14], but no study on bacterial mortality, especially viral lysis on bacterial community in seagrass environments. There is no doubt that viral lysis and protozoan grazing are both crucial factors in controlling bacterial mortality in aquatic ecosystems. It is important to understand that how bacteria are lysed or grazed can impact the microbial food chain in different ways. In addition, it affects biogeochemical cycling as well. In order to fully understand the complex dynamics of these systems, it is essential to understand and appreciate the role played by these different mechanisms. For understanding and quantifying the carbon cycle in seagrass-dominated ecosystems, it is essential to have a reliable measure of bacterial growth and mortality in the system.
We aim to better understand how seagrass and unvegetated meadow habitats differ in terms of bacterial growth and mortality. Therefore, the primary focus of this study was determining bacterial growth and mortality using modified dilution experiments [18]. It was hypothesized that exposure to seagrass-derived DOC would lead to a higher rate of bacterial growth and mortality than in adjacent unvegetated meadows.
2. Materials and Methods
2.1. Study Site and Samplings
In June 2023, two established stations (stations S and C) located in Kenting collected surface samples (at a depth of about 1 m) from the southern part of the Taiwan coastal area (Figure 1). Stations S and C represent seagrass meadows and adjacent unvegetated areas, respectively. We gently poured surface water into 10 L polypropylene carboys after collecting it with a bucket at station S. In order to avoid being influenced by water flowing across the meadow, we collected seawater from the chamber located at station C in order to produce an independent sample (Figure 1). Following the casting of the sampling bucket, the temperature of the water was measured immediately, and all samples were brought to the laboratory within 30 min. According to our previous studies [19,20], we analyzed DOC concentration. To determine the DOC content, the water sample was filtered through a 0.7 µm glass fiber filter (GF/F, Whatman, Maidstone, UK). To prevent contamination from organic materials, the glass bottles for DOC analysis were pre-washed in 0.1 N HCl and pre-combusted for 4 h at 450 °C.
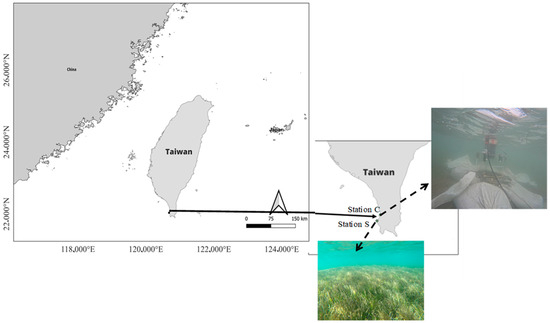
Figure 1.
The sampling sites are illustrated on this map. Stations S and C represent seagrass meadows and adjacent unvegetated areas, respectively. A chamber located at station C was used to collect seawater.
2.2. Modified Dilution Experiments
We examined how the seagrass environment affected surface waters during summer compared with adjacent unvegetated areas on bacterial growth and loss caused by grazing and viral infection. Our objective was to assess the growth, grazing, and viral lysis rates of bacteria by taking advantage of the modified dilution method [18] in order to achieve these results. To prepare the ‘standard’ diluent, seawater (2 L) was passed through a 10 µm mesh filter, followed by a Nuclepore 47 mm filter (type PC, pore size 0.2 µm). Following the filtration of the seawater sample (10 µm), the 0.2 µm filtered seawater was diluted using a 4-point dilution series of 25, 50, 75, and 100%. A dilution series using 30 kDa filtered seawater instead of 0.2 µm filtered water altered grazing as well as viral mortality. Under natural light, triplicates of 50 mL polycarbonate bottles were incubated in a water bath set at the in situ seawater temperature at the time of sampling. To determine the abundance of viruses and bacteria, triplicate subsamples were collected from t0. At the end of the experimental period, t24, final samples were taken from every bottle. We calculated the net growth rate for bacteria at each dilution within an experimental series (i.e., 0.2 m and 30 kDa) as ln(Nt24/N0)/t. Nt24 and N0 represent the final and initial abundance of bacteria, respectively, and t represents the experimental duration (24 h).
According to Evans et al. [18], growth, grazing, and viral-induced mortality coefficients were calculated for bacteria as described in this paper. A dilution series regression of 30 kDa was used to determine the growth rates of bacteria (µ) without both mortality factors. A slope of a 0.2 m filtered seawater dilution series was used in this study to calculate the nanoflagellate grazing coefficient (mg). Further, nanoflagellate grazing and viral-induced mortality (mg + mv) were derived from the slope of the 30 kDa filtered seawater dilution series. Based on these results, virus-induced bacterial mortality rates are equal to the difference between these two regression slopes, i.e., mv = (mv + mg) − mg.
2.3. Flow Cytometric Analyses
An analysis of virus samples and bacteria samples was performed using a CytoFLEX S flow cytometer (Beckman Coulter, Brea, CA, USA) that was equipped with an argon-ion laser at 488 nm, a filter at 525 nm, and a SYBR signal trigger in order to measure the presence of viruses and bacteria. To reduce interference from high particle density due to interference from high particle density, TE buffer (pH 8.0, EM grade) was used to dilute virus samples 1:10 prior to staining. We stained diluted samples with SYBR Green I (1:50,000 of commercial stock) for 10 min in the dark at 80 °C. Following staining, samples were cooled in an ice bath to 25 °C and processed through FCM according to Brussaard [21]. It was determined that blank controls were run on TE buffer stained with the same concentrations of SYBR Green I as those used in the experiment, in order to detect and eliminate noise in the buffer. As described by Hammes and Egli [22], bacteria samples were stained with SYBR Green I (final concentration 1:10,000) for 15 min in the dark, before processing through FCM.
2.4. Statistical Analysis
It was determined by a linear regression analysis of Model 1 if there is a relationship between the net growth rate of bacteria and each of the series of dilution experiments (30 kDa and 0.2 μm). An analysis of variance (ANOVA) was used to examine the significance of the slope based on the data. The significance of the difference between the slopes of the 30 kDa and 0.2 μm regression lines was determined by F-test. All statistical operations were carried out using the STATISTICA 7.0 software. The significance of the results was determined by a probability value of <0.05.
3. Results
3.1. Station Characteristics
In June, both stations recorded a temperature of approximately 28 °C. Station S was situated in a seagrass environment and had a higher level of DOC (1685 µg L−1) compared to station C (as shown in Table 1). According to Table 1, the bacterial abundance in the seawater collected in June measured 7.3 and 5.2 × 10⁵ cells mL−1 at station C and S, respectively. Virus abundance was 3.4 × 10⁶ mL−1 and 8.9 × 10⁶ cells mL−1 at stations C and S, respectively (Table 1). Virus-to-bacterial ratios (VBR) were 4.7 and 17.1 at stations C and S, respectively (Table 1). Station C had the lower VBR.

Table 1.
The data of dissolved organic carbon, bacterial abundance, viral abundance, virus-to-bacteria ratio (VBR), bacterial growth rate, grazing and viral lysis at the sampling stations. *: growth rate of bacteria was calculated from the fractionated series of 0.2-μm. nd: not determined.
3.2. Bacterial Growth Rates
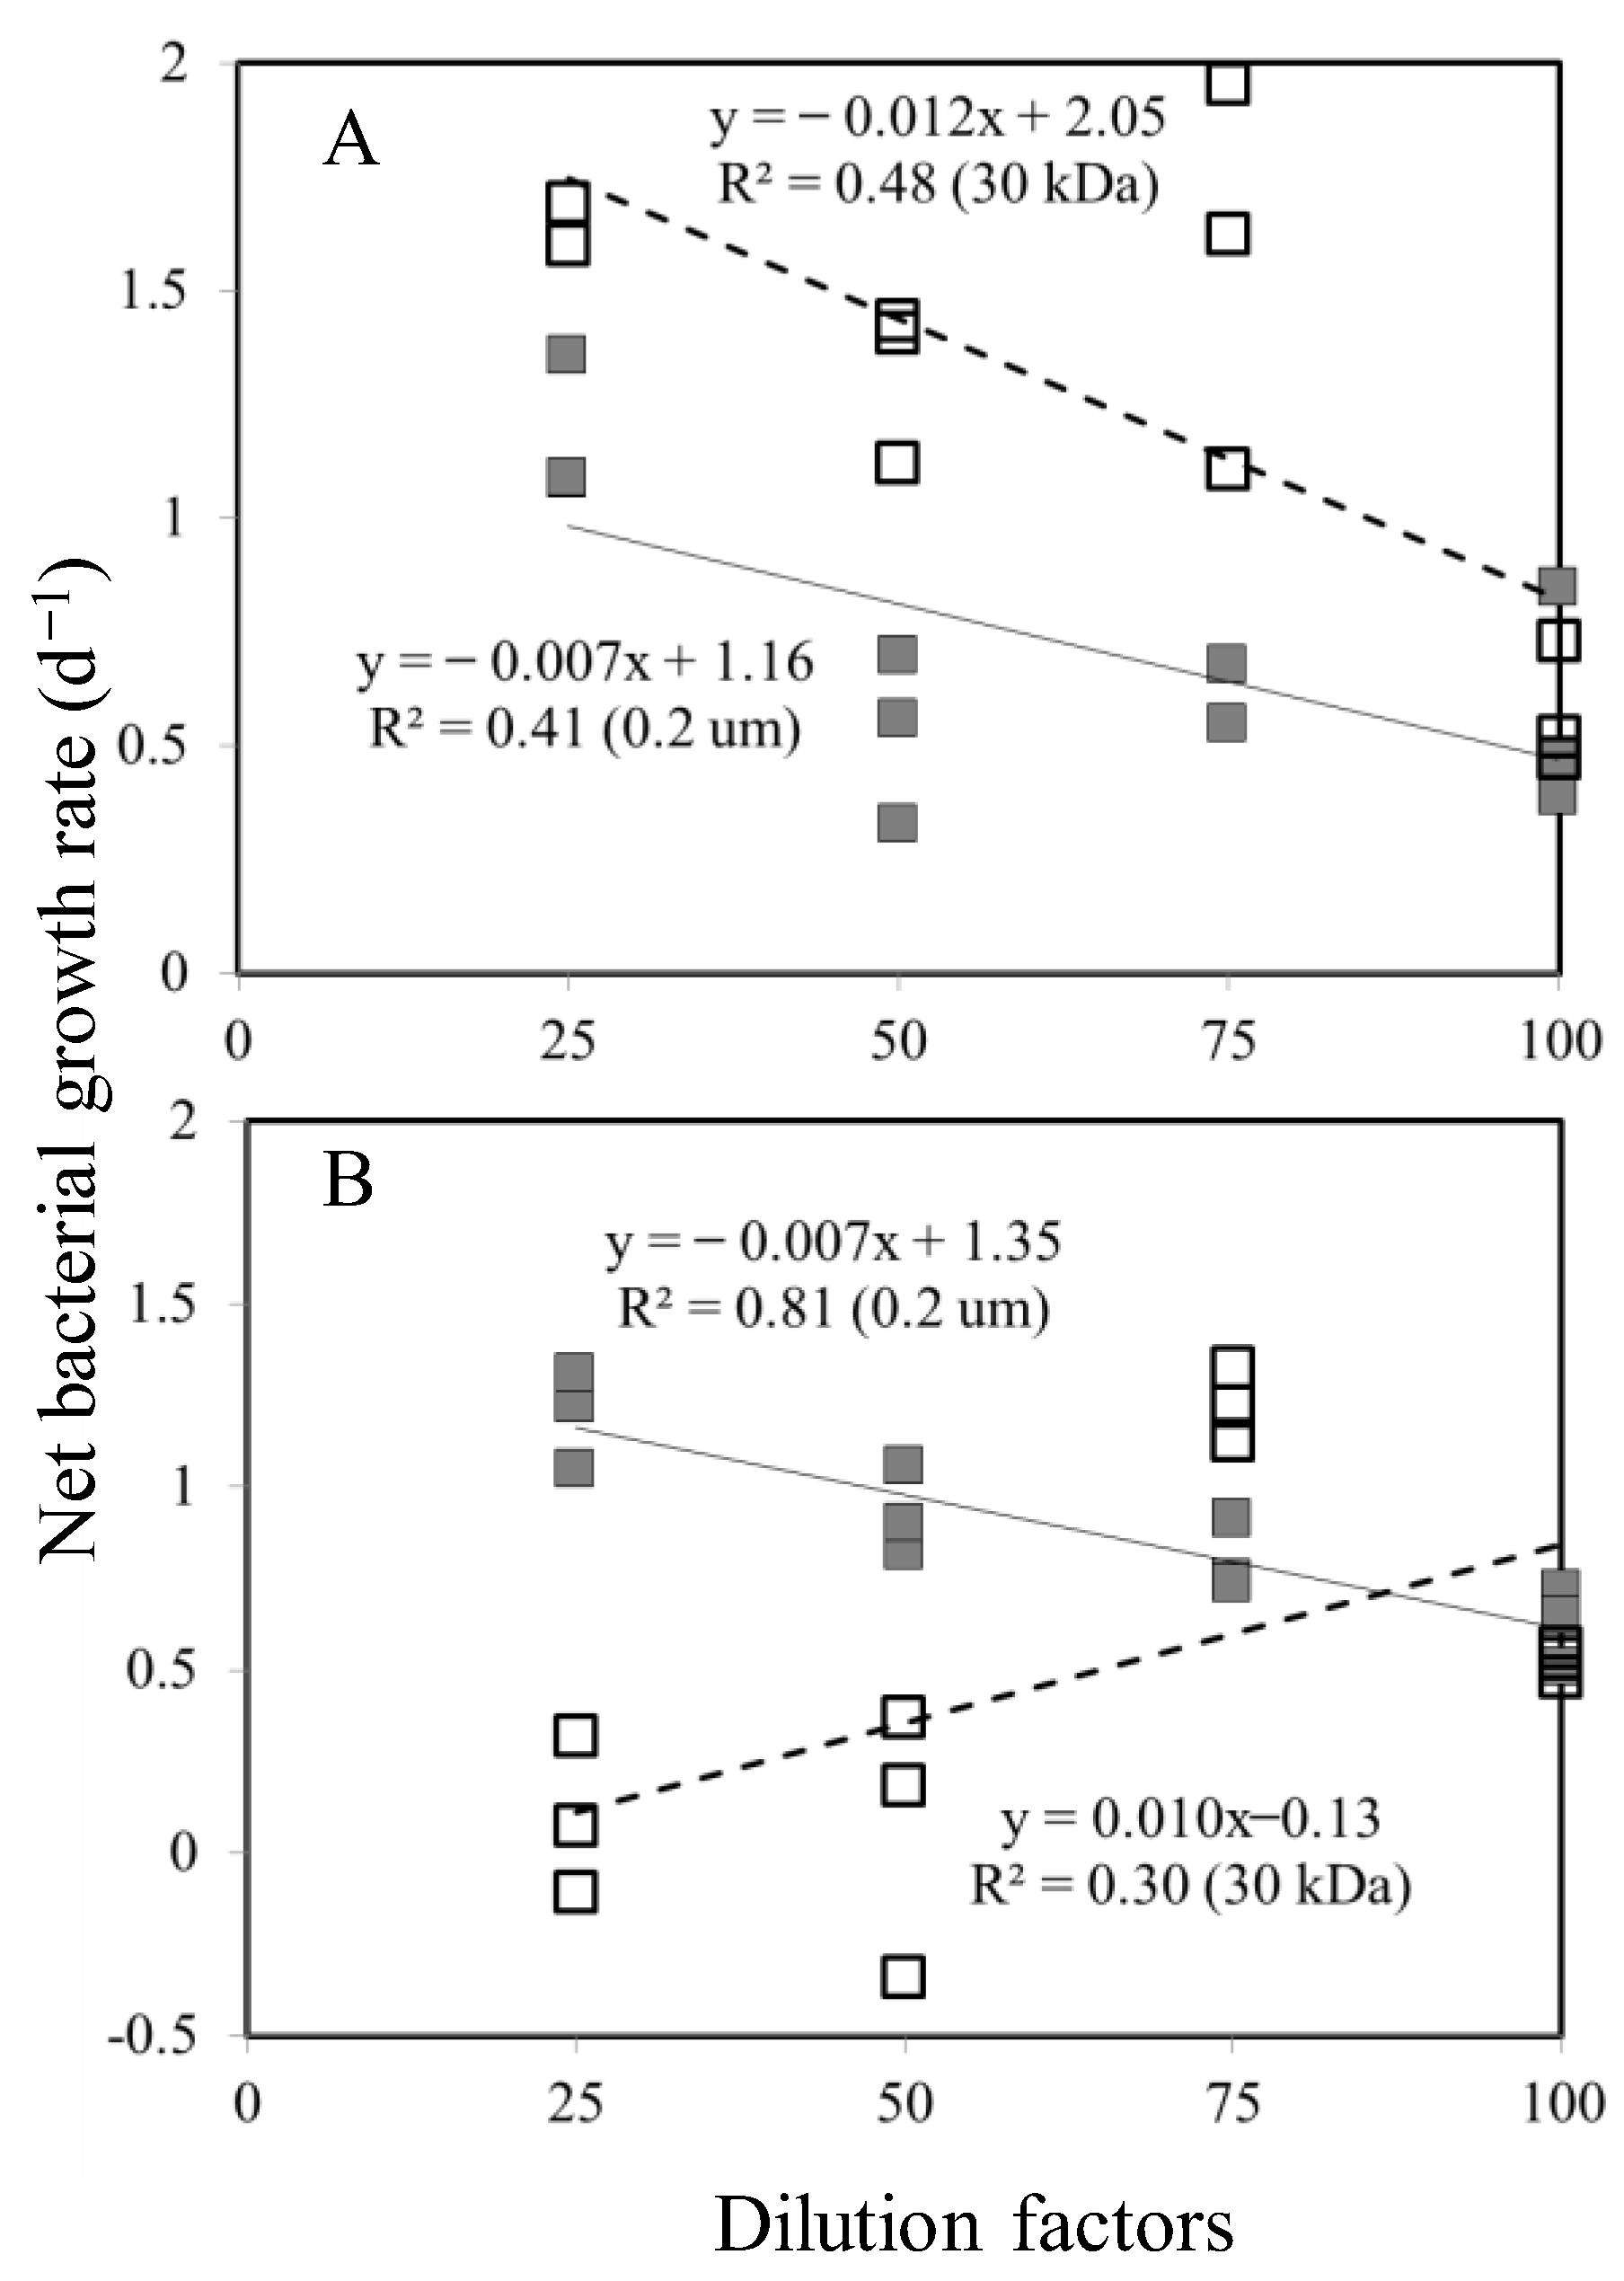
Using least-square regression, it was determined whether net growth rates increased directly with the dilution factor (Figure 2). For station S, there was a highly significant relationship (ANOVA, p < 0.05) between bacterial net growth rate and dilution level in both series of 0.2 m and 30 kDa (Figure 2A). According to Figure 2A, the y-intercepts of these regression lines were 1.16 and 2.05 d−1 for 0.2 m and 30 kDa fractionated series, respectively. An instantaneous growth rate of 2.05 d−1 is calculated without lytic or grazing pressure (Table 1).
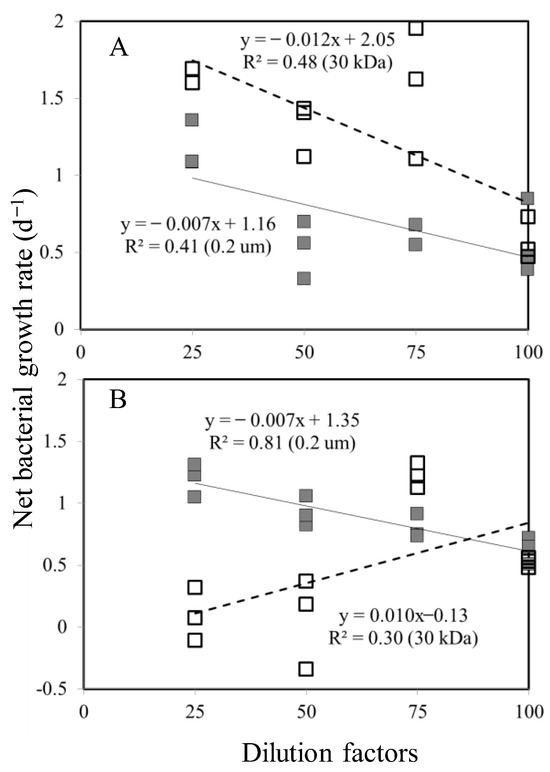
Figure 2.
Net bacterial growth rate vs. fraction of sample water in the dilution series experiments incubated at station S (A) and C (B), respectively. Seawater sample (<10 μm) diluted with the 30 kDa filtered seawater (open square), seawater sample (<10 μm) diluted with the 0.2 μm filtered seawater (filled square). Solid and broken lines: linear regression of 0.2 µm filtered and 30 kDa filtered seawater, respectively.
In the adjacent unvegetated areas experiments, we also found a significant relationship (ANOVA, p < 0.05) between the bacterial net growth rate and the level of dilution in both the 0.2 μm and 30 kDa series (Figure 2B), but a positive slope was found in the 30 kDa dilution series (Figure 2B), and so it was impossible to quantify their specific potential growth rates. Figure 2B shows that the y-intercept of these regression lines is 1.35 d−1 for fractionated series of 0.2 μm. In the absence of grazing pressure, this value represents the instantaneous growth rate (Table 1).
3.3. Bacterial Mortality
The regression slopes of the 0.2 μm and the 30 kDa dilution series were clearly different (F-test, p < 0.05), indicating that the gradient in grazers and viral abundance created in the 0.2 μm and 30 kDa dilution series had a significant impact on the mortality of bacteria at station S. Thus, the regression coefficients (slope) at station S were −0.007 and −0.012 d−1 for the 0.2 µm and 30 kDa fractionated series, respectively (Figure 2A). The difference between the two slope values of 0.005 d−1 indicated bacterial mortality due to viruses, lytic mortality accounted for was 42% of the total mortality at station S (Table 1). According to standard dilution experiments (0.2 m fractionated series), the bacterial mortality rate due to nanoflagellate grazing at station C was 0.007 d−1 (Figure 2B); however, in this study, we were unable to estimate the viral mortality of bacteria at station C (Figure 2B).
4. Discussion
Station S is surrounded by coastal environments dominated by seagrass, which due to its low lying induces sandy soil sedimentation, resulting in a beneficial environment for seagrass growth. Nevertheless, adjacent unvegetated areas have coral reef terrain with little sandy soil. Various physical and biological phenomena interact with each other to determine how the dynamics of a population of any given group of organisms proceed. As a result of advection and diffusion, bacteria are subjected to two types of physical processes. As well as cell division and cell death, grazing and viral lysis are some of the biological processes that affect them. As far as we know, the modified dilution method is the only method available that will allow the simultaneous measurement of bacteria growth and mortality rates. To the best of our knowledge, no studies have been conducted on how viruses affect marine bacteria in the southern part of the Taiwan coastal area, so the rate of viral lysis of marine bacteria in this part of the Taiwan coast is not well understood. As the first study to identify the mortality effects of both viral lysis and grazing on bacteria in a seagrass zone as well as an adjacent unvegetated zone, the results of the study were compared. Although both viral lysis and grazing caused similar mortality rates of bacteria in seagrass in summer, grazing mortality of bacteria prevailed in adjacent unvegetated zones where grazing mortality dominated. Moreover, our data indicate that bacteria in adjacent unvegetated waters are controlled by available resources (bottom-up control) and are cycling within the bacteria–virus–DOC loop that takes place in adjacent unvegetated waters. It is possible that this shift in the fate and cycling of organic matter may have implications for the fate and cycling of organic matter in the regions we studied.
4.1. Bacterial Growth and Mortality
In terms of the amount of productivity that benthic producers generate as well as the fate of that productivity, the studies of benthic producers can be of importance to climate studies. According to estimates, seagrass covers approximately 6 × 10⁵ km2 of global seafloor, and it produces approximately 0.5 PgC per year in net primary production (NPP). Consequently, this represents approximately 1% of the NPP of phytoplankton in the ocean [23]. Although benthic producers play an important role in both the local ecology and biogeochemical cycle of a particular area, the extent to which they contribute to this process also depends on the extent to which production is left unremineralized by herbivores and decomposers to accumulate on the seabed [24]. During photosynthesis by seagrass roots and rhizomes, the organic carbon that is produced is released, and some of it can be consumed by bacteria in order to satisfy their nutritional needs [10]. The study also found that sources of organic carbon outside of the seagrass community are able to contribute to increased bacterial productivity [10]. According to previous studies, seagrass ecosystems were found to be dominated by a substantial amount of bacterial production. According to some reports, heterotrophic bacteria (both part of the sediment and part of the water column) are responsible for more than half of the total primary production of seagrass meadows in Australia [25]. As a result of the current study, the DOC value of the seagrass was found to be higher than that of the adjacent meadow habitats (Table 1). This transfer of seagrass-derived organic matter to aquatic ecosystems is likely to occur as a result of microbial loops (the utilization of detritus derived from seagrass by bacteria, as well as the consumption of bacterial biomass by grazers). Whether bacteria act as carbon sinks or carbon links depends on the ecosystem, however, and that remains an open question in seagrass-dominated ecosystems.
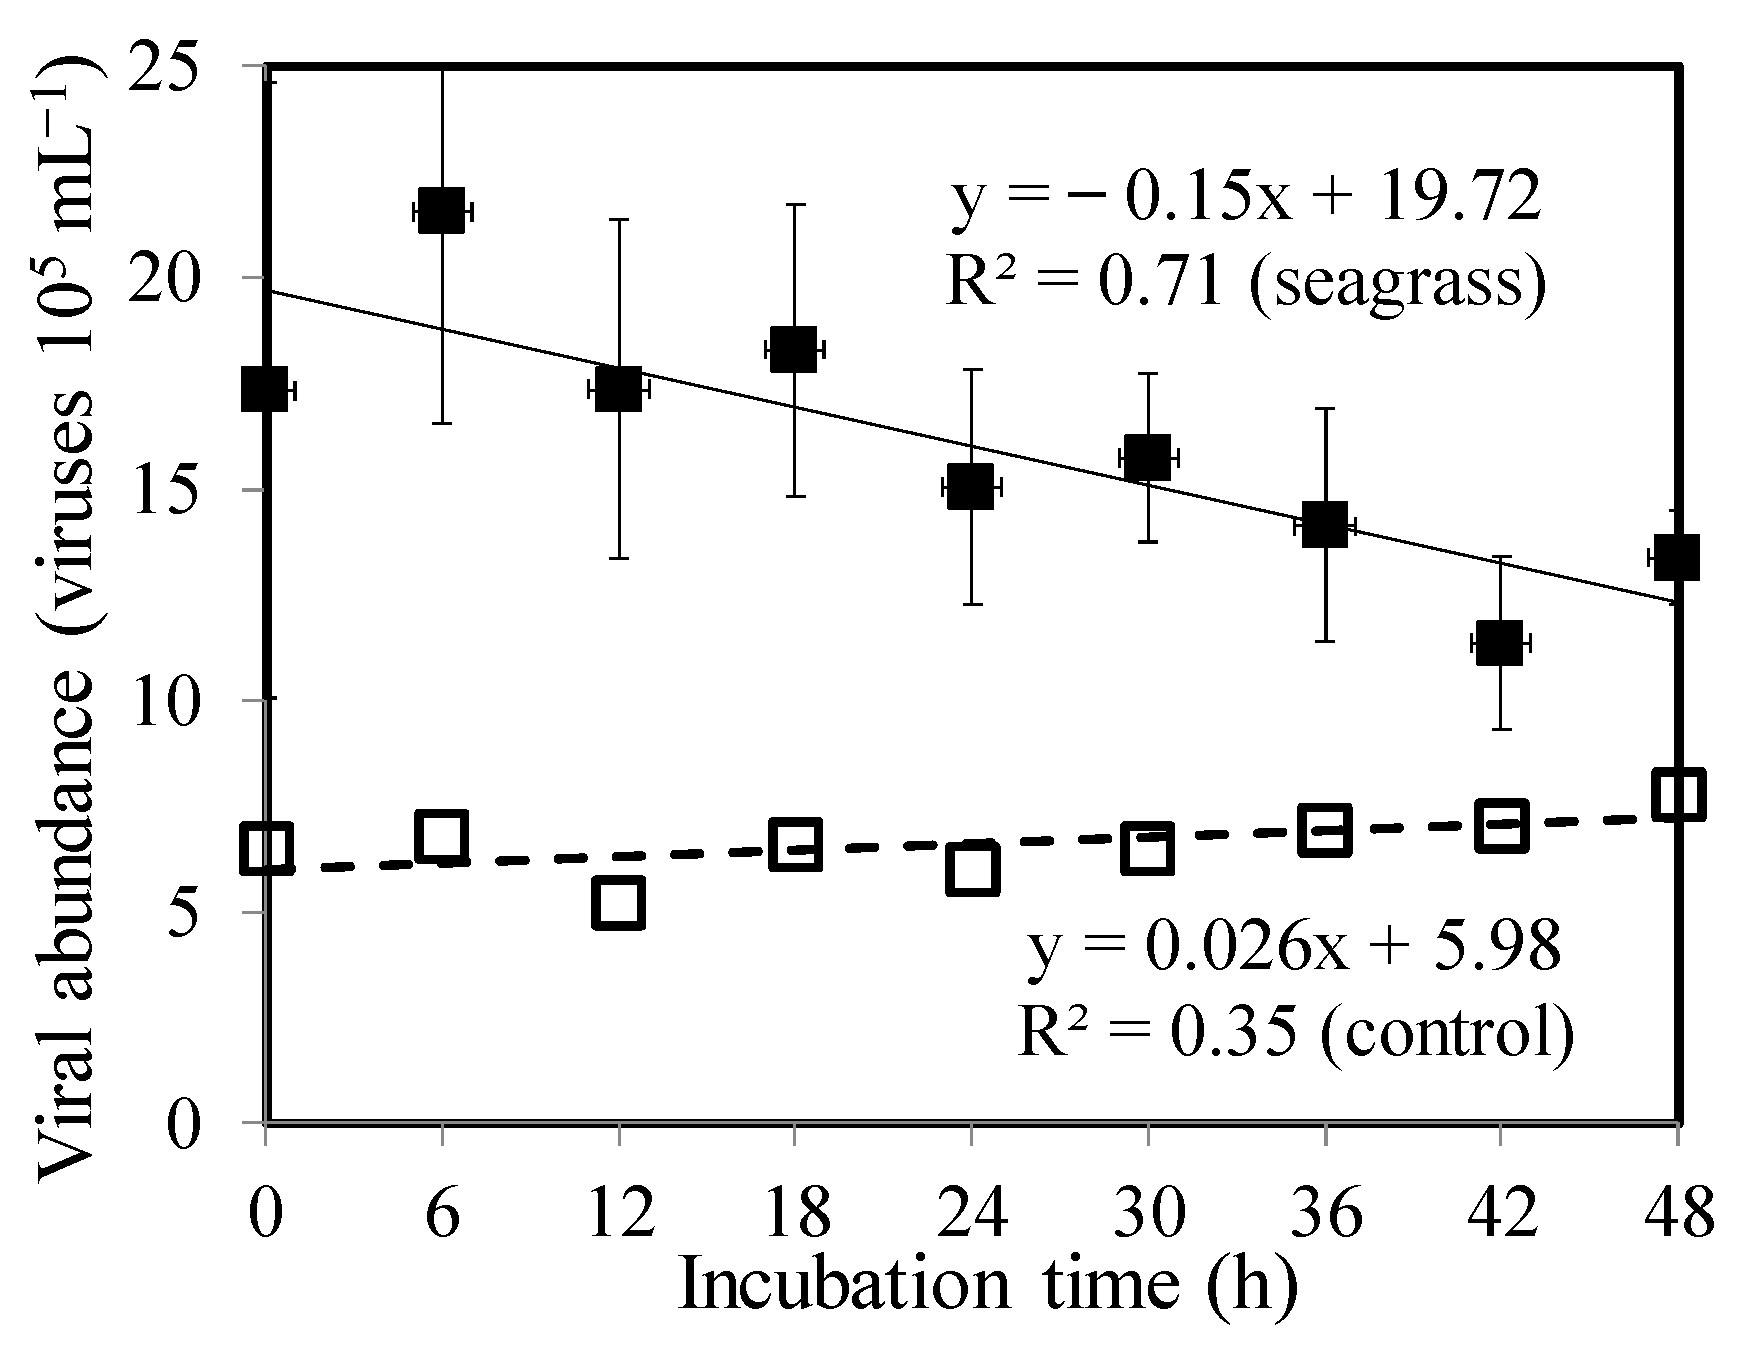
The technique of dilution has been successfully used on a variety of prey as well as in a variety of environments [26,27,28]. Moreover, Evans et al. [18] also applied a dilution series that included microzooplankton and viruses to determine the mortality caused by grazing and virus lysis in the laboratory. Based on the regression coefficient for apparent growth rate versus dilution factor of 0.2 μm dilution series, only the microzooplankton grazing rate (mg) was considered. In this study, 30 kDa filtered seawater was used as a diluent, and the regression slope was reflective of both the loss of bacteria due to grazing as well as the loss of viruses (mg and mv). The viral mortality rate of bacteria was calculated, based on the difference between the regression slopes drawn for the two dilution series, using the difference between the slopes of the regression equation. In contrast to other methods for estimating viral impact on host mortality, the dilution method is capable of providing quantitative information concerning both viral lysis and microzooplankton grazing without the need for conversion factors. There are, however, two critical assumptions associated with using the dilution technique in many cases, which are not satisfied. The first point to keep in mind is that, based on the assumptions of the dilution method, plankton growth is exponential, without being influenced by the dilution factor [29]. As a consequence, nutrient availability as well as other factors of the environment should not restrict the growth of plankton in any way. It is interesting to note that the results of Ayukai [30] differ from the findings of Landry and Hassett [29] concerning the effects of limiting nutrients on their study. In an experiment performed by Ayukai [30], Synechococcus spp. growth was reduced by most diluted treatments. We have found, similarly to Ayukai [30], that the positive slope of the fractionated 30 kDa series is contrary to what was expected, and with the same method we have been unable to measure the rate of growth and mortality of bacteria at station C (Figure 2B). According to the dilution method, a second assumption is made that the mortality rate of plankton resulting from predation is proportional to the amount of dilution seen on the abundance of parasites (viruses) and predators (grazers) [31]. Hence, the dilution gradient that was established at the beginning of the experiment should remain constant throughout the whole experiment to ensure that predators or viruses are prevalent throughout the whole experiment. In our study, we observed that the abundances of the viruses significantly differed between the start and end of each experiment, which did not satisfy this assumption. During the present experiments at station S, we observed a decrease in viral abundance after the viral dilution series were observed over time in a 25% dilution factor of 30 kDa fractionated series (Figure 3). In seagrass-dominated ecosystems, bacteria are more likely to be infected by viruses at a 25% dilution factor of 30 kDa fractionated series within 48 h.
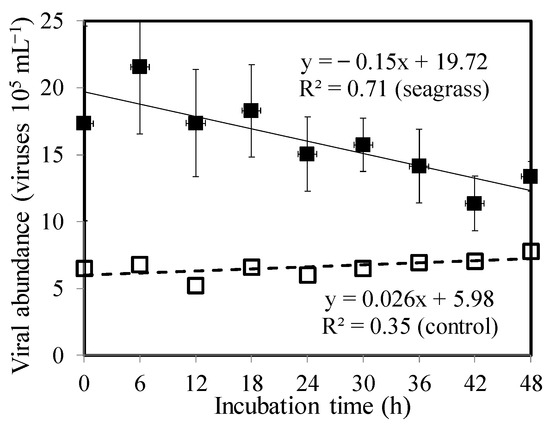
Figure 3.
Temporal variations of viral abundance during 48 h incubations for 25% diluted factor in the 30 kDa filtered seawater in seagrass meadows (filled black square) and adjacent unvegetated areas (open square), respectively. The solid and broken lines depict linear regressions for seagrass meadows and unvegetated areas nearby.
The present study showed that there were two types of responses to the modified dilution experiment at station C (Figure 2B). It is expected that there will be a negative slope in a regression line of apparent growth versus a fraction of 0.2 μm filtered water when there is a significant mortality impact from grazing. In spite of this, the slope generated from the fractionated 30 kDa series is the opposite of what one would expect, making it impossible to calculate the growth and mortality rates for bacteria. Studies suggest that viral lysis products, such as cell content and fragments of cell walls, enter the organic matter pool, which bacteria primarily use. As a result of this viral shunt [32,33], bacterial production increases, and the bacteria-nanoflagellate relationship is reduced. There is a possibility that a reduction in nutrient remineralization might have caused a decrease in the bacterial instantaneous growth rate due to the dilution of heterotrophic bacteria and viruses from the 30 kDa fractionated series as a result of the decreased mineralization. It seems, based on our findings, that nutrients were limited in the experiments, even for those cases in which positive-linear responses were detected. The reason we believe this is because the dilution of the original water could disrupt the supply of nutrients and DOC to the bacteria, as a result of which the growth rate of the bacteria became lower in the most diluted treatments. There is still a great deal of work to be conducted in order to understand how viruses may lead to nutrient regeneration within aquatic environments. There is still a challenge when it comes to measuring nutrition regeneration in microbial communities since it is so difficult to directly quantify the process. There have been some experiments in the field with viral-host systems that have provided evidence that the regeneration of nutrients by viral lysis may be an important ecological function in some environments [34].
4.2. Microbial Ecology in Seagrass Meadows
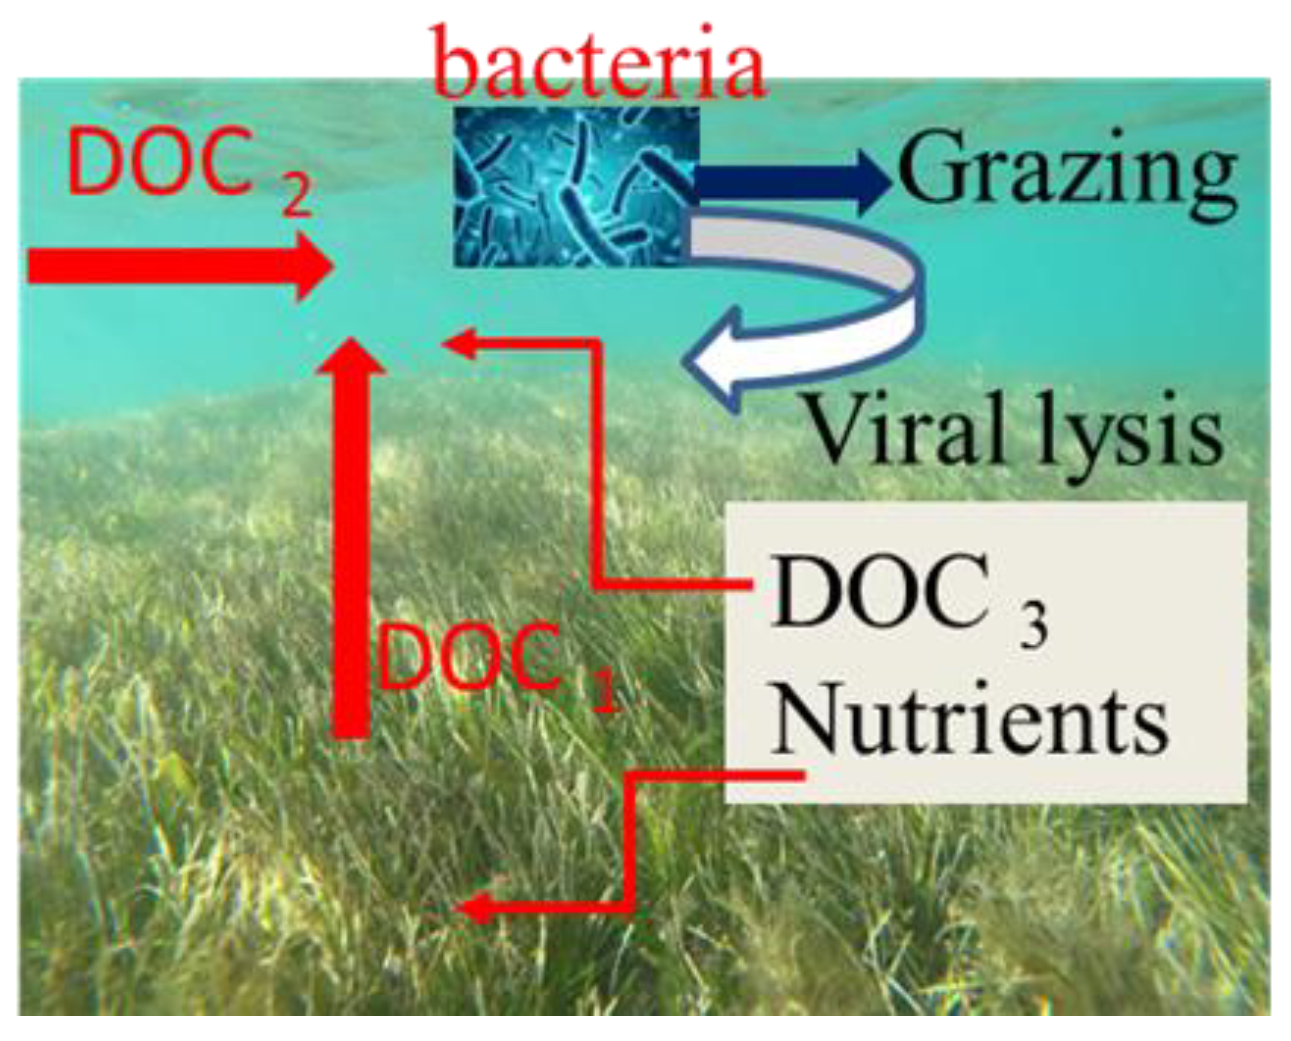
A further study is needed for the estimation of carbon and energy flux through heterotrophic microorganisms as well as the possible role bacteria play in the trophic dynamics of ecosystems. A debate has been going on about whether bacterial production and biomass are controlled by available resources (bottom-up control) or predators/viruses (top-down control). The present study does not identify what factors may be responsible for the variation in growth and mortality of seagrass meadows and adjacent non-vegetated areas, but it is possible to speculate that there are some possible explanations. The carbon sources available for bacterial growth are most likely to come from three important sources in the seagrass meadow environment. During the photosynthesis process, DOC is released by seagrasses as the first step (shown as DOC1) (Figure 4). Also during phytoplankton photosynthesis, another DOM is released extracellularly (DOC2). As a third effect, viral lysis of bacteria could release relatively labile dissolved organic carbon into the marine DOC pool (DOC3). As a result of the fact that carbon is not only fixed photosynthetically but is also recycled through bacteria–virus interactions, it is difficult to estimate the percentage of primary productivity contributed by bacterial productivity in this study. A previous study in seagrass meadows of Australia estimated that heterotrophic bacteria (sediments and the water column) accounted for nearly half of the total primary production [35]. However, a number of studies have shown that seagrass growth is limited by nutrient availability, and marine seagrass may depend on bacteria associated with it for nutrient availability [36,37]. Hence, this “viral loop” might not only control bacterial production but also supply recycled nutrients for seagrass growth (Figure 4).

Figure 4.
Image the interaction of seagrass meadows and bacteria. DOC1: DOC is released by seagrasses during photosynthesis. DOC2: DOC is released extracellularly from phytoplankton photosynthesis. DOC3: viral lysis of bacteria release relatively labile dissolved organic carbon into the marine DOC pool.
In the present study, we found that bacterial growth rates were significantly lower in treatments with reduced viral abundance in the 30 kDa filtered series in adjacent unvegetated water, the presence of active viruses stimulated bacterial growth, as indicated by Figure 2B. Moreover, the DOC pool in the oligotrophic unvegetated waters was significantly influenced by viral lysis of bacteria, based on our results in adjacent unvegetated waters. Aside from this, even small amounts of organic phosphorus, nitrogen, and carbon are likely to increase bacterial growth in the presence of bacterial lysis products, which bacteria could readily utilize [38]. Our data show that bacteria production is controlled by resource availability (bottom-up control) and cycled within the bacteria–virus–DOC loop in adjacent unvegetated water.
5. Conclusions
In summary, since viral lysis and microzooplankton grazing impact the bacterial community differently in seagrass meadows and adjacent unvegetated areas, it is crucial to assess their importance relative to each other. The current study found similar rates of bacterial mortality caused by viral lysis and grazing in a seagrass environment, whereas grazing mortality predominated in adjacent unvegetated regions. Also, our data indicate that bacteria production is controlled by available resources (bottom-up control) and cycled in the bacteria–virus–DOC loop in unvegetated waters. In the regions that we studied, this shift may have important implications for organic matter fate and cycling.
Author Contributions
Conceptualization: A.-Y.T.; methodology: A.-Y.T., P.W.-Y.C. and M.O.; validation: A.-Y.T.; formal analysis: P.W.-Y.C., A.-Y.T. and M.O.; investigation: A.-Y.T., P.W.-Y.C. and M.O.; resources: A.-Y.T. and W.-C.C.; data curation: A.-Y.T. and R.-F.S.; writing—original draft preparation: A.-Y.T. and P.W.-Y.C.; writing—review and editing: A.-Y.T. and V.M.; funding acquisition: A.-Y.T., V.M. and W.-C.C. All authors have read and agreed to the published version of the manuscript.
Funding
The research was conducted in the frame of the Russian state assignments No.121040600178-6, 121121700354-9 (the program ‘Prioritet-2030’ of Sevastopol State University) and supported by RFBR project 21-55-52001, and the Ministry of Science and Technology, ROC (Taiwan), grant number NSC 109-2611-M-019-013 and MOST 111-2119-M-019-002.
Institutional Review Board Statement
Not applicable.
Informed Consent Statement
Not applicable.
Data Availability Statement
All data are provided in the main text.
Acknowledgments
We appreciate the language editing and helpful comments related to this manuscript.
Conflicts of Interest
The authors declare no conflict of interest.
References
- Russell, B.D.; Connell, S.D.; Uthicke, S.; Muehllehner, N.; Fabricius, K.E.; Hall-Spencer, J.M. Future seagrass beds: Can increased productivity lead to increased carbon storage? Mar. Poll. Bull. 2013, 73, 463–469. [Google Scholar] [CrossRef] [PubMed]
- Lohrer, A.M.; Townsend, M.; Hailes, S.F.; Rodil, I.F.; Cartner, K.; Pratt, D.R.; Hewitt, J.E. Influence of New Zealand cockles (Austrovenus stutchburyi) on primary productivity in sandflat-seagrass (Zostera muelleri) ecotones. Estuar. Coast. Shelf Sci. 2016, 181, 238–248. [Google Scholar] [CrossRef]
- Beck, M.W.; Heck, K.L., Jr.; Able, K.W.; Childers, D.L.; Eggleston, D.B.; Gillanders, B.M.; Halpern, B.; Hays, C.G.; Hoshino, K.; Minello, T.J.; et al. The identification, conservation and management of estuarine and marine nurseries for fish and invertebrates. Biosciences 2001, 51, 633–641. [Google Scholar] [CrossRef]
- Valentine, J.F.; Duffy, J.E. The central role of grazing in seagrass ecology. In Seagrasses: Biology, Ecologyand Conservation; Springer: Amsterdam, The Netherlands, 2006; pp. 463–501. [Google Scholar]
- Mazarrasa, I.; Marba, N.; Lovelock, C.E.; Serrano, O.; Lavery, P.S.; Fourqurean, J.W.; Kennedy, H.; Mateo, M.A.; Krause-Jensen, D.; Steven, A.D.L.; et al. Seagrass Meadows as a Globally Significant Carbonate Reservoir. Biogeosciences 2015, 12, 4993–5003. [Google Scholar] [CrossRef]
- Ricart, A.M.; York, P.H.; Bryant, C.V.; Rasheed, M.A.; Ierodiaconou, D.; Macreadie, P.I. High variability of Blue Carbon storage in seagrass meadows at the estuary scale. Sci. Rep. 2020, 10, 5865. [Google Scholar] [CrossRef]
- Egan, S.; Harder, T.; Burke, C.; Steinberg, P.; Kjelleberg, S.; Thomas, T. The seaweed holobiont: Understanding seaweed–bacteria interactions. FEMS Microbiol. Rev. 2013, 37, 462–476. [Google Scholar] [CrossRef]
- Church, M.J. Resource control of bacterial dynamics in the sea. In Microbial Ecology of the Ocean, 2nd ed.; Kirchman, D.L., Ed.; John Wiley and Sons, Inc.: Hoboken, NJ, USA, 2008; pp. 335–382. [Google Scholar]
- Barrón, C.; Duarte, C. Dissolved organic matter release in a Posidonia oceanica meadow. Mar. Ecol. Prog. Ser. 2009, 374, 75–84. [Google Scholar] [CrossRef]
- Holmer, M.; Andersen, F.Ø.; Nielsen, S.L.; Boschker, H.T.S. The importance of mineralization based on sulphate reduction for nutrient regeneration in tropical seagrass sediments. Aquat. Bot. 2001, 71, 1–17. [Google Scholar] [CrossRef]
- Hemminga, M.A.; Duarte, C.M. Seagrass Ecology; Cambridge University Press: Cambridge, UK, 2000. [Google Scholar]
- Boschker, H.T.S.; Wielemaker, A.; Schaub, B.E.M.; Holmer, M. Limited Coupling of Macrophyte Production and Bacterial Carbon Cycling in the Sediments of Zostera spp. Meadows. Mar. Ecol. Prog. Ser. 2000, 203, 181–189. [Google Scholar] [CrossRef]
- Holmer, M.; Duarte, C.M.; Boschker, H.T.S.; Barrón, C. Carbon Cycling and Bacterial Carbon Sources in Pristine and Impacted Mediterranean Seagrass Sediments. Aquat. Microb. Ecol. 2004, 36, 227–237. [Google Scholar] [CrossRef]
- Tarquinio, F.; Hyndes, G.A.; Laverock, B.; Koenders, A.; Säwström, C. The seagrass holobiont: Understanding seagrass-bacteria interactions and their role in seagrass ecosystem functioning. FEMS Microbiol. Lett. 2019, 366, fnz057. [Google Scholar] [CrossRef] [PubMed]
- Koopmans, D.; Holtappels, M.; Chennu, A.; Weber, M.; De Beer, D. High net primary production of Mediterranean seagrass (Posidonia oceanica) meadows determined with aquatic eddy covariance. Front. Mar. Sci. 2020, 7, 118. [Google Scholar] [CrossRef]
- Chou, W.C.; Fan, L.F.; Yang, C.C.; Chen, Y.H.; Hung, C.C.; Huang, W.J.; Shih, Y.Y.; Soong, K.; Tseng, H.C.; Gong, G.C.; et al. A unique diel pattern in carbonate chemistry in the seagrass meadows of dongsha island: The enhancement of metabolic carbonate dissolution in a semienclosed lagoon. Front. Mar. Sci. 2021, 8, 717685. [Google Scholar] [CrossRef]
- Moriarty, D.J.W.; Pollard, P.C. Diel Variation of Bacterial Productivity in Seagrass (Zostera capricorni) BedsMeasured by Rate of Thymidine Incorporation into DNA. Mar. Biol. 1982, 72, 165–173. [Google Scholar] [CrossRef]
- Evans, C.; Archer, S.D.; Jacquet, S.; Wilson, W.H. Direct estimates of the contribution of viral lysis and microzooplankton grazing to the decline of a Micromonas spp. population. Aquat. Microb. Ecol. 2003, 30, 207–219. [Google Scholar] [CrossRef]
- Shiu, R.-F.; Lee, C.-L. Role of microgel formation in scavenging of chromophoric dissolved organic matter and heavy metals in a river-sea system. J. Hazard. Mater. 2017, 328, 12–20. [Google Scholar] [CrossRef]
- Shiu, R.-F.; Vazquez, C.I.; Tsai, Y.-Y.; Torres, G.V.; Chen, C.-S.; Santschi, P.; Quigg, A.; Chin, W.-C. Nano-plastics induce aquatic particulate organic matter (microgels) formation. Sci. Total Environ. 2020, 706, 135681. [Google Scholar] [CrossRef]
- Brussaard, C.P.D. Optimization of procedures for counting viruses by flow cytometry. Appl. Environ. Microbiol. 2004, 70, 1506–1513. [Google Scholar] [CrossRef]
- Hammes, F.; Egli, T. Cytometric methods for measuring bacteria in water: Advantages, pitfalls and applications. Anal. Bioanal. Chem. 2010, 397, 1083–1095. [Google Scholar] [CrossRef]
- Dierssen, H.M.; Zimmerman, R.C.; Drake, L.A.; Burdige, D. Benthic ecology from space: Optics and net primary production in seagrass and benthic algae across the Great Bahama Bank. Mar. Ecol. Prog. Ser. 2010, 411, 1–15. [Google Scholar] [CrossRef]
- Barron, C.; Apostolaki, E.T.; Duarte, C.M. Dissolved organic carbon fluxes by seagrass meadows and macroalgal beds. Front. Mar. Sci. 2014, 1, 42. [Google Scholar] [CrossRef]
- Moriarty, D.J.W.; Roberts, D.G.; Pollard, P.C. Primary and bacterial seagrass communities in the Gulf of Carpentaria, Australia. Mar. Ecol. Prog. Ser. 1990, 61, 145–157. [Google Scholar] [CrossRef]
- Scharek, R.; Latasa, M. Growth, grazing and carbon flux of high and low nucleic acid bacteria differ in surface and deep chlorophyll maximum layers in the NW Mediterranean Sea. Aquat. Microb. Ecol. 2007, 46, 153–161. [Google Scholar] [CrossRef]
- Pearce, I.; Davidson, A.T.; Thomson, P.G.; Wright, S.; van den Enden, R. Marine microbial ecology in the sub-Antarctic Zone: Rates of bacterial and phytoplankton growth and grazing by heterotrophic protists. Deep Sea Res. II 2011, 58, 2248–2259. [Google Scholar] [CrossRef]
- Tsai, A.-Y.; Mukhanov, V. Response of Growth and Grazing Rate of Nanoflagellates on Synechococcus spp. to Experimental Nutrient Enrichment. Water 2021, 13, 2686. [Google Scholar] [CrossRef]
- Landry, M.R. Estimating rate of growth and grazing mortality of phytoplankton by the dilution method. In Handbook of Methods in Aquatic Microbial Ecology; Kemp, P.F., Sherr, B.F., Sherr, E.B., Cole, J.J., Eds.; Routledge: Abingdon, UK, 1993; pp. 114–135. [Google Scholar]
- Ayukai, T. Possible limitation of the dilution technique for estimating growth and grazing mortality rates of picoplanktonic cyanobacteria in oligotrophic tropical waters. J. Exp. Mar. Biol. Ecol. 1996, 198, 101–111. [Google Scholar] [CrossRef]
- Landry, M.R.; Hassett, R.P. Estimating the grazing impact of marine microzooplankton. Mar. Biol. 1982, 67, 283–288. [Google Scholar] [CrossRef]
- Landry, M.R.; Kirshtein, J.; Constantinou, J. A refined dilution technique for measuring the community grazing impact of microzooplankton, with experimental tests in the central Equatorial Pacific. Mar. Ecol. Prog. Ser. 1995, 120, 53–63. [Google Scholar] [CrossRef]
- Fuhrman, J.A. Marine viruses and their biogeochemical and ecological effects. Nature 1999, 399, 541–548. [Google Scholar] [CrossRef]
- Middelboe, M.; Lyck, P.G. Regeneration of dissolved organic matter by viral lysis in marine microbial communities. Aquat. Microb. Ecol. 2002, 27, 187–194. [Google Scholar] [CrossRef]
- Fourqurean, J.W.; Zieman, J.C.; Powell, G.V. Phosphorus limitation of primary production in Florida Bay: Evidence from C:N:P ratios of the dominant seagrass Thalassia testudinum. Limnol. Oceanogr. 1992, 37, 162–171. [Google Scholar] [CrossRef]
- Welsh, D. Nitrogen fixation in seagrass meadows: Regulation, plant-bacteria interactions and significance to primary productivity. Ecol. Lett. 2000, 3, 58–71. [Google Scholar] [CrossRef]
- Cole, L.W.; McGlathery, K.J. Nitrogen fixation in restored eelgrass meadows. Mar. Ecol. Prog. Ser. 2012, 448, 235–246. [Google Scholar] [CrossRef]
- Weinbauer, M.G.; Höfle, M.G. Significance of viral lysis and flagellate grazing as factors controlling bacterioplankton pro duction in a eutrophic lake. Appl. Environ. Microbiol. 1998, 64, 431–438. [Google Scholar] [CrossRef] [PubMed]

Disclaimer/Publisher’s Note: The statements, opinions and data contained in all publications are solely those of the individual author(s) and contributor(s) and not of MDPI and/or the editor(s). MDPI and/or the editor(s) disclaim responsibility for any injury to people or property resulting from any ideas, methods, instructions or products referred to in the content. |
© 2023 by the authors. Licensee MDPI, Basel, Switzerland. This article is an open access article distributed under the terms and conditions of the Creative Commons Attribution (CC BY) license (https://creativecommons.org/licenses/by/4.0/).