Article

Spatial Distribution and Genetic Diversity of Turbot (Scophthalmus maximus, Linnaeus, 1758) in Bulgarian Black Sea Waters Relative to Fishing Pressure and Their Abiotic Environment

Institute of Oceanology, Bulgarian Academy of Sciences, 40 Parvi May St., 9000 Varna, Bulgaria
*
Author to whom correspondence should be addressed.
J. Mar. Sci. Eng. 2023, 11(10), 1982; https://doi.org/10.3390/jmse11101982
Submission received: 13 September 2023 / Revised: 10 October 2023 / Accepted: 12 October 2023 / Published: 13 October 2023
(This article belongs to the Section Marine Biology)

Abstract

:
The present study examined the genetic diversity and spatial distribution of turbot (Scophthalmus maximus), an economically important species on the Bulgarian Black Sea coast. Maximum entropy (MaxEnt) modeling software Version 3.4.4. was utilized to develop a habitat suitability model for S. maximus in the Bulgarian Black Sea region. Data collected via demersal and pelagic surveys and genetic sampling from 2017 to 2021 were utilized to link species occurrence localities with selected abiotic factors. Our findings showed that the species’ habitat preferences are strongly influenced by temperature and dissolved oxygen, and projections based on simplified climatic scenarios indicated potential distribution shifts and a substantial reduction in reproduction habitats in the northern region. The assessment of genetic diversity was based on mtDNA COIII sequencing; MtDNA revealed a low level of polymorphism in all analyzed populations. The extensive fishing pressure may have increased the likelihood of genetic and population bottlenecks and a consequent decline in genetic diversity in the Shabla, Nesebar, and Tsarevo populations. The Tajima’s D values for the latter indicated that turbot underwent a bottleneck followed by rapid population expansion. Our findings are essential for the conservation and effective management of S. maximus stocks in the region.

1. Introduction

In the marine environment, the greatest genetic threats appear to be the extinction of genetically unique subpopulations and the loss of genetic diversity through declines in abundance due to overfishing and climate change [1]. The human overexploitation of natural resources has elevated conservation and management to one of modern society’s most pressing concerns, particularly in the case of highly sensitive marine ecosystems [2]. Fishing is one of the most significant causes of decline in populations of ocean species [3]. In addition to depleting populations [4], overfishing can erode the age and size structure as well as the spatial distribution of stocks, making them more vulnerable to environmental fluctuations. The distribution of fish in the maritime environment follows distinct patterns. Fish are more prevalent in areas with sufficient resources to support higher densities. In general, the geographic dispersal of fish increases in proportion to abundance or as a density-dependent selection response, in which fish preferentially occupy a chosen location until maximum density is reached, at which point, they disperse into more peripheral regions [5]. Fishing typically focusses on high-density core areas in order to maximize catch while minimizing effort. Hence, identifying core density areas and understanding the link between fish and their immediate environment are essential for an ecosystem-based approach to fisheries management [6].
Additionally, a growing number of studies in recent years indicate that substantial size-selective fishing can trigger evolutionary changes in the life-history traits of the harvested population, which can have negative implications for populations, ecosystems, and fisheries. Overfishing has the potential to generate three types of genetic change: changes in population structure and connectivity, selection-induced genetic changes, and genetic diversity loss [7]. Despite the fact that data on stock abundance and age composition for economically important species have been collected for decades [8,9], fisheries statistics are based on short-term responses to exploitation. Genetic analysis, on the other hand, can provide information about long-term processes related to a species’ adaptive capacity to respond to changes in environmental conditions.
By displaying the genetic level, patterns of dispersal (connectivity), and demographics (past and present), population genetic methods enable scientists to comprehend species’ responses to ecological changes and anthropogenic stressors. Human activities have the potential to reduce the genetic diversity of a population in a very short period of time [10]. The overexploitation of a wide variety of marine fish species has been linked to a decline in genetic diversity [11].
For economically important species, however, which are facing substantial fishery pressures throughout their entire distribution range, genetic diversity is likely declining globally [7]. For many years, mitochondrial genetic markers have been used in phylogenetic and population genetics research. The loss of genetic diversity in mitochondrial genomes as a result of population declines can provide insights into the conservation status of fish species populations [7].
Fisheries management and conservation priorities, including fishing regulations, vary greatly around the world [8,9,12], as does the impact of fishing pressures, necessitating local studies of fish populations [7]. Furthermore, the comprehension and effective conservation and management of ecosystems necessitate a solid understanding of population dynamics within a spatial and temporal context. In line with the latter, typically, dispersal and recruitment success are determined in the early development stages for many marine species. The final dispersal pattern, larval survival, and overall success of populations are influenced by a range of environmental conditions along with biological aspects such as ecophysiology, behavior, and reproductive strategy [13].
In a broader context, the application of genomic methods has the potential to enhance stock assessments through the facilitation, improvement, and estimation of crucial parameters. Additionally, these approaches offer valuable insights into stock structure, genetic diversity within populations, and connectivity, all of which are recognized as significant factors in the fields of conservation and resource management [14].
Turbot (Scophthalmus maximus, Linnaeus, 1758), as a transboundary stock, has played an important role in the fisheries of all Black Sea countries for decades, and is regarded as one of the most important key species in the Black Sea ecosystem. As with most benthic fishes, turbot display shifting reliance on coastal regions to complete their life-cycles, thereby exhibiting varying degrees of connectivity and environmental selection [15,16]. Turbot is a top predator species, mainly feeding on fish, crustaceans, polychaetes, and mollusks. The distribution and migration of turbot across the continental shelf is evidently seasonal. The spring migration towards the coastal area typically starts in March. Spawning occurs in April to the middle of June with a peak in the first half of May, at depths ranging from 15 to 50 m. During the summer, turbot inhabit depths over 50 m and are spread out across a larger area. Migration towards the coastal feeding areas occurs in the autumn. In addition to the seasonal migrations offshore and towards the coast, adult turbot exhibit a tendency to move northwards. During all seasons, juvenile turbot are typically restricted to coastal areas. Considering the latter, it is evident that throughout its entire biological cycle, the turbot utilizes a variety of habitat types, including reproduction habitats (coastal waters, down to 15 m depth), growing habitats (near the seafloor, down to 50–60 m depth), and wintering habitats (near the seafloor, down to 60–80 m depth). To these depths, the turbot populates nearly all habitat types, but prefers sandy and muddy environments [17,18], and consequently, the environmental heterogeneity throughout the extensive distribution range of turbot allows for a variety of spatial differentiation and adaptation [15,16,19]. Accordingly, it is anticipated that turbot populations will microevolve under dispersal limitation using models of isolation by distance and local adaptation [20].
Since 2007, Bulgaria has implemented the Total Allowable Catch (TAC) regime for turbot in an effort to prevent overfishing, and to maintain and restore the effective population size of the species inhabiting the Bulgarian waters of the Black Sea in order to provide high long-term yields that are consistent with the Maximum Sustainable Yield (MSY). Despite all conservation and technical measures adopted at the regional level to prevent overfishing and ensure sustainable exploitation, 75 percent of the assessed Black Sea stocks, including turbot, are reported to be fished at levels that are biologically unsustainable [8].
Although turbot has been the subject of extensive research, there is still a lack of understanding regarding its population structure throughout its entire distribution range. Current knowledge on wild populations is primarily limited to the Atlantic and Baltic regions. Furthermore, investigations into the genomic characteristics linked to environmental factors have only been conducted in a few populations [21,22] and with a limited number of markers [16,23]. Novel findings about the adaptation of turbot have been documented [24], particularly in the Black Sea, highlighting the occurrence of parallel evolution in regions characterized by comparable environmental conditions, specifically temperature. Generally, the natural distribution of turbot exhibits the concurrent influence of robust neutral evolutionary factors and adaptive selection in geographically distinct populations [24]. Accordingly, a more advanced conceptualization of management units can be developed by considering demographic variables and the adaptive capacity of turbot to respond to environmental changes throughout its whole distribution range.
There are few case studies addressing turbot stock assessments [25] along the Bulgarian Black Sea coast, and data on the species’ spatiotemporal distribution and habitat suitability are limited. For a small number of populations, genetic diversity throughout the Bulgarian Black Sea coast was assessed using mitochondrial markers [26,27]. However, no studies have been conducted to analyze the temporal decline in genetic diversity and the loss of genetic variation associated with harvesting in the past due to a lack of genetical monitoring.
In line with the latter, the primary objectives of our research were to provide an accurate and objective understanding of the spatial distribution and core density areas, the genetic diversity and variability of turbot populations along the Bulgarian Black Sea coast, as well as the environmental factors that govern the species’ geographic dispersal. Providing new insights on turbot populations’ genetic structure and spatial dispersal involving environmental, ecological, and genetic mechanisms can greatly support and adjust existing management strategies towards sustainable exploitation and conservation.

2. Materials and Methods
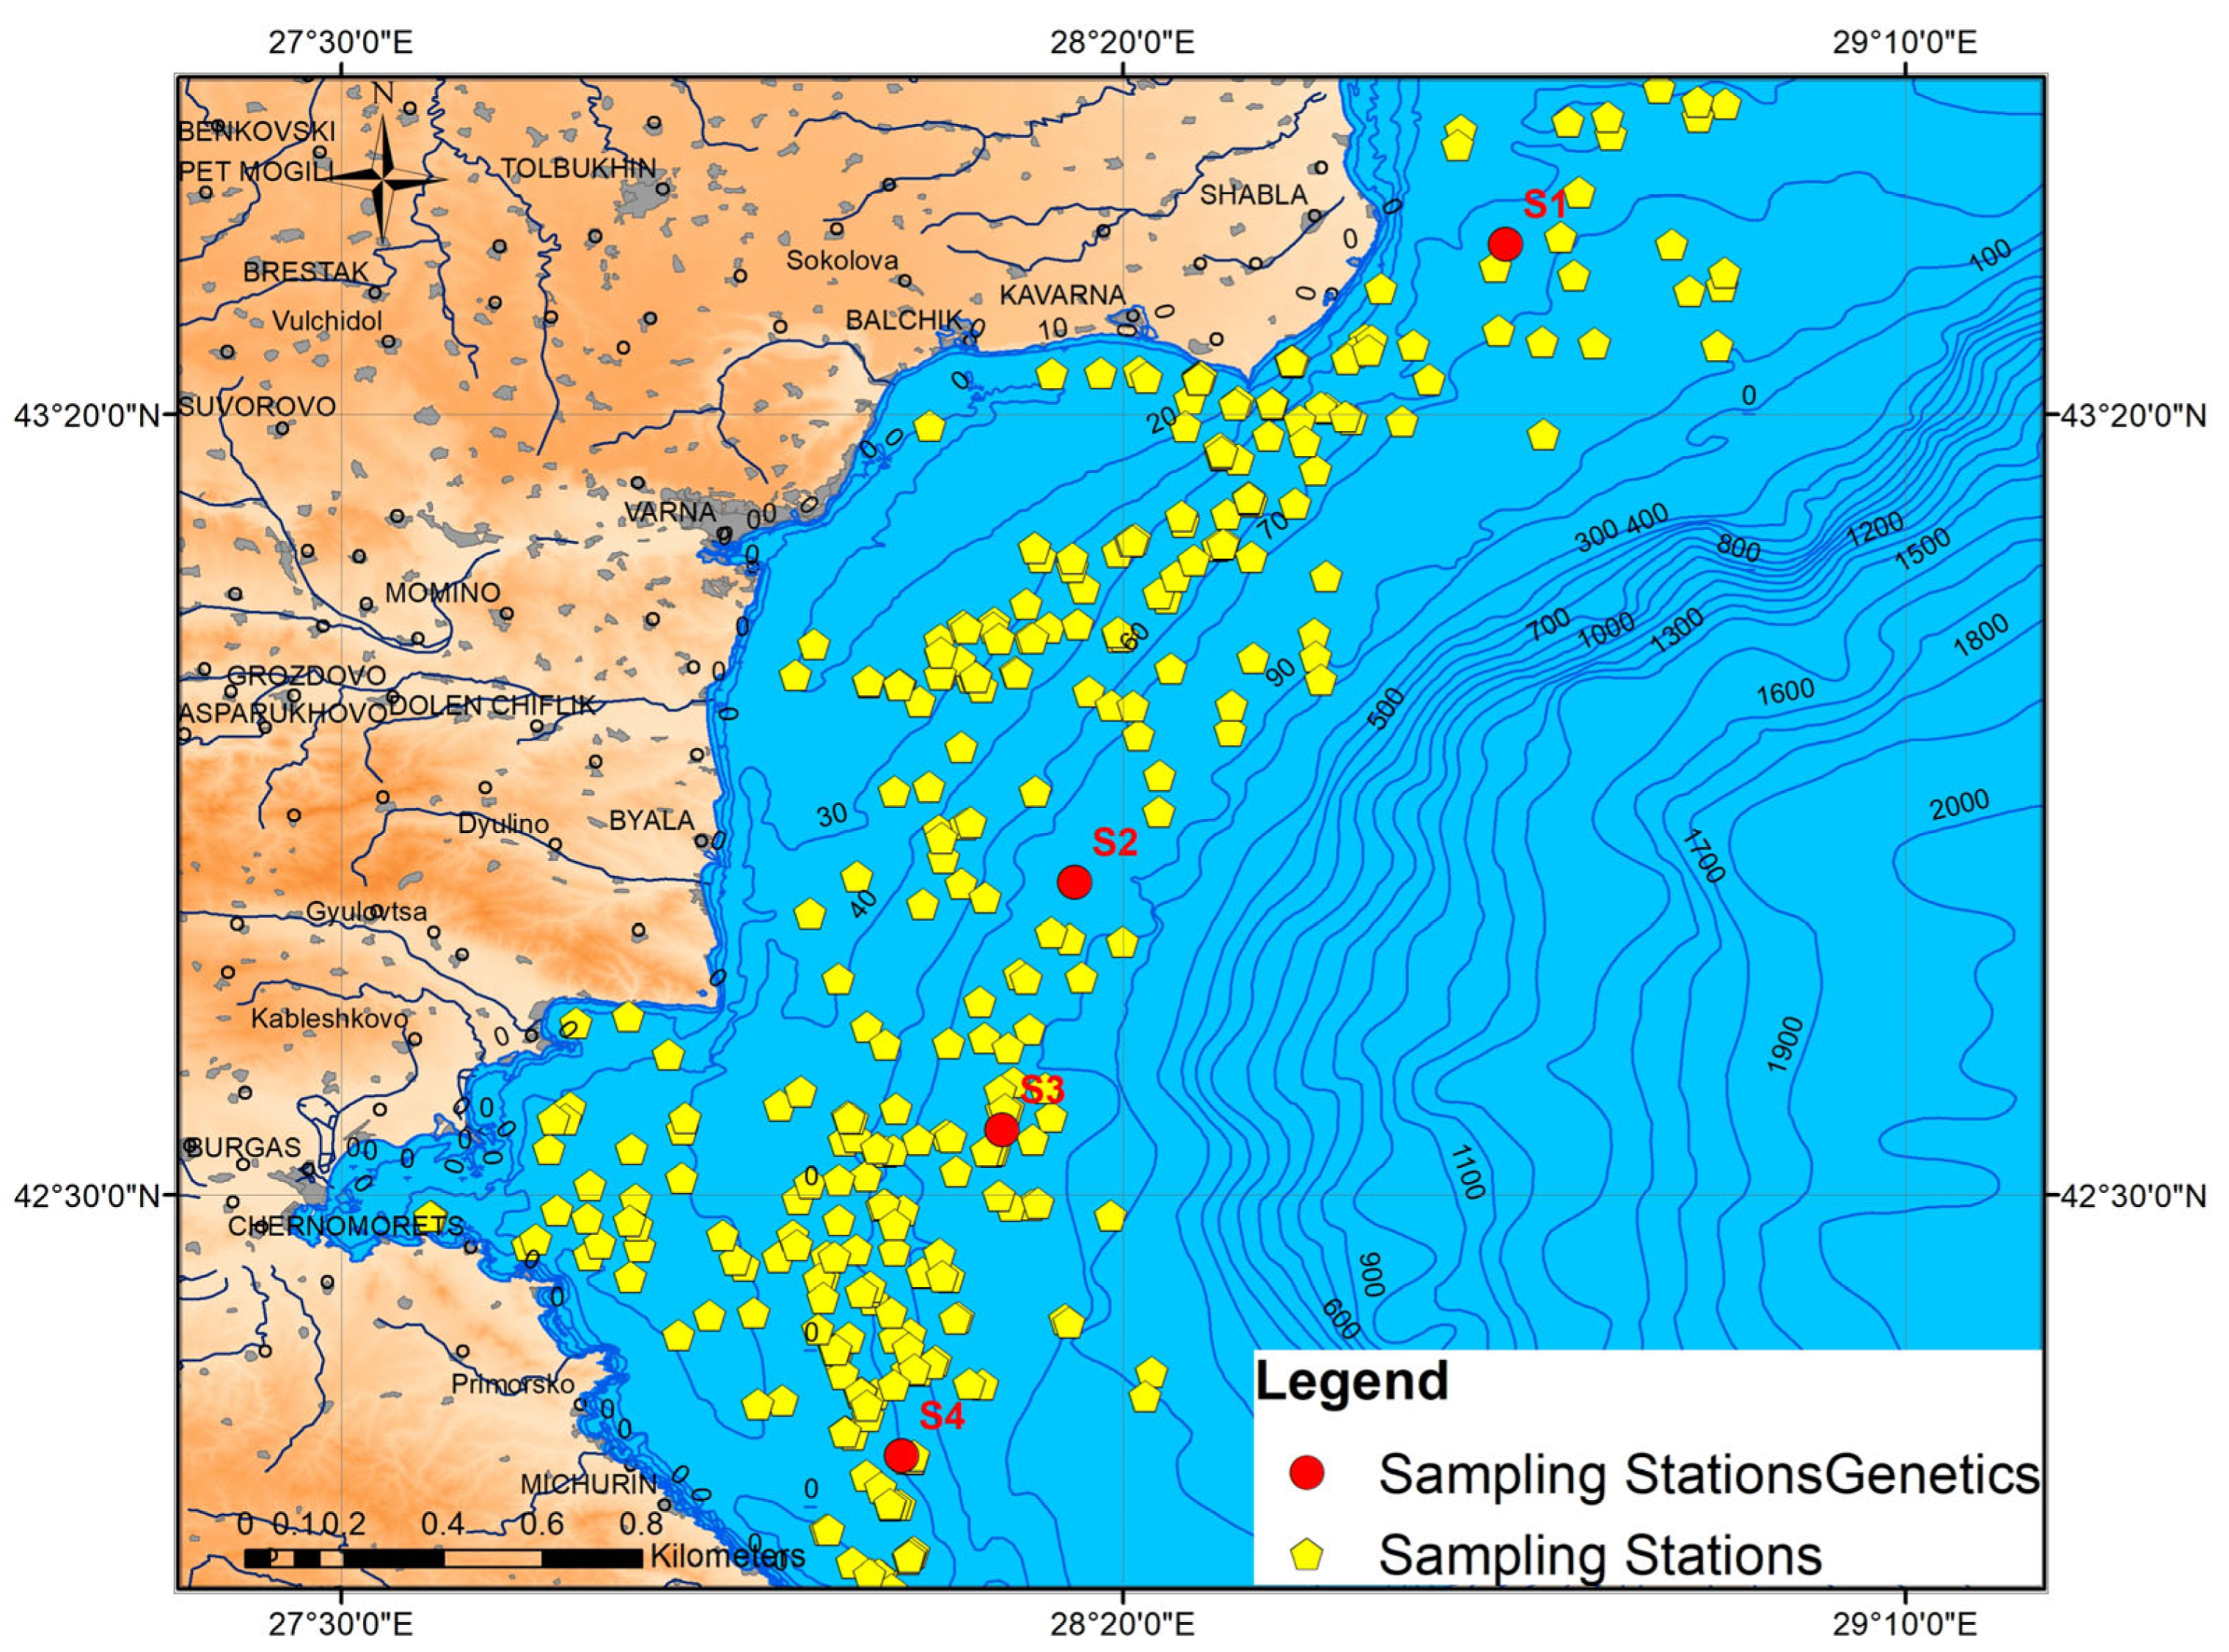
2.1. Study Area

The study area covered the Bulgarian Black Sea exclusive economic zone (EEZ) (Figure 1). Since the sampling data utilized in the spatial distribution modeling were only available for the Bulgarian coastal and shelf waters, the relative spatial extent was limited to the area where sufficiently large number of observations of S. maximus were available.

2.2. Spatial Distribution Modeling

2.2.1. Spatial Modeling Software

Over the past two decades, significant advancements have occurred in the domain of species distribution modeling, resulting in the availability of numerous methodologies. One significant disparity between modeling approaches lies in the type of species data they utilize, the complexity of the algorithms, the underlying assumptions, and the simplicity of use and model interpretation [28,29]. Regression methods such as generalized linear or additive models (GLMs or GAMs) and ensembles of regression trees are routinely utilized when species presence/absence and/or abundance have been systematically collected, typically via formal biological surveys [29,30].
In practice, however, the documenting of recurring observations of absence data can be challenging [31], and numerous spatial distribution modeling techniques, including regression models, various machine learning algorithms such as maximum entropy MaxEnt [32] models, presence and background learning (PBL) [33], and ensemble models, have been devised to address the issue of handling presence-only (PO) data.
The maximum entropy (MaxEnt) modeling package software Version 3.4.4 [32] was chosen to fit a correlative model for the studied species. The latter option was deemed appropriate for our case study due to several reasons. Generally, the predictive performance of Maxent has continuously been proven to be comparable to the most effective techniques [29], and it has been successfully employed to model the biogeographic distributions of species in various regions of the world [34,35,36,37,38,39,40,41,42,43,44,45].
Another advantage of MaxEnt is that its functionality performs variable transformation, maximum entropy model fitting, and lasso regularization to avoid model overfitting [29,32,46,47,48]. Moreover, the resulting output of the model is relatively straightforward to interpret. Another rationale for using a modeling technique based on PO (presence-only) data was the inclusion of auxiliary data, such as genetic samples and pelagic survey locations, where abundance data were unavailable.
MaxEnt model input data consist of a list of species’ PO locations and a set of environmental predictors across a user-defined, grid-cell-divided spatial extent with an option for the manipulation of background/pseudoabsence data. MaxEnt extracts a sample of background locations, compares them to the presence locations, and generates an estimate of the probability of the presence of a species (or relative environmental suitability) ranging from 0 (least likely) to 1 (most likely) [32,48].

2.2.2. Species Presence Data

Data on species PO localities were compiled from demersal surveys records [49,50,51,52,53,54,55,56,57,58] aimed at the stock assessment of turbot, pelagic surveys where the accidental bycatch of turbot occurred, and genetics sampling. Survey expeditions were conducted in the period of 2017–2021 (Table 1).
Both surveys’ sampling designs, as well as genetic sampling, encompassed the Bulgarian Black Sea’s coastal (0–30 m) and shelf waters (30–200 m), providing an accurate representation of S. maximus presence records within the area of interest. As a result, the species dataset was constructed by taking into consideration the PO localities (384 records in all).

2.2.3. Selection of Abiotic Variables

The abiotic variables chosen as predictors were based on previously documented impact extent and ecological concepts linked to species preferences form a particular habitat, as well as those influencing the biomass and recruitment variability of flatfishes [59,60,61,62,63,64,65,66,67,68,69]. Accordingly, the water temperature, salinity, dissolved oxygen, and current speed were selected as the most relevant.
The Copernicus Marine Environmental Service (CMEMS) data portal (https://marine.copernicus.eu/ accessed on 15 February 2023) was used for obtaining monthly mean environmental data layers for the chosen variables from April to December in the 2017-to-2021 period (corresponding to the sampling expeditions). The latter are generated by numerical simulation models that integrate in situ and satellite data for the Black Sea profile (the hydrodynamic NEMO (Nucleus for European Modelling of the Ocean [70]) and the BAMHBI (Biogeochemical Model for Hypoxic and Benthic Influenced Areas [71,72,73])). The data were compiled using two products: the Black Sea Physics Reanalysis [74] for the period of April to December 2017 to 2020, with a spatial resolution of 0.037° × 0.028°, and the Black Sea Physics Analysis and Forecast [75] for the period of April to December 2021, with a spatial resolution of 0.025° × 0.025°.
The datasets were initially resampled to a finer resolution (0.025° × 0.025°), and then, averaged in the water column and throughout the period of the study in MATLAB [76] over the entire Black Sea region. The resulting data were then imported into ArcGIS 10.2, where they were further reduced to match the spatial extent of the study area and extracted in ESRI (Environmental Systems Research Institute) ASCII grid format to be utilized in MaxEnt software to fit the model.

2.2.4. Model Evaluation and Validation

The species distribution model (SDM) was cross-validated with ten replicate model runs (using 10-fold cross-validation) for an adequate evaluation of its predictive performance, and 25% of PO data were set aside to be utilized as a randomly selected test sample for every model run.
The performance of the resulting SDM was assessed using the area under the curve (AUC) of a receiver operating characteristic (ROC) [77], which represents an overall measure of the model’s performance across all thresholds and strengths of prediction, and is thus considered threshold-independent [78], the maximized Cohen’s kappa [79], and true skill statistics (TSS) was introduced as a prevalence-independent alternative to Cohen’s kappa to assess model reliability (the agreement between predictions and known occurrences, across various binary thresholds) [78].
Additionally, the mean relative probabilities of species occurrence (in terms of suitability) were cross-validated with the species’ field-measured catch per unit effort (CPUE) to further support the models’ applicability.

2.3. Mitochondrial DNA Analysis

2.3.1. Sample Collection and DNA Extraction

Tissue samples were obtained from 133 samples collected by a local fishing vessel in the Black Sea near Shabla, Shkorpilovtsi, Nesebar, and Tsarevo during the period of 2019 to 2021 (Figure 1, Table 2).
Prior to the subsequent analyses, dorsal fin tissue samples were stored in 96% ethanol at 4 °C for DNA analysis. DNA was extracted using the DNeasy Blood & Tissue Kit (QIAGEN). Prior to PCR amplification, all DNA extracts were analyzed via gel electrophoresis to determine the DNA’s quality.

2.3.2. PCR and Sequence Analysis of Mitochondrial DNA (COIII)

Using mitochondrial primers (COIII), polymerase chain reaction (PCR) was performed in a reaction volume of 50 μL containing 2 μL of each primer, 25 μL of Mastermix (MyTaqTM HS Mix), and 2 μL of the target DNA. The mitochondrial cytochrome c oxidase subunit III (COIII) was amplified using universal primers (F: AGCCCATGACCTTTAACAGG and R: GACTACATCAACAAAATGTCAGTATCA) [80]. PCR amplification required the following conditions: 94 °C for 5 min, 95 °C for 30 s, 49 °C for 1 min, 72 °C for 1 min (35 cycles), and 72 °C for 5 min. The DNA sequencing was conducted by Macrogen Europe B.V. The sequences were deposited in GenBank under accession numbers MN556886-MN556913, MW446249-MW446288, OL456316-OL456393, and OR635172-OR635198.

2.3.3. Statistical Analyses

The mtDNA sequence data were analyzed using MEGAX software (https://www.megasoftware.net/downloads/dload_win_gui, accessed on 15 February 2023) [81]. DNA sequence polymorphisms comprising the largest number of haplotypes (h), number of segregating sites (S), haplotype diversity (Hd), nucleotide diversity (π), and neutrality test (Tajima’s D and Fu’s Fs) values for each population were estimated using DNASP 6.12.03 [82]. Haplotype networks were visualized via PopART network analysis software (https://github.com/jessicawleigh/popart, accessed on 15 February 2023) [83] using the TCS network inference method [84].

3. Results

3.1. Species Distribution Modeling

3.1.1. SDM of S. maximus and Variables’ Contribution to Species Spatial Dispersal

The MaxEnt grid output (maps) employ a gradient color scale to reflect the relative mean predictive probability (within the range 0–1) of the most favorable habitat for the species under consideration [32]. The resulting model (Figure 2) clearly displayed a broad area where environmental conditions were deemed suitable, particularly within the 30–80 m depth range (clearly demonstrating the reproduction, growing, and wintering habitats due to the seasonal resolution of sampling), broadening across the entire region in front of the of the Bulgarian Black Sea coast.
For the entire Black Sea region, a strong negative spatial correlation between temperature and salinity values (averaged in the water column and over the period of the case study) was detected (r = −0.861, p~0); however, given that Maxent is robust to predictor collinearity when training the model and accounts for redundant variables [85], the exclusion of highly correlated variables has little to no effect on model improvement. Therefore, the original selection of predictor variables was retained. Furthermore, data collinearity is likely to have an effect when the model is applied to new environmental conditions if the variables’ correlation and collinearity shift are not accounted for [85].
In the context of variables’ importance to the MaxEnt model, temperature showed the highest gain when used isolated, and therefore appears to have the most important information on its own (Table 3). Dissolved oxygen was the environmental variable that reduced the gain the most when it was omitted, and hence, seemed to contain the most information that was not present in the other variables. Salinity and current speed had little to no effect on fitting the training and test data models.
The importance of temperature, identified as a major factor that governs turbot spatial dispersal, is of superior concern when accounting for the effects of climate change; hence, two distinct scenarios were examined to perceive whether rises of 0.5 °C and 1 °C in the annual mean temperatures could potentially lead to distribution shifts (Figure 3).
The projected results demonstrated a significant decrease in the relative probability of species occurrence in the coastal areas in front of Varna Bay and to the north, as well as a potential core area shift to deeper waters—a very concerning finding given that the Black Sea has hypoxic/anoxic conditions that prevent fish stock distribution beyond a 100 m depth.

3.1.2. Evaluation of SDMs Performance

The test omission rates and predicted areas as a function of the cumulative threshold for all replicate runs (including the averaged) were close to the predicted omission, according to the definition that a model that distinguishes well between presences and absences would have low omission (high sensitivity) and low commission (high specificity) [84]. The model performance metrics for the 10 replicate runs were calculated to be: AUC = 0.906 ± 0.016; maximized Cohen’s kappa = 0.915 ± 0.006; and TSS = 0.687 ± 0.088. In general, AUC values greater than 0.9 are very good [85,86], kappa > 0.75 is considered excellent, and TSS > 0.5 indicates good agreement between predictions and known occurrences [79].

3.1.3. Model Validation with the Field-Measured Catch per Unit Effort (CPUE)

The MaxEnt predicted habitat suitability map was overlaid with the field-measured CPUE for all PO localities used in fitting the training data model to validate the expected association of the highest probabilities of occurrence of the studied species with areas where the species’ density and performance were evidently high (Figure 4).
A good spatial overlap between the two grids—CPUE and the average relative predicted probabilities—was detected; nevertheless, the most abundant catches observed during the surveys were recorded in the southern region.

3.2. Mitochondrial DNA Analysis

Sequences from 133 individuals were obtained, and a total of 25 haplotypes for COIII (563 bp) were identified among the populations.
The number of haplotypes ranged from six in Shkorpilovtsi to twelve in the Nesebar population (Table 4). The level of genetic diversity was determined for S. maximus from each sampling location. The haplotype diversity (Hd) and nucleotide diversity (π) indices ranged from 0.363 ± 0.098 to 0.783 ± 0.057 and from 0.00128 ± 0.00044 to 0.00233 ± 0.00037, respectively. Overall, most locations exhibited moderate to high haplotype diversity (0.363–0.783) due to a large number of unique haplotypes. The mean haplotype diversity (Hd = 0.577) of turbot along the Black Sea coast was close to that reported by [26] for the same species (Hd = 0.550), and higher than that (0.380) published by [27]; however, the nucleotide diversity was relatively low, ranging from 0.00128 to 0.00233.
Due to its central position, the haplotype network analyses identified the haplotype Hap_1 as a potential maternal ancestral haplotype for the studied populations (Figure 5). Overall, five shared haplotypes were identified (Hap_1, Hap_4, Hap_7, Hap_9, and Hap_16) and 20 unique haplotypes (Shabla—5, Nesebar—7, Tsarevo—6, and Shkorpilovtsi—2) were found to derive from the above-mentioned haplotypes.
Both Tajima’s D and Fu’s Fs tests showed negative values for all populations (Table 4). Tajima’s D values were statistically significant for three of the studied populations (Shabla, Nesebar, and Tsarevo). These results suggest that the lineages may have undergone a process of population expansion after a bottleneck event, which is evidenced by the high number of unique haplotypes.

4. Discussion

The key findings of our study may have been shaped by background events that have been unfolding over the last two decades. The unexpectedly low nucleotide diversity (π ≤ 0.002) observed across all studied populations may be attributable to the commercial overexploitation of wild stocks [87]. The latter hypothesis was further strengthened by possible local depletion of the species under study identified in the northern region during the validation of the S. maximus spatial distribution model with the field-measured CPUEs recorded during the survey expeditions over the last five years.
The low haplotype and nucleotide diversity of the Tsarevo population (0.363 and 0.00139, respectively) was most likely the result of a founder event or population bottleneck [88]. Such low nucleotide diversity of the COI mitochondrial gene has been discovered in heavily exploited fish stocks (Lophius budegassa, Merluccius merluccius, Mullus barbatus, and Mullus surmuletus) from the Balearic Islands [7], and is typically leading to population bottleneck and a subsequent genetic reduction in the total gene pool [3].
The negative and statistically significant Tajima’s D values that were observed in three of the studied populations (Shabla, Nesebar, and Tsarevo) most likely indicate that several haplotypes in these populations were eliminated, resulting in a bottleneck effect [89]. The latter has been reported to typically occur as a result of natural or human activities. Accordingly, overfishing can deplete a population by removing a large number of individuals, resulting in a population bottleneck, which may cause a loss of genetic diversity and lead to population decline. Consequently, the low level of nucleotide diversity observed in turbot populations along the Bulgarian Black Sea coast is likely due to population declines caused by highly selective and cost-effective fishing pressures, which target reproduction and growing habitats (30 to 50–60 m depths). The decline in genetic diversity is generally associated with the long-term adaptation and survival of a population and can further restrict the capacity of individuals to adapt to novel environmental conditions [90].
In line with the latter, species spatial distribution model validation with the field-measured CPUE revealed persistently low catches (with regard to stock density) in northern coastal and shelf areas (up to 50–60 m depths) over the past five years, which could be attributed to overfishing and the applied physical disturbance in coastal benthic habitats while targeting other commercially important benthic species such as Rapana venosa and Mullus barbatus. Consequently, the locations with the lowest captures may indicate the partial effects of local depletion and habitat fragmentation, which are more evident in turbot growing habitat depths in the northern region, and the effective population size is likely to decrease as a direct result.
In addition to excessive fishing pressure and other stressors of anthropogenic and natural origin, the variables contributing most to the spatial distribution of the studied species are the temperature and dissolved oxygen, which raises serious concerns regarding how the species’ stock’s spatial integrity and dispersal would change as a result of global climate change. Both climatic scenarios (annual mean temperature rises of 0.5 °C and 1 °C) were intended to highlight prospective future habitat shifts of temperature-sensitive species, although species’ tolerance to temperature rises and their overall influence on the abiotic environment, including species’ biotic interactions, must still be addressed to yield more accurate outcomes in terms of species’ responses to global warming.
Applying distribution modeling to marine benthic species to predict shifts in distribution patterns in response to climate change is rather challenging. Our simplified climatic scenario projections demonstrate a significant shift in the core areas and species’ geographic dispersal, and furthermore, anoxic layers represent a natural barrier to spatial dispersion due to the Black Sea’s specific vertical structure [91,92].
In addition to the annual mean abiotic variables that may be linked to the relative abundance and distribution of fish stocks, it is important to take into account other factors, such as biotic interactions (e.g., interactions with prey, predators, and competitor species) and time-lagged abiotic conditions on a finer temporal scale [93]. In certain practical scenarios, it has been observed that ecological variables with time-lag effects, such as sea surface temperature and salinity, and proxies to biotic interactions (e.g., chlorophyll-a for planktivorous fishes), could facilitate a more accurate representation of fish spatial dispersal and productivity areas in response to environment alterations. The latter could potentially explain the spatio-temporal variability in the relative abundance and distribution of fish species more clearly; nevertheless, it also requires more frequent assessments and data collection for the species under consideration.
Processes such as species interactions, habitat change, and dispersal range and barriers usually remain unaccounted for in prognostic spatial distribution modeling as a response to climate change. Furthermore, changes in biotic interactions can significantly affect species distributions [94,95], which might be further altered by invasions of non-native species favored by climate change, resulting in novel combinations of species [96].
Furthermore, the examination of the physiological mechanisms underlying individual responses can facilitate the integration of various factors such as rising temperature, acidification, and hypoxia. This integration allows for a comprehensive assessment of the cumulative impact on organisms and the energetic costs associated with individual acclimation. Consequently, the inclusion of mechanistic models in predictive analyses may yield more accurate forecasts regarding species’ spatial distribution in response to climate change and their ability to adapt to novel environmental conditions.

5. Conclusions

In conclusion, considering our research results, conducting mechanistic research to study species population dynamics and underlying development processes, including biotic interactions, is of fundamental importance, given the species preferences of habitat. Studying the sensitivity of S. maximus to temperature and oxygen availability can support the study of their response to climate change and provide more unbiased knowledge on the expected patterns in their spatial dispersal. Furthermore, given the findings of the effects of fishing pressure on S. maximus genetic diversity and stock spatial integrity, stock management strategies must focus on the development of an integrated ecosystem-based management approach to benthic fisheries, considering the impact of other benthic-species fisheries on turbot stock spatial dispersal, population dynamics, and species habitat integrity.

Author Contributions

Conceptualization, P.I., N.D. and I.Z.; methodology, I.Z., P.I. and N.D.; software, I.P. and I.Z.; validation, P.I., N.D., I.Z. and V.D.; formal analysis, P.I., N.D. and I.Z.; investigation, P.I., N.D. and I.Z.; resources, V.R., Y.R. and D.D.; data curation, I.Z., I.P., V.S. and V.D.; writing—I.Z., P.I. and N.D.; writing—review and editing, I.Z., P.I. and N.D.; visualization, I.Z., P.I, N.D., I.P., V.S. and V.D. All authors have read and agreed to the published version of the manuscript.

Funding

This work was carried out in the framework of the National Science Program “Environmental Protection and Reduction of Risks of Adverse Events and Natural Disasters”, approved by the Resolution of the Council of Ministers (№ 577/17.08.2018) and supported by the Ministry of Education and Science (MES) of Bulgaria (Agreement No Д01-271/09.12.2022) and MASRI (project of the National roadmap for scientific Infrastructure (2020–2027) of Republic of Bulgaria).

Informed Consent Statement

Not applicable.

Data Availability Statement

Not applicable.

Conflicts of Interest

The authors declare no conflict of interest. The funders had no role in the design of the study; in the collection, analyses, or interpretation of the data; in the writing of the manuscript; or in the decision to publish the results.

References

  1. Grant, W.S. Status and trends in genetic resources of capture fisheries. In Proceedings of the Workshop on Status and Trends in Aquatic Genetic Resources: A Basis for International Policy, Victoria, BC, Canada, 8–10 May 2006. [Google Scholar]
  2. Neves, J.M.; Nolen, Z.J.; Fabré, N.N.; Mott, T.; Pereira, R.J. Genomic methods reveal independent demographic histories despite strong morphological conservatism in fish species. Heredity 2021, 127, 323–333. [Google Scholar] [CrossRef] [PubMed]
  3. Mohd Yusoff, N.I.S.; Mat Jaafar, T.N.A.; Vilasri, V.; Mohd Nor, S.A.; Seah, Y.G.; Habib, A.; Wong, L.L.; Danish-Daniel, M.; Sung, Y.Y.; Mazlan, A.G.; et al. Genetic diversity, population structure and historical demography of the two-spined yellowtail stargazer (Uranoscopus cognatus). Sci. Rep. 2021, 11, 13357. [Google Scholar] [CrossRef]
  4. Scientific, Technical and Economic Committee for Fisheries (STECF). The 2017 Annual Economic Report on the EU Fishing Fleet (STECF-17-12); PUBSY No. JRC107883; Publications Office of the European Union: Luxembourg, 2017; ISBN 978-92-79-73426-7. [Google Scholar] [CrossRef]
  5. Carson, S.; Shackell, N.; Mills Flemming, J. Local overfishing may be avoided by examining parameters of a spatio-temporal model. PLoS ONE 2017, 12, e0184427. [Google Scholar] [CrossRef] [PubMed]
  6. Parra, H.E.; Pham, C.K.; Menezes, G.M.; Rosa, A.; Tempera, F.; Morato, T. Predictive modeling of deep-sea fish distribution in the Azores. Deep Sea Res. Part II Top. Stud. Oceanogr. 2017, 145, 49–60. [Google Scholar] [CrossRef]
  7. Petit-Marty, N.; Liu, M.; Tan, I.Z.; Chung, A.; Terrasa, B.; Guijarro, B.; Ordines, F.; Ramírez-Amaro, S.; Massutí, E.; Schunter, C. Declining population sizes and loss of genetic diversity in commercial fishes: A simple method for a first diagnostic. Front. Mar. Sci. 2022, 9, 872537. [Google Scholar] [CrossRef]
  8. FAO. The State of Mediterranean and Black Sea Fisheries 2020; General Fisheries Commission for the Mediterranean: Rome, Italy, 2020. [Google Scholar] [CrossRef]
  9. Ovando, D.; Hilborn, R.; Monnahan, C.; Rudd, M.; Sharma, R.; Thorson, J.T.; Rousseau, Y.; Ye, Y. Improving estimates of the state of global fisheries depends on better data. Fish Fish. 2021, 22, 1377–1391. [Google Scholar] [CrossRef]
  10. Kenchington, E.L. The effects of fishing on species and genetic diversity. In Responsible Fisheries in the Marine Ecosystem; Sinclair, M., Valdimarsson, G., Eds.; CABI Publishing: Oxfordshire, UK, 2003; pp. 235–253. [Google Scholar] [CrossRef]
  11. Pinsky, M.L.; Palumbi, S.R. Meta-analysis reveals lower genetic diversity in overfished populations. Mol. Ecol. 2014, 23, 29–39. [Google Scholar] [CrossRef]
  12. Bryndum-Buchholz, A.; Tittensor, D.P.; Lotze, H.K. The status of climate change adaptation in fisheries management: Policy, legislation and implementation. Fish Fish. 2021, 22, 1248–1273. [Google Scholar] [CrossRef]
  13. Barbut, L.; Groot Crego, C.; Delerue-Ricard, S.; Vandamme, S.; Volckaert, F.A.; Lacroix, G. How larval traits of six flatfish species impact connectivity. Limnol. Oceanogr. 2019, 64, 1150–1171. [Google Scholar] [CrossRef]
  14. Rodriguez-Mendoza, R.; Saborido-Rey, F. The potential use of genomic methods in bottom trawl surveys to improve stock assessments in Europe. Front. Mar. Sci. 2023, 10, 1095171. [Google Scholar] [CrossRef]
  15. Hemmer-Hansen, J.; Nielsen, E.; Frydenberg, J.; Loeschcke, V. Adaptive divergence in a high gene flow environment: Hsc70 variation in the European flounder (Platichthys flesus L.). Heredity 2007, 99, 592–600. [Google Scholar] [CrossRef] [PubMed]
  16. Vandamme, S.G.; Maes, G.E.; Raeymaekers, J.A.M.; Cottenie, K.; Imsland, A.K.; Hellemans, B.; Volckaert, F.A.M. Regional environmental pressure influences population differentiation in turbot (Scophthalmus maximus). Mol. Ecol. 2014, 23, 618–636. [Google Scholar] [CrossRef] [PubMed]
  17. Niţă, V.; Diaconescu, Ş.; Zaharia, T.; Maximov, V.; Nicolae, C.; Micu, D. The characterization of the main habitat types populated by the Black Sea Turbot in its different stages of development. Aquac. Aquar. Conserv. Legis. 2011, 4, 552–570. Available online: http://www.bioflux.com.ro/aacl (accessed on 1 March 2023).
  18. STECF. Advice for Sprat and Turbot in Theblack Sea, Commission Staff Working Paper. 2007. Available online: https://stecf.jrc.ec.europa.eu/documents/43805/55543/07-10_Black+Sea+advice+for+sprat+and+turbot.pdf (accessed on 8 September 2023).
  19. Yeaman, S.; Whitlock, M.C. The genetic architecture of adaptation under migration–selection balance. Evolution 2011, 65, 1897–1911. [Google Scholar] [CrossRef]
  20. Orsini, L.; Vanoverbeke, J.; Swillen, I.; Mergeay, J.; De Meester, L. Drivers of population genetic differentiation in the wild: Isolation by dispersal limitation, isolation by adaptation and isolation by colonization. Mol. Ecol. 2013, 22, 5983–5999. [Google Scholar] [CrossRef]
  21. Vilas, R.; Bouza, C.; Vera, M.; Millán, A.; Martínez, P. Variation in anonymous and EST-microsatellites suggests adaptive population divergence in turbot. Mar. Ecol. Prog. Ser. 2010, 420, 231–239. [Google Scholar] [CrossRef]
  22. Vilas, R.; Vandamme, S.G.; Vera, M.; Bouza, C.; Maes, G.E.; Volckaert, F.A.; Martínez, P. A genome scan for candidate genes involved in the adaptation of turbot (Scophthalmus maximus). Mar. Genom. 2015, 23, 77–86. [Google Scholar] [CrossRef] [PubMed]
  23. Diopere, E.; Vandamme, S.G.; Hablützel, P.I.; Cariani, A.; Van Houdt, J.; Rijnsdorp, A.; Tinti, F.; FishPopTrace Consortium; Volckaert, F.A.M.; Maes, G.E. Seascape genetics of a flatfish reveals local selection under high levels of gene flow. ICES J. Mar. Sci. 2018, 75, 675–689. [Google Scholar] [CrossRef]
  24. Do Prado, F.D.; Vera, M.; Hermida, M.; Bouza, C.; Pardo, B.G.; Vilas, R.; Blanco, A.; Fernández, C.; Maroso, F.; Maes, G.E.; et al. Parallel evolution and adaptation to environmental factors in a marine flatfish: Implications for fisheries and aquaculture management of the turbot (Scophthalmus maximus). Evol. Appl. 2018, 11, 1322–1341. [Google Scholar] [CrossRef]
  25. Tserkova, F.; Petrova-Pavlova, E.; Stoykov, S.; Mihneva, V.; Valchev, S.; Klisarova, D.; Gerdzhikov, D.; Maximov, V.; Radu, G. Stock Assessment of Scophtalmus maximus in Bulgarian Black Sea zone during autumn 2015. Proc. Inst. Fish. Resour. 2017, 28, 24–33. [Google Scholar]
  26. Ivanova, P.; Dzhembekova, N.; Atanassov, I.; Rusanov, K.; Raykov, V.; Zlateva, I.; Yankova, M.; Raev, Y.; Nikolov, G. Genetic diversity and morphological characterisation of three turbot (Scophthalmus maximus L., 1758) populations along the Bulgarian Black Sea coast. Nat. Conserv. 2021, 43, 123–146. [Google Scholar] [CrossRef]
  27. Turan, C.; Ivanova, P.P.; Raykov, V.S.; Gurlek, M.; Erguden, D.; Yaglioglu, D.; Karan, S.; Dodgu, S.A.; Uyan, A.; Ozturk, B.; et al. Genetics structure analysis of turbot (Scophthalmus maximus, Linnaeus, 1758) in the Black and Mediterranean Seas for application of innovative Management Strategies. Front. Mar. Sci. 2019, 6, 740. [Google Scholar] [CrossRef]
  28. Syphard, A.D.; Franklin, J. Differences in spatial predictions among species distribution modeling methods vary with species traits and environmental predictors. Ecography 2009, 32, 907–918. [Google Scholar] [CrossRef]
  29. Elith, J.; Phillips, S.J.; Hastie, T.; Dudík, M.; Chee, Y.E.; Yates, C.J. A statistical explanation of MaxEnt for ecologists. Divers. Distrib. 2011, 17, 43–57. [Google Scholar] [CrossRef]
  30. Yu, H.; Cooper, A.R.; Infante, D.M. Improving species distribution model predictive accuracy using species abundance: Application with boosted regression trees. Ecol. Model. 2020, 432, 109202. [Google Scholar] [CrossRef]
  31. Lobo, J.M.; Jiménez-Valverde, A.; Hortal, J. The uncertain nature of absences and their importance in species distribution modeling. Ecography 2010, 33, 103–114. [Google Scholar] [CrossRef]
  32. Phillips, S.J.; Anderson, R.P.; Dudík, M.; Schapire, R.E.; Blair, M.E. Opening the black box: An open-source release of Maxent. Ecography 2017, 40, 887–893. [Google Scholar] [CrossRef]
  33. Li, W.; Guo, Q.; Elkan, C. Can we model the probability of presence of species without absence data? Ecography 2011, 34, 1096–1105. [Google Scholar] [CrossRef]
  34. Buebos-Esteve, D.E.; Mamasig, G.D.N.S.; Ringor, A.M.D.; Layog, H.N.B.; Murillo, L.C.S.; Dagamac, N.H.A. Modeling the potential distribution of two immortality flora in the Philippines: Applying MaxEnt and GARP algorithms under different climate change scenarios. Model. Earth Syst. Environ. 2023, 9, 2857–2876. [Google Scholar] [CrossRef]
  35. Choi, J.; Lee, S. Principal bioclimatic variables of ten dominant plant species in Korea wetland using the Maxent model. Ecol. Eng. 2022, 183, 106729. [Google Scholar] [CrossRef]
  36. Gonzaleza, C.R.; Arciaa, Y.A.; Bussa, E.F. Remote Sensing and modeling tools exploration for habitat delimitation of leishmaniasis transmitting vectors. Int. Arch. Photogramm. Remote Sens. Spat. Inf. Sci. 2021, XLVI-4/W2-2021, 139–145. [Google Scholar] [CrossRef]
  37. Gülçin, D.; Arslan, E.S.; Örücü, Ö.K. Effects of climate change on the ecological niche of common hornbeam (Carpinus betulus L.). Ecol. Inform. 2021, 66, 101478. [Google Scholar] [CrossRef]
  38. Jan, A.; Arismendi, I.; Giannico, G.; Flitcroft, R. Habitat overlap among native and introduced cold-water fishes in the Himalayas. Sci. Rep. 2023, 13, 15033. [Google Scholar] [CrossRef] [PubMed]
  39. Khan, A.M.; Li, Q.; Saqib, Z.; Khan, N.; Habib, T.; Khalid, N.; Majeed, M.; Tariq, A. MaxEnt modelling and impact of climate change on habitat suitability variations of economically important Chilgoza Pine (Pinus gerardiana Wall.) in South Asia. Forests 2022, 13, 715. [Google Scholar] [CrossRef]
  40. Mukherjeeq, S.S.; Purohit, S.; Bag, S.; Aditya, G.; Hossain, A. Species Distribution Modeling of Variable Tawny Rajah (Charaxes bernardus hierax) in some unusual habitats of West Bengal, India: Implications for conservation. Res. Sq. 2023; preprint. [Google Scholar] [CrossRef]
  41. Oyarzun, M.C. Predicting Archaeological Site Locations in Northeastern California’s High Desert using the Maxent Model. Ph.D. Thesis, University of Southern California, Los Angeles, CA, USA, 2016. [Google Scholar]
  42. Solanou, M.; Valavanis, V.D.; Karachle, P.K.; Giannoulaki, M. Looking at the Expansion of Three Demersal Lessepsian Fish Immigrants in the Greek Seas: What Can We Get from Spatial Distribution Modeling? Diversity 2023, 15, 776. [Google Scholar] [CrossRef]
  43. Soliman, M.M.; Al-Khalaf, A.A.; El-Hawagry, M.S. Effects of Climatic Change on Potential Distribution of Spogostylum ocyale (Diptera: Bombyliidae) in the Middle East Using Maxent Modelling. Insects 2023, 14, 120. [Google Scholar] [CrossRef]
  44. Tadesse, Z.; Nemomissa, S.; Lemessa, D. Predicting the distributions of Pouteria adolfi-friederici and Prunus africana iconic tree species under current and future climate change scenarios in Ethiopia. bioRxiv 2021. [Google Scholar] [CrossRef]
  45. Yousaf, A.; Hadi, R.; Khan, N.; Ibrahim, F.; Moin, H.; Rahim, S.; Hussain, M. Identification of suitable habitat for Taxus wallichiana and Abies pindrow in moist temperate forest using maxent modelling technique. Saudi J. Biol. Sci. 2022, 29, 103459. [Google Scholar] [CrossRef]
  46. Merow, C.; Smith, M.J.; Silander, J.A., Jr. A practical guide to MaxEnt for modeling species’ distributions: What it does, and why inputs and settings matter. Ecography 2013, 36, 1058–1069. [Google Scholar] [CrossRef]
  47. Phillips, S.J.; Dudík, M.; Schapire, R.E. A maximum entropy approach to species distribution modeling. In Proceedings of the Twenty-First International Conference on Machine Learning, Banff, AB, Canada, 4–8 July 2004; p. 83. [Google Scholar] [CrossRef]
  48. Phillips, S.J.; Anderson, R.P.; Schapire, R.E. Maximum entropy modeling of species geographic distributions. Ecol. Model. 2006, 190, 231–259. [Google Scholar] [CrossRef]
  49. Petrova, E.; Stoykov, S.; Mihneva, V.; Valchev, S.; Penchev, P.; Klisarova, D.; Gerdjikov, D.; Tserkova, F. Bottom Trawl Surveys in the Bulgarian Black Sea Area, Spring 2017; Agricultural Academy Institute of Fish Resources: Varna, Bulgaria, 2017; Available online: https://www.ifrvarna.com/images/files/Publikacii/4.%20Bottom%20Trawl%20Surveys%20In%20The%20Bulgarian%20Black%20Sea%20Area,%20Spring%202017.pdf (accessed on 20 March 2023).
  50. Petrova-Pavlova, E.; Stoykov, S.; Mihneva, V.; Valchev, S.; Penchev, P.; Klisarova, D.; Gerdjikov, D.; Tserkova, F. Bottom Trawl Surveys in the Bulgarian Black Sea Area, Autumn 2017; Agricultural Academy Institute of Fish Resources: Varna, Bulgaria, 2018. [Google Scholar]
  51. Petrova-Pavlova, E.; Stoykov, S.; Mihneva, V.; Valchev, S.; Penchev, P.; Klisarova, D.; Gerdjikov, D.; Tserkova, F. Bottom Trawl Surveys in the Bulgarian Black Sea Area, Spring 2018; Agricultural Academy Institute of Fish Resources: Varna, Bulgaria, 2018. [Google Scholar]
  52. Petrova-Pavlova, E.; Stoykov, S.; Mihneva, V.; Valchev, S.; Penchev, P.; Tserkova, F. Bottom Trawl Surveys in the Bulgarian Black Sea Area, Autumn 2018; Agricultural Academy Institute of Fish Resources: Varna, Bulgaria, 2019. [Google Scholar]
  53. Petrova-Pavlova, E.; Stoykov, S.; Mihneva, V.; Valchev, S.; Penchev, P.; Tserkova, F. Bottom Trawl Surveys in the Bulgarian Black Sea Area, Spring 2019; Agricultural Academy Institute of Fish Resources: Varna, Bulgaria, 2019. [Google Scholar]
  54. Petrova-Pavlova, E.; Stoykov, S.; Mihneva, V.; Valchev, S.; Penchev, P.; Tserkova, F. Bottom Trawl Surveys in the Bulgarian Black Sea Area, Autumn 2019; Agricultural Academy Institute of Fish Resources: Varna, Bulgaria, 2020. [Google Scholar]
  55. Petrova-Pavlova, E.; Stoykov, S.; Mihneva, V.; Valchev, S.; Penchev, P.; Tserkova, F. Bottom Trawl Surveys in the Bulgarian Black Sea Area, Summer 2020; Agricultural Academy Institute of Fish Resources: Varna, Bulgaria, 2020. [Google Scholar]
  56. Petrova-Pavlova, E.; Stoykov, S.; Mihneva, V.; Valchev, S.; Penchev, P.; Tserkova, F. Bottom Trawl Surveys in the Bulgarian Black Sea Area, Autumn 2020; Agricultural Academy Institute of Fish Resources: Varna, Bulgaria, 2021. [Google Scholar]
  57. Petrova-Pavlova, E.; Stoykov, S.; Mihneva, V.; Valchev, S.; Penchev, P.; Tserkova, F. Bottom Trawl Surveys in the Bulgarian Black Sea Area, Spring-Summer 2021; Agricultural Academy Institute of Fish Resources: Varna, Bulgaria, 2021. [Google Scholar]
  58. Petrova-Pavlova, E.; Stoykov, S.; Mihneva, V.; Valchev, S.; Penchev, P.; Tserkova, F. Bottom Trawl Surveys in the Bulgarian Black Sea Area, Autumn 2021; Agricultural Academy Institute of Fish Resources: Varna, Bulgaria, 2022. [Google Scholar]
  59. Damalas, D.; Katsanevakis, S.; Maravelias, C.D.; Karageorgis, A.P. Habitat selection of flatfish in relation to Spatial, temporal and environmental parameters in the Aegean Sea. In Proceedings of the 9th Symposium on Oceanography & Fisheries, Patras, Greece, 13–16 May 2009. [Google Scholar]
  60. Lauria, V.; Vaz, S.; Martin, C.S.; Mackinson, S.; Carpentier, A. What influences European plaice (Pleuronectes platessa) distribution in the eastern English Channel? Using habitat modelling and GIS to predict habitat utilization. ICES J. Mar. Sci. 2011, 68, 1500–1510. [Google Scholar] [CrossRef]
  61. Baptista, V.; Blasco, I.P.; Bueno-Pardo, J.; Teodosio, M.; Leitão, F. Environmental variability and fishing effects on artisanal flatfish fisheries along the Portuguese coast. Front. Mar. Sci. 2022, 9, 844158. [Google Scholar] [CrossRef]
  62. De Raedemaecker, F.; Brophy, D.; O’Connor, I.; O’Neill, B. Dependence of RNA: DNA ratios and Fulton’s K condition indices on environmental characteristics of plaice and dab nursery grounds. Estuar. Coast. Shelf Sci. 2012, 1, 60–70. [Google Scholar] [CrossRef]
  63. Zhang, Y.; Brzezinski, D.; Chang, J.H.; Stepanek, K.; Chen, Y. Spatial structuring of fish community in association with environmental variables in the coastal Gulf of Maine. J. Northw. Atl. Fish. Sci. 2010, 43, 47–64. [Google Scholar] [CrossRef]
  64. Araújo, F.G.; de Azevedo, M.C.C.; de Araújo Silva, M.; Pessanha, A.L.M.; Gomes, I.D.; da Cruz-Filho, A.G. Environmental influences on the demersal fish assemblages in the Sepetiba Bay, Brazil. Estuaries 2002, 25, 441–450. [Google Scholar] [CrossRef]
  65. Essington, T.E.; Anderson, S.C.; Barnett, L.A.; Berger, H.M.; Siedlecki, S.A.; Ward, E.J. Advancing statistical models to reveal the effect of dissolved oxygen on the spatial distribution of marine taxa using thresholds and a physiologically based index. Ecography 2022, 8, e06249. [Google Scholar] [CrossRef]
  66. Carvalho, A.N.; Santos, P.T. Factors affecting the distribution of epibenthic biodiversity in the Cávado estuary (NW Portugal). J. Integr. Coast. Zone Manag. 2013, 13, 101–111. [Google Scholar] [CrossRef]
  67. Claireaux, G.; Lefrançois, C. Linking environmental variability and fish performance: Integration through the concept of scope for activity. Philos. Trans. R. Soc. Lond. B Biol. Sci. 2007, 362, 2031–2204. [Google Scholar] [CrossRef]
  68. Craig, J.K. Aggregation on the edge: Effects of hypoxia avoidance on the spatial distribution of brown shrimp and demersal fishes in the Northern Gulf of Mexico. Mar. Ecol. Prog. Ser. 2012, 445, 75–95. [Google Scholar] [CrossRef]
  69. Vestfals, C.D.; Ciannelli, L.; Hoff, G.R. Changes in habitat utilization of slope-spawning flatfish across a bathymetric gradient. ICES J. Mar. Sci. 2016, 73, 1875–1889. [Google Scholar] [CrossRef]
  70. Madec, G. NEMO Reference Manual 3_6_STABLE: “NEMO Ocean Engine” Note du Pôle de Modélisation; Institut Pierre-Simon Laplace (IPSL): Guyancourt, France, 2016; ISSN 1288-1619. [Google Scholar]
  71. Capet, A.; Meysman, F.J.; Akoumianaki, I.; Soetaert, K.; Grégoire, M. Integrating sediment biogeochemistry into 3D oceanic models: A study of benthic-pelagic coupling in the Black Sea. Ocean Model. 2016, 101, 83–100. [Google Scholar] [CrossRef]
  72. Grégoire, M.; Raick, C.; Soetaert, K. Numerical modeling of the central Black Sea ecosystem functioning during the eutrophication phase. Prog. Oceanogr. 2008, 76, 286–333. [Google Scholar] [CrossRef]
  73. Grégoire, M.; Soetaert, K. Carbon, nitrogen, oxygen and sulfide budgets in the Black Sea: A biogeochemical model of the whole water column coupling the oxic and anoxic parts. Ecol. Model. 2010, 221, 2287–2301. [Google Scholar] [CrossRef]
  74. Lima, L.; Aydogdu, A.; Escudier, R.; Masina, S.; Ciliberti, S.A.; Azevedo, D.; Peneva, E.L.; Causio, S.; Cipollone, A.; Clementi, E.; et al. Black Sea Physical Reanalysis (CMEMS BS-Currents) (Version 1) [Data Set]. CMEMS. 2020. Available online: https://data.marine.copernicus.eu/product/BLKSEA_MULTIYEAR_PHY_007_004/description (accessed on 15 February 2023). [CrossRef]
  75. Jansen, E.; Martins, D.; Stefanizzi, L.; Ciliberti, S.A.; Gunduz, M.; Ilicak, M.; Lecci, R.; Cretí, S.; Causio, S.; Aydoğdu, A.; et al. Black Sea Physical Analysis and Forecast (Copernicus Marine Service BS-Currents, EAS5 System) (Version 1) [Data Set]. CMEMS. 2022. Available online: https://data.marine.copernicus.eu/product/BLKSEA_ANALYSISFORECAST_PHY_007_001/description (accessed on 15 February 2023). [CrossRef]
  76. The MathWorks Inc. MATLAB, Version: 2020a; The MathWorks Inc.: Natick, MA, USA, 2020; Available online: https://www.mathworks.com (accessed on 18 February 2023).
  77. Fielding, A.H.; Bell, J.F. A review of methods for the assessment of prediction errors in conservation presence/absence models. Environ. Conserv. 1997, 24, 38–49. [Google Scholar] [CrossRef]
  78. Allouche, O.; Tsoar, A.; Kadmon, R. Assessing the accuracy of species distribution models: Prevalence, kappa and the true skill statistic (TSS). J. Appl. Ecol 2006, 43, 1223–1232. [Google Scholar] [CrossRef]
  79. Araújo, M.B.; Pearson, R.G.; Thuiller, W.; Erhard, M. Validation of species–climate impact models under climate change. Glob. Chang. Biol. 2005, 11, 1504–1513. [Google Scholar] [CrossRef]
  80. Valles-Jiménez, R. Estudios Sobre la Estructura Genética del Camarón Blanco (Litopenaeus vannamei), del Pacífico Oriental Inferidos del Análisis de Microsatélites y ADN Mitocondrial. Ph.D. Thesis, Centro de Investigaciones Biológicas Del Noroeste, S.C., La Paz, Mexico, 2005; 74p. Available online: http://dspace.cibnor.mx:8080/handle/123456789/122 (accessed on 18 April 2023).
  81. Kumar, S.; Stecher, G.; Tamura, K. MEGAX: Molecular Evolutionary Genetics Analysis across computing platforms. Mol. Biol. Evol. 2018, 35, 1547–1549. [Google Scholar] [CrossRef]
  82. Rozas, J.; Ferrer-Mata, A.; Sánchez-DelBarrio, J.C.; Guirao-Rico, S.; Librado, P.; Ramos-Onsins, S.E.; Sánchez-Gracia, A. DnaSP 6: DNA sequence polymorphism analysis of large data sets. Mol. Biol. Evol. 2017, 34, 3299–3302. [Google Scholar] [CrossRef]
  83. Leigh, J.W.; Bryant, D. PopART: Full-feature software for haplotype network construction. Methods Ecol. Evol. 2015, 6, 1110–1116. [Google Scholar] [CrossRef]
  84. Clement, M.; Posada, D.; Crandall, K.A. TCS: A computer program to estimate gene genealogies. Mol. Ecol. 2002, 9, 1657–1659. [Google Scholar] [CrossRef] [PubMed]
  85. Feng, X.; Park, D.S.; Liang, Y.; Pandey, R.; Papeş, M. Collinearity in ecological niche modeling: Confusions and challenges. Ecol. Evol. 2019, 9, 10365–10376. [Google Scholar] [CrossRef] [PubMed]
  86. Swets, J.A. Measuring the accuracy of diagnostic systems. Science 1988, 240, 1285–1293. [Google Scholar] [CrossRef] [PubMed]
  87. Zhao, Y.; Zhu, X.; Jiang, Y.; Li, Z.; Li, X.; Xu, W.; Wei, H.; Li, Y.; Li, X. Genetic diversity and variation of seven Chinese grass shrimp (Palaemonetes sinensis) populations based on the mitochondrial COI gene. BMC Ecol. Evol. 2021, 21, 167. [Google Scholar] [CrossRef] [PubMed]
  88. Xu, S.; Wang, Z.; Zhang, Y.; Gao, T.; Zou, J.; Zhang, X. Evidence for intra-mitochondrial variation in population genetic structure of Platycephalus sp.1 in the northwestern Pacific. Mitochondrial DNA Part A DNA Mapp. Seq. Anal. 2019, 30, 281–288. [Google Scholar] [CrossRef] [PubMed]
  89. Parmaksiz, A. Population genetic diversity of yellow barbell (Carasobarbus luteus) from Kueik, Euphrates and Tigris Rivers based on mitochondrial DNA D-loop sequences. Turkish J. Fish. Aquat. Sci. 2019, 20, 79–86. [Google Scholar] [CrossRef]
  90. Yorisue, T.; Iguchi, A.; Yasuda, N.; Yoshioka, Y.; Sato, T.; Fujita, Y. Evaluating the effect of overharvesting on genetic diversity and genetic population structure of the coconut crab. Sci. Rep. 2020, 10, 10026. [Google Scholar] [CrossRef]
  91. Murray, J.W.; Top, Z.; Özsoy, E. Hydrographic properties and ventilation of the Black Sea. Deep. Sea Res. Part A Oceanogr. Res. Pap. 1991, 38, S663–S689. [Google Scholar] [CrossRef]
  92. Konovalov, S.K.; Murray, J.W.; Luther III, G.W. Black Sea Biogeochemistry. Oceanography 2005, 18, 24–35. [Google Scholar] [CrossRef]
  93. Olden, J.D.; Neff, B.D. Cross-correlation bias in lag analysis of aquatic time series. Mar. Biol. 2001, 138, 1063–1070. [Google Scholar] [CrossRef]
  94. Mouritsen, K.N.; Tompkins, D.M.; Poulin, R. Climate warming may cause a parasite-induced collapse in coastal amphipod populations. Oecologia 2005, 146, 476–483. [Google Scholar] [CrossRef] [PubMed]
  95. Traill, L.W.; Lim, M.L.; Sodhi, N.S.; Bradshaw, C.J. Mechanisms driving change: Altered species interactions and ecosystem function through global warming. J. Anim. Ecol. 2010, 79, 937–947. [Google Scholar] [CrossRef] [PubMed]
  96. Reiss, H.; Cunze, S.; König, K.; Neumann, H.; Kröncke, I. Species distribution modelling of marine benthos: A North Sea case study. Mar. Ecol. Prog. Ser. 2011, 442, 71–86. [Google Scholar] [CrossRef]
Figure 1. Sampling locations, with yellow dots displaying demersal and multispecies survey sites and red dots representing genetic marker sampling locations (annotated with S1–S4) for the study period (2017–2021).
Jmse 11 01982 g001
Figure 2. MaxEnt Habitat suitability map of S. maximus in the Bulgarian Black Sea coastal and shelf waters (with dark red indicating the highest possible probability of suitable conditions, green indicating conditions equal to those where species were found, and lighter shades of purple corresponding to low predicted probability of suitable environment).
Jmse 11 01982 g002
Figure 3. MaxEnt Habitat suitability map projection under two different climate scenarios: (a) S. maximus habitat suitability in the Bulgarian Black Sea coastal and shelf waters if annual mean temperatures rise by 0.5 °C and (b) if annual mean temperatures rise by 1 °C (with dark red indicating the highest possible probability of suitable conditions, green indicating conditions equal to those where species were found, and lighter shades of purple corresponding to low predicted probability of suitable environment).
Jmse 11 01982 g003
Figure 4. MaxEnt model-predicted probabilities grid vs. field-measured CPUE kg/trawl grid (the red gradient dots) of S. maximus in the Bulgarian Black Sea coastal and shelf waters during the survey expeditions carried out in the 2017–2021 period [49,50,51,52,53,54,55,56,57,58] (with dark red indicating the highest possible probability of suitable conditions, green indicating conditions equal to those where species were found, and lighter shades of purple corresponding to low predicted probability of suitable environment).
Jmse 11 01982 g004
Figure 5. TCS network of S. maximus based on COIII haplotypes. The sizes of the circles indicate the number of individuals with each given haplotype. Small lines illustrate the substitutions between the respective haplotypes. The small black circle indicates the intermediate haplotypes that are not present in the sample.
Jmse 11 01982 g005
Table 1. Survey expeditions from which the presence-only (PO) data were compiled.
SeasonDemersal Trawl Surveys (Turbot Stock Assessment)Pelagic Trawl Surveys (Multi-Species Stock Assessment)Other Sampling
Spring2017 (May)
2018 (May–June)
2021 (May)
2019 (April)
2021 (April)—genetic markers
Summer2020 (July–August)
Autumn2017 (December)2017 (December)
2018 (December)2018 (December)
2019 (December)2019 (October–November)
2020 (December)2020 (November)
Table 2. Information on sampling stations for genetic analyses—location, geographic coordinates in decimal degrees (DD), depth, and date.
Sampling LocationStation Coordinates (DD)DateDepth
Latitude °NLongitude °E
S1. Shabla43.51428.741March 201970–80 m
S2. Shkorpilovtsi42.83328.282April 2020/202170–80 m
S3. Nesebar42.56928.204April 2020/202170–80 m
S4. Tsarevo42.22128.097April 202170–80 m
Table 3. Variables’ relative percentage contribution and permutation importance to training data model. Values shown are averages over replicate runs.
VariablePercentage ContributionPermutation Importance
Temperature (temp_eez)90.2056.4
Dissolved oxygen (do_eez)7.535.1
Salinity (sal_eez)1.83.1
Current speed (curr_eez)0.55.4
Table 4. Genetic polymorphism and neutrality tests of S. maximus inferred from the mitochondrial DNA COIII sequences.
Sampling LocationmtDNA COIII
Genetic PolymorphismNeutrality Test
NShHd (s.d.)π (s.d.)Tajima’s DFu’s Fs
S1. Shabla30880.418 (0.114)0.00128 (0.00044)−2.123 *−5.509
S2. Nesebar3412120.783 (0.057)0.00233 (0.00037)−1.889 *−7.824
S3. Shkorpilovtsi29560.594 (0.095)0.00146 (0.00033)−0.974−2.297
S4. Tsarevo40980.363 (0.098)0.00139 (0.00045)−1.990 *−4.485
N—number of sequences, S—number of polymorphic (segregating) sites, h—number of haplotypes, Hd—haplotype diversity, π—nucleotide diversity. Tajima’s D, statistical significance: *, p < 0.05; Fu’s Fs statistic.
Disclaimer/Publisher’s Note: The statements, opinions and data contained in all publications are solely those of the individual author(s) and contributor(s) and not of MDPI and/or the editor(s). MDPI and/or the editor(s) disclaim responsibility for any injury to people or property resulting from any ideas, methods, instructions or products referred to in the content.

