Article

Assessment of Ship Hull Ultimate Strength under Fire Conditions: The Fire Smith Method Approach

1
Liaoning Shock Protection and Damage Assessment Technology Engineering Research Center, Shenyang University of Technology, Shenyang 110780, China
2
Naval Research Academy, Beijing 100161, China
*
Author to whom correspondence should be addressed.
J. Mar. Sci. Eng. 2023, 11(11), 2055; https://doi.org/10.3390/jmse11112055
Submission received: 15 October 2023 / Accepted: 25 October 2023 / Published: 27 October 2023
(This article belongs to the Special Issue Ship Structures II)

Abstract

:
This article presents the fire Smith method, which integrates the plate model and the Smith method, to analyze the impact of fire temperature and extent on the buckling strength of frigates. This investigation focused on the frigate’s buckling strength and how it is affected by a fire, achieved by modifying both deck temperature and area. Leveraging the principle of oxygen consumption, a coefficient “D” was introduced to account for fire temperature and region variations. This enabled the characterization of buckling strength under varying temperature and regional conditions through 64 simulations conducted on a frigate model. The outcomes revealed that the disparity between simulation results and the fire Smith method remained below 10%, establishing a solid basis for engineering assessment. As the high-temperature area decreased and necessitated less oxygen, the ultimate strength initiated a decline. However, upon reaching a certain threshold temperature, the ultimate strength stabilized. Conversely, expansive high-temperature zones caused a decline in ultimate strength, coupled with an increased oxygen requirement. Under consistent oxygen consumption conditions, the rate of ultimate strength reduction intensified. Consequently, these divergent characteristics of ultimate strength in various high-temperature areas underscored that minimizing the expansive fire high-temperature zones can significantly enhance the ship’s fire resistance, safeguarding its structural integrity.

1. Introduction

Ships play an important role in the transportation of goods and upholding national security. In recent years, ship accidents have caused serious economic and property losses. Between 2009 and 2018, 48 bulk carriers with a dead weight exceeding 10,000 tons suffered various accidents that caused more than 100 fatalities [1]. Extensive research efforts have been directed towards enhancing hull safety and reliability, encompassing studies on intact hull ultimate strength [2,3], damages [4,5,6,7,8,9], combined loads [10,11], and ice-related scenarios [12,13]. Although the safety of ships has been improved in recent decades, more detailed and advanced research should be considered to ensure that the ultimate strength of ships can withstand loads under various conditions, including fire.
In recent years, a series of significant ship fires have underscored the criticality of fire safety. Notably, on 12 July 2020, the “USS Bonhomme Richard” of the 7th Fleet of the US Army caught fire while undergoing maintenance work at the dock of the San Diego Naval Base [14]. Similarly, on 17 July 2020, a fire broke out during the repair of the amphibious assault ship “Kearsarge” located at Norfolk [15]. On the evening of 29 March 2023, a passenger ship caught fire near the island of Brasiland in the Philippines, resulting in a devastating loss of at least 29 lives [16]. The frequent occurrence of fire accidents has raised concerns among scholars, who have conducted research on the ultimate strength of ship hulls under fire conditions. Liu [17] has calculated the fire temperature field based on the large eddy model and used a self-developed temperature mapping program to map the temperature load to the structure for thermal coupling calculation. Nassiraei [18] studied the influence of joint geometry and ring plate size on initial stiffness, ultimate strength, and failure mechanism at different high temperatures. At high temperatures, the initial stiffness and ultimate strength of the X-joint will increase significantly when the ring plate is used. Through nonlinear regression analysis, a parameter equation was proposed to determine the high-temperature compressive support effectiveness of X-joints reinforced with ring plates. Nassiraei [19] studied the influence of ring plate size and joint geometry on the static performance of X-joint reinforced by ring plates under high-temperature tensile loads. The failure mechanism of a joint can be significantly improved by using larger ring plates. It was noted that the tensile strength of ring-plate-reinforced X-joints diminishes as temperature increases, a trend attributed to the decrease in the elastic modulus of the steel material. Li [20] studied the effect of engine room fires on the ultimate strength of the ship using thermal radiation flux values as boundary conditions. Paik [21,22] conducted stiffened plate fire tests to measure the ultimate strength under ISO-834 standard [23] conditions. This provides a reference for the failure modes of reinforced panels under fire conditions. Liu [24] studied the temperature distribution and fire response of multi-compartment fire, proposed the predictive model for hull ultimate strength under fire conditions, and obtained a positive correlation between compartment residual strength and the heat release rate. Guo [25] delved into the failure characteristics, stress distribution, and deformation modes of a two-layer cabin under different heat release rates and fire positions. The study predicted residual cabin strength under heat release rates ranging from 0 to 8 MW at different fire positions.
In order to evaluate the ultimate strength of ship hulls, C.S. Smith proposed the Smith method [2]. Over time, numerous scholars have refined and adapted this method to suit different operational scenarios. Piscopo [26] summarizes the modified incremental iteration method tailored for bulk carriers under alternating loading conditions. Taking ISSC bulk carrier as a reference ship and comparing it with the finite element results from the literature, the effectiveness of this method was verified. Zhao’s [27] investigation into large openings in cabins utilized experimental and simulation approaches. By validating the experimental and simulation outcomes through the Smith method, this study highlighted its practical feasibility. Li [28] compared the ultimate strength of a stranded hull by proposing the damage index method and simulation calculation, providing a reference and overview for future research. Xu [29] studied the buckling ultimate strength and proposed an analytical solution to the evaluation method of the hull ultimate strength under extreme wave loads. Zhu [30] studied the residual strength in damaged ships with the vertical and horizontal hull girder loads, as well as under combined stresses. The improved Smith method was used to calculate the residual load of the damaged ship, and the particle swarm optimization method was used to obtain the neutral axis of the damaged section. Putranto’s [31] innovative proposition of an equivalent single-layer approach for the hull girder ultimate strength not only enhanced computational speed but also streamlined calculations. Cerik [32] introduced a fast procedure to determine the translation and rotation of the neutral axis at each curvature increment, which was used for a rapid assessment of the hull strength under severe conditions. Guedes Soares [33] studied the elastic–plastic behavior of plates under high temperature, which made a very important reference for the study of mechanical properties of plates at such conditions. Guedes Soares [34] delved into the elastic–plastic behavior of plates at high temperatures, in order to comprehend mechanical properties in such conditions. Gordo [35] put forward a method to estimate the ultimate bending moment, considering the strength degradation caused by residual stress caused by welding high temperature, which provides an important reference for the element behavior under high-temperature conditions. Chen [36] proposed a simplified method to study the ultimate strength of welded stiffened plates, which provided a reference for the study of ultimate strength characteristics at high temperature. Teixeira and Guedes Soares [37] introduced the reliability formula of a thermal-insulation-bearing plate under local thermal load. While it is evident that numerous scholars have innovatively proposed improvements to the Smith method for assessing ultimate strength under diverse conditions, it is noteworthy that the application of the fire Smith method remains relatively constrained despite its potential. A first-order second-moment method was proposed to quantify the uncertainty of thermal load and describe the importance of control variables in the limit state function.
Considering the effect of fire on the ultimate strength of the hull at the beginning of the ship design can reduce the damage of fire to the overall ultimate strength of the hull by using fire-resistant coatings or combustible materials. It is helpful for firefighters to put out the fire in the position that has great influence on the ultimate strength, such as the hull deck. For rapid decision making, it is helpful to rationally allocate firefighters to extinguish fires and realize more effective resource allocation.
The sinking of the Sheffield [38] after being hit by a flying fish missile is an example that highlights the importance of correctly evaluating the ultimate strength of the hull under fire conditions. This disaster could have been avoided if the impact of fire had been properly considered during the design process. The analysis of the use of aluminum alloy as hull material [39] suggests that the impact of fire may be underestimated during the design process. Using a fire simulation method to evaluate the impact of fire on the ultimate strength of the hull at the beginning of the design process can help to avoid such disasters.
Analysis of the above research finds that the ultimate strength of ships under fire conditions mainly focuses on two methods: trials and simulations. For the trial method, it can reflect the real fire failure mode, but currently there is limited fire test data, making it difficult to apply to all ship types. For simulation methods, the temperature mapping software needs to be developed, the professional technical level of personnel evaluating the ultimate strength of ships under fire conditions is high, and the work cycle is long. Therefore, a method that supports rapid decision making by command and rescue personnel was needed. However, simulation and trial cannot achieve the goal of simple and rapid assessment of ultimate strength under fire conditions. In summary, to address the issue of simple and rapid assessment of the ultimate strength of ship hulls under fire conditions, a rapid assessment method was proposed.

2. Materials and Methods

The key of the fire Smith method lies in the characteristics of element in the fire stress–strain relationship. With regard to the plate behavior under high temperature, relevant experiments and simulation calculations have been carried out in the past, providing an important reference for the fire Smith method.
In previous studies, it can be found that the failure mode of steel structure gradually changes from elasticity to plasticity in the process of compression and temperature rise, as shown in Figure 1. Yang’s [40,41] exploration of ultimate strength and failure modes in I-beams at diverse temperatures provided essential insights into the progressive shift from elastic to plastic behavior within steel structures under high temperatures.
Han [42] made a comprehensive study on the local buckling behavior of an aluminum alloy plate in fire and obtained the typical failure mode under compression, as shown in Figure 2. It can be observed that buckling occurred in the middle of the plate.
Moreover, Han et al. [43] extended their study to scrutinize the local buckling behavior of high-strength aluminum alloy columns in fire, obtaining the failure mode and ultimate strength curve and using it to evaluate the accuracy of the current design method of aluminum alloy short columns in fire. As shown in Figure 3, it can be found that the failure modes of plates at 20 °C to 400 °C were similar, all of which were buckling failure.
Presently, there are few buckling tests on the real ship fire. It is conceivable that there may be an interaction between the plate in the real ship fire, which may be different from the failure mode of a single beam or plate, but it can provide reference to some extent. As is well known, under normal temperature conditions, the hull deck is subjected to buckling failure due to compression [44]. If the failure mode of the hull deck under compression due to high temperature is plastic deformation, before the failure mode of the whole ship fire changes from elasticity to plasticity, if the elastic buckling strength is estimated by plastic yield strength, the ultimate strength of the whole ship in fire will be overestimated.
Conversely, the buckling force of a plate under compression is less than that of plastic deformation. Therefore, using the elastic buckling strength for estimation could lead to an underestimation of the ultimate strength. However, there is a safety factor built into this approach. Although it may lead to a certain cost in the design process, these expenses are still considerably lower than those incurred due to fire-induced damage to the entire ship.
In the actual fire event, the development speed is fast, and if the influence of fire is underestimated, it may lead to irreparable cost. Therefore, from an engineering perspective, it is highly important to consider the utilization of elastic buckling as a means to underestimate the ultimate strength on fire.
Based on the theory of small deflection plates, an analytical solution for the elastic instability load of a single direction uniformly compressed simply supported plate under fire conditions was proposed. The governing equation for in-plane stressed thin rectangular isotropic plate is outlined [45]. The coordinate system of an equal thickness thin plate is shown in Figure 4, and the XY and XZ plane of the plate is the midplane of the plate. For a differential microelement (dx, dy) and (dx, dz) from the plate, the normal and shear stresses acting on each surface are shown in Figure 4.

2.1. Uniform Compression Thin Plate Model with Four Simply Supported Sides

Three fundamental assumptions underpin the small deflection model: (1) The normal strain perpendicular to the midplane is extremely small and can be disregarded. (2) Stress components σz, τzx, and τzy are smaller than σx, σy, and τxy; thus, normal strain εz and shear strain γzx and γzy can be omitted. The bending of thin plates with small deflections can be simplified as a plane stress problem. (3) When thin plate is bent, there is no strain parallel to the midplane at any point in the midplane.
When solving the small deflection bending problem of thin plates based on displacement, the deflection of thin plates ω is established. An elastic surface an elastic surface differential equation is formulated a small deflection theoretical plate based on geometric, physical, and force equilibrium equations as an unknown function,
D ( 4 ω x 4 + 2 4 ω x 2 y 2 + 4 ω y 4 ) = N x 1 2 ω x 2 + 2 N x 1 y 2 ω x y + N y 2 ω y 2
In the Equation (1), D is the stiffness coefficient of the plate, D = E t 3 12 1 μ 2 ; E is the Elastic modulus; T is the thickness; μ is Poisson’s ratio; Nx1, Ny is the buckling load on the midplane of the plate along the x and y axes; and Nxy is the shear force per unit length on the midplane of the plate.
For simple supported plate Ny = Nxy = 0 under unidirectional uniform compression, then
D ( 4 ω x 4 + 2 4 ω x 2 y 2 + 4 ω y 4 ) N x 1 2 ω x 2 = 0
Assumption   Buckling   condition :   ω = m = 1 A m n sin m π x a sin m π y a
In Equation (3), m and n are the half wave numbers in the x and y directions, respectively, both being positive integers and are positive integers, and Amn is undetermined constant. Substituting Equation (3) into Equation (2) yields Equation (4):
m = 1 n = 1 A m n [ m 4 π 4 a 4 + 2 m 2 n 2 π 4 a 2 b 2 + n 4 π 4 b 4 N x 1 D × m 4 π 4 a 2 ] sin m π x a sin m π y a = 0
If Equation (4) = 0, each coefficient of the unique condition that Equation (4) is 0, that is, the instability condition of the plate is
m 4 π 4 a 4 + 2 m 2 n 2 π 4 a 2 b 2 + n 4 π 4 b 4 N x 1 D × m 4 π 4 a 2 = 0
N x 1 = π 2 a 2 D m 2 ( m 2 a 2 + n 2 b 2 ) 2
Let k be the buckling coefficient:
k = [ a b m ( m 2 a 2 + 1 b 2 ) ] 2 = ( b a m + a m b ) 2 = ( m β + β m ) 2
In a simple supported plate under uniform unidirectional compression, the Buckling load is the minimum load for the plate to maintain a slightly curved state, assumption n = 1.
For a simply supported plate subjected to uniform unidirectional compression, the buckling load represents the minimum load required to maintain a slightly curved state. Assuming n = 1, and recognizing that dk/dm = 0, the expression simplifies:
2 m β + β m 1 β + β m 2 = 0
This establishes the smallest buckling coefficient when β = m, and subsequently, kmin = 4; therefore,
N x 1 , c r , m i n = 4 π 2 D b 2
It can be found that under the condition that the geometric dimensions a and b and the buckling half wave number m and n are determined, the buckling load Nx of the plate varies with the elastic modulus of the plate, then Nx is a function of the elastic modulus E.

2.2. Non-Uniform Compression Thin Plate Model with Three Simply Supported Sides and One Free Side

We assume that the non-uniform compression plate is also a small deformation plate. Due to the longitudinal force characteristics of the ship, the force in the area further away from the neutral axis increases, while the force in the area closer to the neutral axis decreases. Therefore, the force characteristics of the reinforcing ribs are non-uniform compression. This is shown in Figure 4, where a is the length c and the width. Under the longitudinal load of the ship, the cross-sectional stress of the stiffener along the z-axis direction is linearly distributed. The maximum stress value at the compression edge of the stiffener is σ1, and the stress at the bottom of the stiffener under compression is σ2. We define stress gradient coefficient as α0 = (σ1 − σ2)/σ1. Then, the stress at z from the deck σ can be represented as σ = σ1(1 − αz/c).
We applied simply supported boundary conditions to the loading edge of the longitudinal deck girders and the edge in contact with the deck, while leaving the edge in contact with the flange as a free edge. For the buckling coefficient of a thin plate under non-uniform compression, with three simply supported edges and one free edge, according to the Technical Code of Cold-Formed Thin-Wall Steel Structures [46], the calculation formula is as in Equation (10):
k 2 = 0.567 0.213 α 0 + 0.071 α 0 2
The European EC3 standard [47] also provides a calculation method for the buckling coefficient of non-uniform compression plates as in Equation (11):
k 2 = 0.57 0.21 α 0 + 0.07 α 0 2
Buckling load calculation formula N x 2 , c r = k 2 π 2 D c 2 . According to the stress characteristics of the total longitudinal strength of the hull, the area farther away from the neutral axis is more stressed, and the length of the stiffened plate is 0.02 m. Assuming that the neutral axis is in the center of the ship, the stress at the bottom of the stiffened plate is increased α2 = α1(1 − 0.02/(H/2)) = 0.985α1. Then, the stress gradient coefficient α0 = (σ1 − σ2)/σ1 = (1 − 0.985)/1 = 0.015. According to Equation (10), the buckling coefficient k2 = 0.564, and therefore
N x 2 , c r = 0.564 π 2 D c 2

2.3. Uniform Compression Beam Model with Two Simply Supported Sides and Two Free Sides

In terms of the stress characteristics of the flange, while it experiences equal compression as the deck in Section 2.1, both sides of the flange remain free as they are not supported. Moreover, due to its smaller width–thickness ratio compared to the deck, the thin plate theory is not applicable, and a beam buckling model is more suitable. Therefore, considering its size, constraint form, and stress distribution, the flange is treated as a beam to account for the buckling force. According to Euler’s formula,
P x 3 , c r = π 2 E I a 2
When the flange width is e, the plate thickness is t, and the flange width is greater than the plate thickness, Equation (13) can be written as Equation (14):
P x 3 , c r = π 2 E a 2 × e t 3 12

2.4. Ultimate Strength of Uniform and Non-Uniform Compression Plate Models under High-Temperature Conditions
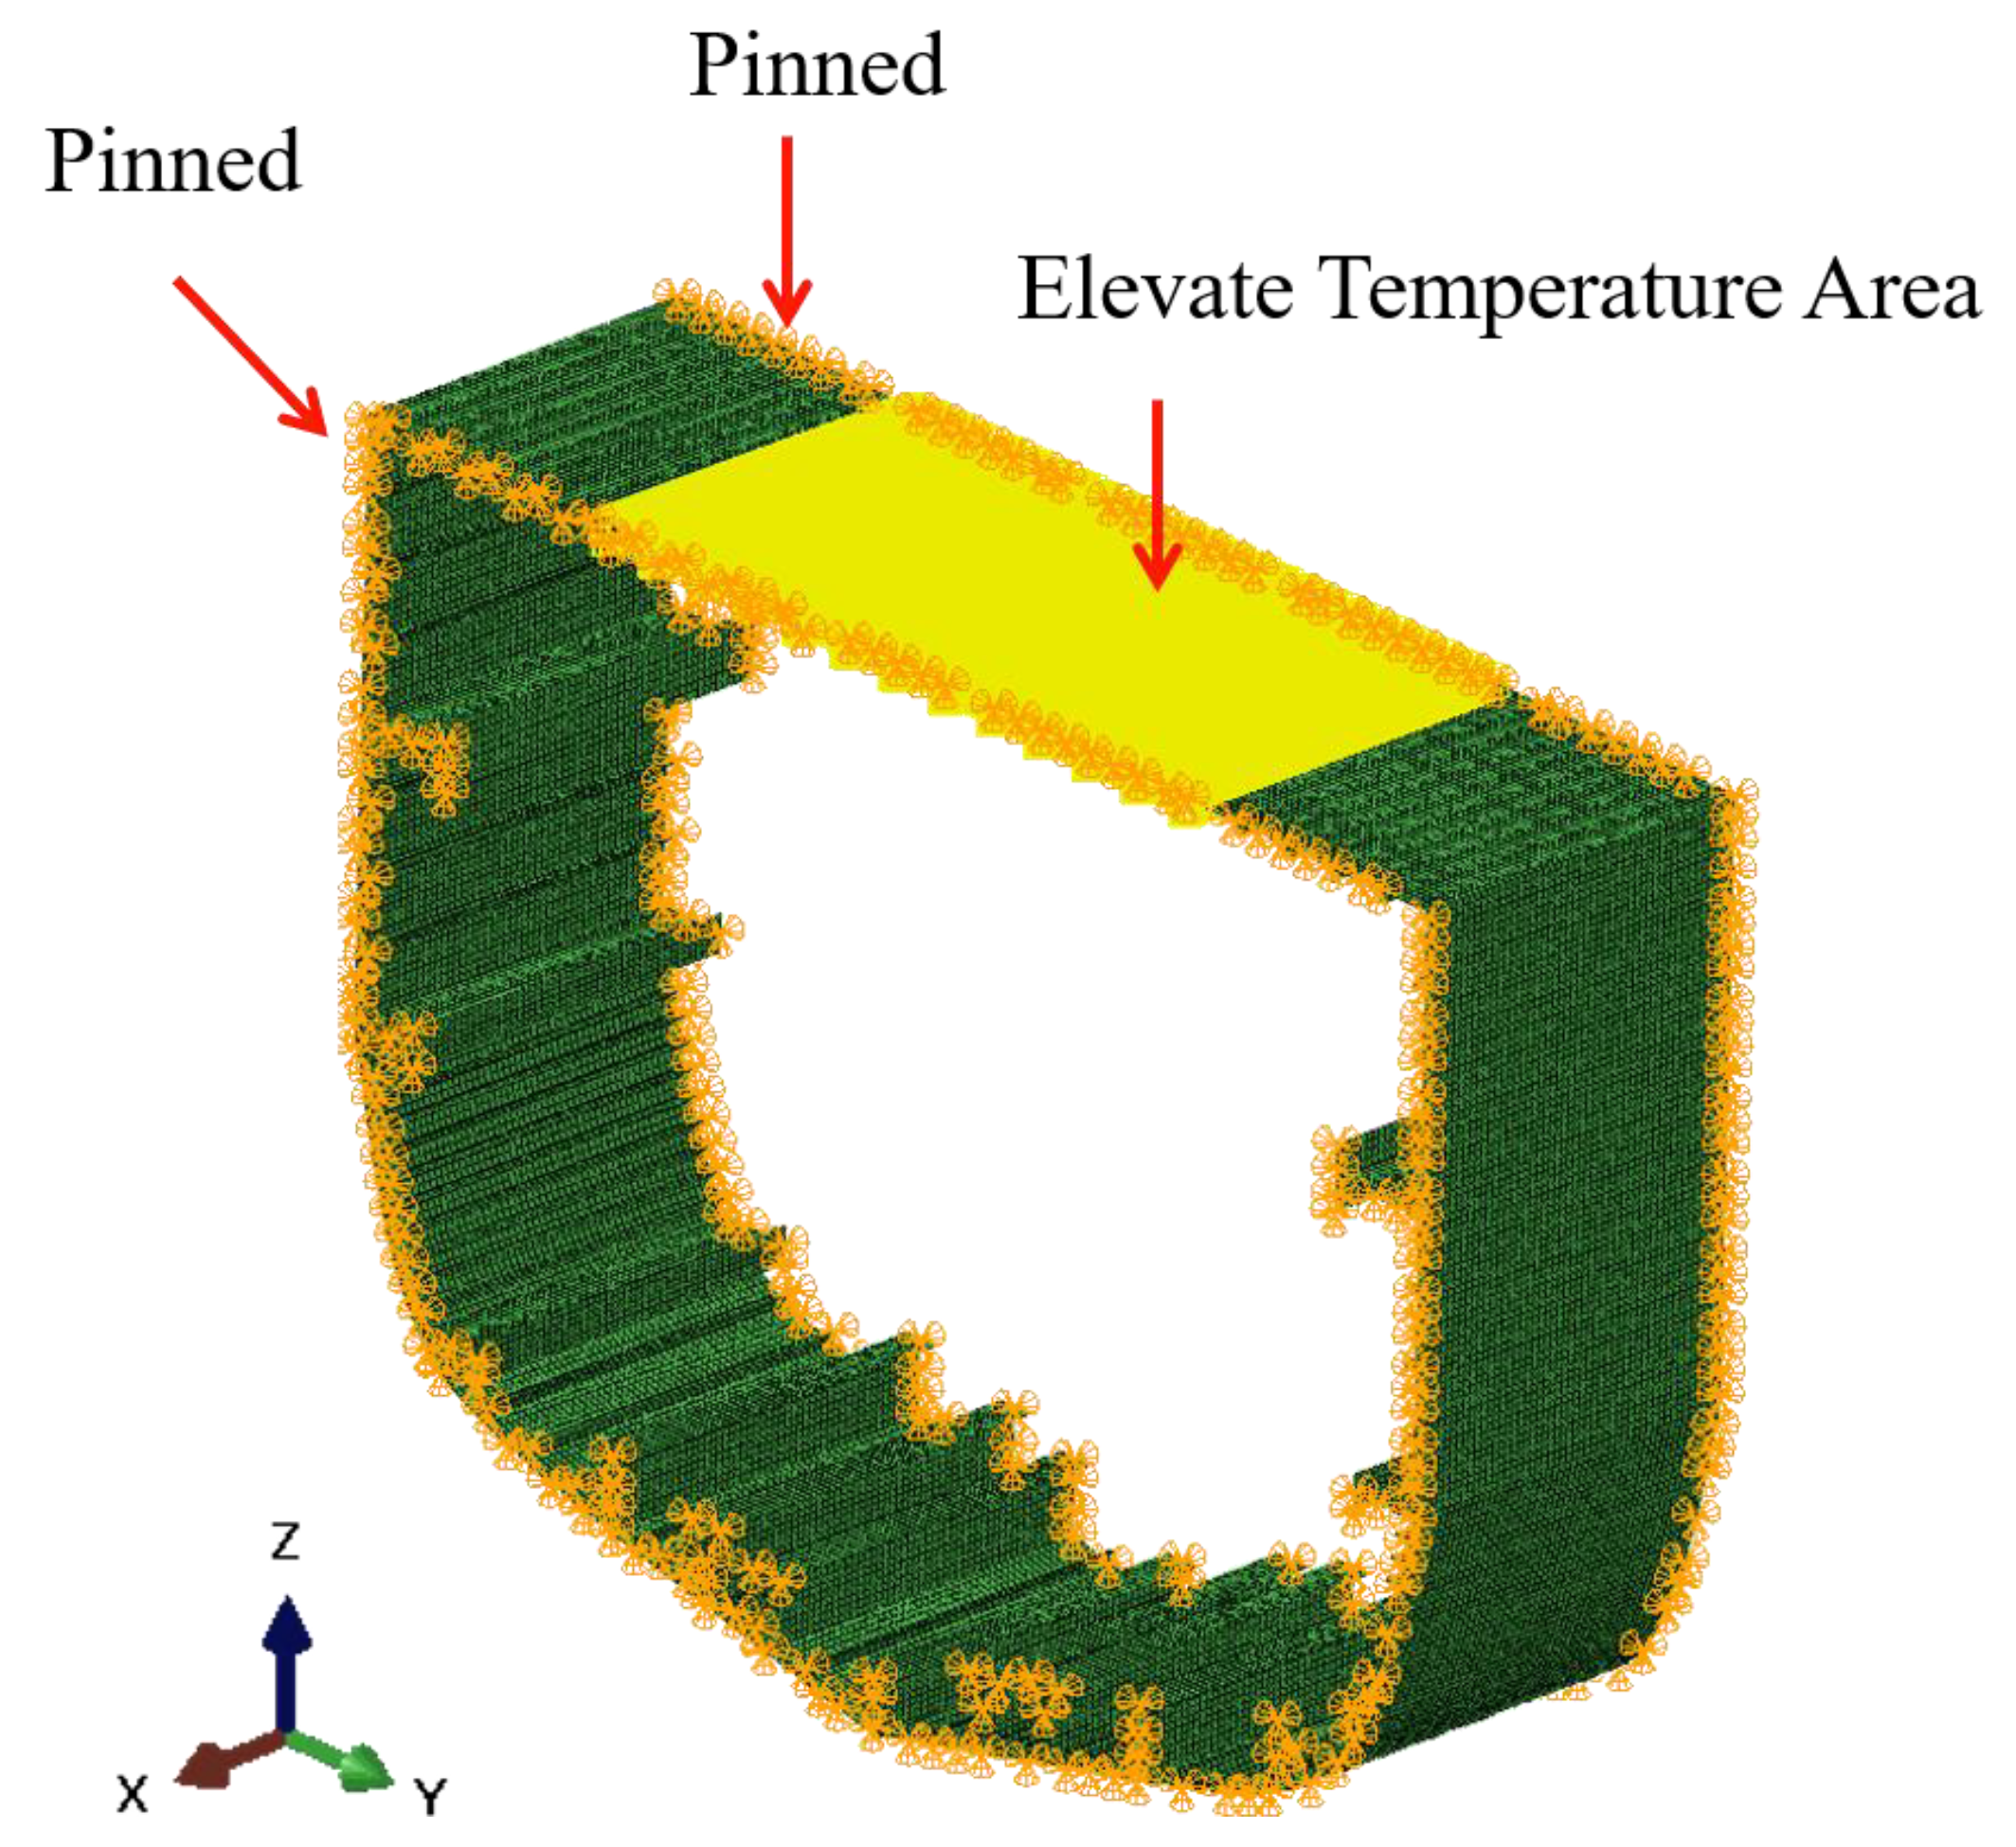
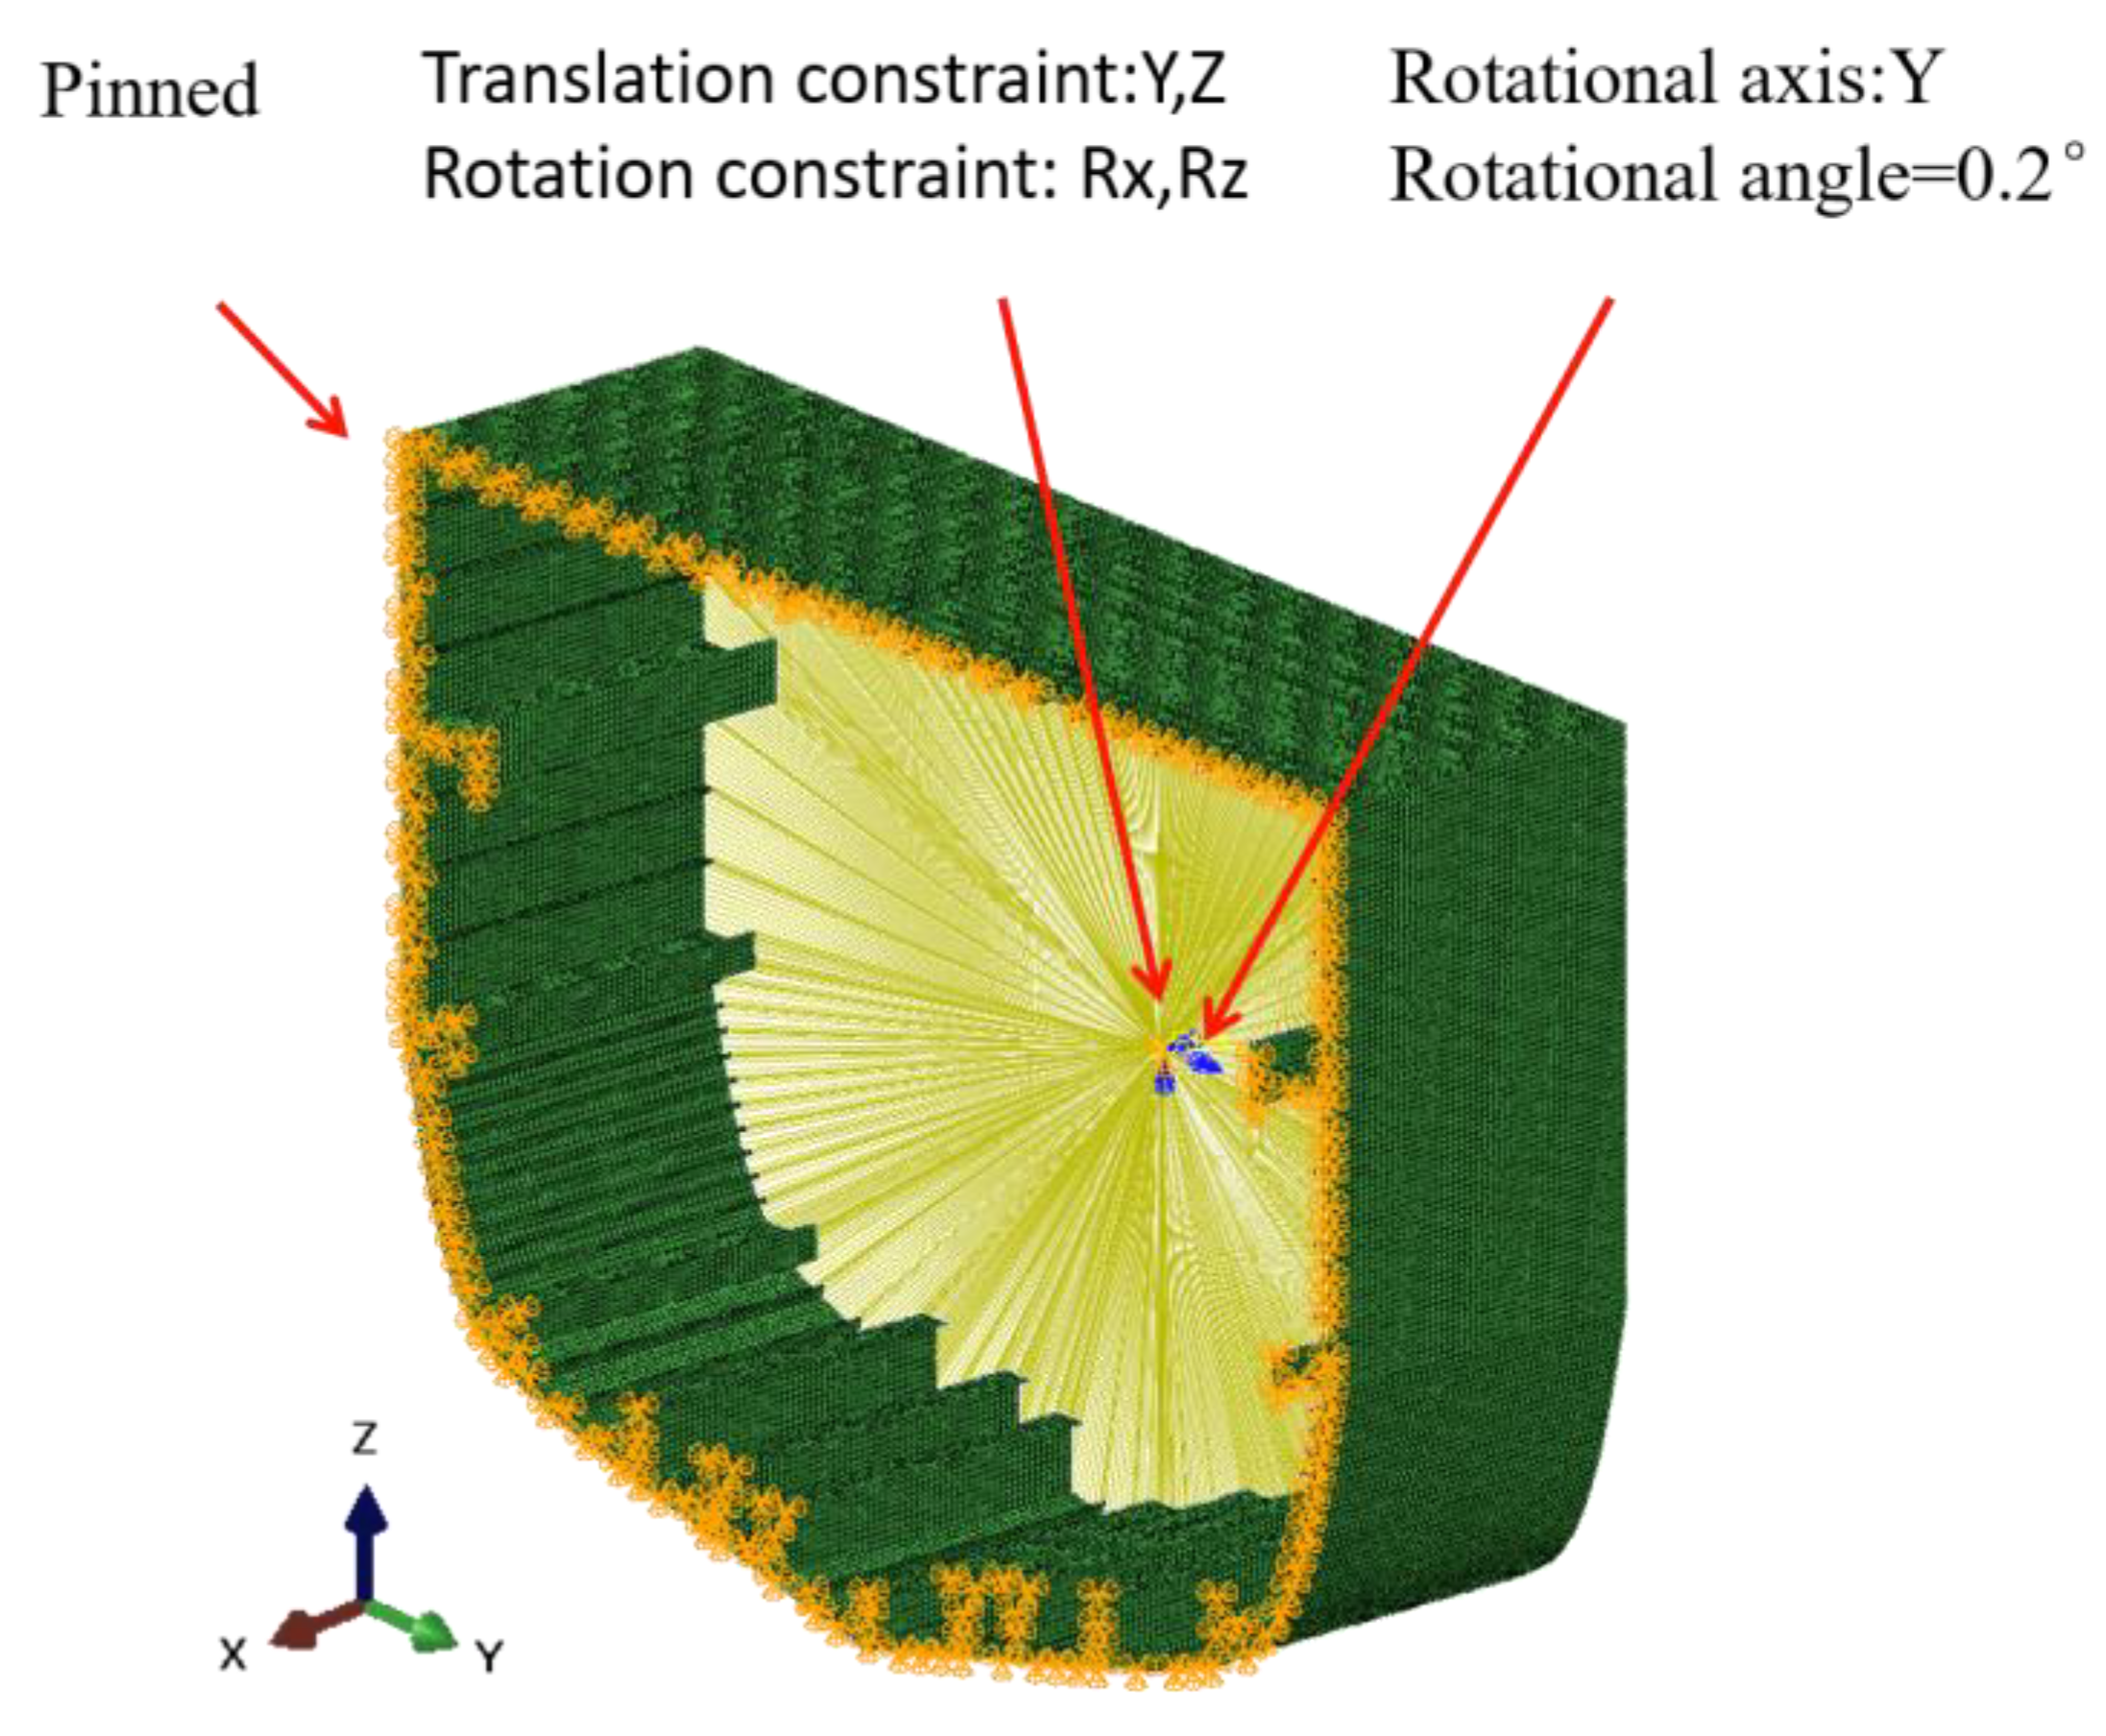
The hull of Figure 4 comprises H36 steel, characterized by a Young’s modulus of 206 GPa and a Poisson’s ratio of 0.3 under normal temperature conditions. To model the evolution of material properties with temperature, one can refer to the recommended data of the American Institute of Steel Construction Specification Committee (AISC) [48]. Figure 5 illustrates the elastic modulus along with its fitting curve, in line with AISC data.
According to the curve of the elastic modulus measured by AISC as a function of temperature, the fitting equations for elastic modulus in different temperature ranges can be established:
E T = 206 0.257 T + 252.87 0.385 T + 328.12 0.054 T + 65.28           0 < T 200 200 < T 600 600 < T 800 800 < T 1200
According to Equation (15) and stiffness coefficient of the plate D = E t 3 12 1 μ 2 Nx1,cr,min as shown in Equation (16):
N x 1 , c r , m i n = 4 π 2 b 2 · 206 · t 3 12 ( 1 μ 2 )           0 < T 200 4 π 2 b 2 · ( 0.257 T + 252.87 ) · t 3 12 ( 1 μ 2 ) 200 < T 600 4 π 2 b 2 · ( 0.385 T + 328.12 ) · t 3 12 ( 1 μ 2 ) 600 < T 800 4 π 2 b 2 · ( 0.054 T + 65.28 ) · t 3 12 ( 1 μ 2 ) 800 < T 1200
Uniform buckling stress σx1,cr,min is shown in Equations (17) and (18):
σ x 1 , c r , m i n = N x 1 , c r , min t
σ x 1 , c r , m i n = 4 π 2 b 2 · 206 · t 2 12 ( 1 μ 2 )           0 < T 200 4 π 2 b 2 · ( 0.257 T + 252.87 ) · t 2 12 ( 1 μ 2 ) 200 < T 600 4 π 2 b 2 · ( 0.385 T + 328.12 ) · t 2 12 ( 1 μ 2 ) 600 < T 800 4 π 2 b 2 · ( 0.054 T + 65.28 ) · t 2 12 ( 1 μ 2 ) 800 < T 1200
Similarly to Equation (16), Nx2,cr is as shown in Equation (19):
N x 2 , c r = 0.564 π 2 c 2 · 206 · t 3 12 ( 1 μ 2 )           0 < T 200 0.564 π 2 c 2 · ( 0.257 T + 252.87 ) · t 3 12 ( 1 μ 2 ) 200 < T 600 0.564 π 2 c 2 · ( 0.385 T + 328.12 ) · t 3 12 ( 1 μ 2 ) 600 < T 800 0.564 π 2 c 2 · ( 0.054 T + 65.28 ) · t 3 12 ( 1 μ 2 ) 800 < T 1200
Non-uniform buckling stress σx2,cr is shown in Equations (20) and (21):
σ x 2 , c r = N x 2 , c r t
σ x 2 , c r = 0.564 π 2 c 2 · 206 · t 2 12 ( 1 μ 2 )           0 < T 200 0.564 π 2 c 2 · ( 0.257 T + 252.87 ) · t 2 12 ( 1 μ 2 ) 200 < T 600 0.564 π 2 c 2 · ( 0.385 T + 328.12 ) · t 2 12 ( 1 μ 2 ) 600 < T 800 0.564 π 2 c 2 · ( 0.054 T + 65.28 ) t 2 12 ( 1 μ 2 ) 800 < T 1200
The formula for buckling stress for flange is shown in Equations (22) and (23):
σ x 3 , c r = P x 3 , c r A = P x 3 , c r e t
σ x 3 , c r = t 2 12 · π 2 a 206           0 < T 200 t 2 12 · π 2 a · ( 0.257 T + 252.87 ) 200 < T 600 t 2 12 · π 2 a · ( 0.385 T + 328.12 ) 600 < T 800 t 2 12 · π 2 a · 0.054 T + 65.28 800 < T 1200
C.S. Smith proposed the Smith method to discretize the hull into multiple elements and assumed that these elements did not affect each other [2]. Although the basic structure of the hull is stiffened plates, stiffened plates can be discretized into multiple plate elements, as shown in Figure 6.
The key of Smith’s method is to obtain the correct stress–strain curve of the element. Taking Reference [43] as an example, it can be found that the force and displacement curve of the plate under pressure at high temperature in Figure 7 shows an approximate linear relationship between force and displacement before the buckling force reaches its maximum value. When the maximum is reached, it approximately presents a “flat area” phenomenon, and with the increase in temperature, the gentler the force is after reaching the maximum.
Based on the characteristics of force and displacement of the elements under various temperature conditions in the experiment, to obtain the maximum buckling stress, we utilize Equations (24)–(26) under the assumption of linear stress–strain behavior before reaching the maximum buckling stress. Additionally, after reaching the maximum stress, keep the stress constant while performing calculations at a very small strain Δε.
σ x 1 = σ x 1 , c r , min 0.005 · ε 0 < ε < 0.005 σ x 1 , c r , min 0.005 ε < ε + Δ ε
σ x 2 = σ x 2 , c r 0.005 · ε 0 < ε < 0.005 σ x 2 , c r 0.005 ε < ε + Δ ε
σ x 3 = σ x 3 , c r 0.005 · ε 0 < ε < 0.005 σ x 3 , c r 0.005 ε < ε + Δ ε
The operational sequence of the fire Smith method is depicted in Figure 8. First, given the value of element number i, a temperature matrix is constructed according to the temperature distribution. According to Equations (24)–(26), the stress calculation formula of which temperature range the current element is applicable to is determined, and the stress value corresponding to the current temperature is calculated. Assuming the buckling strain value is 0.005, the stress–strain curve of the current temperature is obtained. The process then proceeds to initialize the curvature and incrementally raise the curvature value. As the curvature value increases, the concurrent strain increment is calculated, in turn determining the current stress value as per the stress–strain relationship, and then calculating the magnitude of the force. The moment is assessed at the neutral axis, followed by a reevaluation of the neutral axis position. Upon detecting the amalgamated force, neutral axis position, curvature magnitude, and unit number that aligns with the predefined criteria, the bending moment value for the unit is output.

3. Simulation Setup

According to the principle of oxygen consumption, alkane combustibles consume 1 kg of oxygen to release heat, which is approximately 13.6 MJ/kg [49]. Therefore, it is assumed that under the condition of a closed and insulated compartment, the sum of heat received by the top of an oxygen compartment that consumes the same mass is equal. The purpose of working condition design is to study the ultimate strength characteristics and effects of ship hulls in different regions with the same heat distribution.
Using the ABAQUS thermal coupling method, the influence of distinct top decks being exposed to oil pool fires is calculated. For smaller-scale oil pools, the fire source area is smaller, the combustion time is longer, and the ignition area is limited, resulting in extended combustion durations, concentrated temperatures, and higher temperature levels. In contrast, larger oil pools exhibit expanded ignition areas, shorter combustion times, dispersed temperatures, and lower temperature levels. To analyze the ultimate strength of the ship under different heating conditions and verify the feasibility of the Smith method under fire conditions, 64 sets of ultimate strength calculations under fire conditions were carried out. We assumed an oxygen consumption coefficient denoted as D; the heating zone width as W as shown in Figure 9; and the temperature T, which can be represented as D = W × T. This approach facilitates the exploration of ultimate strength attenuation patterns in ship hulls under differing heating zone widths W and temperatures T. The working condition settings are detailed in Table 1. Figure 9a shows a small-scale oil pool fire. Assuming a heated area length above the fire source of W = 1 m, the ultimate strength characteristics of the hull at different temperatures were studied. Figure 9b shows a medium-sized oil pool fire scenario with the heated area above the fire source at W = 2 m. Under conditions of equivalent oxygen consumption, the temperature of heating the deck with the same heat was half that of W = 1 m. By analogy, Figure 9c,d shows large and larger oil pool fires, assuming that the deck temperatures of W = 3 m and W = 4 m were 1/3 and 1/4 of W = 1 m, respectively, under the same oxygen consumption.
The calculation of hull ultimate strength at high temperature was divided into two steps: thermal-mechanical coupling calculation and explicit dynamics calculation. Coupled temp-displacement load step was used. The boundary condition definition is shown in Figure 10. The temperature load was applied above the deck using simply supported boundary conditions at both ends. The element type was S4RT, and the amplitude curves used to define the temperature followed the equally spaced method.
After completing the thermal-mechanical coupling calculation, in order to consider the structural deformation caused by temperature stress, the deformed structure was used as the model output for explicit dynamic analysis, and a predefined field method was used to apply the temperature field to the structure. In explicit dynamic analysis, the elements type is S4RT, and the boundary conditions are shown in Figure 11. One end was constrained by a simple support, while the other end was constrained by a coupling method that constrains movement in the Y and Z directions, as well as rotation in the X and Z directions, and applies rotation around the Y axis to the entire plane with a rotation angle of 0.2°. The ultimate high-temperature strength was obtained by outputting the bending moment value.

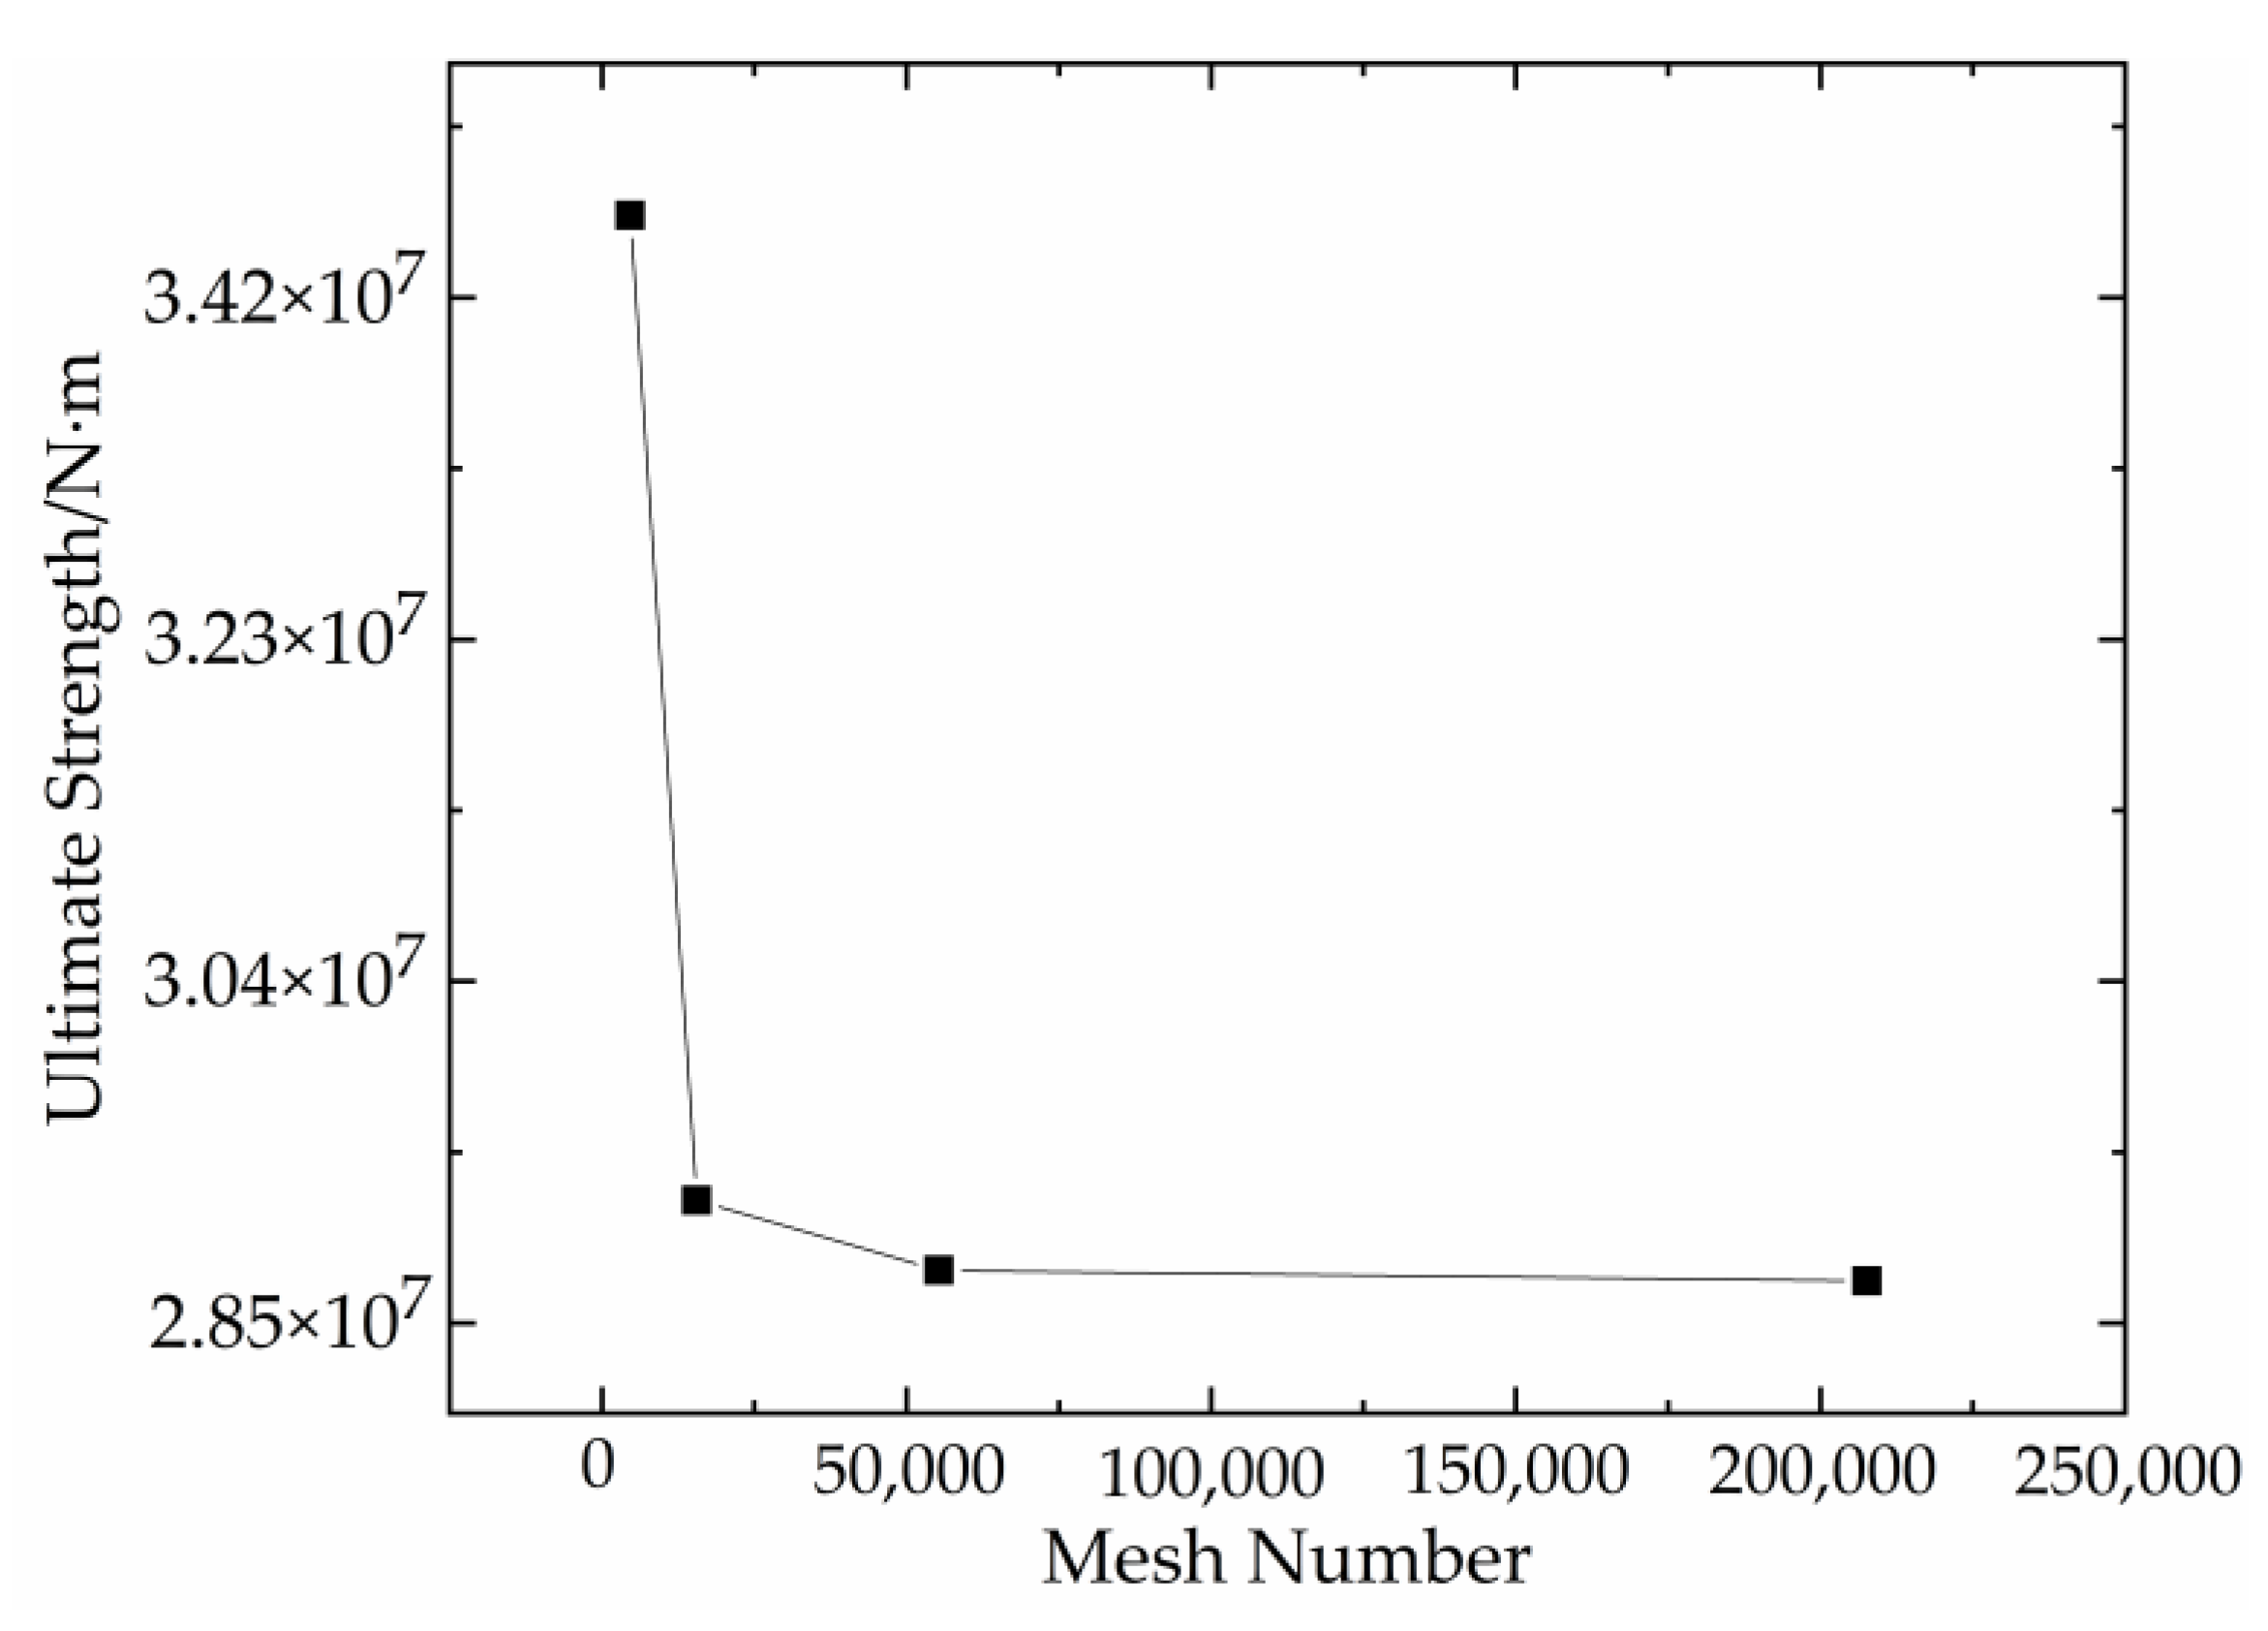
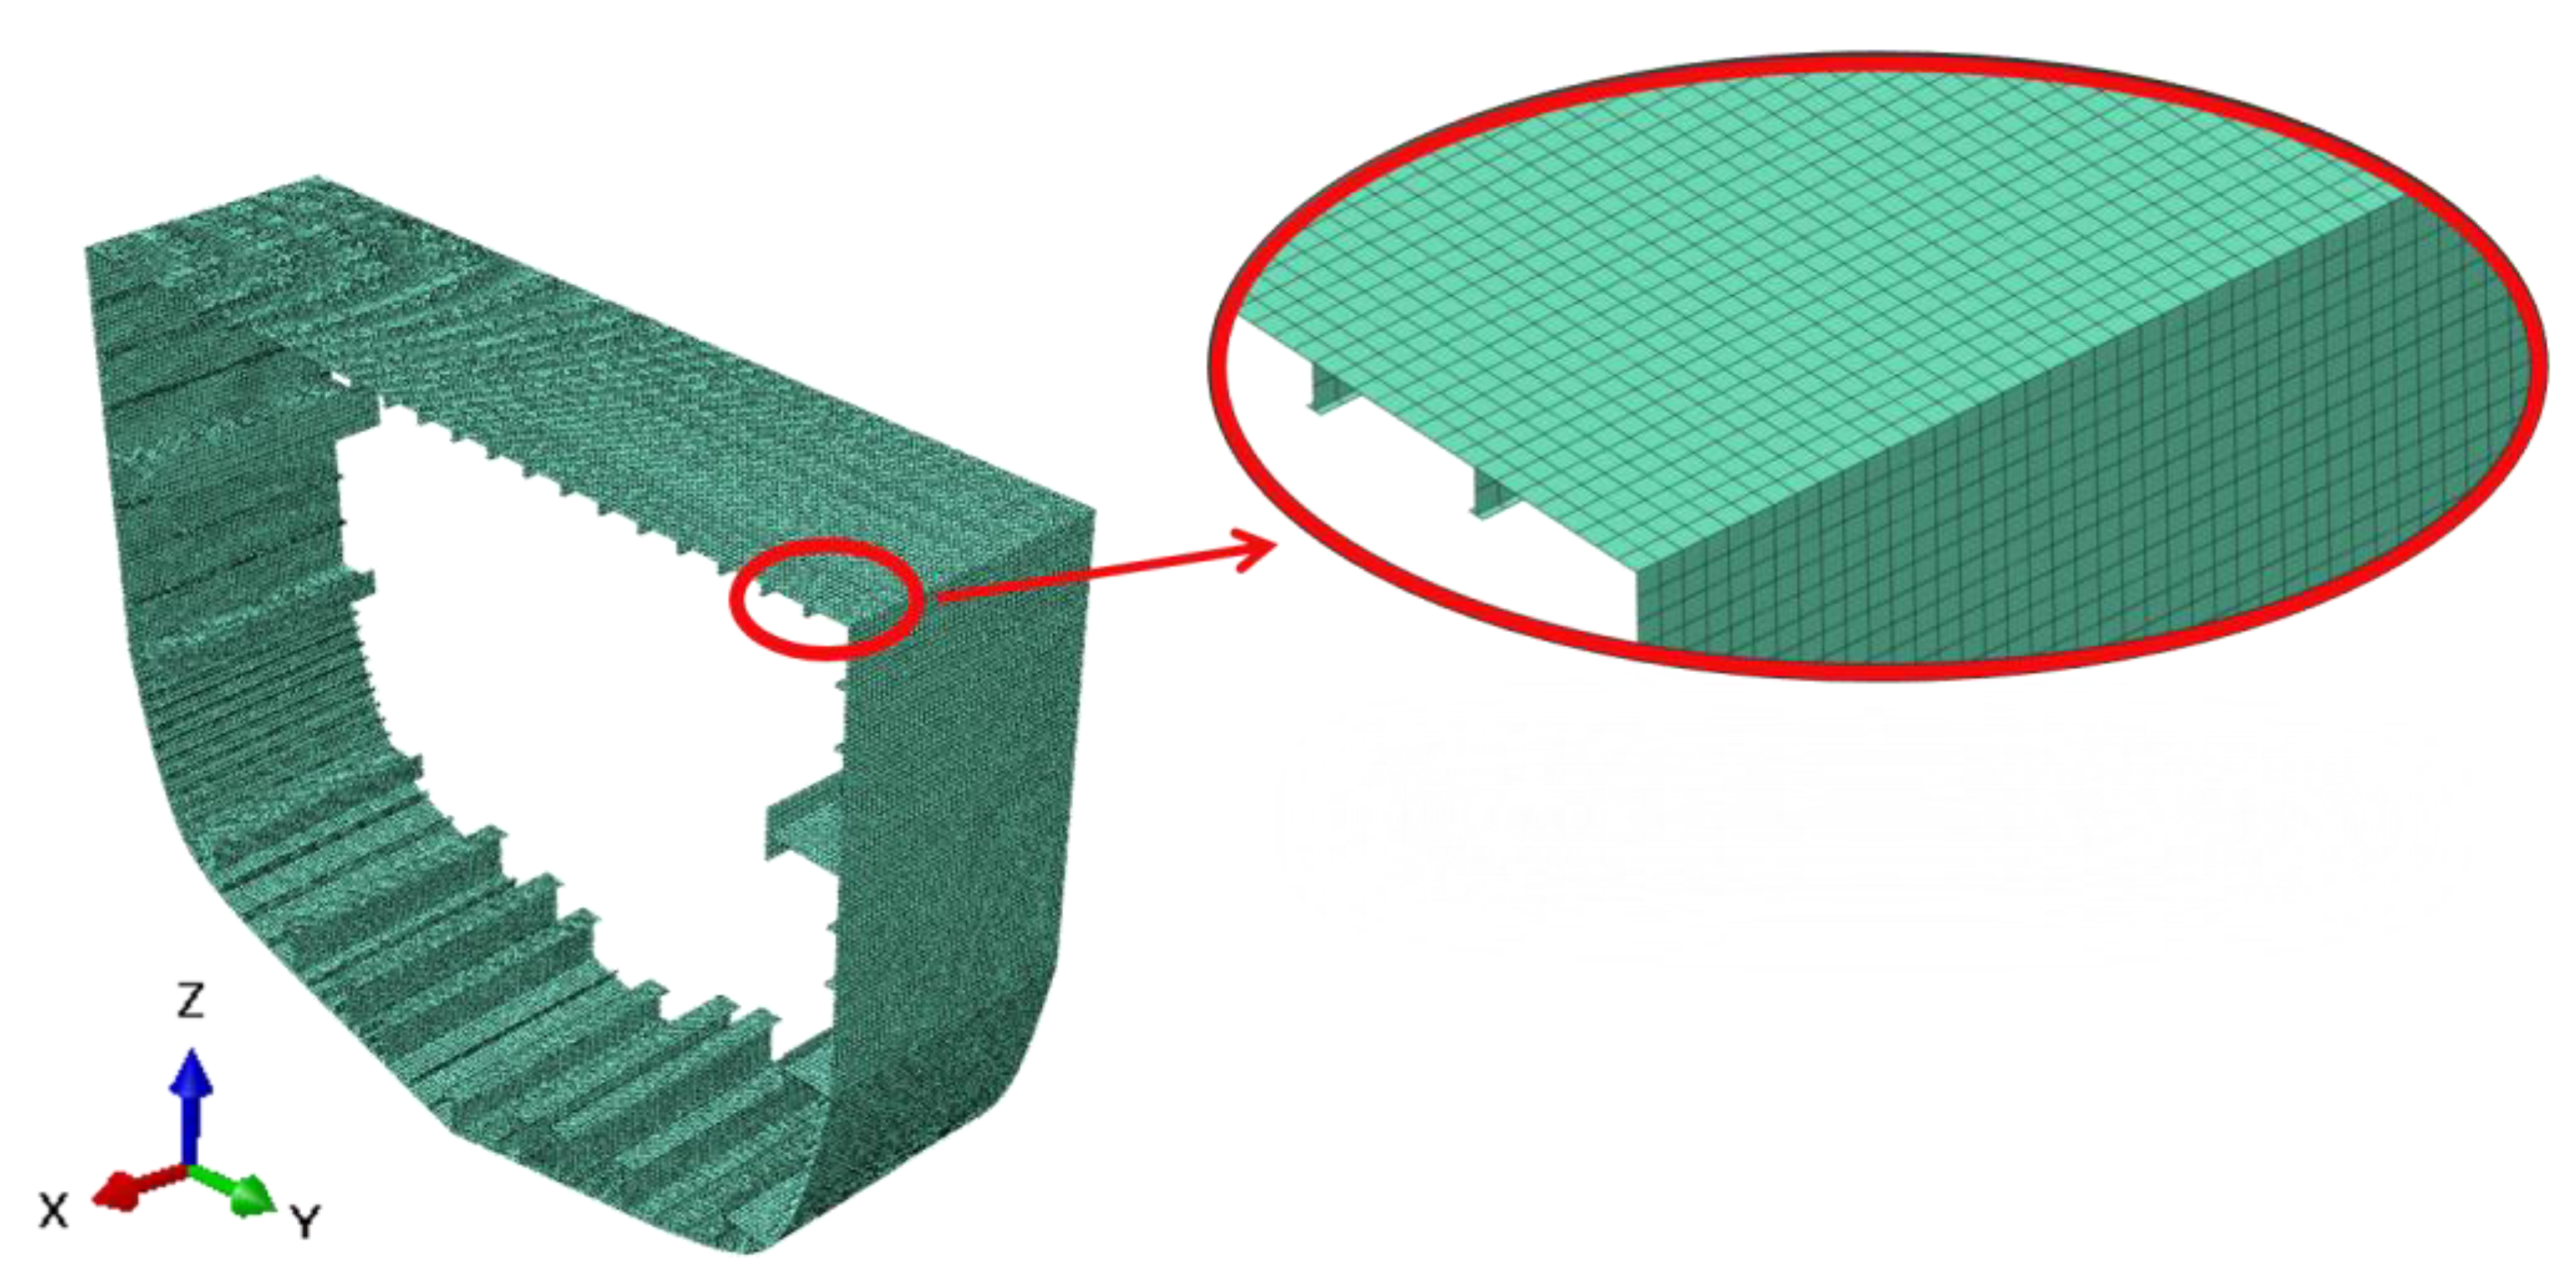
4. Mesh Sensitivity Analysis

The mesh employed in a finite element model significantly influences the analysis outcomes. With the increase in the number of meshes, the results generally converge. Generally speaking, with the increase in the number of meshes, the calculation results gradually converge but at the same time, and the calculation amount increases, so it is important to correctly grasp the number of meshes and the accuracy of the calculation results. In order to verify the mesh sensitivity of the ultimate strength value of frigates, for the mesh sizes of 0.08 m, 0.04 m, 0.02 m, and 0.01 m, the total number of meshes were 6058, 15,575, 55,300, and 207,700 respectively. As shown in Figure 12, the ultimate strength of frigates with different mesh sizes was calculated, and it was found that the ultimate strength decreased with the increase in the number of meshes, and the ultimate strengths of different meshes were 3.465 × 10⁷ N·m, 2.918 × 10⁷ N·m, 2.879 × 10⁷ N·m, and 2.873 × 10⁷ N·m, respectively.
In order to ensure the accuracy of the calculation results and consider the calculation speed, the frigate’s mesh configuration is illustrated in Figure 13, featuring both an overall view and an enlarged section. The overall mesh size of the frigate was 0.02 m, and the mesh type was square with a total of 55,300 elements.

5. Results

Figure 14 shows typical failure modes under different high temperature conditions. The deformation of the top deck due to thermal expansion at high temperatures resulted in a “wave”-shaped failure pattern. Figure 14a is the failure mode of ship hull under the fire condition of a small-scale oil pool, which corresponds to Figure 9a. It can be found that the top high-temperature area presented a “wave”-shaped deformation under the conditions of fire load and compression load. Figure 14b is the ultimate state of ship fire under the condition of a medium-sized oil pool, which corresponds to Figure 9b. Compared with Figure 14a,b, it can be found that with the increase in the high-temperature area, the “wave-like” deformation area was larger, being caused by the larger structural deformation area caused by high fire temperature, which leads to a more decline in the ultimate strength of a ship. Similarly, Figure 14c,d shows the hull failure mode under the conditions of a large-scale oil pool fire and larger-scale oil pool fire. It can be found that due to the high temperature, the “wave-like” deformation gradually spread to the whole deck, which led to a further decrease in ultimate strength.
Figure 15 shows the ultimate strength of high-temperature regions with lengths of 1 m, 2 m, 3 m, and 4 m under different temperature conditions. It can be seen that with the increase in temperature, the ultimate strength showed a downward trend. When the length of the high-temperature area was 1 m, the ultimate strength of the small-scale oil pool fire in Figure 9a decreased rapidly with the temperature, and then tended to be flat, as shown in Figure 15a. Figure 15b shows the change of the ultimate strength of the large-scale oil pool fire in Figure 9b with temperature. Notably, the onset of decline in the ultimate strength was observed at around 200 °C, marked by an accelerated rate of decrease. Similar to Figure 15c,d, it showed large-scale and larger-scale oil pool fires, that is, when the length of the heating zone was 4 m, the ultimate strength needed more oxygen to start to decline, and it showed a rapid downward trend with the temperature change.
To further analyze the ultimate strength characteristics of ships under fire conditions, the maximum ultimate strength at different temperatures was plotted in Figure 16. The fire Smith method was used to calculate and simulate the same temperature conditions as shown in the Figure 16. By comparing the maximum value of the ultimate strength of each working condition calculated by the fire Smith method and the simulation in Figure 16 and Table 2, it was found that the error between the simulation calculation and the fire Smith method was about 9.5%. The sources of the maximum error value point were the W1 simulation calculation value and the fire smith method when T × W = 16. The reason was that with the increase in temperature, the influence of plasticity on ultimate strength increased gradually, while the smith result of fire with elastic buckling failure was less than that of the simulation calculation. It can provide a reference for the assessment of the ultimate buckling strength of a fire hull.
As shown in Figure 17, a comparison of maximum ultimate strength values for different high-temperature regions revealed several key characteristics: (1) The ultimate strength of the ship remained relatively stable until the temperature reached 200 °C. For the heating zone W1 = 1 m, less oxygen was required to reach 200 °C, so less oxygen was required to reduce the ultimate strength. For the case where the heating area W4 = 4 m, due to the larger heating area, more oxygen was required to reach 200 °C in the entire area, resulting in a decrease in ultimate strength requiring more oxygen. A comparison between two sets of working conditions (T × W = 8) revealed that the ultimate strength for W1 was 2.88 × 10⁷ N·m, whereas W 4 exhibited an ultimate strength of 2.57 ×10⁷ N·m, resulting in an approximately 11% decrease for W1. (2) T × W = 12, the heating area W1 = 1 m, and the ultimate strength remained almost unchanged after reaching 1200 °C. However, when the heating area W4 = 4 m, the temperature reached 300 °C, and the ultimate strength was still in a downward trend. (3) For T × W = 16, comparing the four different heating regions, it can be found that W1 had a significant difference in ultimate strength compared to the other three groups due to reaching the temperature threshold. The downward trend of W2, W3, and W4 was similar, with the greater ultimate strength attenuation associated with larger distribution areas. For the same T × W condition, a higher distribution area translated to a more pronounced decrease in ultimate strength.

6. Discussion

On the basis of plate theory and the Smith method, the fire Smith method was proposed. Taking the frigate model as the research object, the simulation calculation was carried out, and it was found that the trend of simulation calculation was consistent with the fire Smith method, so the fire Smith method can be used as a rapid assessment method for hull ultimate strength under fire conditions in engineering.
Based on the principle of oxygen consumption, the same heat is distributed in different high-temperature regions. Through 64 sets of simulation calculations, the ultimate strength characteristics of different high-temperature regions were found. The study showed that the ultimate strength began to decline with lesser oxygen consumption if the high-temperature region was smaller. Conversely, once the temperature reached the threshold, the ultimate strength remained relatively steady. For larger high-temperature regions, ultimate strength decreased with higher oxygen consumption and with a more pronounced attenuation. Comparing high-temperature regions W2, W3, and W4, it was evident that larger distribution areas led to greater ultimate strength reduction. Therefore, based on the ultimate strength characteristics of different high-temperature regions, controlling the fire scale to a smaller range when oxygen consumption is low can effectively reduce the damage of the fire to the ultimate strength of the ship.
In previous studies, many scholars have used experimental and simulation methods to study the ultimate strength of ship hulls under fire conditions. They have found that the ultimate strength gradually decreases with the increase in fire temperature and fire power. However, the evaluation speed of experimental and simulation methods is relatively slow, and they cannot provide a rapid assessment of the ultimate strength of ship hulls during fire disasters. Although this article assumes that the buckling strain and minimum buckling stress of the plate under fire conditions lead to errors in the Smith method and simulation method, the ultimate strength of the ship decreased with the increase in fire temperature, which is consistent with previous studies. It is recommended to further explore failure modes and conduct ultimate strength tests under ship fire conditions to both supplement and validate these findings.

7. Conclusions

In this study, the fire Smith method was put forward based on the Smith method and plate theory, and the frigate in different high-temperature areas was evaluated based on the oxygen consumption theory. Based on the simulation results and fire Smith method, the following conclusions can be drawn:
(1)
In order to quickly evaluate the ultimate strength of ship buckling under fire conditions, a method was proposed based on the Smith method and the plate model. Because there may be a phenomenon that the hull gradually changes from elastic buckling to plasticity, in order to avoid overestimating the ultimate strength of the hull under fire conditions, the elastic buckling equation is used to estimate the ultimate strength value. Although there is a 10% error, it can to some extent avoid overestimating the ultimate strength of the hull before the elastic transition to plasticity, making it safer to evaluate the ultimate strength of the hull in engineering.
(2)
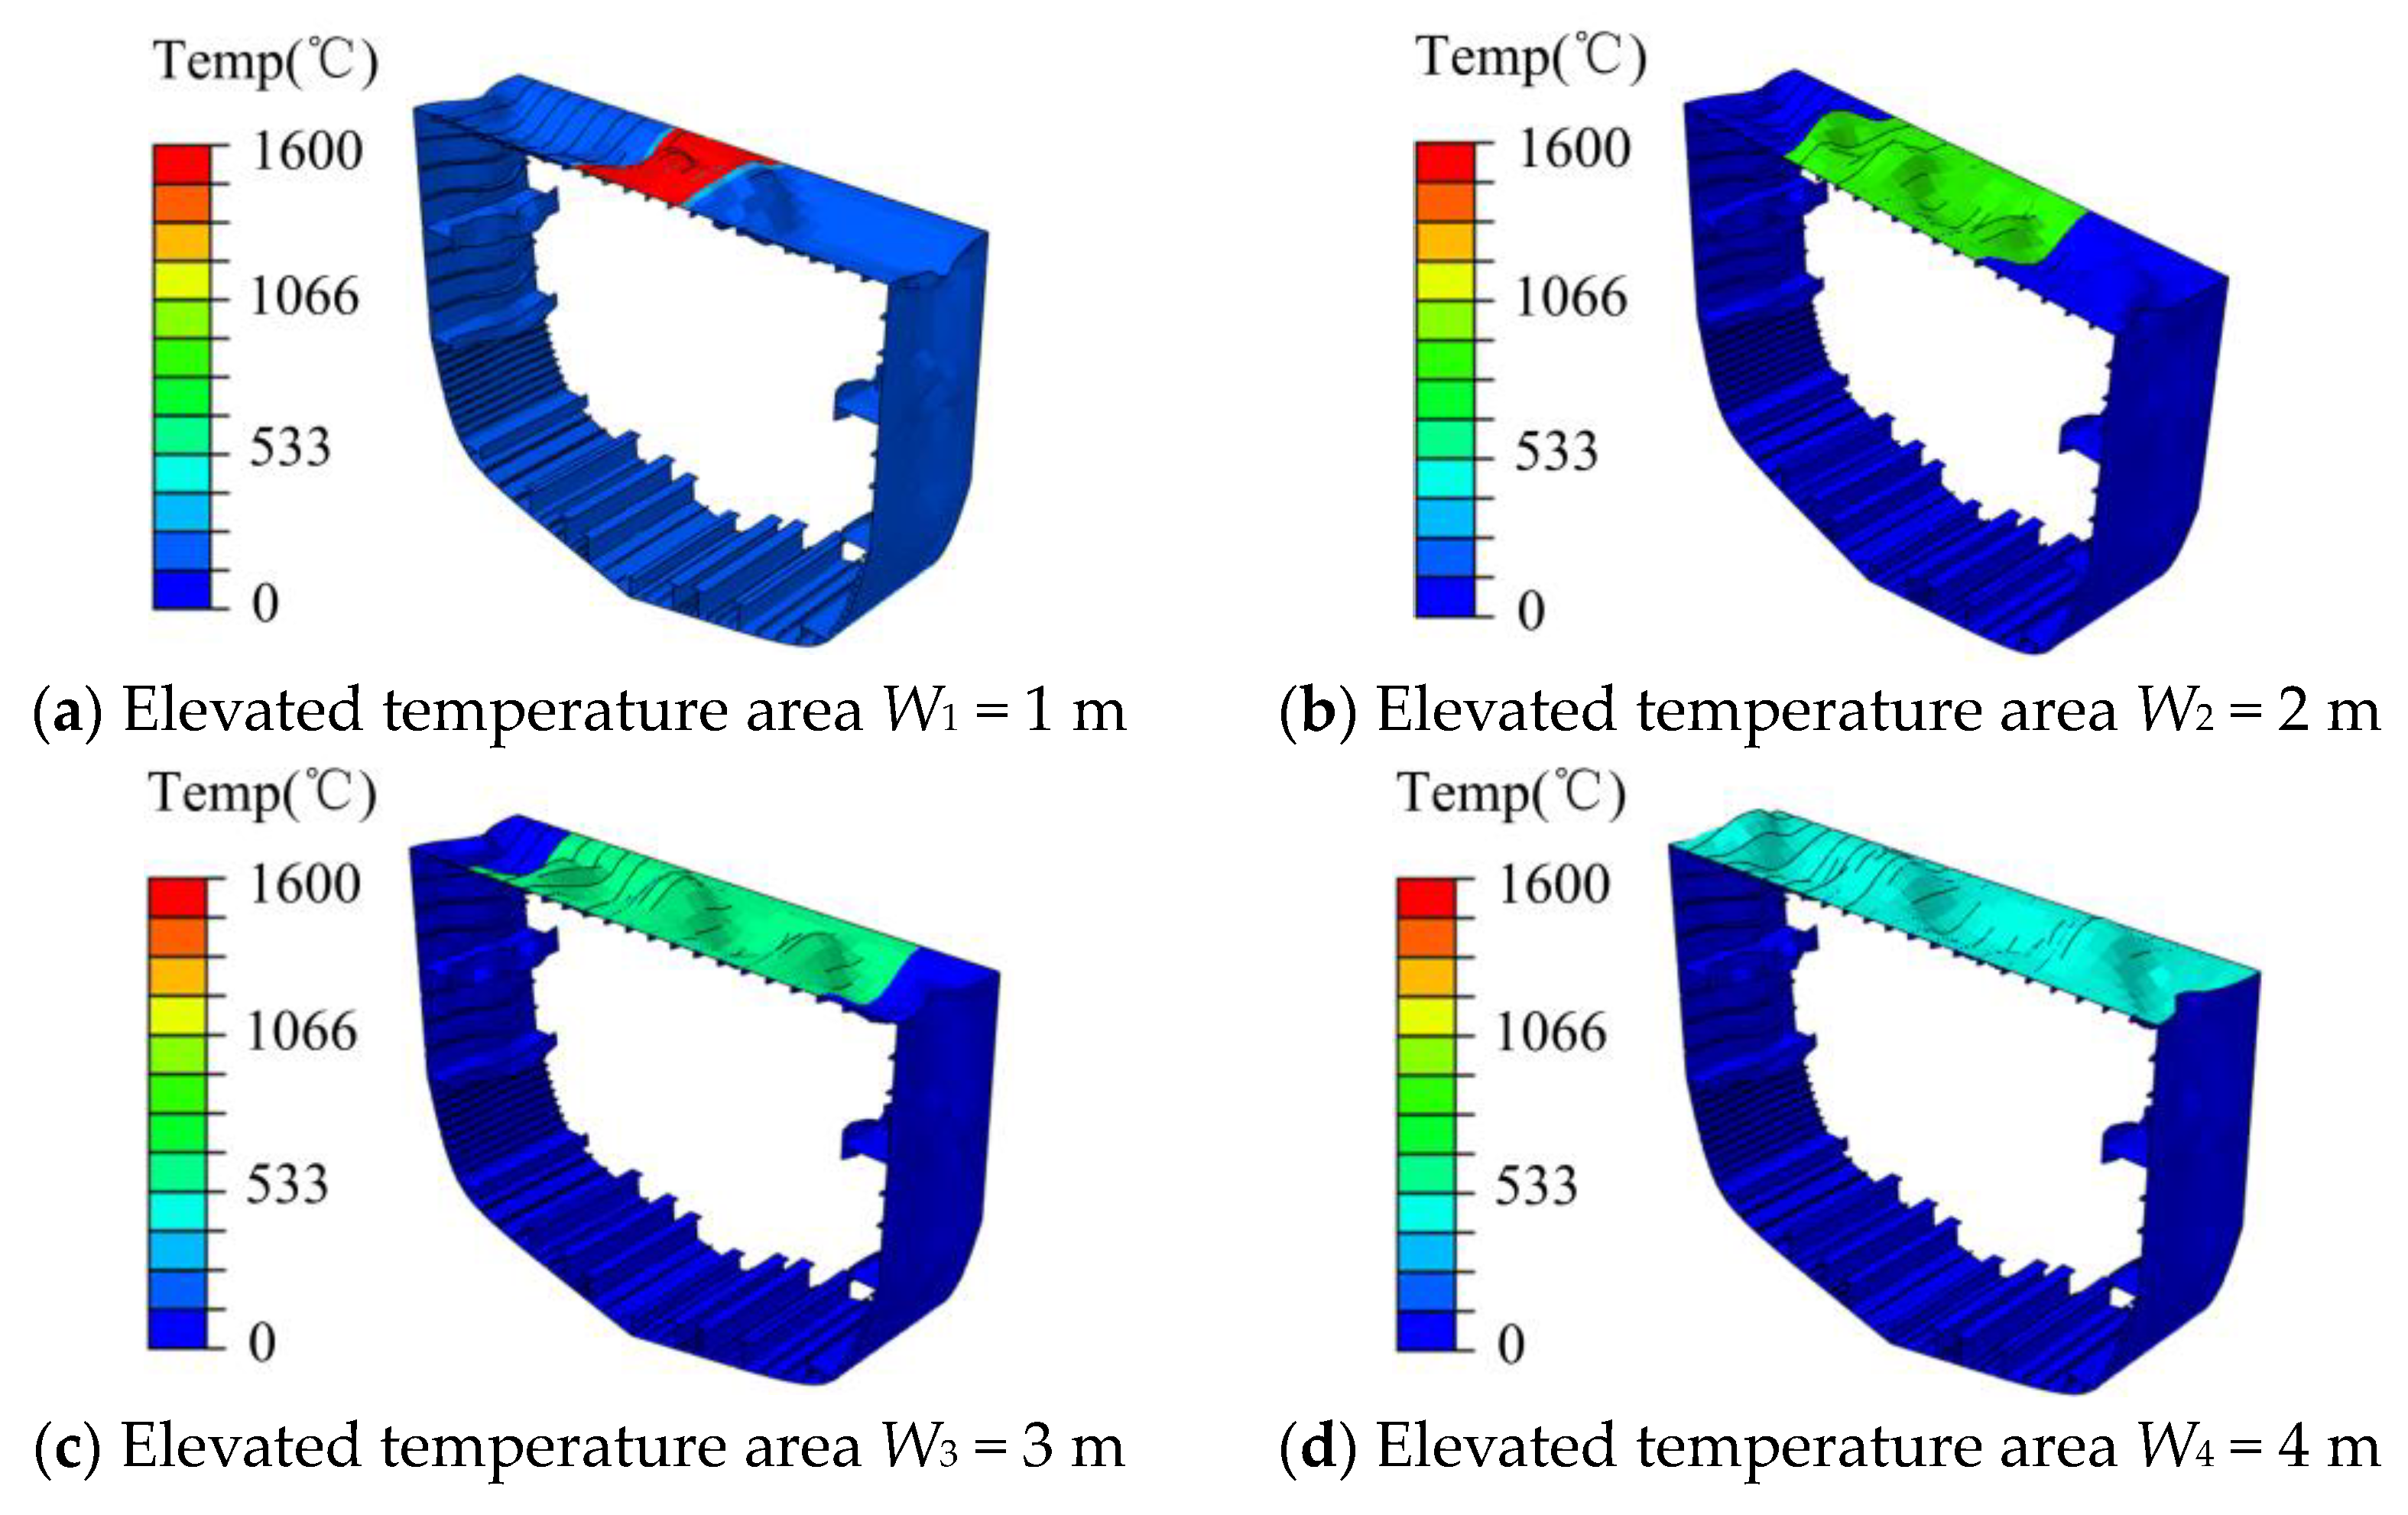
Based on the principle of oxygen consumption, 64 simulations were carried out to study the ultimate strength of different high-temperature regions, and it was found that the high-temperature regions showed a “wavy” failure mode.
(3)
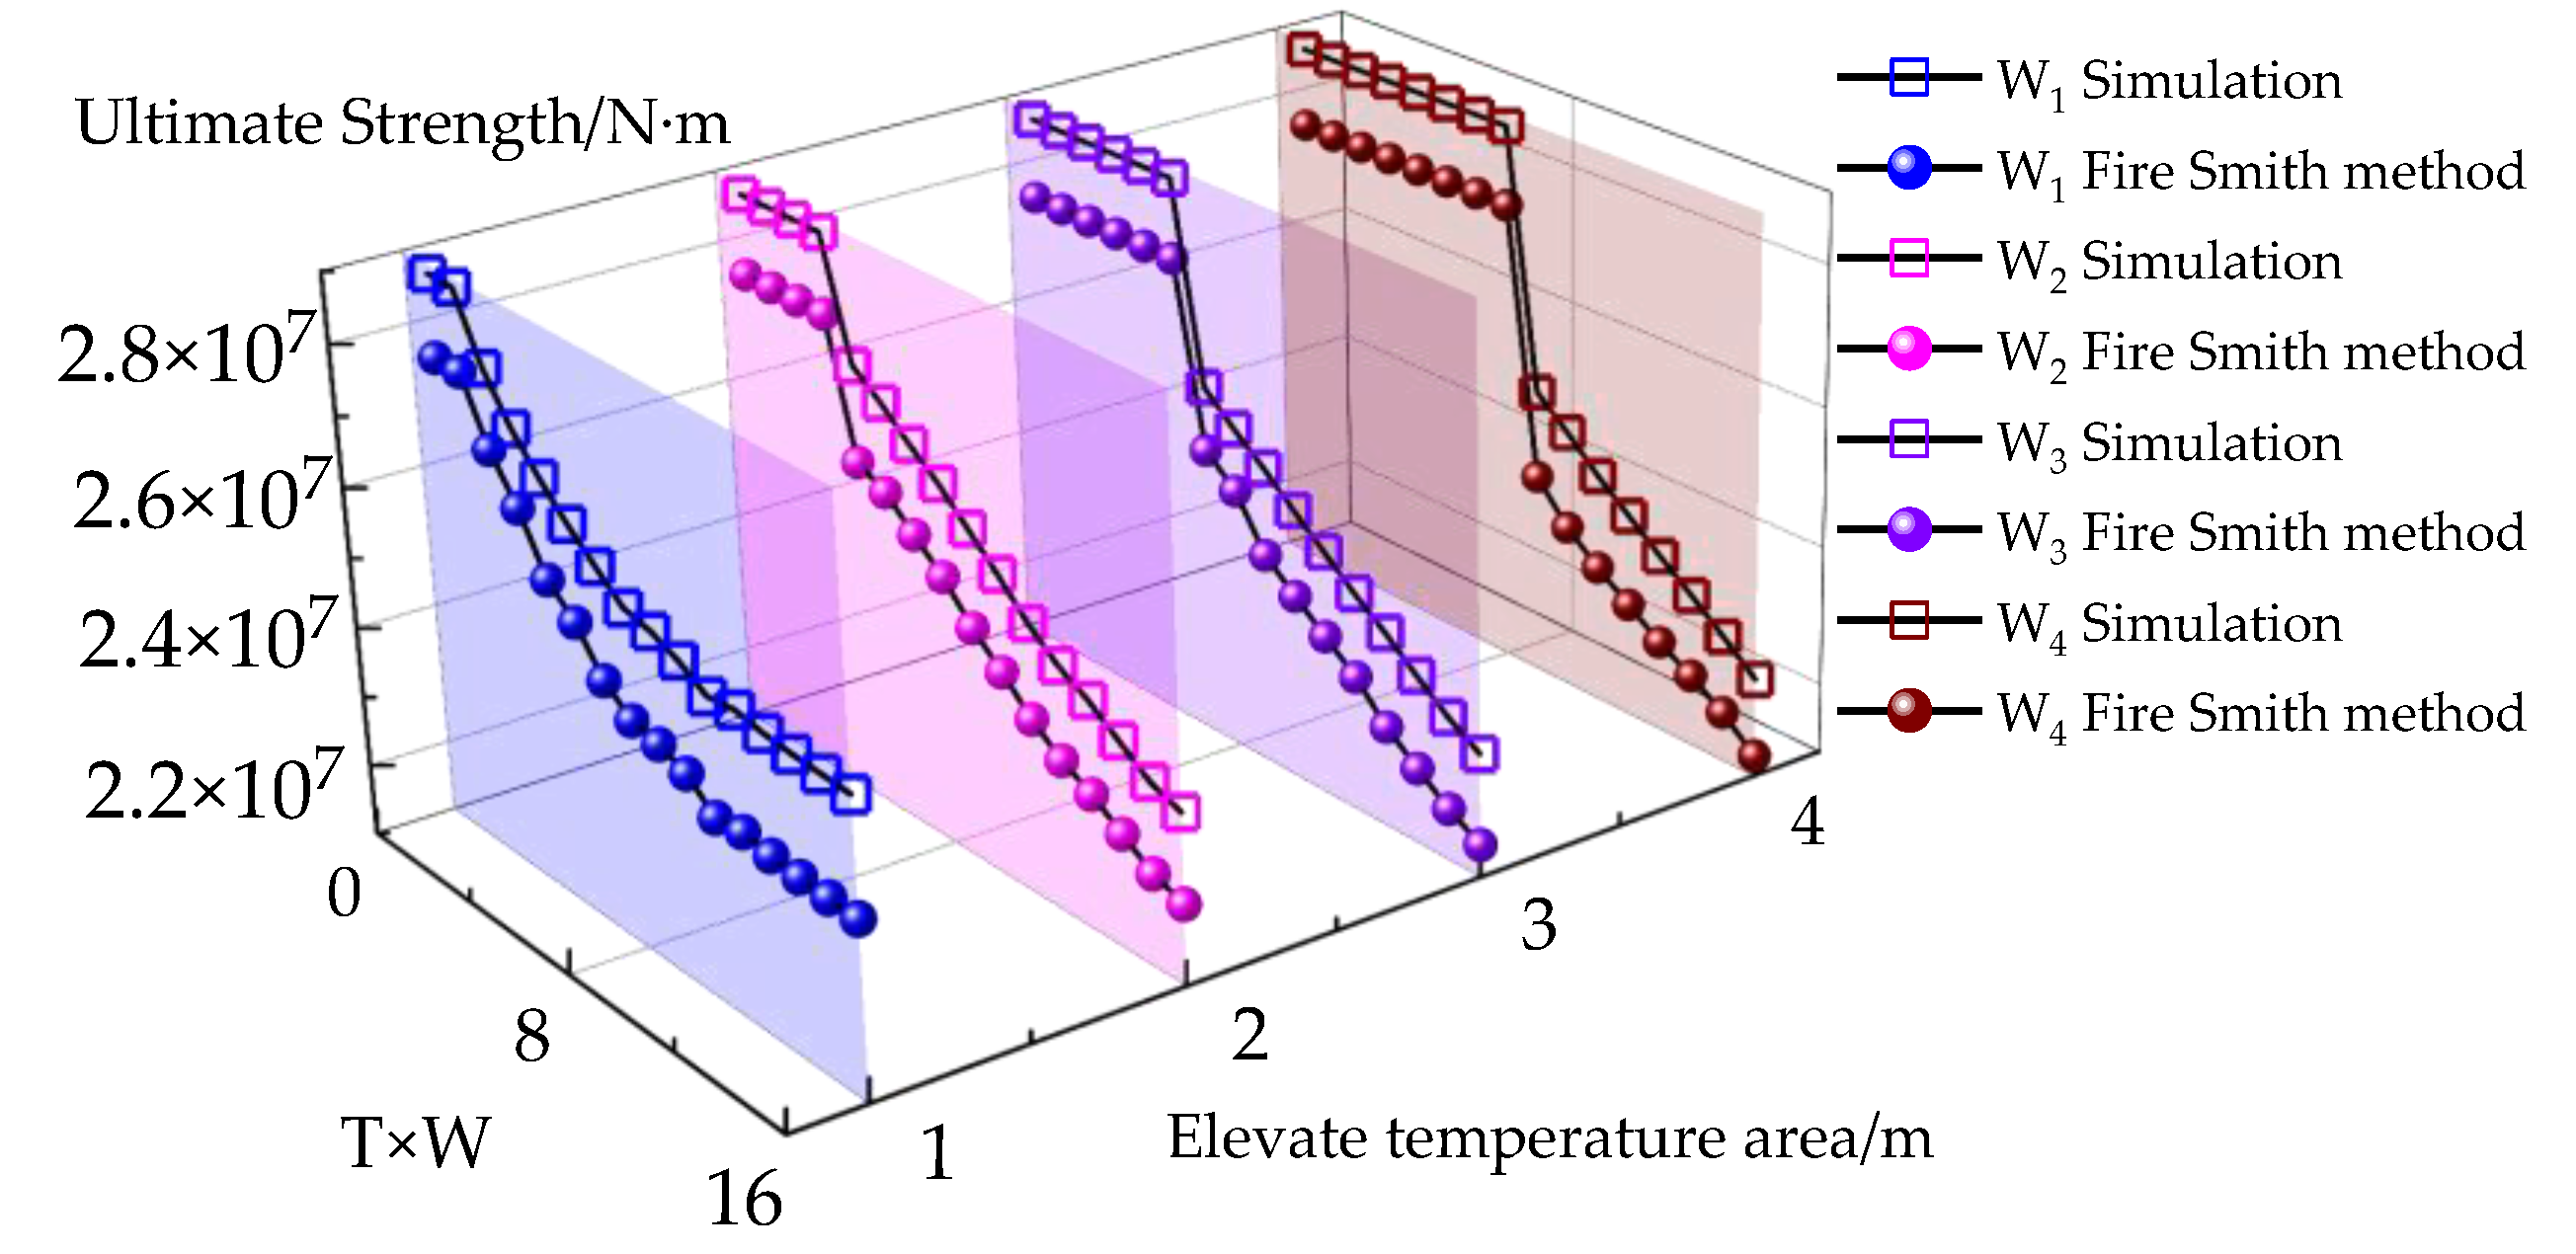
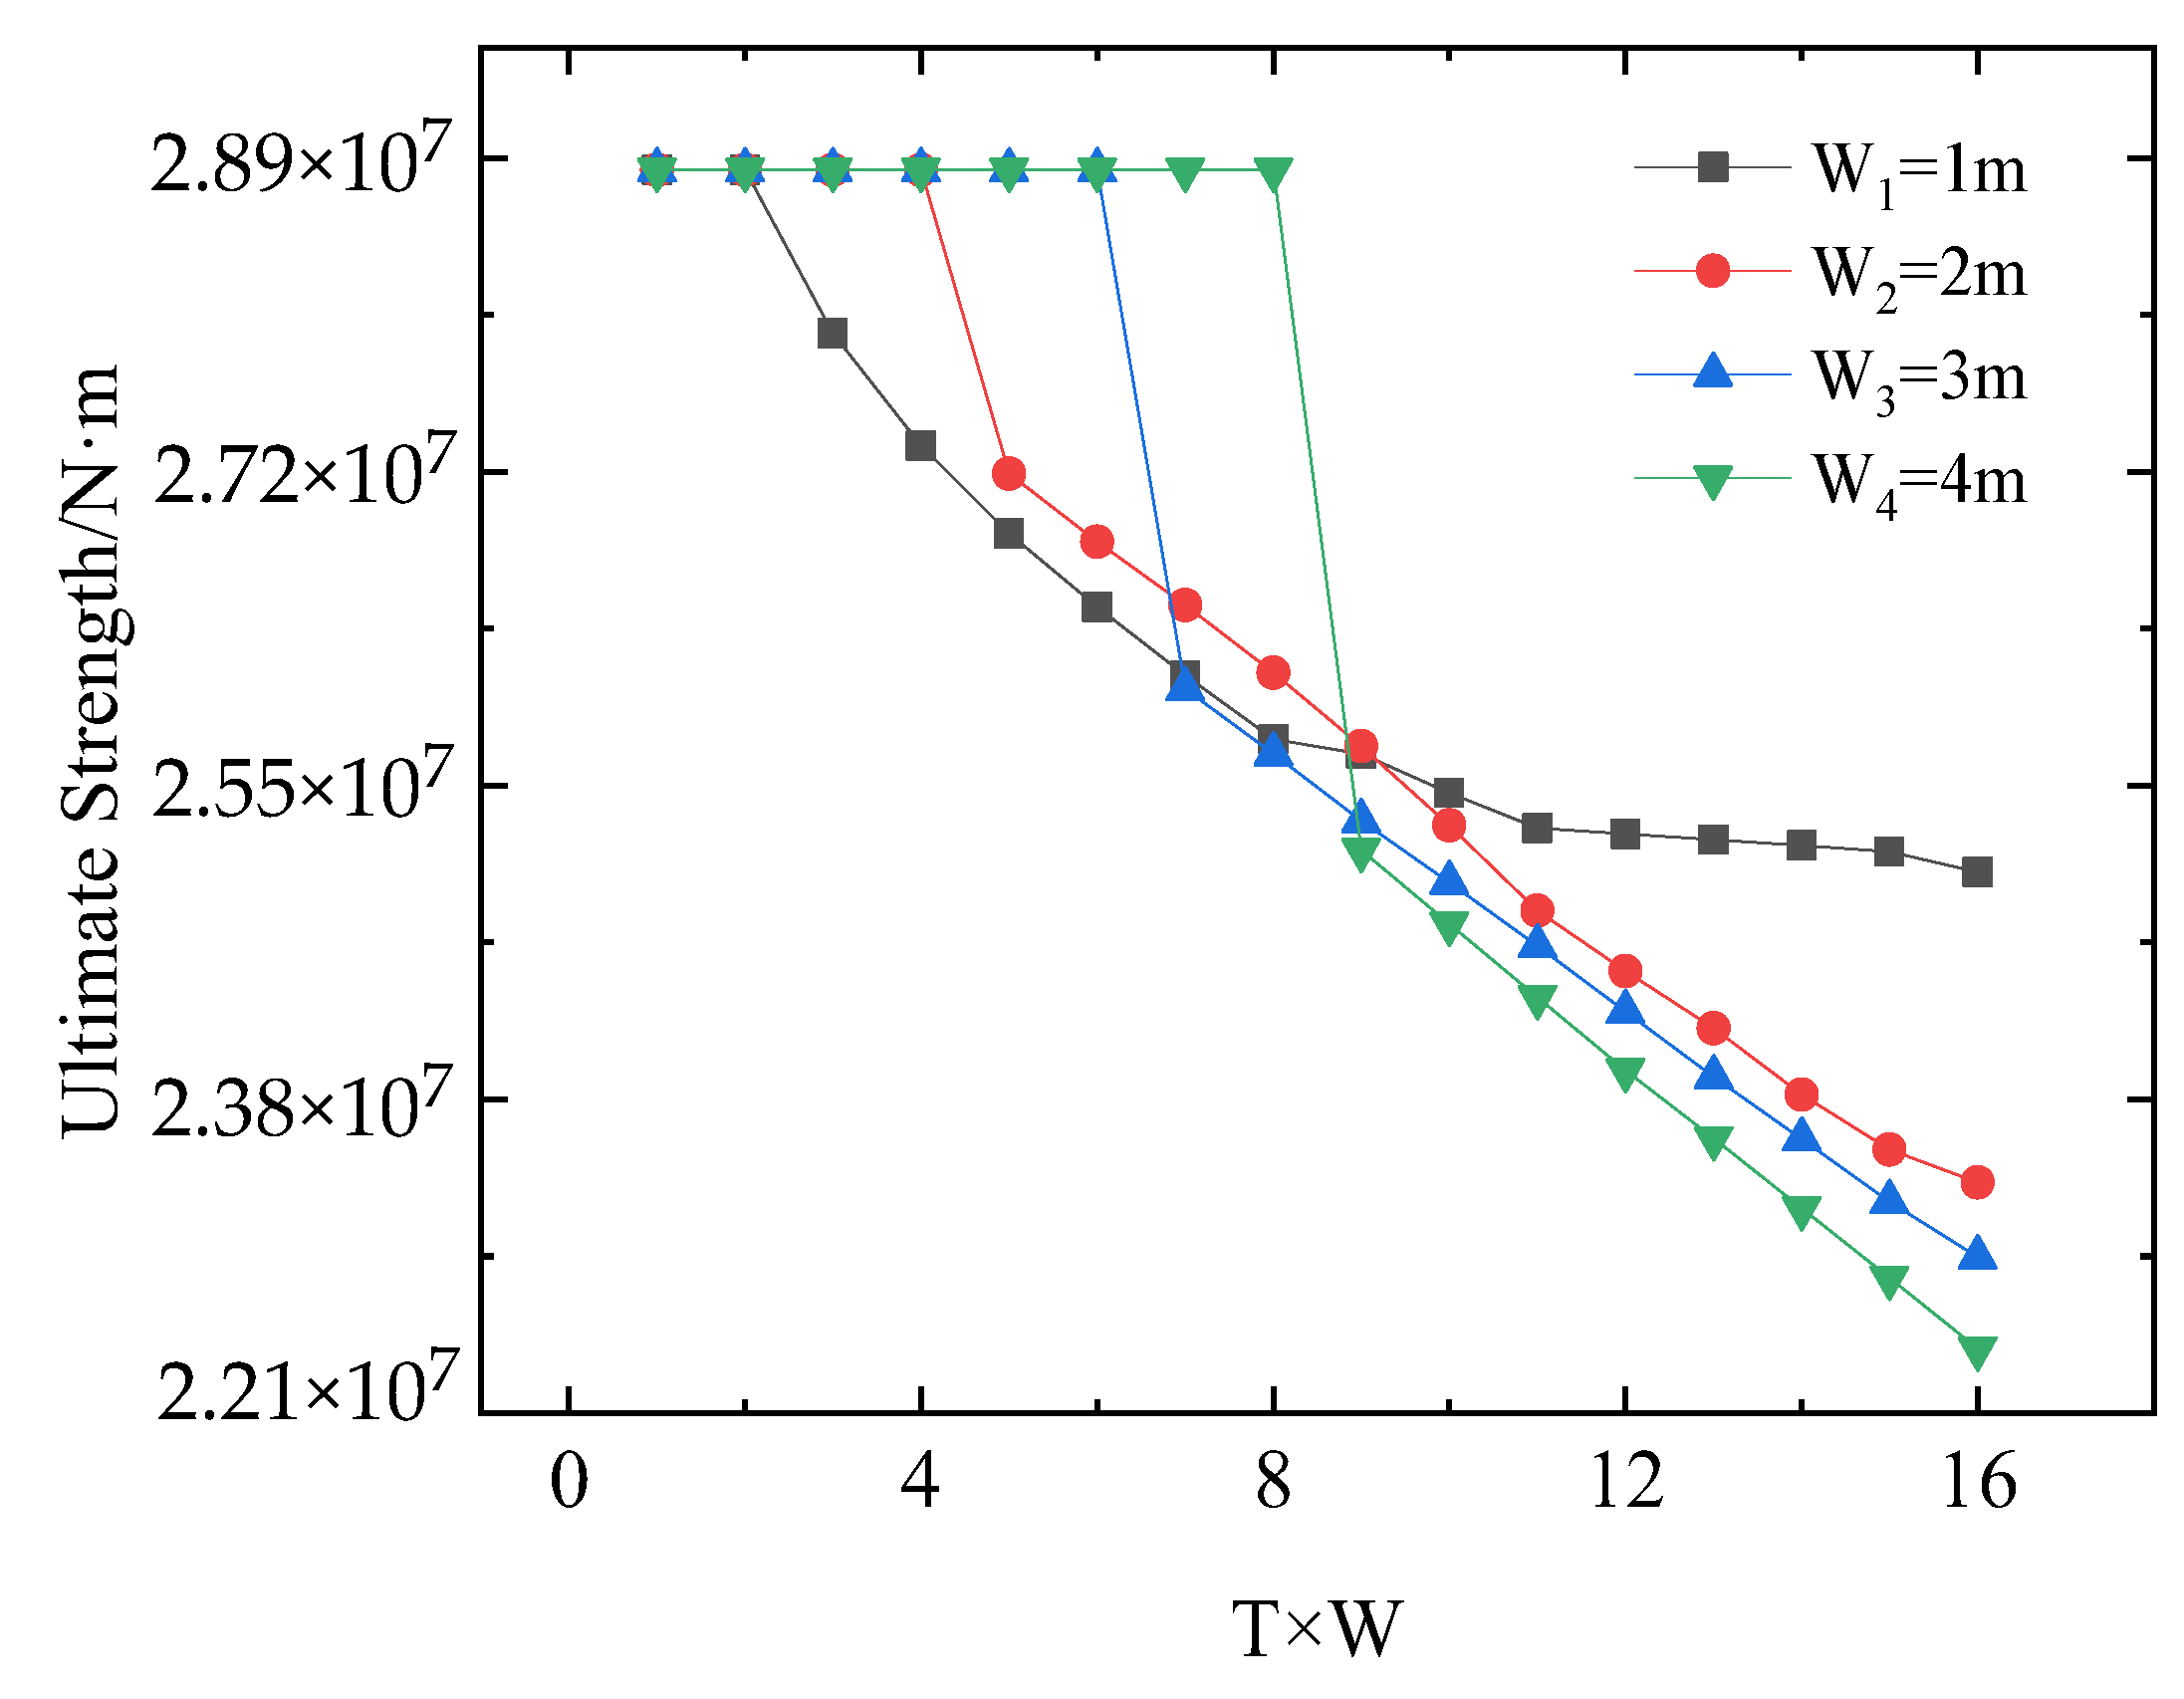
According to the simulation results, the ultimate strength characteristics of different high-temperature regions were obtained. The smaller the high-temperature region, the less oxygen required for the ultimate strength to begin to decrease. At the same time, the ultimate strength remains basically unchanged after the temperature reaches the threshold. The larger the high-temperature area, the more oxygen is required for the ultimate strength to decrease, but as the oxygen consumption coefficient increases, the ultimate strength increases.
(4)
Comparing the fire Smith method with the simulation results, we found that the trend was consistent, so the proposed method can be used as an alternative approach for evaluating the ultimate strength of a fire hull.

Author Contributions

Conceptualization, J.W. and Z.D.; methodology, J.W.; software, J.W.; validation, J.W. and Z.D.; formal analysis, J.W. and M.Y.; investigation, J.W.; resources, Z.D.; data curation, X.S.; writing—original draft preparation, J.W.; writing—review and editing, J.W.; visualization, J.W.; supervision, Z.D., M.Y. and X.S. All authors have read and agreed to the published version of the manuscript.

Funding

This research received no external funding.

Institutional Review Board Statement

Not applicable.

Informed Consent Statement

Not applicable.

Data Availability Statement

Data sharing not applicable. No new data were created or analyzed in this study. Data sharing is not applicable to this article.

Conflicts of Interest

The authors declare no conflict of interest.

Nomenclature

Dstiffness coefficient of the plate
Tthickness, mm
Lship width, m
Nxbuckling load along the x axes, N
Nxyshear force per unit, N
mhalf wave numbers in the x axes
Amnundetermined constant
Nx,cr,minsmallest buckling load along the x axes, N
σx,cr,minsmallest buckling stress along the x axes, MPa
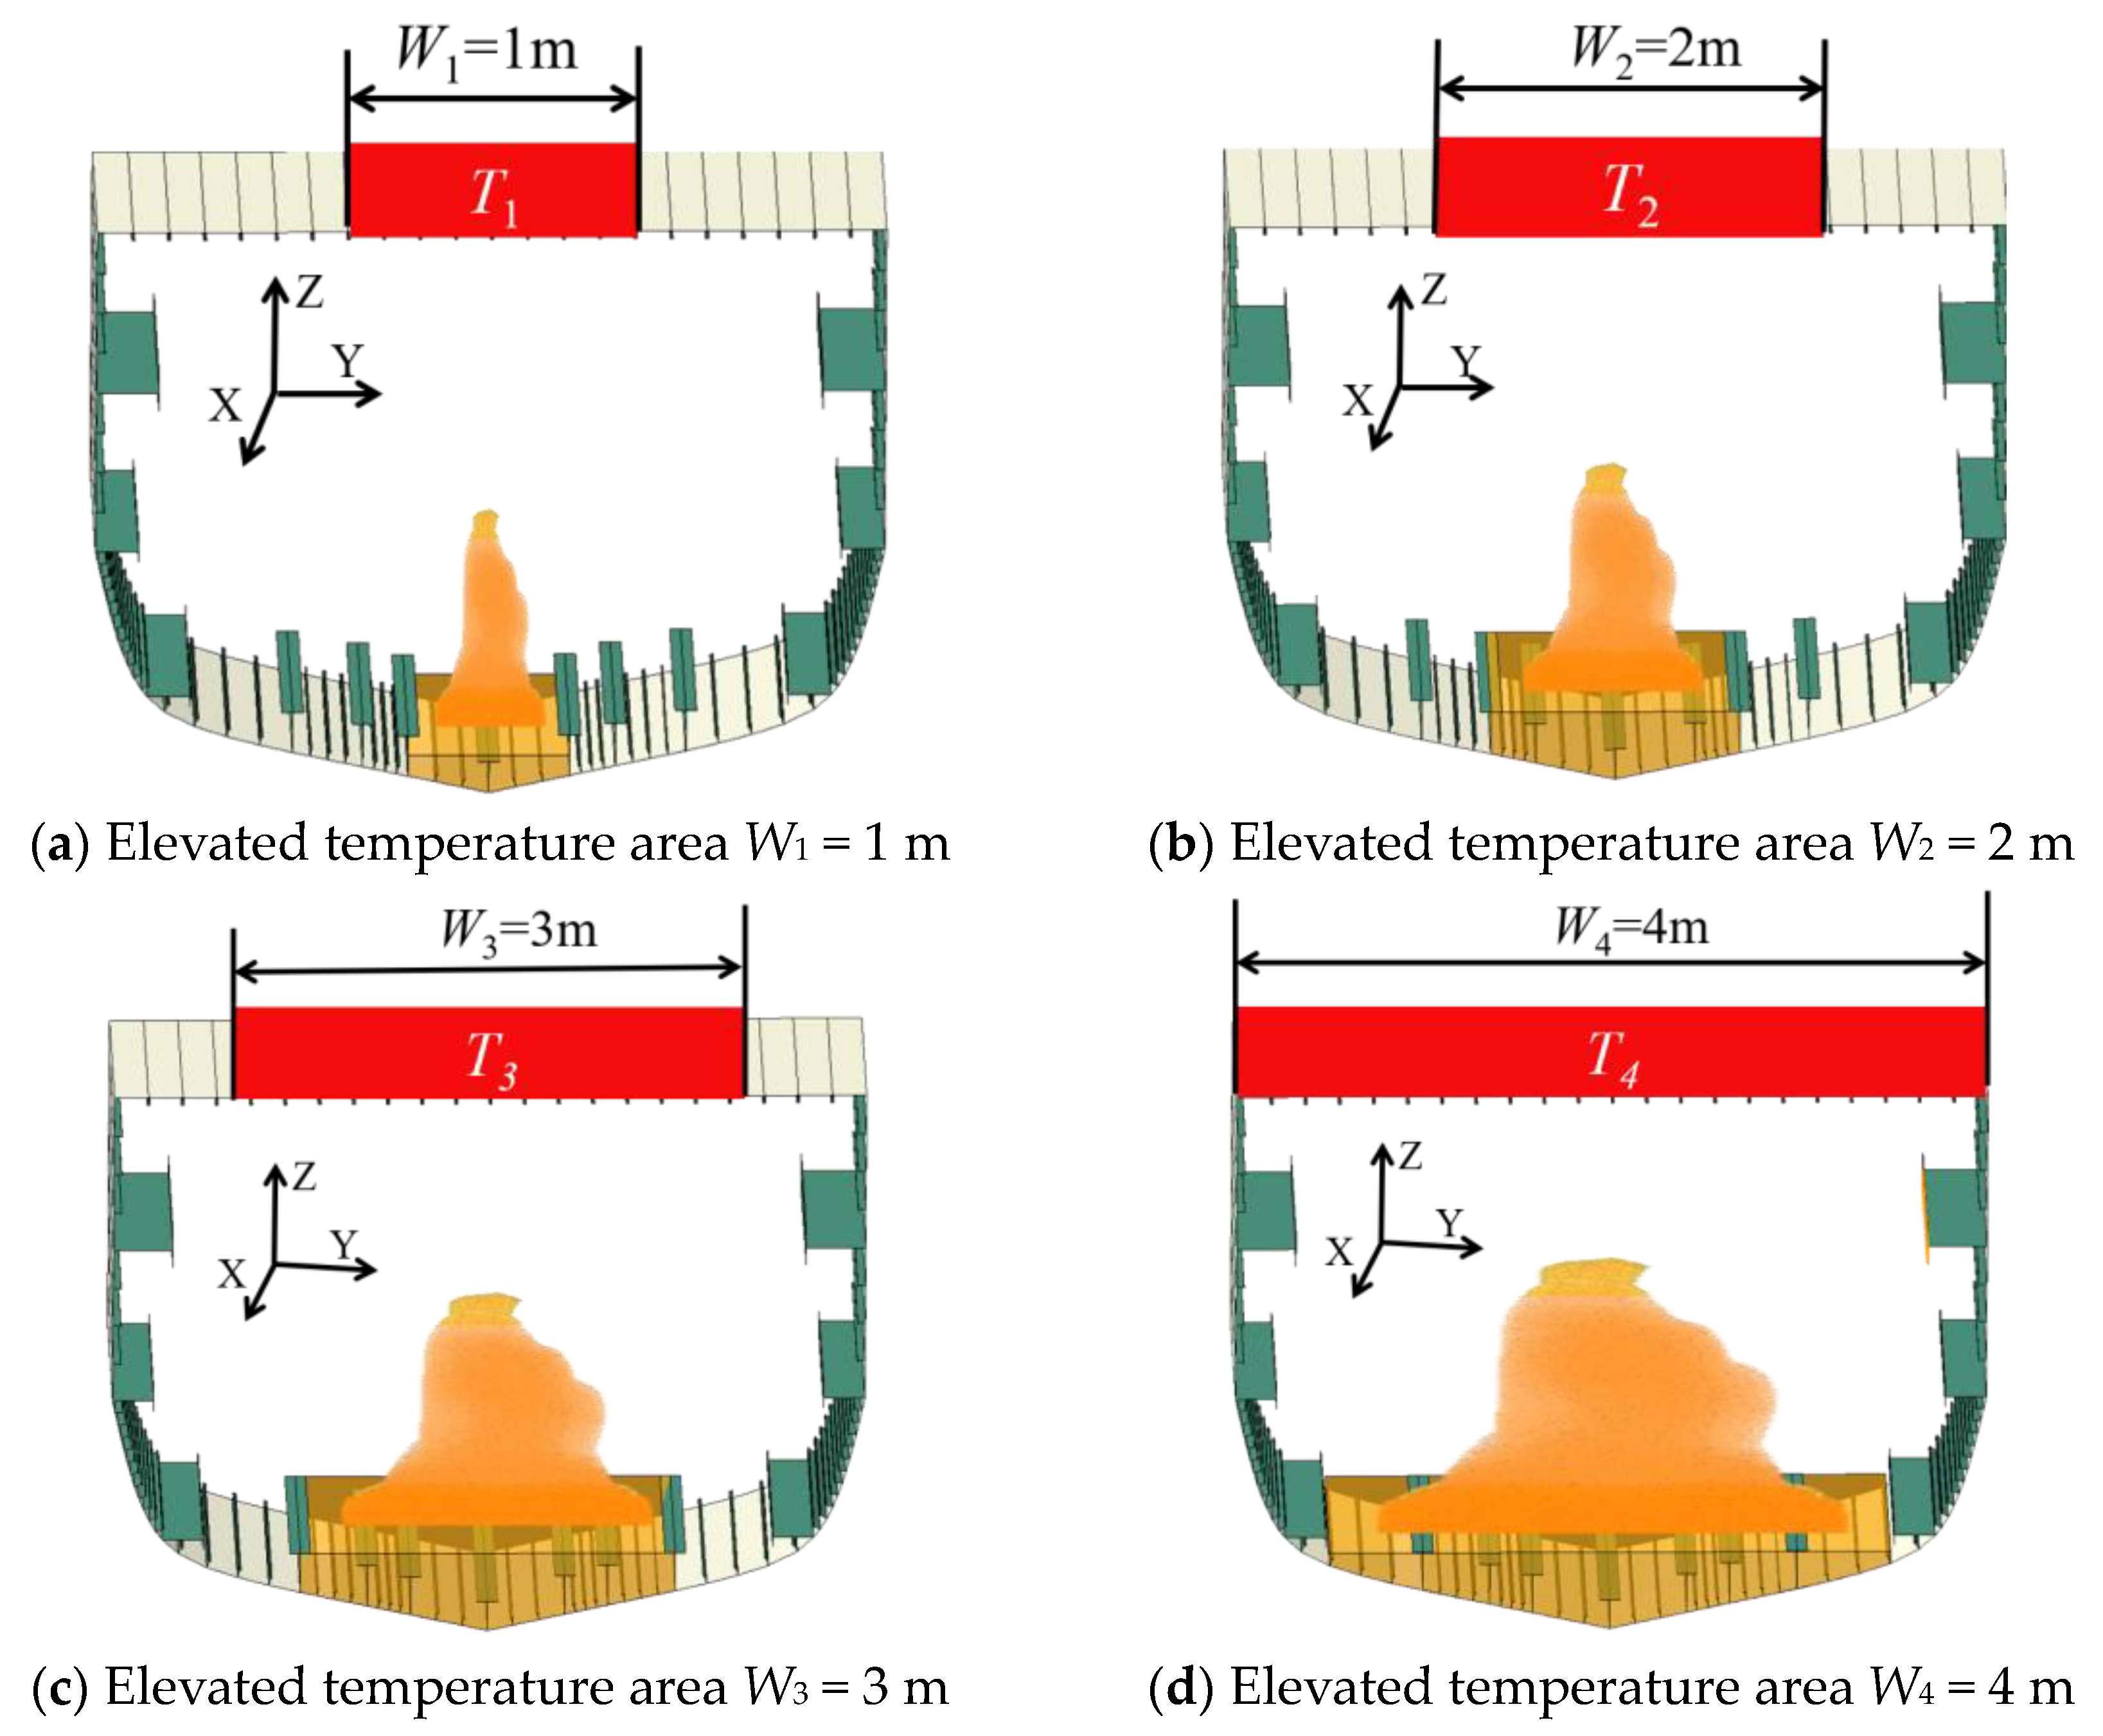
W1,2,3,4elevate temperature area, m
Tttemperature range
Δχcurvature increment
δNtolerance of neutral axes
iδtolerance of element number
Eelastic modulus, GPa
μPoisson’s ratio
Hship height, m
Nybuckling load along the y axes, N
ωbuckling condition
nhalf wave numbers in the y axes
kbuckling coefficient
ETelasticity modulus function of temperature, GPa
Ttemperature, °C
ielement number
χcurvature
δctolerance of combined load
χδtolerance of curvature increment
Mibending moment/m

References

  1. Roberts, S.E.; Pettit, S.J.; Marlow, P.B. Casualties and Loss of Life in Bulk Carriers from 1980 to 2010. Mar. Policy 2013, 42, 223–235. [Google Scholar] [CrossRef]
  2. Smith, S.C. Influence of Local Compressive Failure on Ultimate Longitudinal Strength of a Ship’s, Hull. In Proceedings of the International Symposium on Practical Design in Shipbuilding (PRADS), Tokyo, Japan, 17–21 October 1977; pp. 73–79. [Google Scholar]
  3. Rahman, M.K.; Chowdhury, M. Estimation of Ultimate Longitudinal Bending Moment of Ships and Box Girders. J. Ship Res. 1996, 40, 244–257. [Google Scholar] [CrossRef]
  4. Akpan, U.O.; Koko, T.S.; Ayyub, B.; Dunbar, T.E. Risk Assessment of Aging Ship Hull Structures in the Presence of Corrosion and Fatigue. Mar. Struct. 2002, 15, 211–231. [Google Scholar] [CrossRef]
  5. Ozguc, O.; Das, P.K.; Barltrop, N. A Comparative Study on the Structural Integrity of Single and Double Side Skin Bulk Carriers under Collision Damage. Mar. Struct. 2005, 18, 511–547. [Google Scholar] [CrossRef]
  6. Paik, J.K.; Satish Kumar, Y.V.; Lee, J.M. Ultimate Strength of Cracked Plate Elements under Axial Compression or Tension. Thin-Walled Struct. 2005, 43, 237–272. [Google Scholar] [CrossRef]
  7. Dexter, R.; Mahmoud, H. Predicting Stable Fatigue Crack Propagation in Stiffened Panels; National Aeronautics and Space Administration: Washington, DC, USA, 2004.
  8. Campanile, A.; Piscopo, V.; Scamardella, A. Comparative Analysis among Deterministic and Stochastic Collision Damage Models for Oil Tanker and Bulk Carrier Reliability. Int. J. Nav. Archit. Ocean Eng. 2018, 10, 21–36. [Google Scholar] [CrossRef]
  9. Campanile, A.; Piscopo, V.; Scamardella, A. Conditional Reliability of Bulk Carriers Damaged by Ship Collisions. Mar. Struct. 2018, 58, 321–341. [Google Scholar] [CrossRef]
  10. Amlashi, H.K.K.; Moan, T. Ultimate Strength Analysis of a Bulk Carrier Hull Girder under Alternate Hold Loading Condition—A Case Study. Mar. Struct. 2008, 21, 327–352. [Google Scholar] [CrossRef]
  11. Tanaka, Y.; Ogawa, H.; Tatsumi, A.; Fujikubo, M. Analysis Method of Ultimate Hull Girder Strength under Combined Loads. Ships Offshore Struct. 2015, 10, 587–598. [Google Scholar] [CrossRef]
  12. Kim, J.-H.; Kim, Y.; Kim, H.-S.; Jeong, S.-Y. Numerical Simulation of Ice Impacts on Ship Hulls in Broken Ice Fields. Ocean Eng. 2019, 182, 211–221. [Google Scholar] [CrossRef]
  13. Zhaka, V.; Bridges, R.; Riska, K.; Nilimaa, J.; Cwirzen, A. Observations of Snow–Slush–Snow Ice Transformation and Properties of Brash Ice in Ship Channels. Water 2023, 15, 2360. [Google Scholar] [CrossRef]
  14. Here Is What Happened to the USS Bonhomme Richard (2020) |CNN. Available online: https://edition.cnn.com/videos/world/2020/07/17/uss-bonhomme-richard-fire-lon-orig-tp.cnn (accessed on 27 June 2023).
  15. Larter, D. US Navy Orders General Dynamics Shipyard to Stop Work after Small Fire on the Warship Kearsarge. Available online: https://www.defensenews.com/naval/2020/07/18/us-navy-orders-to-general-dynamics-nassco-to-stop-work-after-fire-on-uss-kearsarge/ (accessed on 27 June 2023).
  16. CNN. Philippines Ferry Fire Kills Dozens as Passengers Jump into Sea to Escape. Available online: https://edition.cnn.com/2023/03/30/asia/philippine-ferry-fire-basilan-intl-hnk/index.html (accessed on 27 June 2023).
  17. Liu, Y.; Xue, H.; Zhou, J.; Tang, W. Numerical Analysis of Dynamical Thermal Response of Ship Cabin Structure in Fire Scenario. Ship Build. China 2018, 59, 161–169. [Google Scholar]
  18. Nassiraei, H.; Lotfollahi-Yaghin, M.A.; Neshaei, S.A.; Zhu, L. Structural Behavior of Tubular X-Joints Strengthened with Collar Plate under Axially Compressive Load at Elevated Temperatures. Mar. Struct. 2018, 61, 46–61. [Google Scholar] [CrossRef]
  19. Nassiraei, H.; Mojtahedi, A.; Lotfollahi-Yaghin, M.A.; Zhu, L. Capacity of Tubular X-Joints Reinforced with Collar Plates under Tensile Brace Loading at Elevated Temperatures. Thin-Walled Struct. 2019, 142, 426–443. [Google Scholar] [CrossRef]
  20. Li, C.F.; Zhang, K.; Wei, Z.Y.; Guo, Z.; Xu, W.J. Residual Strength of Hull Structures under Cabin Fire. J. Harbin Eng. Univ. 2019, 42, 610–617. [Google Scholar] [CrossRef]
  21. Paik, J.K.; Ryu, M.G.; He, K.; Lee, D.H.; Lee, S.Y.; Park, D.K.; Thomas, G. Full-Scale Fire Testing to Collapse of Steel Stiffened Plate Structures under Lateral Patch Loading (Part 1)—Without Passive Fire Protection. Ships Offshore Struct. 2020, 16, 227–242. [Google Scholar] [CrossRef]
  22. Paik, J.K.; Ryu, M.G.; He, K.; Lee, D.H.; Lee, S.Y.; Park, D.K.; Thomas, G. Full-Scale Fire Testing to Collapse of Steel Stiffened Plate Structures under Lateral Patch Loading (Part 2)—With Passive Fire Protection. Ships Offshore Struct. 2021, 16, 243–254. [Google Scholar] [CrossRef]
  23. ISO 834-1:1999; Fire-Resistance Tests Elements of Building Construction Part: 1: General Requirements. International Standard: Geneva, Switzerland, 1999.
  24. Liu, Y.; Guo, Z.; Jia, X.; Li, C.; Kang, J. Space Temperature Field and Structure Response of Multi-Chamber Cabin Subjected to Fire. Ocean Eng. 2022, 266, 112904. [Google Scholar] [CrossRef]
  25. Guo, Z. Residual Strength Prediction and Structural Response of a Multi-Chamber Cabin to a Fire. J. Mar. Eng. Technol. 2023, 22, 294–303. [Google Scholar] [CrossRef]
  26. Piscopo, V.; Scamardella, A. Modified Incremental-Iterative Method for Bulk Carriers under Alternate Hold Loading Conditions. Ships Offshore Struct. 2021, 16, 919–930. [Google Scholar] [CrossRef]
  27. Zhao, N.; Chen, B.-Q.; Zhou, Y.-Q.; Li, Z.-J.; Hu, J.-J.; Soares, C.G. Experimental and Numerical Investigation on the Ultimate Strength of a Ship Hull Girder Model with Deck Openings. Mar. Struct. 2022, 83, 103175. [Google Scholar] [CrossRef]
  28. Li, S.; Kim, D.K. A Comparison of Numerical Methods for Damage Index Based Residual Ultimate Limit State Assessment of Grounded Ship Hulls. Thin-Walled Struct. 2022, 172, 108854. [Google Scholar] [CrossRef]
  29. Xu, W.; Zhou, X.; Li, C.; Ren, H. Post-Ultimate Strength Behavior and Collapse Severity of Ship Hull Girder under Extreme Wave Load by an Analytical Method. Ships Offshore Struct. 2020, 17, 109627. [Google Scholar]
  30. Zhu, Z.; Ren, H.; Li, C.; Zhou, X. Ultimate Limit State Function and Its Fitting Method of Damaged Ship under Combined Loads. J. Mar. Sci. Eng. 2020, 8, 117. [Google Scholar] [CrossRef]
  31. Putranto, T.; Kõrgesaar, M.; Tabri, K. Application of Equivalent Single Layer Approach for Ultimate Strength Analyses of Ship Hull Girder. J. Mar. Sci. Eng. 2022, 10, 1530. [Google Scholar] [CrossRef]
  32. Cerik, B.C.; Choung, J. Progressive Collapse Analysis of Intact and Damaged Ships under Unsymmetrical Bending. J. Mar. Sci. Eng. 2020, 8, 988. [Google Scholar] [CrossRef]
  33. Guedes Soares, C.; Gordo, J.M.; Teixeira, A.P. Elasto-Plastic Behaviour of Plates Subjected to Heat Loads. J. Constr. Steel Res. 1998, 45, 179–198. [Google Scholar] [CrossRef]
  34. Guedes Soares, C.; Teixeira, A.P. Strength of Plates Subjected to Localised Heat Loads. J. Constr. Steel Res. 2000, 53, 335–358. [Google Scholar] [CrossRef]
  35. Gordo, J.M.; Guedes Soares, C.; Faulkner, D. Approximate Assessment of the Ultimate Longitudinal Strength of the Hull Girder. J. Ship Res. 1996, 40, 60–69. [Google Scholar] [CrossRef]
  36. Chen, B.-Q.; Guedes Soares, C. A Simplified Model for the Effect of Weld-Induced Residual Stresses on the Axial Ultimate Strength of Stiffened Plates. J. Mar. Sci. Appl. 2018, 17, 57–67. [Google Scholar] [CrossRef]
  37. Teixeira, A.P.; Guedes Soares, C. Reliability of load bearing steel plates subjected to localised heat loads. Int. J. Rel. Qual. Saf. Eng. 2006, 13, 97–113. [Google Scholar] [CrossRef]
  38. Guterl, F. Today’s Navies: Plying a Sea of Debate. IEEE Spectr. 1982, 19, 43–48. [Google Scholar] [CrossRef]
  39. Lake, J.S. The U.S. Navy: Can Ships Survive? IEEE Spectr. 1982, 19, 83–85. [Google Scholar] [CrossRef]
  40. Yang, K.C.; Lee, H.H. Experimental Study on Ultimate Strength of Steel Columns under Fire Load. Fire Saf. Sci. 2004, 6, 354–361. [Google Scholar]
  41. Yang, K.-C.; Lee, H.-H.; Chan, O. Performance of Steel H Columns Loaded under Uniform Temperature. J. Constr. Steel Res. 2006, 62, 262–270. [Google Scholar] [CrossRef]
  42. Han, Q.; Li, M.; Wang, Z.; Yun, X.; Ouyang, Y. Local Buckling Behaviour and Design of Aluminium Alloy Plates in Fire. Thin-Walled Struct. 2023, 189, 110886. [Google Scholar] [CrossRef]
  43. Han, Q.; Li, M.; Wang, Z. Testing of High Strength Aluminium Alloy SHS and RHS Stub Columns in Fire. Eng. Struct. 2023, 284, 115971. [Google Scholar] [CrossRef]
  44. Zhang, Y.; Huang, Y.; Wei, Y. Ultimate Strength Experiment of Hull Structural Plate with Pitting Corrosion Damage under Unaxial Compression. Ocean Eng. 2017, 130, 103–114. [Google Scholar] [CrossRef]
  45. NR467 Steel Ships, Part B Hull and Stability, Chapter 5 Design Loads, Section 2 Hull Girder Loads 2021. Available online: https://www.doc88.com/p-484420770866.html (accessed on 16 October 2023).
  46. GB 50018-2002; Technical Code of Cold-Formed Thin-Wall Steel Structures, Chapter 5 Calculation of Components, Section 6 Compression Plates in Components. Beijing China Planning Publishing House: Beijing, China, 2002; p. 27.
  47. BS EN 1993-1-5; Eurocode 3, Design of Steel Structure, Part 1–5: Plated Structural Elements. British Standard Institution: London, UK, 2006.
  48. AISC 36005 [S]; Specification for Structural Steel Buildings. American Institute of Steel Construction, Inc.: Chicago, IL, USA, 2005; p. 182.
  49. Nscort, A. Estimation of Rate of Heat Release by Means of Oxygen Consumption Measurements. Fire Mater. 1980, 4, 61–65. [Google Scholar]
Figure 1. Failure mode of I-beam under compression and fire condition.
Jmse 11 02055 g001
Figure 2. Plate in compression failure mode at elevated temperatures.
Jmse 11 02055 g002
Figure 3. Plate in compression failure mode at different elevated temperatures.
Jmse 11 02055 g003
Figure 4. Schematic diagram of the model under fire conditions.
Jmse 11 02055 g004
Figure 5. Elastic modulus and its linear fitting curve.
Jmse 11 02055 g005
Figure 6. Discrete element diagram of a hull.
Jmse 11 02055 g006
Figure 7. Force and displacement curve of a high-temperature compression plate.
Jmse 11 02055 g007
Figure 8. Evaluation method for the ultimate strength of a ship’s hull under a fire condition.
Jmse 11 02055 g008
Figure 9. Schematic diagram of working conditions.
Jmse 11 02055 g009
Figure 10. Schematic diagram of boundary condition setting for a thermal-mechanical coupling simulation.
Jmse 11 02055 g010
Figure 11. Schematic diagram of boundary conditions for an explicit dynamic.
Jmse 11 02055 g011
Figure 12. Mesh sensitivity analysis of ultimate strength.
Jmse 11 02055 g012
Figure 13. Overall and enlarged view of frigate mesh.
Jmse 11 02055 g013
Figure 14. Failure mode under different elevated temperature area conditions.
Jmse 11 02055 g014
Figure 15. Ultimate strength under different elevated temperature area conditions.
Jmse 11 02055 g015
Figure 16. Comparison of the ultimate strength simulation and fire Smith method for ships in different high-temperature regions.
Jmse 11 02055 g016
Figure 17. Ultimate strength characteristics of ships in different high-temperature regions.
Jmse 11 02055 g017
Table 1. Working condition table.
T1 × W1T2 × W2T3 × W3T4 × W4
1100 × 150 × 233.3 × 325 × 4
2200 × 1100 × 266.6 × 350 × 4
3300 × 1150 × 299.9 × 375 × 4
4400 × 1200 × 2133.3 × 3100 × 4
5500 × 1250 × 2166.6 × 3125 × 4
6600 × 1300 × 2199.9 × 3150 × 4
7700 × 1350 × 2233.3 × 3175 × 4
8800 × 1400 × 2266.6 × 3200 × 4
9900 × 1450 × 2299.9 × 3225 × 4
101000 × 1500 × 2333.3 × 3250 × 4
111100 × 1550 × 2366.6 × 3275 × 4
121200 × 1600 × 2399.9 × 3300 × 4
131300 × 1650 × 2433.3 × 3325 × 4
141400 × 1700 × 2466.6 × 3350 × 4
151500 × 1750 × 2499.9 × 3375 × 4
161600 × 1800 × 2533.3 × 3400 × 4
Table 2. Ultimate strength value and error of Smith simulation and fire.
No.W1 = 1 mW2 = 2 m
SimulationFire SmithError (%)SimulationFire SmithError (%)
12.88 × 1072.65 × 1077.822.88 × 1072.65 × 1077.82
22.88 × 1072.65 × 1077.822.88 × 1072.65 × 1077.82
32.79 × 1072.57 × 1077.822.88 × 1072.65 × 1077.82
42.73 × 1072.51 × 1077.962.88 × 1072.65 × 1077.82
52.68 × 1072.46 × 1078.092.71 × 1072.50 × 1077.92
62.64 × 1072.42 × 1078.232.68 × 1072.46 × 1078.01
72.60 × 1072.39 × 1078.372.64 × 1072.43 × 1078.11
82.57 × 1072.35 × 1078.502.61 × 1072.39 × 1078.21
92.56 × 1072.34 × 1078.642.57 × 1072.35 × 1078.31
102.54 × 1072.32 × 1078.782.52 × 1072.31 × 1078.40
112.52 × 1072.30 × 1078.922.48 × 1072.27 × 1078.50
122.52 × 1072.29 × 1079.052.44 × 1072.23 × 1078.60
132.52 × 1072.28 × 1079.192.41 × 1072.20 × 1078.70
142.51 × 1072.28 × 1079.332.38 × 1072.17 × 1078.79
152.51 × 1072.27 × 1079.422.35 × 1072.14 × 1078.87
162.50 × 1072.26 × 1079.472.33 × 1072.12 × 1078.95
No.W3 = 3 mW4 = 4 m
SimulationFire SmithError (%)SimulationFire SmithError (%)
12.88 × 1072.65 × 1077.822.88 × 1072.65 × 1077.82
22.88 × 1072.65 × 1077.822.88 × 1072.65 × 1077.82
32.88 × 1072.65 × 1077.822.88 × 1072.65 × 1077.82
42.88 × 1072.65 × 1077.822.88 × 1072.65 × 1077.82
52.88 × 1072.65 × 1077.822.88 × 1072.65 × 1077.82
62.88 × 1072.65 × 1077.822.88 × 1072.65 × 1077.82
72.60 × 1072.39 × 1077.882.88 × 1072.65 × 1077.82
82.56 × 1072.36 × 1077.942.88 × 1072.65 × 1077.82
92.53 × 1072.32 × 1078.012.51 × 1072.31 × 1077.84
102.49 × 1072.29 × 1078.072.47 × 1072.28 × 1077.84
112.46 × 1072.26 × 1078.142.43 × 1072.24 × 1077.84
122.42 × 1072.22 × 1078.202.39 × 1072.20 × 1077.85
132.39 × 1072.19 × 1078.272.35 × 1072.17 × 1077.86
142.35 × 1072.16 × 1078.322.32 × 1072.13 × 1077.87
152.32 × 1072.13 × 1078.362.28 × 1072.10 × 1077.88
162.29 × 1072.10 × 1078.402.24 × 1072.07 × 1077.90
Disclaimer/Publisher’s Note: The statements, opinions and data contained in all publications are solely those of the individual author(s) and contributor(s) and not of MDPI and/or the editor(s). MDPI and/or the editor(s) disclaim responsibility for any injury to people or property resulting from any ideas, methods, instructions or products referred to in the content.

