Article

Underwater Reverberation Suppression via Attention and Cepstrum Analysis-Guided Network

1
School of Mechanical Engineering, Xi’an Jiaotong University, Xi’an 710049, China
2
School of Software Engineering, Xi’an Jiaotong University, Xi’an 710049, China
3
Naval Academy of Armament, Beijing 100161, China
4
Institute of Acoustics, Chinese Academy of Sciences, Beijing 100190, China
5
Shaanxi Key Laboratory of Intelligent Robots, Xi’an Jiaotong University, Xi’an 710049, China
*
Author to whom correspondence should be addressed.
J. Mar. Sci. Eng. 2023, 11(2), 313; https://doi.org/10.3390/jmse11020313
Submission received: 8 December 2022 / Revised: 23 January 2023 / Accepted: 26 January 2023 / Published: 1 February 2023
(This article belongs to the Special Issue Application of Sensing and Machine Learning to Underwater Acoustic)

Abstract

:
Active sonar systems are one of the most commonly used acoustic devices for underwater equipment. They use observed signals, which mainly include target echo signals and reverberation, to detect, track, and locate underwater targets. Reverberation is the primary background interference for active sonar systems, especially in shallow sea environments. It is coupled with the target echo signal in both the time and frequency domain, which significantly complicates the extraction and analysis of the target echo signal. To combat the effect of reverberation, an attention and cepstrum analysis-guided network (ACANet) is proposed. The baseline system of the ACANet consists of a one-dimensional (1D) convolutional module and a reconstruction module. These are used to perform nonlinear mapping and to reconstruct clean spectrograms, respectively. Then, since most underwater targets contain multiple highlights, a cepstrum analysis module and a multi-head self-attention module are deployed before the baseline system to improve the reverberation suppression performance for multi-highlight targets. The systematic evaluation demonstrates that the proposed algorithm effectively suppresses the reverberation in observed signals and greatly preserves the highlight structure. Compared with NMF methods, the proposed ACANet no longer requires the target echo signal to be low-rank. Thus, it can better suppress the reverberation in multi-highlight observed signals. Furthermore, it demonstrates superior performance over NMF methods in the task of reverberation suppression for single-highlight observed signals. It creates favorable conditions for underwater platforms, such as unmanned underwater vehicles (UUVs), to carry out underwater target detection and tracking tasks.

1. Introduction

Sonar systems with long detection ranges are one of the most commonly used pieces of equipment in underwater detection operations. Reverberation is one of the most critical background interferences of active sonar systems, which limits the detection and identification performance of the system, especially in shallow sea environments. The superposition of scattered sound waves from different scatterers produces reverberation. These scatterers [1] include organisms, sand grains, undulating sea surfaces, bubble layers, sediments on the seafloor, etc. Similar to the target echo signal, the time–frequency characteristics of the reverberation are also related to the transmitted signal. Thus, the reverberation and the target echo signal overlap in both the time and frequency domains. Therefore, it is challenging to perform reverberation suppression in the time domain or frequency domain alone. How to effectively improve the signal-to-reverberation ratio (SRR) of the target echo signal has always been one of the hottest topics in underwater acoustic signal processing.
Currently, the research on reverberation suppression mainly focuses on two aspects: transmit waveform design and signal processing algorithm. The basic principle of active sonar waveform design is that the signal should have Doppler reverberation suppression ability, noise suppression ability, and good emission performance. Therefore, ensuring the ability of the active sonar system to detect medium and long-range targets [2]. Cox et al. [3] refer to a pulse signal with multiple narrowband segments on the spectrum as a comb waveform (CW), whose energy is distributed in multiple narrowband segments but is still a broadband signal. Therefore, CW has the reverberation suppression characteristics of both narrowband and wideband signals [4]. Typical comb spectrum signals include sinusoidal frequency modulation (SFM), uniform comb spectrum signal (UC), and geometric comb spectrum signal (GC) [5]. SFM has good peak-to-average power characteristics, but its high range side lobes lead to the degradation of ranging accuracy. Hague et al. [6] effectively suppressed the range side lobes by making the instantaneous frequency of SFM non-periodic. However, they also made the signal lose its reverberation suppression ability. Soli et al. [7] proposed a co-prime comb spectral signal (CC), which can achieve a range-Doppler performance similar to UC while occupying reduced bandwidth. GC has good ranging accuracy, but its high peak-to-average power leads to low emission efficiency. Li et al. [8] proposed a comb spectrum waveform cognitive filtering detection algorithm, which improved the output SRR by more than 6 dB.
This study focuses on reverberation suppression methods based on modern signal processing, including space–time adaptive processing (STAP) and joint time–frequency domain processing. The moving active sonar platform will cause the reverberation in different orientations to have different Doppler shifts, leading to the Doppler spectrum expanding. When the target and the sonar platform have a non-zero radial velocity, the target signal and the reverberation is theoretically separable on the angle-Doppler plane. This is how STAP achieves reverberation suppression. Jaffer et al. [9] were the first to apply the STAP method to active sonar and proposed two space–time adaptive filter structures. Karine et al. [10] studied the low-frequency sonar STAP method and obtained better reverberation suppression performance than the standard method by mixing waveform design and the STAP method. Li et al. [11] proposed a space–time adaptive pre-whitener based on a two-dimensional autoregressive (2D-AR) algorithm. Compared to one-dimensional (1D) autoregressive detectors, it exhibits better reverberation suppression performance. Sasi et al. [12] proposed a low-complexity STAP algorithm based on a multinomial filter structure, which reduces the computational complexity with little impact on detection performance. Zhang et al. [13] exploited the sparsity of the reverberation spectrum in the angle-Doppler plane. They proposed a sparse adaptive covariance estimation STAP (SACE-STAP) algorithm, which improved the reverberation suppression ability and object detection performance. Xing et al. [14] proposed a STAP algorithm based on direct data domain, which can effectively suppress the reverberation of active sonar by combining the advantages of joint domain localized (JDL) processing and STAP. However, there are still many problems that limit the performance of STAP in practical applications. For example, STAP estimates the NK × NK reverberation covariance matrix C with many independent and identically distributed data. K is the number of sampling points of the transmitted signal, and N is the number of array elements. To generate the optimal weight vector, the matrix C−1 is calculated, which has a computational complexity of O{(NK)3}. Thus, the computational complexity of the STAP method is relatively high.
The joint time–frequency domain processing method uses the difference in time–frequency structure between the target echo and the reverberation. In recent years, joint time–frequency domain processing methods such as short-time Fourier transform (STFT), fractional Fourier transform (FRFT), Wigner–Ville distribution (WVD), and the Hilbert–Huang transform (HHT) have been widely used. STFT is not affected by cross-term interference, but has the disadvantage of lower time–frequency resolution. WVD has better time–frequency resolution when dealing with single-component signals, but there will be severe cross-term interference when dealing with multi-component signals. Cohen’s time–frequency distribution [15,16] reduces cross-term interferences to a certain extent by adding kernel functions, but its applicability to different signals has significant differences. Based on the joint time–frequency domain processing method, Li et al. [17] established a joint feature space by studying the target echo and reverberation characteristics and separated the target echo and reverberation in the joint feature space. Kay et al. [18] proposed a pre-whitener based on an autoregressive model, which makes objects easier to detect. Li et al. [19] combined image morphology and a time–frequency blind separation algorithm to separate the target echo from reverberation. They also derived the expression of reverberation in the WVD time–frequency domain. In addition, non-negative matrix factorization (NMF) is also widely used in reverberation suppression tasks. Under non-negative constraints, NMF is a fully additive model that achieves nonlinear dimensionality reduction. It has been widely used in speech signal processing, pattern recognition, and computer vision [20,21]. Lee et al. [22] proposed a reverberation suppression algorithm for continuous wave signals based on the NMF method. Kim et al. [23,24] proposed two preprocessing methods that facilitate the application of NMF methods. Jia et al. [25] proposed an NMF-based reverberation suppression method that uses matrix rotation for low-rank preprocessing. Even so, reverberation suppression remains a challenging problem in underwater active sonar detection, especially for moving sonar platforms.
Over the past few decades, deep neural networks (DNNs) have been widely used to solve regression and classification problems [26]. With theoretical innovations and the improvement in computing speed, DNNs have achieved great success in the fields of image processing [27,28], speech processing [29], and natural language processing [30]. In noise suppression [31] and reverberation suppression [32] of speech signals, DNNs can predict clean speech spectrograms from complex inputs. Compared with traditional methods based on statistical models, DNN-based methods have significant performance improvements. Borgstrom et al. [33] proposed an end-to-end noise–reverberation joint suppression network for speech enhancement which uses an attention masking mechanism. Zhao et al. [34] proposed a single-channel speech reverberation suppression network based on the self-attention mechanism and temporal convolutional network (TCN).
In general, since the received clutter is usually non-stationary, it is difficult to obtain a sufficient quantity of independent and identically distributed data to calculate the clutter covariance matrix. Thus, most of the research on STAP methods, including those mentioned above and related works such as sparse recovery STAP (SR-STAP) [35,36,37] and knowledge-aided STAP (KA-STAP) [38], are aimed at faster or better estimation of the clutter covariance matrix. Furthermore, NMF-based methods and other machine learning methods, such as low-rank matrix recovery [39], require target echo signals to be low-rank in the time–frequency domain. However, the echo signals of targets with complex geometric structures often contain multiple highlighted structures, which is challenging to meet the low-rank requirements. Therefore, a better method is needed to create favorable conditions for underwater platforms to carry out underwater target detection and tracking tasks [40,41].
The primary purpose of this study is to solve the problem of reverberation suppression of non-low-rank target echo signals that NMF-based methods cannot handle. Therefore, a single-channel underwater reverberation suppression network (ACANet) was proposed. The spectrogram of the input waveform is obtained after STFT time–frequency analysis. The cepstral analysis module is used to learn the features of the signal in the cepstral domain, the self-attention module is used to represent different input features dynamically, and the convolution module is used to learn the nonlinear mapping of the features. Finally, the reconstruction module is used to reconstruct the spectrogram of the target echo signal.

2. Theory and Methods

2.1. Active Sonar Observation Signal Model

2.1.1. Reverberation Model

This study generates seabed reverberation data based on the cell scattering model. Since the composition of reverberation is highly complex, some simplified assumptions are used to make the simulation more feasible [42].
  • Changes in the sound velocity caused by temperature, pressure, and other factors are not considered. Thus, the sound trajectories are all straight lines;
  • Only the sound absorption effect and the spherical expansion effect of sound waves are considered, while other attenuation effects are ignored;
  • The reverberant scattering units are uniformly distributed in distance, azimuth, and elevation;
  • The scatterers are uniformly distributed in the entire scattering unit at any given moment, and the density of the scatterer is large enough;
  • The pulse width is short enough that the propagation effect within the scattering units is negligible;
  • No multiple scattering.
Both theoretical research and experimental results prove that these simplified assumptions only disregard some secondary factors and simplify the complexity of the simulation. The reverberation generated in the simulation has the same statistical characteristics as the detected reverberation. Both the reverberation intensity and the correlation coefficient gradually decrease with the increase in time. The reverberation magnitude obeys the Gaussian distribution, and the reverberation envelope obeys the Rayleigh distribution. Therefore, the obtained reverberation simulation results have general guiding significance.
The seafloor is an effective reflector and scatterer of sound waves. The sound waves projected on the irregular seafloor form the seafloor reverberation. In addition, the sea surface, bubble layer, suspended sediment, plankton, and fishes are also effective scatterers. The sound waves projected on the sea surface and the bubble layer are scattered to form the sea surface reverberation. The sound waves projected on suspended sediment, plankton, and fishes are scattered to form the volume reverberation. However, the intensity of seafloor scattering usually exceeds the intensity of volume scattering and surface scattering. Therefore, seafloor reverberation is the main interference background for active sonar systems working in shallow waters [1]. Scatterers produce scattered echoes under the excitation of incident sound waves. The superposition of the scattered echoes generated by many seafloor scatterers constitutes seafloor reverberation. The Doppler frequency shift resulting from the motion of the sonar platform is expressed as
f d   =   2 f 0 v cos θ cos φ / c
where f0 is the pulse frequency, v is the speed of the sonar platform, θ and φ are the azimuth and elevation angles of the scatterer relative to the sonar platform, respectively, and c is the speed of sound in seawater.
Considering the Doppler frequency shift caused by the movement of the sonar platform, when the incident sound wave is a linear frequency-modulated (LFM) pulse, the scattered echo generated by the scatterer is expressed as
r t   =   A t u t     τ exp j 2 π f 0   +   f d t     τ   +   π k t     τ 2   +   j ϕ
where A(t) is the random amplitude obeying a normal distribution, u(t) is the signal envelope, τ is the time delay, k is the slope of the LFM pulse, and ϕ is the random phase that obeys the uniform distribution of [0, 2π].
When the grazing angle of the incident sound wave is less than 45°, the relationship between the scattering intensity of the seafloor and the grazing angle satisfies Lambert’s law. The scattered acoustic wave of the seafloor reverberation consists of non-specular reflection obeying Lambert’s law. Therefore, the scattering intensity of the scatterer can be expressed as
S b   =   10 log 10 μ   +   10 log 10 sin 2 φ
where μ is the seafloor scattering constant and is confirmed to be −2.7 by measurements over a wide frequency range [1]. The equivalent plane wave reverberation level of the seabed reverberation is expressed as
R L b   =   S L     2 T L   +   S b   +   10 log 10 Δ θ Δ R
where SL is the source level, TL is the propagation loss, Sb is the seabed scattering intensity, and Δθ∙ΔR is the size of the scattering unit.
At a certain time, the shape of the reverberation area is an annular sector [42]. Assuming that there are Nθ × NR scattering units in this area, each scattering unit contains Nn scatters. According to Equations (2) and (4), and the principle of linear superposition, the seafloor reverberation generated by the superposition of these scatters can be expressed as
r ( t )   =   i   =   1 N θ k   =   1 N R j   =   1 N n 10 R L i k / 10 r i j k ( t )

2.1.2. Target Echo Highlight Model

The highlight model assumes that the target echo signal of any complex underwater target can be equivalent to the coherent superposition of sub-echoes generated by several highlight components on the target [43]. Affected by target geometry and incident angle, the highlight components on the target surface and corners will generate scattered geometric waves under the excitation of the incident sound wave. These scattered waves together constitute the geometric highlight echo of the target. In addition, due to the influence of the target material and structure, the boundary of the target surface and the medium will generate orbiting waves and scattered elastic waves, which together constitute the elastic highlight echo of the target.
The highlight model treats the target as a linear system with a transfer function defined as [25,43]
H f   =   A e j f d τ e j ϕ
where A is the amplitude of the highlight echo, τ is the delay, and ϕ is the phase jump generated during the echo formation.
When the incident sound wave is an LFM pulse, the target echo signal generated by a target containing multiple highlights is expressed as
s t   =   i   =   1 N A i u t     τ i exp j 2 π f 0   +   f d t     τ i   +   π k t     τ i 2   +   j ϕ i
where N is the number of highlights.
It is worth noting that this study did not consider the multi-path effect. Training deep neural networks with feature-rich data can improve the performance and robustness of the network. This study uses the highlight model to generate a series of observed signals containing different highlight structures. These signals with different highlight features are used to train and evaluate the proposed ACANet. Taking multi-path into account does not cause changes in the highlight structure, but instead increases the computational complexity of the highlight model. Therefore, to simplify the model, this study did not consider the multi-path effect.

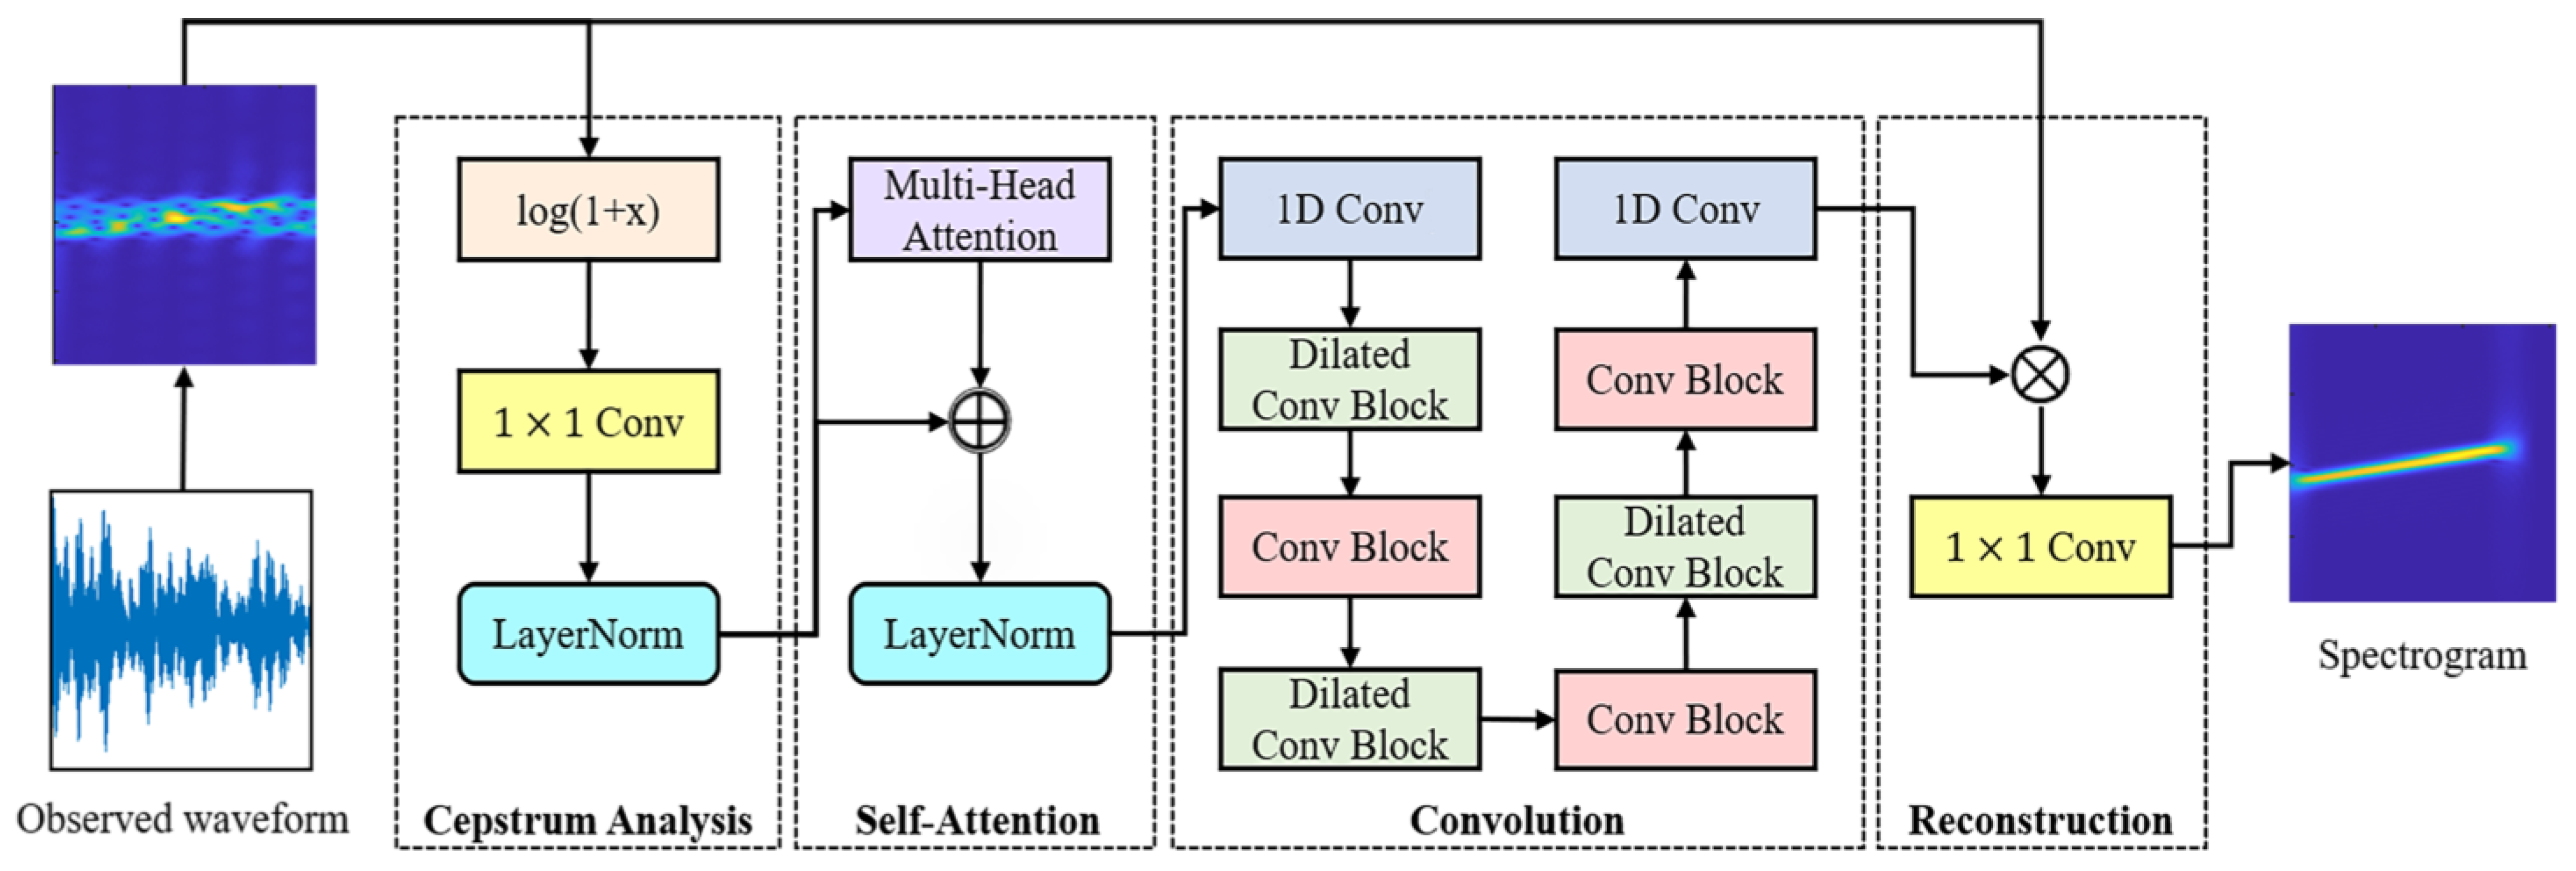
2.2. Proposed Method

The underwater reverberation suppression network ACANet is introduced in this section. It consists of a cepstrum analysis module, a multi-head self-attention module, a one-dimensional (1D) convolutional module, and a reconstruction module.
In Figure 1, the observed waveform is the reverberant target echo signal received by the sonar platform, which can be written as
x t   =   s t   +   r t
where s(t) and r(t) are the target echo signal and reverberation. This study aims to recover the clean target echo signal s(t) from the reverberant observation x(t). The following subsections will first describe the joint time–frequency domain processing method. Then the details of each component of the network will be introduced.

2.2.1. Joint Time–Frequency Domain Processing

In terms of physical structure, the target echo signal may contain multiple highlight echoes so that the target echo signal might be a multi-component signal. WVD suffers from severe cross-term interference when dealing with multi-component signals. Cohen’s time–frequency distribution reduces the interference of cross terms to a certain extent by adding kernel functions, but its applicability to different signals has significant differences. Therefore, STFT is chosen as the joint time–frequency domain processing method for feature extraction of the observed signal x(t).
This study divides the time domain observed signal x(t) into several frames with a hamming window. Then, a 256-point discrete Fourier transform (DFT) is performed on each frame. Finally, the spectrogram of the observed signal is obtained by stacking the DFT results along the time dimension. X(m) is used to denote the features of the observed signal at time frame m, which is a 256-D vector. It is important to note that all the features have been mapped to [0, 1] by normalization. Therefore, the following consecutive feature vector will be used as the input of the network
X   =   X 1 , X 2 , X 3 , , X N
where N is the total number of frames.
S(m) is used to denote the features of the clean target echo signal at time frame m, which can be expressed as
S   =   S 1 , S 2 , S 3 , , S N
Taking S as the training target of the network, the reverberation suppression task is now formulated as a seq-to-seq mapping problem.
F X i S i , i   =   1 , 2 , 3 , , N

2.2.2. Cepstrum Analysis Module

Cepstrum analysis is a widely used nonlinear digital signal processing method in speech processing. It transforms a signal into a cepstrum domain to reveal the pseudo-frequency features of the signal. The traditional cepstrum processing method [44] consists of a logarithmic operation and a discrete cosine transform (DCT).
In ACANet, the cepstrum analysis module (CAM) simulates the traditional cepstrum processing method, and is used to extract the different features of the signal in the cepstrum domain. The difference between the system in this study and the traditional system is that the CAM consists of an element-wise log operational layer, a 1 × 1 convolutional layer with a ReLU activation function [45], and a normalization layer. The traditional DCT process is replaced with a CNN layer to achieve a trainable linear transformation. The layer normalization layer makes the input features follow the standard normal distribution, which ensures the stability of the features and makes the training process more stable. The layer normalization process can be expressed as
LayerNorm I L N   =   I L N     E I L N Var I L N   +   ε γ   +   β
where ILN is a dynamic representation of the input feature output by the CNN layer. Both mean and standard deviation are calculated on the ILN matrix. Note that compared to the statistical formula, here there are three more variables: ε is a small constant used to ensure that the denominator is non-zero, and γ and β are trainable affine transformation parameters. A deep network may suffer from overfitting problems. Therefore, CAM is used to enrich the features of the input signal, which helps to reduce the network’s depth while improving its performance. The implementation of CAM can be expressed as
O C A M   =   LayerNorm ReLU Conv log 1   +   X

2.2.3. Self-Attention Module

In recent years, attention-based models have been successfully applied to many deep learning tasks and have achieved impressive performance. These tasks include machine translation [30] and speech enhancement [34]. To ensure that the network can adapt to a variety of different reverberation environments, a multi-head attention mechanism in the self-attention module (SAM) is introduced to learn the dynamic representation of the input features. Figure 2 shows the diagram of the multi-head attention module, where the number of heads is 2.
It has been found beneficial to replicate the attention mechanism into multiple heads, each being able to focus on different subsequences of the input by using different query (Q), key (K), and value (V). Q, K, and V are the input vectors of the attention mechanism. In the multi-head attention mechanism, they are first mapped to Q’, K’, and V’ through linear transformation, respectively. Then they are divided into multiple subsequences based on the number of heads to focus on the information in different subspaces. Qh, Kh, and Vh denote the subsequences on different heads, respectively, where h = 1, 2, …, M, and M is the number of heads. The similarity between Qh and Kh determines the weight distribution of Vh. Here, a scaled dot product is used to measure the similarity, which can be expressed as
Similarity Q h , K h   =   SoftMax Q h K h d K h
where d K h is the dimension of the vectors in the submatrix Kh.
Attention is a weighted summation of the similarity and Vh. It is a compact dynamic representation including relevant information learned from the whole subsequence. Therefore, attention can be defined as
Attention Q h , K h , V h   =   SoftMax Q h K h d K h V h
Finally, the attention vectors from each head are concatenated, and a linear transformation is performed to generate a new dynamic representation of the input features. Thus, multi-head attention can be expressed as
Attention Q , K , V   =   Concat Attention Q h , K h , V h W
A normalization layer with a residual connection is used to ensure the stability of the dynamic representation of the input features. It is worth noting that in SAM, Q, K, and V come from the same sequence, which is the output of CAM. This is why it is called self-attention. Therefore, the implementation of SAM can be expressed as
O S A M   =   LayerNorm O C A M   +   Attention O C A M , O C A M , O C A M

2.2.4. Convolution Module

In ACANet, a large number of residual units are used to build the convolutional module (CM). The deep residual network is a deep network that has been widely used in recent years. It consists of a large number of residual units, and has achieved remarkable performance in accuracy and convergence [27]. In CM, a pre-activated residual unit [28] is used because it performs better than post-activation. Figure 3 shows the pre-activation residual unit. It consists of two 1D convolutional layers, and the ReLU activation function in each layer is applied before the convolution operation.
Therefore, the implementation of the pre-activation residual unit can be expressed as
O R U   =   X   +   Conv ReLU LayerNorm Conv ReLU LayerNorm X
where X is the input of each residual unit.
Reverberation may cause a smearing effect in the spectrogram. To ensure the performance of reverberation suppression, more contextual information needs to be captured while learning the mapping function. Enlarging the receptive field size is a commonly used method for CNNs to capture more contextual information. In general, increasing the depth or width of the network is the most commonly used method to expand the receptive field of CNN, but increasing the depth of the network will drastically increase the network’s computational cost and memory consumption. Dilated convolution [46] makes a tradeoff between increasing the depth and width of the network, which can minimize the depth of the network while increasing the receptive field. For example, the receptive field of a 1D dilated convolutional network with kernel size 3 and dilation rate 2 is (4n + 1). The receptive field of a standard convolution network with kernel size 3 and dilation rate 1 is (2n + 1), where n is the depth of the network. Therefore, the receptive field of one-layer dilated convolution is equal to the receptive field of two-layer standard convolution. In CM, dilated convolution with dilation rate 2 and standard convolution are used to construct the residual units, corresponding to the dilated convolution blocks and convolution blocks in Figure 1, respectively.
Table 1 illustrates the parameters of each convolutional layer used in the experiments. To minimize the training time of the network while maximizing its reverberation suppression performance, 14 convolutional layers are deployed in the CM. Increasing the number of channels in a deep neural network means increasing the number of features available during the training process. Thus, the first layer performs a linear projection from 256-D to 512-D to double the number of features. The last layer performs a linear projection from 512-D to 256-D to recover the number of channels. In the remaining 12 convolutional layers, dilated and standard convolutions are deployed interleaved, achieving a receptive field size of 38. Compared with a 12-layer standard convolution, the receptive field is expanded by 1.52 times. In addition, the same padding is applied to all 14 convolutional layers to ensure that the input sequence is the same length as the output sequence.

2.2.5. Reconstruction Module

The common goal of the above modules is to output a multiplication mask, and the reconstruction module (RM) aims to use this multiplicative mask to suppress the reverberation in the spectrogram of the observed signal. First, the Hadamard product of the spectrogram matrix and the multiplication mask is computed. In Figure 1, ⊗ represents the Hadamard product operator. Then, a 1 × 1 convolutional layer with a ReLU activation function is used as the fully connected layer of the network to achieve better regression performance. Since the data have been normalized to [0, 1] during the joint time–frequency domain processing, the network’s output needs to be non-negative, which can be achieved by the ReLU activation function. Ocm is used to denote the output of the CM. Thus, the implementation of the RM can be defined as
O R M   =   ReLU ( Conv ( X O C M ) )

2.2.6. Loss Function

The training process of ACANet aims to make the difference between the spectrogram matrix output by the network and the spectrogram matrix of the target echo signal as small as possible. On the one hand, a more negligible difference means a better reverberation suppression performance. On the other hand, this also maximizes the power difference between the target echo signal and the background interference. Therefore, the mean squared error (MSE) is used as the loss function when training the reverberation suppression network. The MSE loss function can be expressed as
L Θ   =   F X     S 2 2
where Φ is the parameter learned during training, F is the mapping function learned by the network, and ‖∙‖2 denotes the L2 norm.

3. Data and Implementation

3.1. Dataset

3.1.1. Training Dataset

The ACANet is trained with simulated data. Table 2 lists the configurations for simulated training and test datasets. Specifically, 3 frequencies, 4 bandwidths, and 3 pulse widths are used to generate 36 LFM signals, which are the sonar system’s transmitted signals. Assume that the source level of the sonar system is 220 dB, the emission period is 3 s, the distance to the sea surface is 20 m, the depth of the ocean channel is 300 m, and the target is 50 m away from the seabed. This study simulated three targets, containing one, two, and three highlights, respectively. Each target is activated by 36 transmitted signals. Based on this, 108 clean target echo signals are generated in the simulation. Reverberation is a random process, and 10 reverberations are generated for each target echo signal. In general, the reverberation interference suffered in short-range detection tasks is very serious, while that in long-range detection tasks is relatively slight. Therefore, to simulate different reverberation levels, the reverberation and the target echo signal are combined according to five different SRRs. Finally, a dataset with 5400 training data points is obtained in this study.
Figure 4 shows the STFT spectrograms of nine observed signals randomly selected from the training dataset. This training dataset contains different transmitted signals, target echo signals with different numbers of highlights, reverberation in different environments, and observed signals with different SRRs, which can reflect the variability and complexity of the underwater environment to a certain extent. Thus, the reverberation suppression network can improve its performance and efficiency by training with a dataset with robust features.

3.1.2. Test Dataset

The reverberation suppression performance of ACANet is also evaluated with simulated data. In this phase, 27 LFM signals are randomly selected from the above 36 LFM signals as the transmitted signals of the sonar system. Then, the target echo signals with different powers and highlight structures are generated in the simulation, which ensures that the target highlight features in the test dataset differ from the training dataset. By setting different seeds for the random number generator, three different reverberations are generated for each target echo signal. Finally, the reverberation and the target echo signal are combined according to 5 different SRRs to form a test dataset consisting of 1215 data points.

3.2. Implementation Detail

The initial parameters of ACANet are a learning rate of 2 × 10⁻³, batch size of 64, and epoch of 20. The Adam optimization algorithm is used to update the parameters of the network, which is more efficient than traditional gradient descent and stochastic gradient descent. The Adam optimization algorithm can also adjust the learning rate automatically during training.
PyTorch 1.12.1 and Python 3.8 are applied to train and test the proposed ACANet. All the simulations and experiments are conducted on Windows 10 with an Intel Core i5-10400 CPU, 16 G RAM, and Nvidia GeForce GTX 1080 Ti GPU. The Nvidia CUDA 11.6 and cuDNN 8.4.1 are employed to speed up the training process.
The joint time–frequency domain processing in Section 2.2.1 is designed and performed in MATLAB R2022a. With this exception, the whole network is designed and performed in Python.

4. Results

4.1. Evaluation Metrics

Peak signal-to-noise ratio (PSNR) and SRR are used as the primary metrics to evaluate the proposed ACANet. For both of these metrics, a higher value indicates better performance.
The PSNR evaluation is defined as
PSNR   =   10 log 10 M A X 2 / M S E
where MAX is the maximum value of the spectrogram matrix, and MSE is the error between the spectrogram of the clean target echo signal and the ACANet output.
The SRR evaluation is expressed as
SRR   =   10 log 10 P s / P r
where Ps is the power of the clean target echo signal, and Pr is the power of the reverberation.

4.2. Evaluation Results

First, an ablation study was conducted to assess the effectiveness of the various modules that make up ACANet; the results are provided in Table 3. The reverberation suppression performance of the proposed ACANet is evaluated with multiple groups of input signals containing one, two, and three highlights, respectively. Each group has three columns corresponding to three different reverberation environments. The results are reported in terms of PSNR. The table first includes the PSNR evaluation results for the unprocessed input signal. Next, in each row, an additional feature is added to the ACANet. They all further improve the performance of the network.
The second row provides the results when the baseline system is introduced, which consists of the convolutional module (CM) and the reconstruction module (RM) proposed in Section 2.2.4 and Section 2.2.5, respectively. Benefiting from the dilated convolution, which has a larger receptive field and the residual connection, thus overcoming the gradient disappearance problem, the baseline system offers significant performance improvements over input signals. The PSNR evaluation results of each group of input signals are improved by 7.34, 6.38, and 5.21 dB on average, respectively.
The third row provides the results when the cepstrum analysis module (CAM) is introduced, which is proposed in Section 2.2.2. This module is used to extract the features of the input signal in the cepstrum domain. Compared with the baseline system, the PSNR evaluation results of each group of input signals are improved by 0.67, 0.69, and 0.77 dB on average, respectively. The results illustrate that the reverberation suppression performance is further improved after adding this module, especially for those input signals with multiple highlights. Thus, the proposed CAM is beneficial for processing multi-highlight input signals in reverberation suppression tasks.
The last row provides the results when the self-attention module (SAM) is introduced, which is proposed in Section 2.2.3. The suggested SAM can dynamically represent global features while focusing on the vital part of the input signal. The PSNR evaluation results of each group of input signals are improved by 0.24, 0.25, and 0.54 dB on average, respectively. Therefore, SAM also significantly improves performance when dealing with multi-highlight input signals.
Moreover, Table 3 reveals that the range of PSNR results for the baseline system is 3.87 dB. With the introduction of CAM, the range changed to 3.94 dB. The final range is reduced to 3.35 dB after the introduction of SAM. It can be seen that the proposed SAM makes the dispersion of the results smaller. Therefore, SAM improves the robustness of the network to a certain extent.
Figure 5 shows the difference in reverberation suppression results generated by the SAM. It can be seen from Figure 5b that the network consisting of the baseline system and the CAM suppresses the reverberation effectively. However, the reconstructed signal lost some components. In Figure 5c, the addition of SAM makes the proposed ACANet reconstruct the signal more completely.
Next, an experiment was designed to compare the performance of the proposed ACANet with the method from Jia et al. [25], representing a state-of-the-art solution for single-channel underwater reverberation suppression. They use the NMF with matrix rotation as a low-rank preprocessing to suppress the reverberation. The premise of the NMF algorithm to suppress the reverberation is that the signal must be low-rank. Therefore, matrix rotation is used as a preprocessing method in [25] to ensure the low rank of the LFM signal on the spectrograms. However, for multi-highlight target echo signals, the multi-highlight structure destroys the low-rank feature of the signal. Therefore, the NMF algorithm cannot effectively suppress the reverberation in multi-highlight signals.
As the PSNR evaluation results in Table 4 indicate, the NMF algorithm does suffer from significant performance degradation when dealing with multi-highlight input signals. For some groups of input signals, it even leads to counterproductive reverberation suppression performance. The proposed ACANet also faces the same performance degradation problem. Due to the rich features brought by CAM and the robustness brought by SAM, the evaluation results after decay are within an acceptable range. Under this PSNR, the target echo signal is relatively pure, and the structure of the highlights is pronounced.
The final experiment is conducted to verify the reverberation suppression performance difference under five PSNRs and five SRRs. As shown in Table 5, with the increase in input PSNR and SRR, the reverberation in input signals gradually decreases. Therefore, the PSNR and SRR gain that the reverberation suppression method can bring gradual decreases. At this time, the matrix rotation preprocessing method, which cannot make multi-highlight LFM signals satisfy the low-rank condition, becomes a fatal flaw of NFM. Thus, the counterproductive reverberation suppression performance caused by the NMF algorithm becomes more apparent. In contrast, the proposed ACANet provides performance improvements for all input signals. Compared with the NMF algorithm proposed in [25], the evaluation results of the proposed ACANet are improved by about 3–5 dB.
Figure 6, Figure 7 and Figure 8 show the spectrogram results of the pre-rotation NMF method and the proposed ACANet. Specifically, Figure 6b illustrates that the pre-rotation NMF method suppresses the reverberation well when there is only one highlight in the signal. However, it could perform better when it comes to multi-highlight signals. Since the matrix rotation preprocessing fails to make multi-highlight signals to satisfy the low-rank condition, the results of the NMF method deteriorate predictably. In Figure 7b and Figure 8b, it can be seen that the structure of the highlight has changed, which may lead to the failure of tasks such as target recognition.
From Figure 6c, Figure 7c and Figure 8c, it can be seen that the reverberation suppression performance of the proposed ACANet is relatively stable. It can effectively complete the reverberation suppression job while retaining the highlight features of the target echo signal. By analyzing output spectrograms of the proposed ACANet, target parameters can be predicted based on features such as the time delay between highlights.

5. Conclusions and Future Scope

Reverberation is the primary background interference for active sonar systems. Therefore, reverberation suppression is a crucial issue in underwater active sonar detection tasks. To improve the reverberation suppression performance for most underwater targets, which usually contain multiple highlights, the ACANet with a multi-head self-attention module and a cepstrum analysis module is proposed. Systematic evaluations demonstrate that due to the rich cepstrum features provided by CAM, the dynamic features and robustness provided by SAM, and the larger receptive field provided by CM, the proposed ACANet is very effective at reverberation suppression in active sonar observed signals. On the one hand, the ACANet performs better than NMF methods in suppressing reverberation in single-highlight observed signals, with about 5 dB improvement in PSNR evaluation. On the other hand, when processing multi-highlight input signals that destroy the signal’s low-rank feature, it is difficult for NMF methods to separate target echo signals and reverberations. In contrast, the ACANet improves the PSNR of the input signal by about 7 dB. The robustness of the ACANet makes it effectively suppress the reverberation in multi-highlight signals and the trained model generalizes well to untrained reverberation environments.
Further research will focus on completely reconstructing the target echo signal in the time–frequency spectrogram. From the above analysis, the proposed ACANet shows impressive reverberation suppression performance. However, it only suppresses the reverberation via a multiplicative mask. The reconstructed target echo signal still differs from the clean target echo signal. One of the reasons for this result may be the low resolution of the STFT time–frequency distribution, which leads to reverberation and target echo signal coupling. Thus, the target echo signal affected by the reverberation needs to be further enhanced. Since the target echo signal has the same time–frequency structure as the transmitted signal, the enhancement of the target echo signal can fully use the known features of the transmitted signal.

Author Contributions

Conceptualization, Q.H., Y.H. and Z.W.; methodology, X.W., Y.H. and H.W.; software, X.W., H.W., X.H. and C.H.; validation, Y.H.; formal analysis, Q.H., Y.H., X.H. and C.H.; investigation, Y.H. and H.W.; resources, Q.H.; data curation, Y.H.; writing—original draft preparation, Y.H.; writing—review and editing, Q.H., X.W. and Y.H.; visualization, Y.H.; supervision, Q.H. and X.W.; project administration, Q.H.; funding acquisition, Q.H. All authors have read and agreed to the published version of the manuscript.

Funding

This research was funded by the Major Program of the National Natural Science Foundation of China, Grant No. 61890961, the General Program of the National Natural Science Foundation of China, Grant No. 61971412, the National Defense Basic Research Project of China, Grant No. JCKY2020110C074, and the Rapid Support Fund Project of China, Grant No. 61404150405.

Institutional Review Board Statement

Not applicable.

Informed Consent Statement

Not applicable.

Data Availability Statement

Data supporting the findings of this study are available from the corresponding author upon reasonable request.

Acknowledgments

The authors would like to thank the financial support offered by the Major Program of the National Natural Science Foundation of China (Grant No. 61890961), the General Program of the National Natural Science Foundation of China (Grant No. 61971412), the National Defense Basic Research Project of China (Grant No. JCKY2020110C074), and the Rapid Support Fund Project of China (Grant No. 61404150405).

Conflicts of Interest

The authors declare no conflict of interest.

References

  1. Etter, P.C. Underwater Acoustic Modeling and Simulation, 5th ed.; CRC Press: Boca Raton, FL, USA, 2018; pp. 275–314. ISBN 978-0-429-22538-3. [Google Scholar]
  2. Wang, Y.; He, Y.; Wang, J.; Shi, Z. Comb Waveform Optimisation with Low Peak-to-average Power Ratio via Alternating Projection. IET Radar Sonar Navig. 2018, 12, 1012–1020. [Google Scholar] [CrossRef]
  3. Cox, H.; Lai, H. Geometric Comb Waveforms for Reverberation Suppression. In Proceedings of the 1994 28th Asilomar Conference on Signals, Systems and Computers, Pacific Grove, CA, USA, 31 October–2 November 1994; Volume 2, pp. 1185–1189. [Google Scholar] [CrossRef]
  4. Doisy, Y.; Deruaz, L.; van IJsselmuide, S.P.; Beerens, S.P.; Been, R. Reverberation Suppression Using Wideband Doppler-Sensitive Pulses. IEEE J. Ocean. Eng. 2008, 33, 419–433. [Google Scholar] [CrossRef]
  5. Collins, T. Active Sonar Pulse Design, 1st ed.; University of Birmingham: Birmingham, UK, 1996; pp. 97–119. [Google Scholar]
  6. Hague, D.A.; Buck, J.R. The Generalized Sinusoidal Frequency Modulated Waveform for High Duty Cycle Active Sonar. In Proceedings of the 2014 48th Asilomar Conference on Signals, Pacific Grove, CA, USA, 2–5 November 2014; pp. 148–152. [Google Scholar] [CrossRef]
  7. Soli, J.; Hickman, G. Co-Prime Comb Signals for Active Sonar. In Proceedings of the OCEANS 2015—MTS/IEEE Washington, Washington, DC, USA, 19–22 October 2015; pp. 1–5. [Google Scholar] [CrossRef]
  8. Yue, L.; Liang, H.; Duan, T.; Dai, Z. A Reverberation Suppression Method Based on the Joint Design of a PTFM Waveform and Receiver Filter. Entropy 2022, 24, 1707. [Google Scholar] [CrossRef] [PubMed]
  9. Jaffer, A.G. Constrained Partially Adaptive Space-Time Processing for Clutter Suppression. In Proceedings of the 1994 28th Asilomar Conference on Signals, Systems and Computers, Pacific Grove, CA, USA, 31 October–2 November 1994; Volume 1, pp. 671–676. [Google Scholar] [CrossRef]
  10. Mio, K.; Chocheyras, Y.; Doisy, Y. Space Time Adaptive Processing for Low Frequency Sonar. In Proceedings of the OCEANS 2000 MTS/IEEE Conference and Exhibition, Conference Proceedings (Cat. No.00CH37158), Providence, RI, USA, 11–14 September 2000; Volume 2, pp. 1315–1319. [Google Scholar] [CrossRef]
  11. Li, W.; Ma, X.; Zhu, Y.; Yang, J.; Hou, C. Detection in Reverberation Using Space Time Adaptive Prewhiteners. J. Acoust. Soc. Am. 2008, 124, EL236–EL242. [Google Scholar] [CrossRef] [PubMed]
  12. Sasi, N.M.; Sathidevi, P.S.; Pradeepa, R.; Gopi, S. A Low Complexity STAP for Reverberation Cancellation in Active Sonar Detection. In Proceedings of the 2010 IEEE Sensor Array and Multichannel Signal Processing Workshop, Jerusalem, Israel, 4–7 October 2010; pp. 245–248. [Google Scholar] [CrossRef]
  13. Zhang, Y.; Chen, S.; Hao, C. A Novel Adaptive Reverberation Suppression Method for Moving Active Sonar. In Proceedings of the 2021 OES China Ocean Acoustics (COA), Harbin, China, 14–17 July 2021; pp. 831–835. [Google Scholar] [CrossRef]
  14. Xing, G.; Cai, Z. Ocean Reverberation Suppressing by Direct Data Domain Based STAP. In Proceedings of the 2012 IEEE 11th International Conference on Signal Processing, Beijing, China, 21–25 October 2012; pp. 2085–2088. [Google Scholar] [CrossRef]
  15. Cohen, L. Time-Frequency Distributions-a Review. Proc. IEEE 1989, 77, 941–981. [Google Scholar] [CrossRef]
  16. Choi, H.-I.; Williams, W.J. Improved Time-Frequency Representation of Multicomponent Signals Using Exponential Kernels. IEEE Trans. Acoust. Speech Signal Process. 1989, 37, 862–871. [Google Scholar] [CrossRef]
  17. Li, X.; Xia, Z. Research of Underwater Bottom Object and Reverberation in Feature Space. J. Marine. Sci. Appl. 2013, 12, 235–239. [Google Scholar] [CrossRef]
  18. Kay, S.; Salisbury, J. Improved Active Sonar Detection Using Autoregressive Prewhiteners. J. Acoust. Soc. Am. 1990, 87, 1603–1611. [Google Scholar] [CrossRef]
  19. Li, X.; Yang, Y.; Meng, X. Morphological characteristics separation of underwater target echo and reverberation in time and frequency domain. Acta Acust. 2017, 42, 169–177. [Google Scholar] [CrossRef]
  20. Virtanen, T. Monaural Sound Source Separation by Nonnegative Matrix Factorization with Temporal Continuity and Sparseness Criteria. IEEE Trans. Audio Speech Lang. Process. 2007, 15, 1066–1074. [Google Scholar] [CrossRef]
  21. Mohammadiha, N.; Smaragdis, P.; Leijon, A. Supervised and Unsupervised Speech Enhancement Using Nonnegative Matrix Factorization. IEEE Trans. Audio Speech Lang. Process. 2013, 21, 2140–2151. [Google Scholar] [CrossRef]
  22. Lee, S.; Lim, J. Reverberation Suppression Using Non-Negative Matrix Factorization to Detect Low-Doppler Target with Continuous Wave Active Sonar. EURASIP J. Adv. Sig. Process. 2019, 2019, 11. [Google Scholar] [CrossRef]
  23. Kim, G.; Lee, K.; Lee, S. Linear Frequency Modulated Reverberation Suppression Using Non-Negative Matrix Factorization Methods, Dechirping Transformation and Modulo Operation. IEEE Access 2020, 8, 110720–110737. [Google Scholar] [CrossRef]
  24. Kim, G.; Lee, S. Reverberation Suppression Method for Active Sonar Systems Using Non-Negative Matrix Factorization with Pre-Trained Frequency Basis Matrix. IEEE Access 2021, 9, 148060–148075. [Google Scholar] [CrossRef]
  25. Jia, H.; Li, X. Underwater Reverberation Suppression Based on Non-Negative Matrix Factorisation. J. Sound Vib. 2021, 506, 116166. [Google Scholar] [CrossRef]
  26. Schmidhuber, J. Deep Learning in Neural Networks: An Overview. Neural Netw. 2015, 61, 85–117. [Google Scholar] [CrossRef]
  27. He, K.; Zhang, X.; Ren, S.; Sun, J. Deep Residual Learning for Image Recognition. In Proceedings of the 2016 IEEE Conference on Computer Vision and Pattern Recognition (CVPR), Las Vegas, NV, USA, 27–30 June 2016; pp. 770–778. [Google Scholar] [CrossRef]
  28. He, K.; Zhang, X.; Ren, S.; Sun, J. Identity Mappings in Deep Residual Networks. In Proceedings of the 14th European Conference on Computer Vision (ECCV), Amsterdam, The Netherlands, 8–16 October 2016; Volume 9908, pp. 630–645. [Google Scholar] [CrossRef]
  29. Hu, Y.; Liu, Y.; Lv, S.; Xing, M.; Zhang, S.; Fu, Y.; Wu, J.; Zhang, B.; Xie, L. DCCRN: Deep Complex Convolution Recurrent Network for Phase-Aware Speech Enhancement. arXiv 2020, arXiv:2008.00264. [Google Scholar]
  30. Vaswani, A.; Shazeer, N.; Parmar, N.; Uszkoreit, J.; Jones, L.; Gomez, A.N.; Kaiser, Ł.; Polosukhin, I. Attention Is All You Need. arXiv 2017, arXiv:1706.03762. [Google Scholar]
  31. Xu, Y.; Du, J.; Dai, L.-R.; Lee, C.-H. A Regression Approach to Speech Enhancement Based on Deep Neural Networks. IEEE/ACM Trans. Audio Speech Lang. Process. 2015, 23, 7–19. [Google Scholar] [CrossRef]
  32. Han, K.; Wang, Y.; Wang, D.; Woods, W.S.; Merks, I.; Zhang, T. Learning Spectral Mapping for Speech Dereverberation and Denoising. IEEE/ACM Trans. Audio Speech Lang. Process. 2015, 23, 982–992. [Google Scholar] [CrossRef]
  33. Borgstrom, B.J.; Brandstein, M.S. The Speech Enhancement via Attention Masking Network (SEAMNET): An End-to-End System for Joint Suppression of Noise and Reverberation. IEEE/ACM Trans. Audio Speech Lang. Process. 2020, 29, 515–526. [Google Scholar] [CrossRef]
  34. Zhao, Y.; Wang, D.; Xu, B.; Zhang, T. Monaural Speech Dereverberation Using Temporal Convolutional Networks with Self Attention. IEEE/ACM Trans. Audio Speech Lang. Process. 2020, 28, 1598–1607. [Google Scholar] [CrossRef]
  35. Zou, B.; Wang, X.; Feng, W.; Zhu, H.; Lu, F. DU-CG-STAP Method Based on Sparse Recovery and Unsupervised Learning for Airborne Radar Clutter Suppression. Remote Sens. 2022, 14, 3472. [Google Scholar] [CrossRef]
  36. Kou, S.; Feng, X.; Huang, H.; Bi, Y. A Space-Time Adaptive Processing Method Based on Sparse Reconstruction of Reverberation Interference. JNWPU 2020, 38, 1179–1187. [Google Scholar] [CrossRef]
  37. Chen, W.; Xie, W.; Wang, Y. Short-Range Clutter Suppression for Airborne Radar Using Sparse Recovery and Orthogonal Projection. IEEE Geosci. Remote Sens. Lett. 2022, 19, 3500605. [Google Scholar] [CrossRef]
  38. Shang, Z.; Huo, K.; Liu, W.; Sun, Y.; Wang, Y. Knowledge-Aided Covariance Estimate via Geometric Mean for Adaptive Detection. Digit. Signal Process. 2020, 97, 102616. [Google Scholar] [CrossRef]
  39. Zhu, G.; Song, Z.; Yin, J.; Liu, B.; Liu, J. Extracting target highlight feature based on low-rank matrix recovery in reverberation background. Acta Acust. 2019, 44, 471–479. [Google Scholar] [CrossRef]
  40. Kazimierski, W.; Zaniewicz, G. Determination of Process Noise for Underwater Target Tracking with Forward Looking Sonar. Remote Sens. 2021, 13, 1014. [Google Scholar] [CrossRef]
  41. Wawrzyniak, N.; Stateczny, A. MSIS Image Postioning in Port Areas with the Aid of Comparative Navigation Methods. Polish Marit. Res. 2017, 24, 32–41. [Google Scholar] [CrossRef]
  42. Liu, B.; Huang, Y.; Chen, W.; Lei, J. Principles of Underwater Acoustics, 3rd ed.; Science China Press: Beijing, China, 2019; pp. 217–261. ISBN 978-7-03-063011-7. [Google Scholar]
  43. Tang, W. Highlight model of echoes from sonar targets. Acta Acust. 1994, 19, 92–100. [Google Scholar] [CrossRef]
  44. Zheng, F.; Zhang, G.; Song, Z. Comparison of Different Implementations of MFCC. J. Comput. Sci. Technol. 2001, 16, 582–589. [Google Scholar] [CrossRef]
  45. Glorot, X.; Bordes, A.; Bengio, Y. Deep Sparse Rectifier Neural Networks. In Proceedings of the Fourteenth International Conference on Artificial Intelligence and Statistics, Fort Lauderdale, FL, USA, 11–13 April 2011; Volume 15, pp. 315–323. [Google Scholar]
  46. Yu, F.; Koltun, V. Multi-Scale Context Aggregation by Dilated Convolutions. arXiv 2015, arXiv:1511.07122. [Google Scholar]
Figure 1. Diagram of the proposed ACANet.
Jmse 11 00313 g001
Figure 2. Diagram of the multi-head attention module.
Jmse 11 00313 g002
Figure 3. Diagram of the residual unit.
Jmse 11 00313 g003
Figure 4. STFT spectrogram of nine observed signals in the training dataset. Frequency, bandwidth, and pulse width for each plot are, respectively, (a) 35 kHz, 10 kHz, 3 ms; (b) 40 kHz, 5 kHz, 3 ms; (c) 30 kHz, 5 kHz, 3 ms; (d) 30 kHz, 10 kHz, 5 ms; (e) 40 kHz, 10 kHz, 5 ms; (f) 30 kHz, 8 kHz, 3 ms; (g) 40 kHz, 10 kHz, 5 ms; (h) 40 kHz, 8 kHz, 3 ms; (i) 35 kHz, 8 kHz, 1 ms.
Jmse 11 00313 g004
Figure 5. Reverberation suppression results: (a) input signal; (b) output of the proposed ACANet without SAM; (c) output of the proposed ACANet.
Jmse 11 00313 g005
Figure 6. Reverberation suppression results for the signal with one highlight: (a) input signal; (b) output of the NMF method; (c) output of ACANet.
Jmse 11 00313 g006
Figure 7. Reverberation suppression results for the signal with two highlights: (a) input signal; (b) output of the NMF method; (c) output of ACANet.
Jmse 11 00313 g007
Figure 8. Reverberation suppression results for the signal with three highlights: (a) input signal; (b) output of the NMF method; (c) output of ACANet.
Jmse 11 00313 g008
Table 1. Conventional module architecture in ACANet.
Layer1D CNN LayerLayer-NormActivationBlock
in Figure 1
Kernel SizeInput
Channels
Output ChannelsDilation
132565121ReLU1D Conv
235125122ReLUDilated Conv Block
335125122ReLU
435125121ReLUConv Block
535125121ReLU
635125122ReLUDilated Conv Block
735125122ReLU
835125121ReLUConv Block
935125121ReLU
1035125122ReLUDilated Conv Block
1135125122ReLU
1235125121ReLUConv Block
1335125121ReLU
1435122561ReLU1D Conv
Table 2. Configuration for simulated dataset.
ItemTraining DatasetTest Dataset
Target3 targets contain 1, 2, and 3 highlights, respectively
Transmitted Signal3 (frequency) × 4 (bandwidth)
× 3 (pulse width) = 36
3 (frequency) × 3 (bandwidth)
× 3 (pulse width) = 27
Target Echo Signal36 for each target27 for each target
Reverberation10 for each target3 for each target
Observed Signal36 × 3 × 10 × 5 (SRRs) = 540027 × 3 × 3 × 5 (SRRs) = 1215
Table 3. Ablation study for the ACANet.
MethodsPSNR
Number of
Highlights
123
Input23.9424.3924.1023.0023.3223.3122.8822.9123.06
Baseline system31.5831.7631.1129.6129.6929.4728.3628.2427.89
Cepstrum Analysis32.0132.6831.7830.2030.3930.2429.1528.9028.74
Self-Attention32.4332.6932.0930.4330.6830.4829.7129.3629.34
Table 4. Evaluation results of input signals with different numbers of highlights.
MethodsPSNR
Number of
Highlights
123
Input23.9424.3924.1023.0023.3223.3122.8822.9123.06
NMF *27.2427.5627.1223.3423.4023.2921.9021.8421.83
ACANet *32.4332.6932.0930.4330.6830.4829.7129.3629.34
* Comparison of ACANet to the NMF with matrix rotation preprocessing.
Table 5. Evaluation results of input signals with five different PSNRs and SRRs.
MethodsPSNRSRR
Input18.5519.6822.2526.1230.58−9.2−3.981.226.4111.6
NMF *21.8122.6424.3725.7326.28−5.94−1.013.346.037.3
ACANet *26.5926.2927.4930.3232.94−1.172.646.4610.6113.96
* Comparison of ACANet to the NMF with matrix rotation preprocessing.
Disclaimer/Publisher’s Note: The statements, opinions and data contained in all publications are solely those of the individual author(s) and contributor(s) and not of MDPI and/or the editor(s). MDPI and/or the editor(s) disclaim responsibility for any injury to people or property resulting from any ideas, methods, instructions or products referred to in the content.

