1. Introduction
The demand for precious metals (e.g., copper and cobalt) has been steadily soaring across the globe, owing to the dire need for decarbonizing our future. These metals are essential to move toward the electrification of the transport sector (i.e., manufacturing battery-powered vehicles). Since the terrestrial mineral deposits are depleting, the deep-sea floor has recently been receiving a great attention from industrialists and scientists [
1]. Immense amounts of strategic metals and rare-earth elements are embedded into the ocean floor, in particular into potato-sized concretions termed polymetallic nodules [
2]. These nodules are amazingly rich in key metals such as cobalt, copper, manganese and nickel, and are found at typical water depths of 4–6.5 km in all oceans. In particular, they are abundantly scattered on the ocean floor within the Clarion Clipperton Zone (CCZ) [
3].
Companies are very keen to get their hands on thesse nodules, but the potential environmental impact of deep-sea mining is still a major matter of concern [
4]. Therefore, a minimal environmental impact is a key performance metric for nodule collectors, together with the pick-up efficiency. There are primarily three mechanisms to harvest polymetallic nodules: mechanical, hydraulic and hybrid [
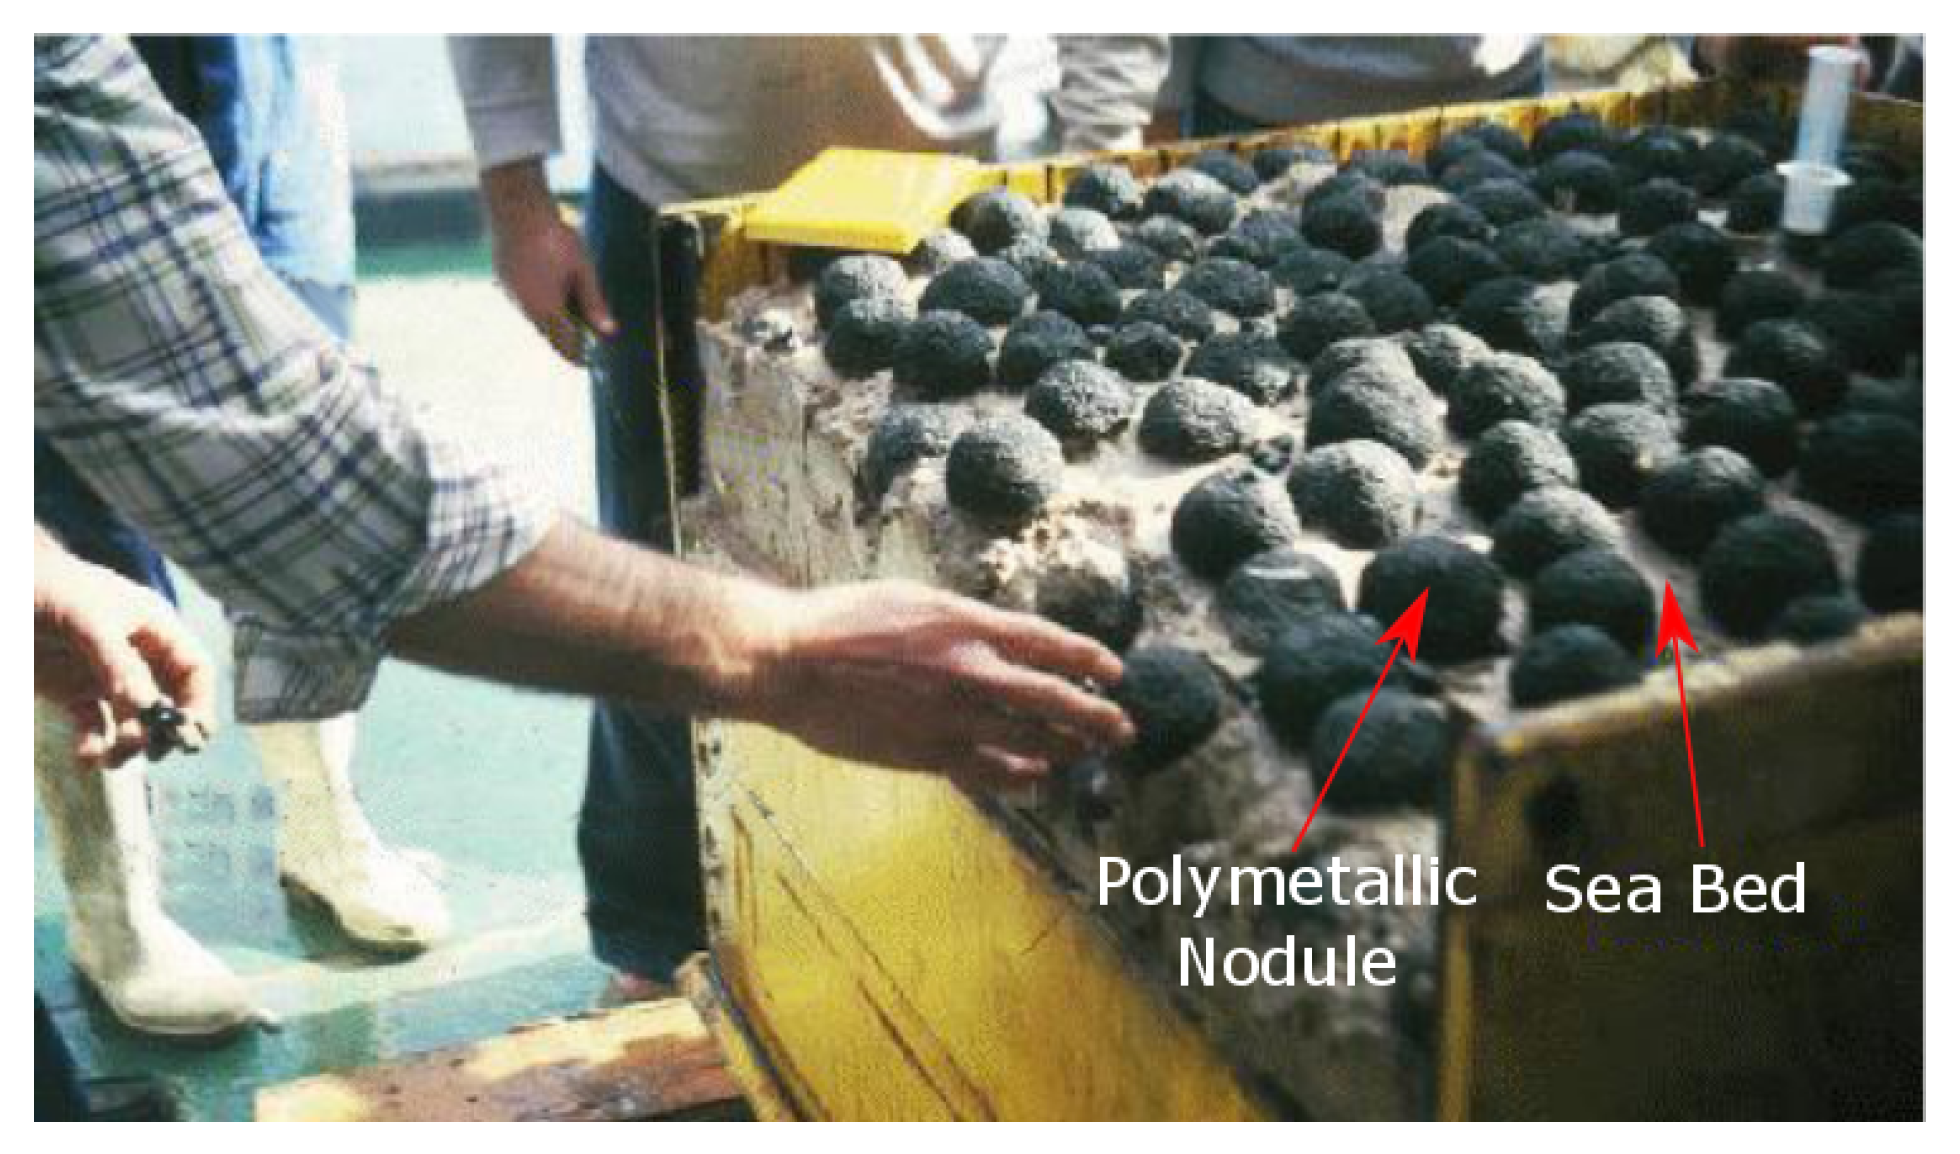
5]. To date, the hydraulic mechanism is the most widely considered technique, because it barely involves direct contact between the hydraulic collector and the seabed. However, hydraulic collectors also disturb the seabed; polymetallic nodules are partially/completely buried into the sediment of the ocean floor (see
Figure 1), implying that sediments are inevitably kicked up and collected together with the nodules during the mining process. As a result, the sediments are discarded at the rear of the hydraulic collectors, creating a sediment plume traveling across the ocean floor. This plume could conceivably drift or be transported by background ocean currents for long distances away from mining sites, disrupting aquatic ecosystems in their track. The prediction of the evolution and fate of these plumes is central to the environmental impact assessment of deep-sea mining activities [
6,
7,
8,
9]. To this end, the characteristics of the sediment-water mixture discharged at the rear of the collector should be determined [
10]. A key parameter of this discharge is the sediment concentration, which is governed by the depth of the sediment layer picked up by the collector while operating. Therefore, it is fundamentally important to develop a solid understanding of the interaction of hydraulic collectors with the sea bed, which will eventually pave the way for a collector that results in the least environmental impact.
There is a paucity of direct measurements detailing flow fields and quantifying the thickness of the sediment layer disturbed by hydraulic polymetallic-nodule collectors (termed hereafter as the ’erosion depth’). This precluded the prediction of sediment erosion during nodule mining and thus the assessment of the overall effectiveness of collectors. Therefore, we conducted a series of small-scale experiments in a water flume where a hydraulic collector functioning based on Coandă-effect drives over a subaqueous sand bed. Several operational conditions were investigated, delivering the very first quantitative data for sediment erosion resulting from such a collector. This article presents and discusses the acquired experimental results and observations. The experimental measurements provide better insights into the effect of crucial parameters for the effectiveness of the collector (i.e., main jet velocity, secondary jet velocity, collector’s forward velocity and bottom clearance) on the extent to which the bed-sediment is disturbed. Additionally, the measurements are utilized to explore the physics governing the depth of the disturbed bed by the collector. Lastly, the article discusses the salient implications of the findings of this study for the collector design, pointing out directions to minimize the extent of the accompanying sediment plumes. It is worth mentioning that the measurements obtained within this study may also be utilized for the validation of numerical models employed for the improvement of the collector design.
2. Coandă-Effect-Based Collector
Several hydraulic collection methods were considered in the literature, such as suck-up-based method [
12], Coandă-effect-based method [
13,
14], and double-jet method [
15]. Coandă-effect-based collectors are expected to result in smaller disturbance to the sediments, since the nozzle flow does not directly interact with the seabed [
16].
The collector considered in our study utilizes the fluid-mechanical phenomenon of Coandă-effect to dislodge and collect nodules hydraulically. It is worth noting that this is the most mature technology for nodule collection so far, and it has been employed in most recent pilot testing (i.e., GSR [
6], Blue Nodules [
17] and TMC [
18]). Additionally, design analysis of such collector systems has been performed in recent publications, e.g., [
14,
19,
20]. Intriguingly, Coandă effect, named after the Romanian scientist Henri Coandă, is the tendency of a jet flow to keep adhering to an adjacent surface, even if it curves [
21].
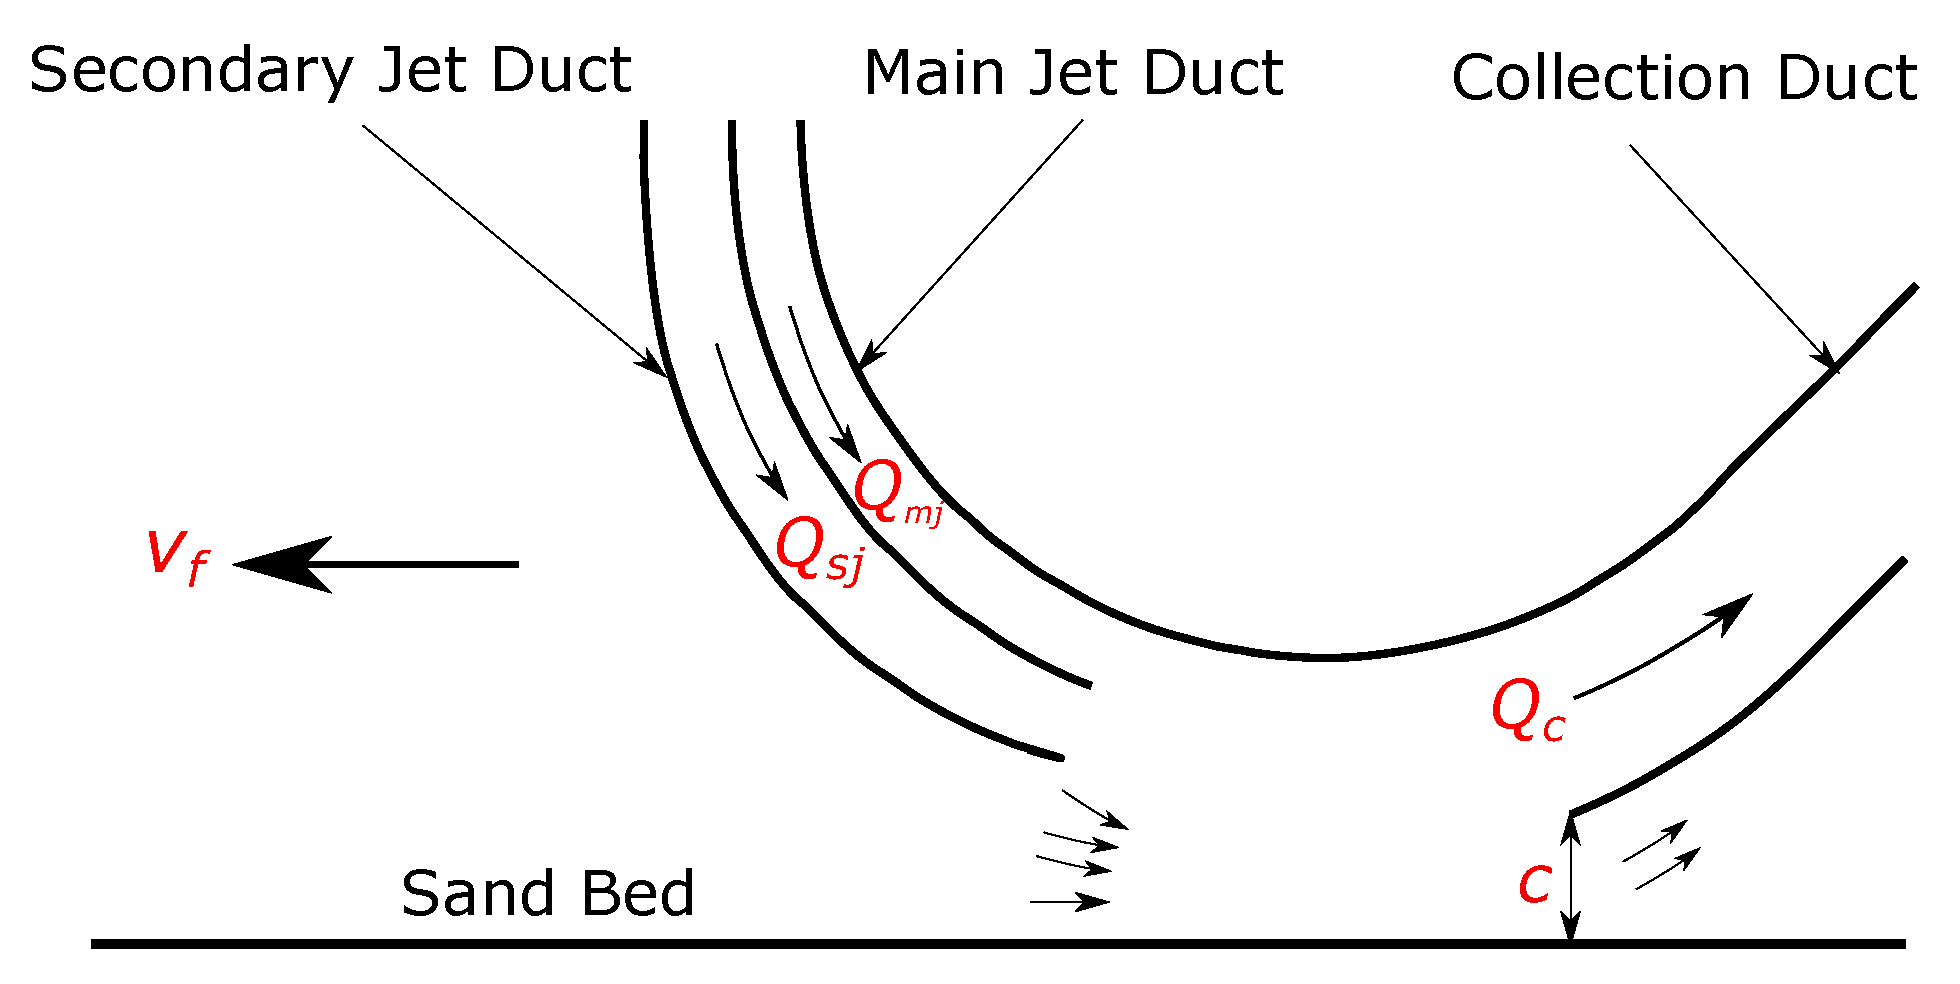
Figure 2 shows a diagrammatic representation of the fundamental design of our Coandă-effect-based collector. It consists of four curved surfaces, forming three ducts: main jet duct, secondary jet duct and a collection duct. As a result of the Coandă effect, the high-velocity water jets flowing through the jet ducts follow the curvature of the upper curved plate. This causes entrainment of the ambient water towards the collection duct, which produces a pressure difference (suction) under the collector, thereby dislodging nodules from the seabed and dragging them along towards the collection duct [
14].
3. Laboratory Experiments
This section describes the experimental setup, instrumentation, test procedure and characterization of sand deposit, respectively.
3.1. Experimental Setup
The experimental setup is composed of several components: the collector head, a mobile carriage, three PVC hoses, water pumps, and a water flume. The size of the collector head was governed by the scale of the used water flume. Therefore, the collector head presented in Alhaddad et al. [
14] was scaled down by a factor of 4 in the 2-D plane shown in
Figure 2, while the third dimension (width) was 20 cm. The collector head was fabricated from high-density polyethylene (HDPE) in various parts, which were eventually fastened together with bolts and nuts, and sealed with gaskets. To allow it to drive, it was fastened on a mobile carriage that can automatically run along bespoke railways (5 m long) at the top of the water flume with a constant, but controllable forward velocity. In this setting, the net distance that the carriage can travel from the beginning to the end of the railways is 3.2 m.
Each jet duct was connected to a water pump using a hose of 40 mm inner diameter, while the collection duct was connected to a third water pump using a hose of 63 mm inner diameter. The flow rate through the three ducts is controlled using variable-frequency drives (VFDs). The water flume (15 m long, 0.4 m wide and 0.47 m high) was divided into two compartments using a gate made of a geotextile filter (opening size = 0.04 mm), which allows water to pass through it while it holds sediments in place. The tests are performed in one compartment (‘testing compartment’), while the other compartment (‘sedimentation compartment’) is used to collect the sand-water mixture flowing through the collection duct. At the end of each experiment, the sediment particles settle down into the sedimentation compartment, so the sediment can be reused in following experimental runs.
Figure 3 shows a real view of the experimental setup where the used equipment is labelled.
3.2. Instrumentation
The experimental setup was equipped with two electromagnetic flowmeters to monitor the flow rate in the jet hoses and an acoustic flowmeter to monitor the flow rate in the collection hose. To measure bed disturbance depth (or ’erosion depth’), three optical sensors (optoNCDT 1302) were attached to the mobile carriage, which can measure the distance from the sensor to the sand bed, while the carriage drives along the water flume. Since the optical sensors were used underwater, they were mounted into a custom-built watertight housing. In addition, a wheel encoder was used to pinpoint the position of sensors, and thus the measurements along the flume.
3.3. Test Procedure and Data Acquisition
Every test was conducted following the next sequence of steps:
The water flume is half filled with clean water.
Sand is placed into the testing compartment until reaching the target depth, which is defined based on the target bottom clearance, c.
The sand bed is levelled using a level wooden plate, which was fastened on the mobile carriage. To level the bed, the carriage slowly drives several times back and forth along the flume.
Additional clean water is supplied into the water flume until reaching a water level of 40 cm, leaving a clearance of 7 cm between the water surface and the top of the flume. This top clearance is adequate to warrant that water will not overspill due to the surface waves generated by the movement of the collector head.
The mobile carriage slowly drives forward along the flume to measure the initial bathymetry using the optical sensors. Thereupon, it drives backward towards the starting point.
Using the VFDs, the water pumps are switched on at the frequencies required to obtain the target flow rate in each duct (calibration was conducted earlier). To make sure there is no water spill, two submersible pumps are used to drain water constantly from the flume.
The mobile carriage drives forward at the required forward velocity and halts at the end of the railways; a sensor was mounted at each end point of the railway to force the carriage to come to a halt there.
After waiting about 2 min, to allow suspended sediment particles to settle down, the carriage drives once again along the flume to measure the final bathymetry.
Table 1 summarises the initial conditions of the experiments conducted within this study. The bed disturbance depth for each test was quantified based on the difference between the initial and final bathymetries.
3.4. Characterization of Sand Deposit
A fine sand (GEBA weiss) of
= 0.145 mm was used in the experiments. The Laser Diffraction technique was used to determine the cumulative grain size distribution (see
Figure 4). The minimum porosity,
= 0.38, and maximum porosity,
= 0.48, were determined from sand compaction tests. The in situ porosity,
= 0.42, was measured by collecting sand cores from the bed. The main characteristics of the sand used are summarized in
Table 2. It is to be noted that the deep-sea sediment, in which the polymetallic nodules are buried, is primarily composed of clay. Nonetheless, we conducted our experiments using sand instead, to conduct a larger number of tests and to investigate more operational conditions; using clayey sediment requires more time and effort and will be considered in future research.
4. Experimental Results
4.1. General Description of Sediment Erosion
While the collector drives forward over the sand bed, a layer of sand is eroded and part of which is picked-up by the collector towards the collection duct. The rest of the eroded sand is suspended in the water column behind the collector head, consequently generating a turbidity flow (see
Figure 5). The reason why not all eroded sand ends up into the collection duct is that not only do the water jets entrain ambient water into the collection duct, but also entrain/inject water behind the collector head (termed hereafter as the ’spilling water’) (see
Figure 2). This water flows backward, in the opposite direction of the collector movement, with sufficient velocity to carry sand particles in suspension. The suspended particles settle down at the sand bed within 1–2 min after the end of an experimental run, forming a deposition layer of a few millimeters on the bed.
As a result of sand erosion, a shallow trench is created at the sand bed (see
Figure 6 left). Our visual observations, along with erosion measurements, show that sand erosion is not uniform across the flume width. Rather, the erosion is the highest at the middle of the flume width (which coincides with the middle of the collector width) and declines towards the position of the collector sides. This is in agreement with the lateral structure of the jets velocities.
In the following, we will analyse the relationship between the amount of sand erosion and key parameters for the effectivity of the collector in question. The erosion depths documented in this section are measured at the middle of the flume width (Point 2 in
Figure 6 right), while the deposition depths are the average of the depths of the sand layer deposited near the side walls of the flume (Point 1 and Point 3 in
Figure 6 right), where sand erosion does not occur.
Two erosion depths are distinguished in this paper: net erosion depth,
, which results from the sand collected by the collector, and total erosion depth,
, which results from both the sand collected by the collector and the sand carried in suspension behind the collector head. In other words, the total erosion depth is the summation of the net erosion depth and the deposition depth,
d. It is to be noted that all documented depths are the average value over the first traveling distance of 1.4 m.
Figure 7 depicts the bathymetry change over this distance.
4.2. Main and Secondary Jets
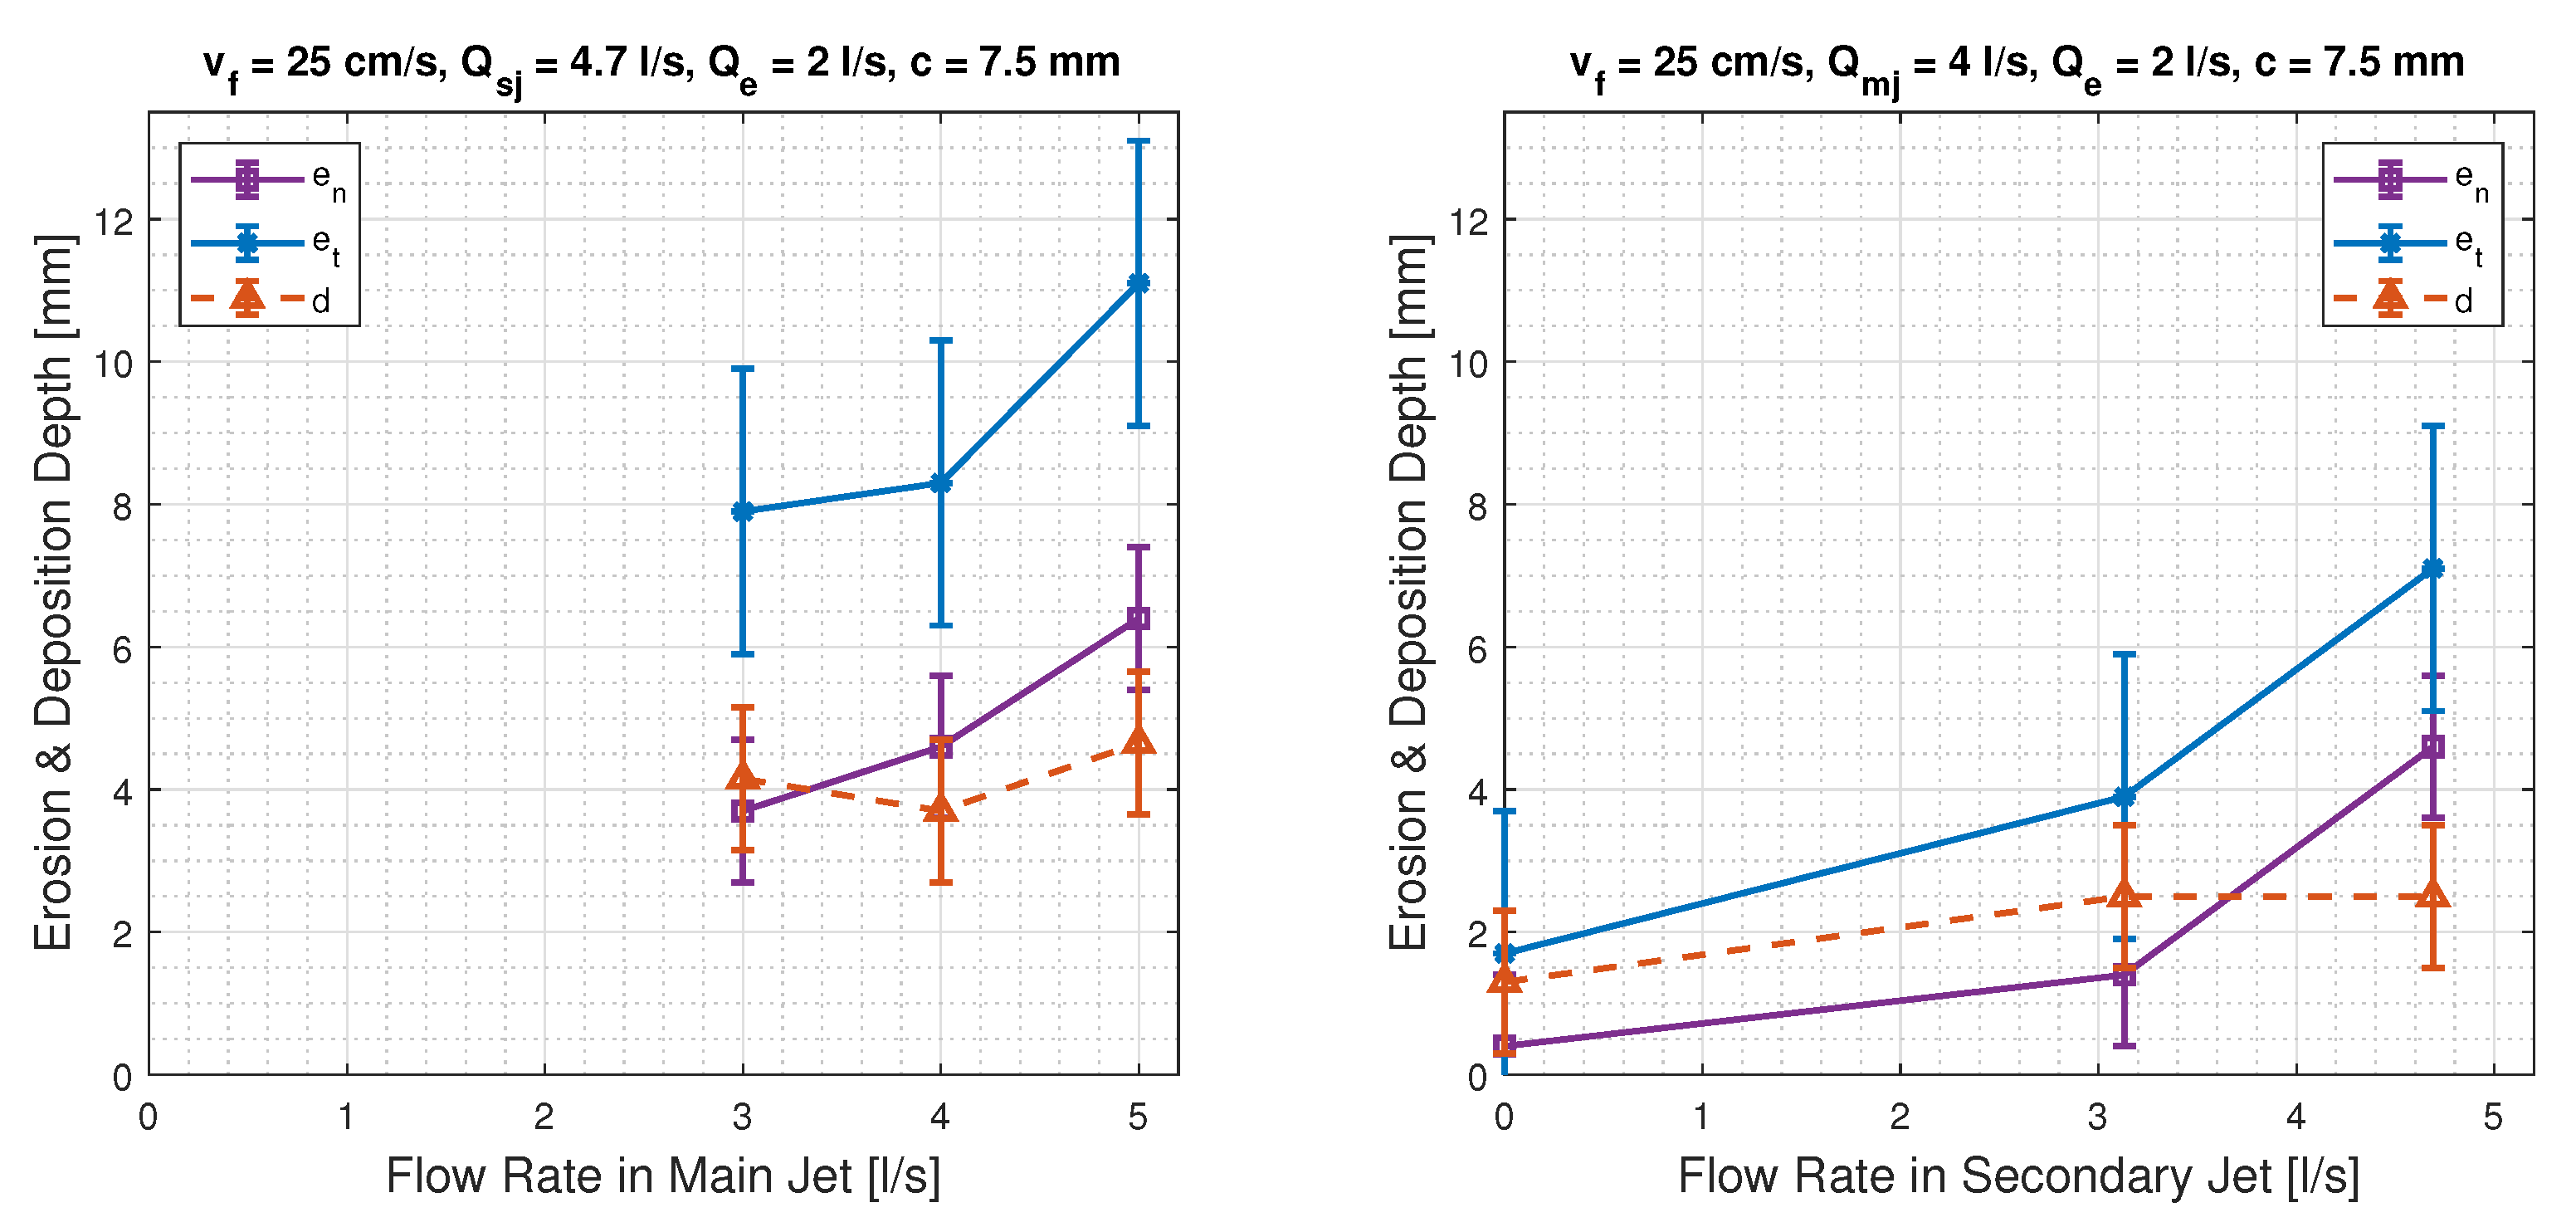
The erosion and deposition depths were measured for experimental runs of different flow rates through the main jet,
(see
Figure 8 left). It can clearly be seen that a higher
results in a larger erosion depth. The same holds for the effect of the flow rates through the secondary jet,
(see
Figure 8 right). However, it is observed that the erosion depth is minimal, when
is zero, indicating that the presence of a secondary jet enhances sand erosion. The reason behind the observed correlations between the flow rates in the jets and sediment erosion will be explored in
Section 5.
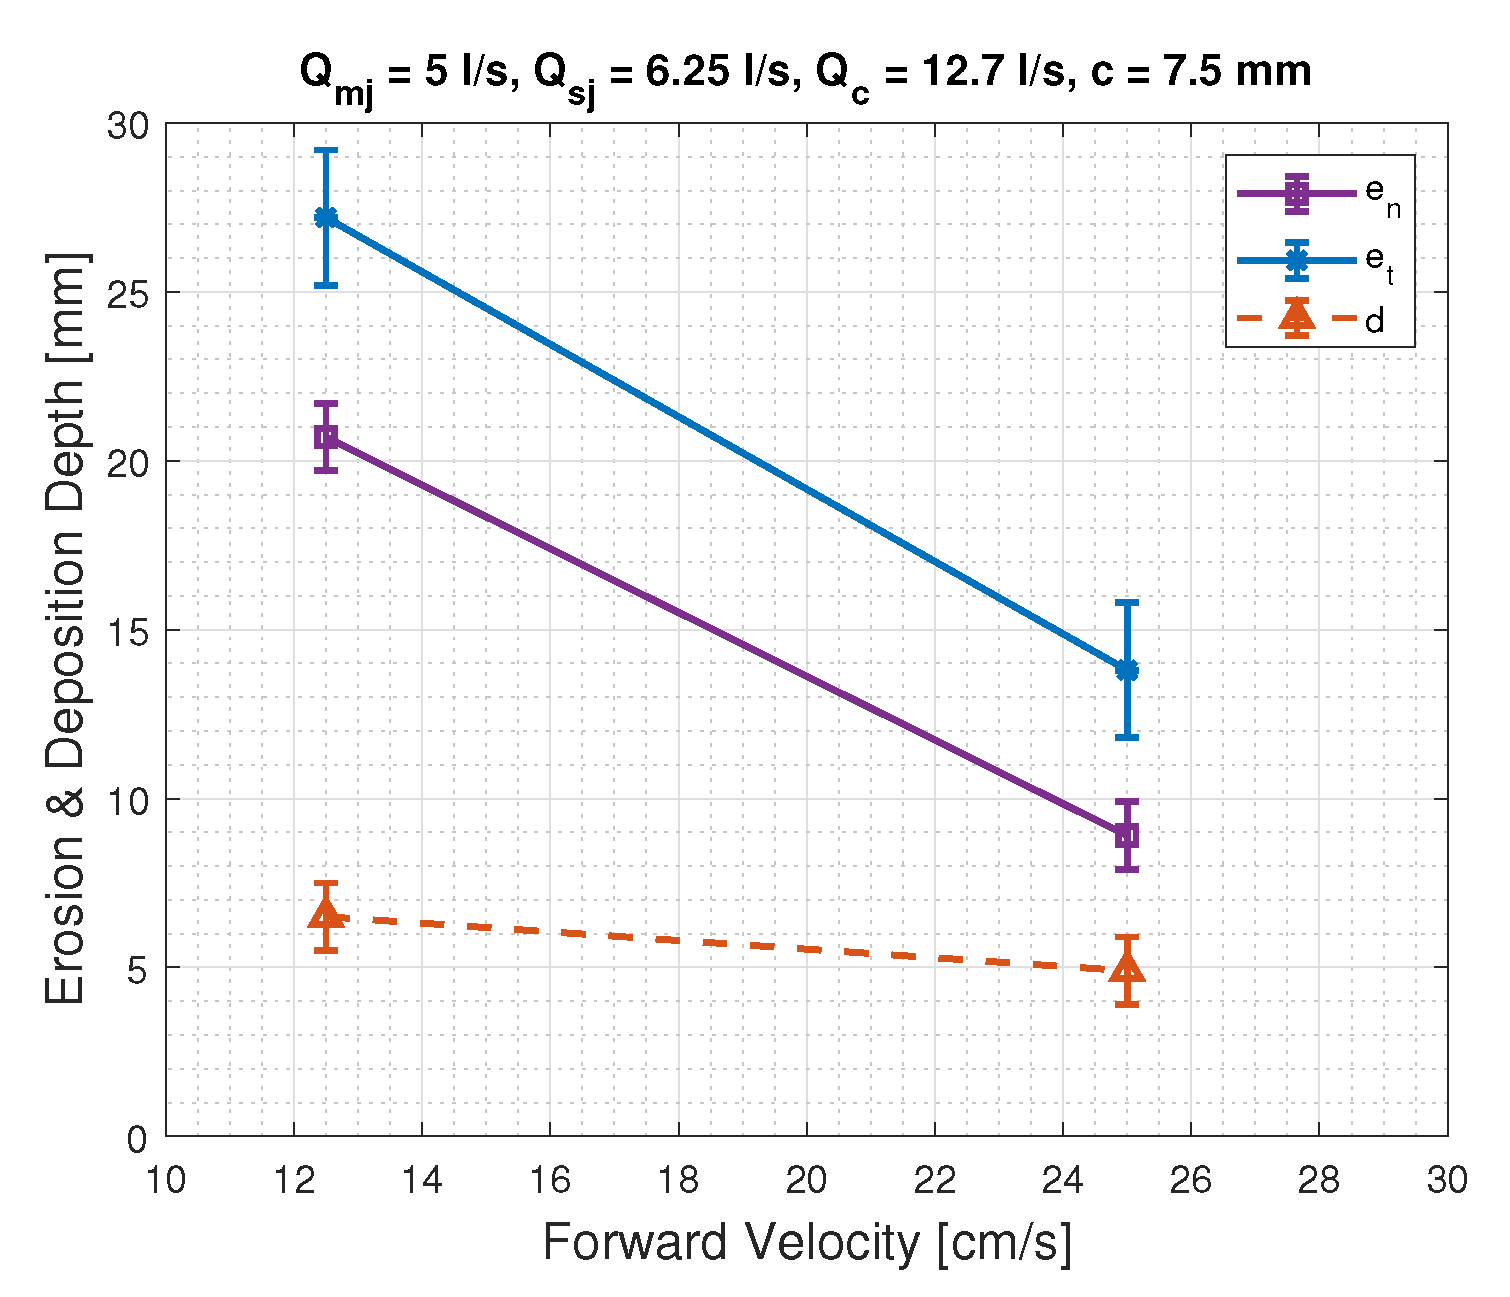
4.3. Collector’s Forward Velocity
The collector’s forward velocity,
, plays an influential role in the erosion process. Unsurprisingly, the experimental results distinctly demonstrate that a lower
leads to a larger erosion depth (see
Figure 9). This correlation is expected, as a lower
means that the sand bed is exposed to the water jets for a longer time, consequently eroding a thicker layer of sediment.
4.4. Bottom Clearance
The experimental results show that a smaller bottom clearance results in a larger erosion depth (see
Figure 10). This correlation is also expected and is attributed to the fact that a larger sand layer is exposed to the water jets, when the underside of the collector is closer to the sand bed.
5. Sediment Erosion
The ability to predict the depth of the sediment layer picked up by the collector is crucial to estimate the hydrodynamics of the sediment plume generated behind the collector, in particular the run-out distance. This is because the amount of sediment that passes through the collector will define the sediment concentration at the discharge duct at the rear of the collector, which is a key parameter to any numerical model used to predict the extent of the sediment plume. In the following, we seek after the main mechanism by which the sand bed is eroded when the collector at hand is in operation.
5.1. Shear-Stress Erosion
To investigate whether or not the sediment is picked up mainly through the flow-induced shear stress exerted on the sediment bed, we need measurements of the flow velocity right above the bed. To this end, we operated the collector in a stationary mode (
= 0) and used a high-speed camera (IL5HM8512D Fastec, frame rate = 308 fps) to obtain velocity fields of a few tests. Instead of solid particles, we allowed air bubbles to pass through the collector, which functioned as a seed material (see
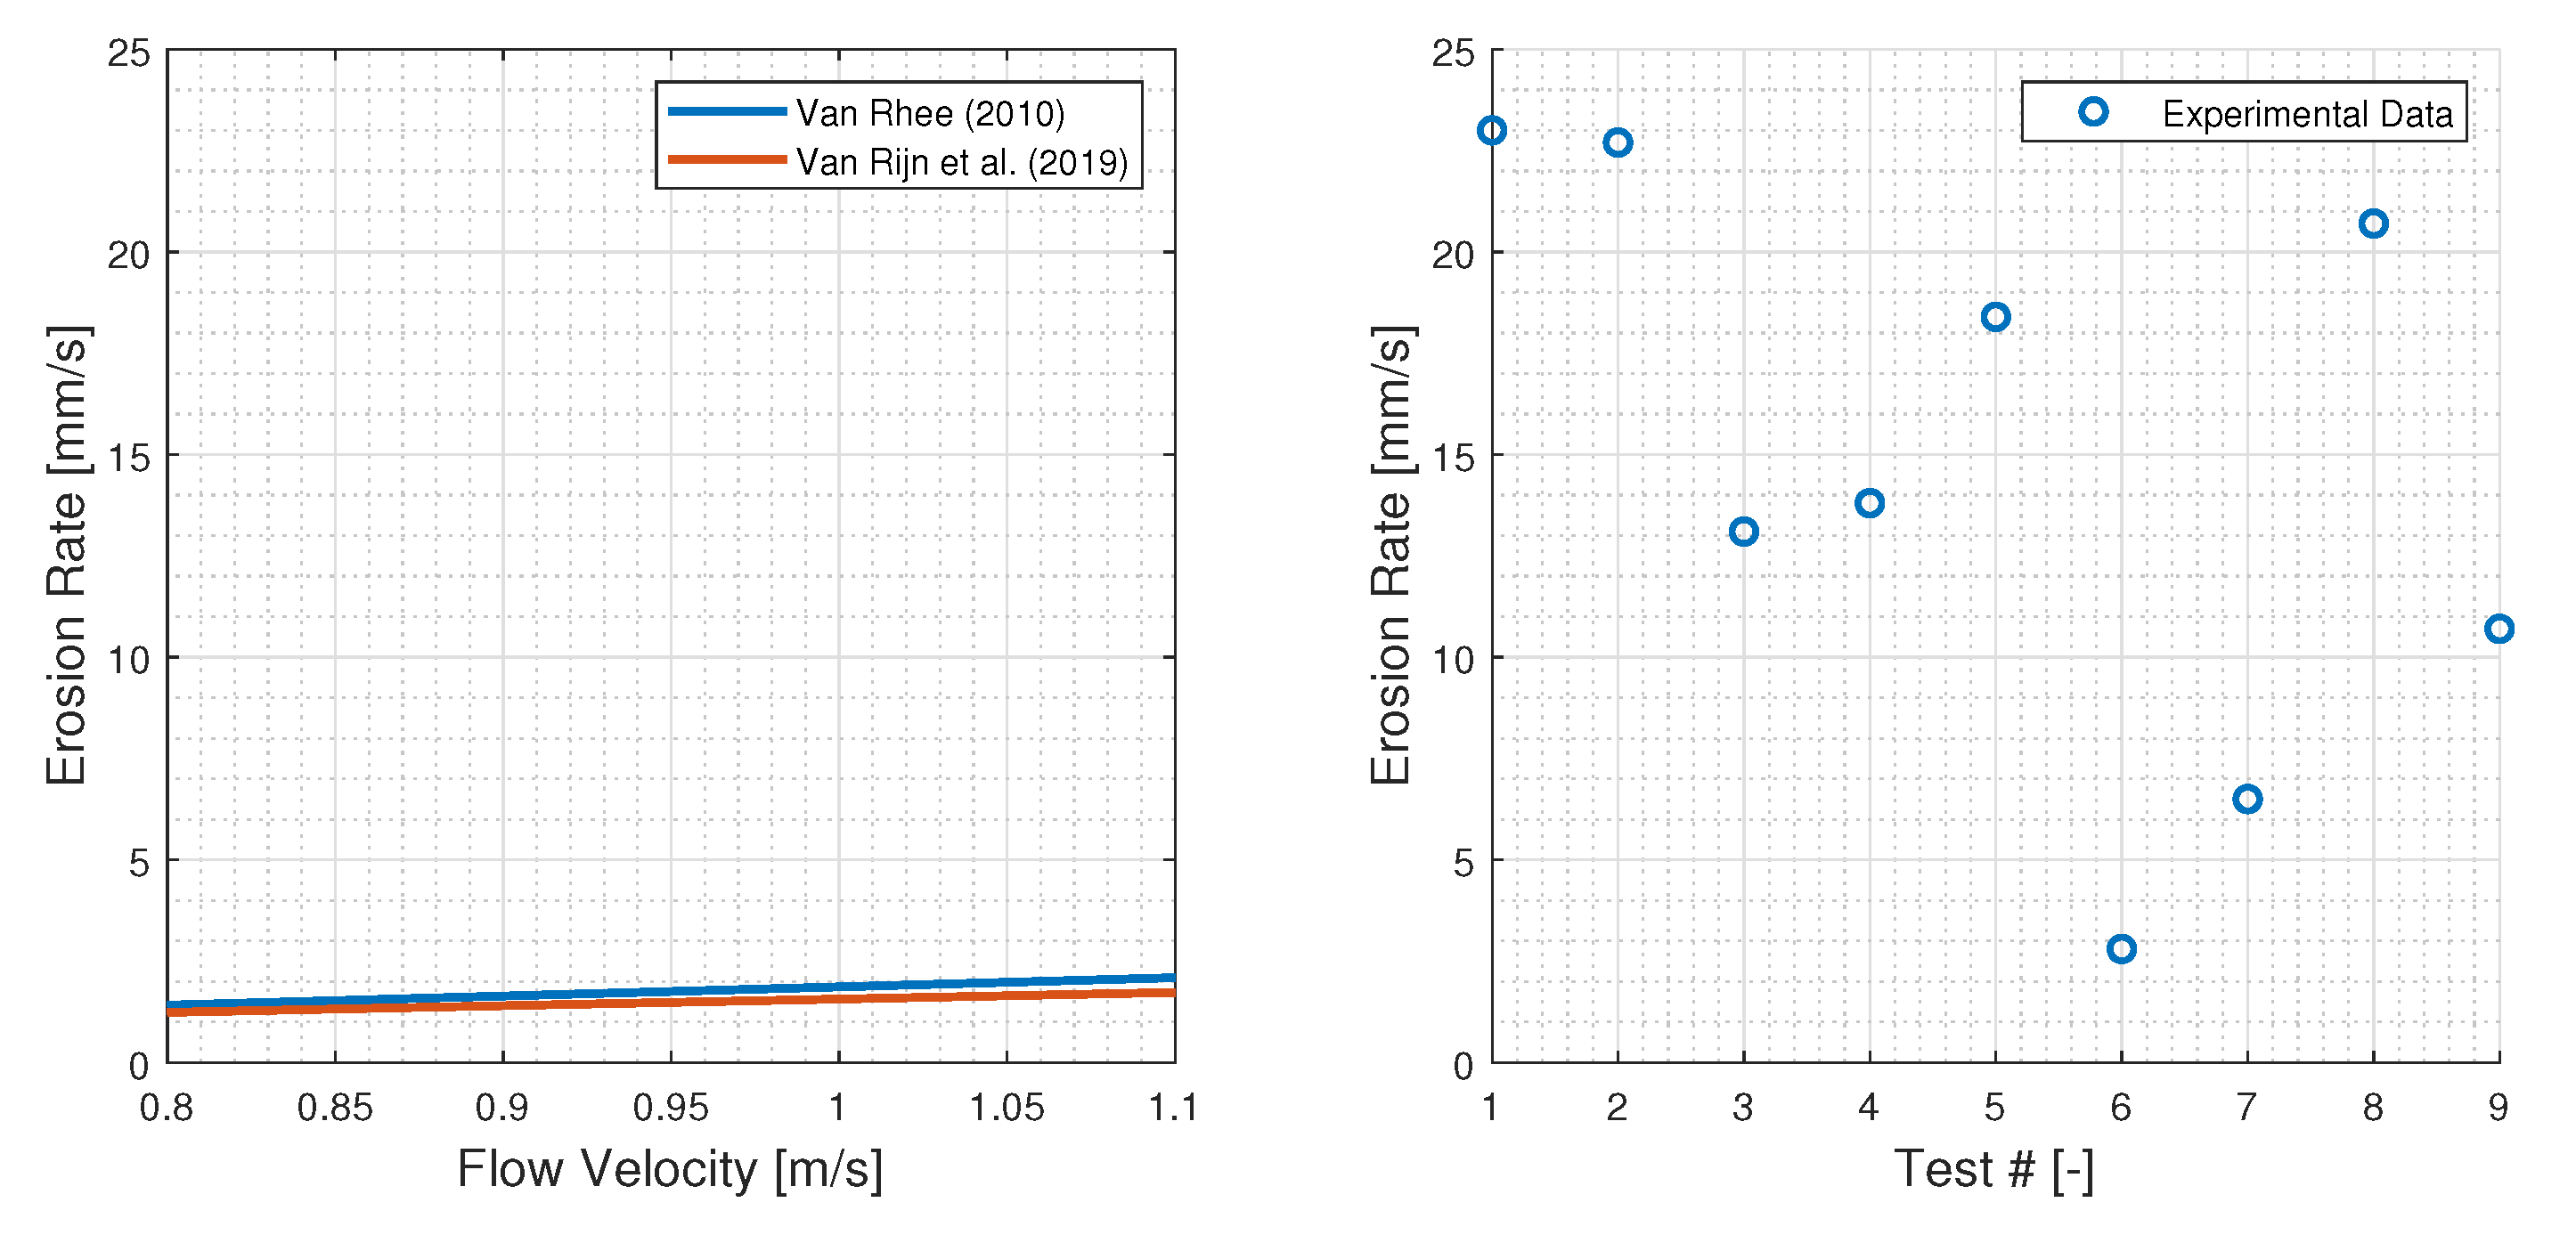
Figure 11). The flow measurements visualize the direction of the flow under and behind the collector head, illustrating that most of the water flow ends up into the collection duct and a small portion of it spills behind the collector head. For Test 4, Test 5 and Test 8, the horizontal flow velocity right above the bed was found to range between 0.8–1.1 m/s.
Assuming that the sand bed is primarily eroded by the flow-induced shear stress, the pick-up functions of Van Rhee [
22] and Van Rijn et al. [
23], which are well-suited for such a case, are used here to estimate the erosion rate of the bed sediment (see
Figure 12). For the sake of comparison, we can convert the erosion depths measured within this study to erosion rates. This can be conducted by calculating the time span over which a certain point on the sediment bed is exposed to the flow; exposure time can be defined as the length of sediment transect exposed to the flow (ca. 15 cm) divided by the forward velocity of the collector. The resulted erosion rates and the measured ones are depicted in the left and right panel of
Figure 12, respectively. It can manifestly be seen that the predicted erosion rates are considerably lower than those resulting from the experiments. This refutes the hypothesis that the collector picks up sediments predominately through the flow-induced shear stress.
5.2. Jetting Erosion
Based on our visual observations during the experiments and the videos recorded by the high-speed camera, we noticed that the flow leaving the jet ducts impinges onto the sediment bed under an inclined angle (∼40
) while keeping adhering to the curved underside of the collector (see
Figure 11). In other words, it is conjectured that the flow works as an inclined water jet hitting the sand bed, thereby destabilising and eroding sand. In the following, we provide evidence supporting the correctness of our hypothesis by revisiting experimental data of sediment erosion created by a water jet moving over non-cohesive sediment.
The current knowledge about sediment erosion resulting from moving water jets is still scant. To the best of our knowledge, there are no laboratory experiments on the erosion of a moving, submerged, inclined, water jet reported in the literature. Nevertheless, Weegenaar [
24] carried out a set of laboratory experiments on sand erosion caused by a moving, submerged, vertical jet with respect to the sand bed (
= 0.284 mm). We conducted a thorough analysis of these measurements, seeking after a correlation between the erosion depth and a flow property. Consequently, we revealed a pronounced logarithmic correlation between the erosion depth and the impinging force exerted by the flow onto the sediment bed (see
Figure 13); a larger striking force results in a larger erosion depth.
The total force exerted by a water jet onto a sediment bed is equal to the rate of change of momentum in the direction of the water jet through a control volume. In the case of a vertical water jet, a control volume encapsulating the water jet and the sediment bed can be established (see
Figure 14 left). The impingement of the water jet on the sediment bed reduces the jet velocity component normal to the bed to zero, resulting in a force
F reading:
where
is water density,
A is the cross sectional area of the jet nozzle and
v is the jet velocity at the exit of the nozzle.
For the collector, the resultant force,
F, exerted by the water jets on the bed is calculated by considering the control volume shown in the right panel of
Figure 14 and by determining the component forces
and
in the
x and
y directions, respectively. Since we could not quantify the velocity of water spilling behind the collector head in our tests, we will perform our analysis of the total impinging force assuming that there is no water entrainment occurring during the operation of the collector. It is worth noting that the contribution of the water entrainment to the total striking force is negligible compared to the water jets and will not change the drawn conclusions of this study. The component forces and resultant force read:
where
is the velocity of the water jet when the two jet ducts are combined,
(40
) is the angle between
and X-axis,
is the flow velocity in the collection duct,
(45
) is the angle between
and X-axis and
is the mass per unit time entering/leaving the control volume and can be calculated as:
In our analysis, we consider all the tests in which
= 25 cm/s and
c = 7.5 mm, as these represent the vast majority of the tests performed. Nevertheless, we exclude the measurements of Test 6, as we observed that the flow under the collector head does not strike the sediment bed, when the secondary jet is switched off (
= 0) due to the thinness of the flow adhering to the curved underside. Interestingly, similar to our finding using the data of Weegenaar [
24],
Figure 15 also depicts a logarithmic correlation between the impinging force and the erosion depth, evidencing that erosion is mainly caused by jetting.
5.3. Discussion
The analysis of the experimental results demonstrates that the Coandă-effect-based collector does not erode sediments mainly by the flow-induced shear stress. Rather, the water jets strike the sediment bed under an inclined angle, thereby causing a layer of sediment to collapse. The majority of the collapsing sediment will be transported with the deflecting flow into the collection duct, while the remaining part will be transported behind the collector head by the spilling water. Crucially, the latter part forms a sediment plume behind the collector, which brings about an additional environmental pressure besides the plume generated at the collector rear. The thickness of the collapsing layer (or ‘total erosion depth’) is logarithmically proportional to the impinging force of the flow.
There are two important implications of the findings of this study for the collector design. Firstly, the force exerted by the flow on the bed is the key parameter to be optimised in order to minimise the erosion depth. Once minimised, the amount of discarded sediment behind the collector through a discharge duct will be minimised, consequently reducing the corresponding environmental pressure [
10]. Secondly, the amount of the spilling water behind the collector head must also be minimised in order to reduce the amount of suspended sediment transported directly behind the collector head. As a result, the extent of the corresponding turbidity flow would be minimized.
An obvious difference in our experiments, compared to actual conditions in reality, is that we used a bare sediment bed without nodules. The effect of the presence of nodules remains to be investigated. Nonetheless, we hypothesise that the presence of the nodules would reduce the erosion depth of sediments. The collector first collects the available nodules and following that the sediment will be exposed to the flow, resulting in a shorter exposure time compared to the case of a bare sediment bed. This, in turn, leads to a smaller erosion depth, as previously discussed in this article.
6. Conclusions
To pave the way for a design of a Coandă-effect-based hydraulic collector that results in the least environmental impact, we carried out a set of small-scale experiments to explore bed-sediment erosion. Several operational conditions were tested, demonstrating the effect of a handful of critical parameters on the bed-sediment erosion. The experimental results highlight the importance of optimizing the collector’s forward velocity, since it is inversely related to bed erosion depth. In contrast, an increased jet velocity leads to a larger erosion depth. Furthermore, a smaller erosion depth is observed when the bottom clearance is larger.
It was revealed that the sediment bed is predominantly disturbed by jetting: water jets impinge obliquely on the sediment bed, leading to the collapse of the bed’s uppermost layer. Although this study does not provide a complete theoretical description of the erosion induced by an inclined water jet, it provides a solid guideline on how to minimize the sediment pick-up rate by the collector. Careful analysis of the experimental results showed that the erosion depth is logarithmically proportional to the force exerted by the flow on the sediment bed. This implies that a minimized erosion depth requires a minimized flow impinging force. Another key finding of this study is that the entrainment of the ambient water is a source of sediment plume kicking off just behind the collector head.
Author Contributions
Conceptualization and Methodology: All authors; Execution of experiments, Investigation, Data curation, Formal analysis, Visualization, Writing of original draft: S.A.; Funding acquisition and Reviewing: R.H. All authors have read and agreed to the published version of the manuscript.
Funding
This study was conducted as part of the Blue Harvesting project, which is funded by the European Institute of Innovation and Technology, EIT Raw Materials under Project Agreement 18138, Specific Grant Agreement No. [EIT/RAW MATERIALS/SGA2019/1].
Institutional Review Board Statement
Not applicable.
Informed Consent Statement
Not applicable.
Data Availability Statement
Analysed data is reported in this article.
Acknowledgments
The authors would like to thank the technicians of both Stevin-3 Laboratory and Dredging Laboratory for their assistance during the experimental work, and Royal IHC Mining for making the engineering drawings of the collector head.
Conflicts of Interest
The authors declare no conflict of interest.
References
- Sharma, R. Deep-Sea Mining: Resource Potential, Technical and Environmental Considerations; Springer: Cham, Switzerland, 2017. [Google Scholar]
- Schulz, K.J.; DeYoung, J.H.; Seal, R.R.; Bradley, D.C. Critical Mineral Resources of the United States: Economic and Environmental Geology and Prospects for Future Supply; U.S. Geological Survey: Reston, VA, USA, 2018. [Google Scholar]
- Hein, J.R.; Koschinsky, A.; Kuhn, T. Deep-ocean polymetallic nodules as a resource for critical materials. Nat. Rev. Earth Environ. 2020, 1, 158–169. [Google Scholar] [CrossRef]
- Boetius, A.; Haeckel, M. Mind the seafloor. Science 2018, 359, 34–36. [Google Scholar] [CrossRef] [PubMed]
- Min, K.S.; Shim, J.Y.; Hong, S.; Choi, J.S.; Amann, H. Conceplual Design of a Hybrid Pick-up Device For Deep Ocean Mining. In Proceedings of the Second ISOPE Ocean Mining Symposium, Seoul, Republic of Korea, 24–26 November 1997. [Google Scholar]
- GSR. Environmental Impact Statement: Small-Scale Testing of Nodule Collector Components on the Seafloor of the Clarion-Clipperton Fracture Zone and Its Environmental Impact; Technical Report; GSR: Zwijndrecht, Belgium, 2018. [Google Scholar]
- Peacock, T.; Ouillon, R. The Fluid Mechanics of Deep-Sea Mining. Annu. Rev. Fluid Mech. 2022, 55, 403–430. [Google Scholar] [CrossRef]
- Mu noz-Royo, C.; Ouillon, R.; El Mousadik, S.; Alford, M.H.; Peacock, T. An in situ study of abyssal turbidity-current sediment plumes generated by a deep seabed polymetallic nodule mining preprototype collector vehicle. Sci. Adv. 2022, 8, eabn1219. [Google Scholar] [CrossRef] [PubMed]
- Weaver, P.; Aguzzi, J.; Boschen-Rose, R.; Colaço, A.; de Stigter, H.; Gollner, S.; Haeckel, M.; Hauton, C.; Helmons, R.; Jones, D.O.; et al. Assessing plume impacts caused by polymetallic nodule mining vehicles. Mar. Policy 2022, 139, 105011. [Google Scholar] [CrossRef]
- Elerian, M.; Alhaddad, S.; Helmons, R.; van Rhee, C. Near-field analysis of turbidity flows generated by polymetallic nodule mining tools. Mining 2021, 1, 251–278. [Google Scholar] [CrossRef]
- Parianos, J.; Lipton, I.; Nimmo, M. Aspects of Estimation and Reporting of Mineral Resources of Seabed Polymetallic Nodules: A Contemporaneous Case Study. Minerals 2021, 11, 200. [Google Scholar] [CrossRef]
- Zhao, G.; Xiao, L.; Yue, Z.; Zhao, W.; Kou, Y. Investigation on Characteristics of Forces on Spherical Particles in Deep Sea Hydraulic Collecting. In Proceedings of the 29th International Ocean and Polar Engineering Conference, Honolulu, HI, USA, 16–21 June 2019. [Google Scholar]
- Lee, M.; Hong, S.; Choi, J.; Kim, H.; Yeu, T.; Min, C.; Cho, S.; Lee, T. Design optimization of a hydraulic deep-sea manganese pick-up device using Coanda effect. In Proceedings of the KSME Fall Annual Meeting, Gangwon-do, Republic of Korea; 2013; Volume 12, pp. 1660–1665. [Google Scholar]
- Alhaddad, S.; Mehta, D.; Helmons, R. Mining of Deep-Seabed Nodules Using a Coandă-Effect-Based Collector. Results Eng. 2023, 17, 100852. [Google Scholar] [CrossRef]
- Hong, S.; Choi, J.S.; Kim, J.H.; Yang, C.K. Experimental study on hydraulic performance of hybrid pick-up device of manganese nodule collector. In Proceedings of the Third ISOPE Ocean Mining Symposium, Goa, India, 8–19 November 1999. [Google Scholar]
- Zhao, G.; Xiao, L.; Yue, Z.; Liu, M.; Peng, T.; Zhao, W. Performance characteristics of nodule pick-up device based on spiral flow principle for deep-sea hydraulic collection. Ocean Eng. 2021, 226, 108818. [Google Scholar] [CrossRef]
- De Stigter, H.; Langeler, R.; Mohn, C.; de Jonge, L. Blue Nodules Deliverable Report D2.9: Test Report Second Field Test; Technical Report; Blue-Nodule: The Netherlands, 2020. [Google Scholar]
- NORI/TMC. Environmental Impact Statement: Testing of Polymetallic Nodule Collector System Components in the NORI-D Contract Area, Clarion Clipperton Zone, Pacific Ocean; Technical Report; NORI/TMC: Nauru, 2021. [Google Scholar]
- Cho, S.g.; Park, S.; Oh, J.; Min, C.; Kim, H.; Hong, S.; Jang, J.; Lee, T.H. Design optimization of deep-seabed pilot miner system with coupled relations between constraints. J. Terramechanics 2019, 83, 25–34. [Google Scholar] [CrossRef]
- Jia, H.; Yang, J.; Su, X.; Xia, Q.; Wu, K. Theoretical Prediction on Hydraulic Lift of a Coandă Effect-Based Mining Collector for Manganese Nodule. Energies 2022, 15, 6345. [Google Scholar] [CrossRef]
- Reba, I. Applications of the Coanda effect. Sci. Am. 1966, 214, 84–93. [Google Scholar] [CrossRef]
- Van Rhee, C. Sediment entrainment at high flow velocity. J. Hydraul. Eng. 2010, 136, 572–582. [Google Scholar] [CrossRef]
- Van Rijn, L.C.; Bisschop, R.; van Rhee, C. Modified sediment pick-up function. J. Hydraul. Eng. 2019, 145, 06018017. [Google Scholar] [CrossRef]
- Weegenaar, R. Sand Erosion with a Horizontally Moving Jet. Master’s Thesis, Delft University of Technology, Delft, The Netherlands, 2014. [Google Scholar]
Figure 1.
Undisturbed nodule-sediment sample demonstrating the burial of polymetallic nodules (Museum National d’Histoire Naturelle Box Corer [
11]).
Figure 1.
Undisturbed nodule-sediment sample demonstrating the burial of polymetallic nodules (Museum National d’Histoire Naturelle Box Corer [
11]).
Figure 2.
Diagrammatic representation of the collector head; is the forward velocity of the collector, c is bottom clearance, , and are the flow rate through the main jet duct, the secondary jet duct and the collection duct, respectively. The small arrows above the bed depict the direction of water entrainment.
Figure 3.
Front view of the experimental setup illustrating the equipment used in the experiments.
Figure 3.
Front view of the experimental setup illustrating the equipment used in the experiments.
Figure 4.
Cumulative grain size distribution of the sand used in the experiments.
Figure 4.
Cumulative grain size distribution of the sand used in the experiments.
Figure 5.
An experimental run in progress showing the turbidity flow generated behind the collector head.
Figure 5.
An experimental run in progress showing the turbidity flow generated behind the collector head.
Figure 6.
Shallow trench created at the sand bed as a result of sand erosion (left). Top view of the water flume depicting the position of the three optical sensors represented by the cross markers (right).
Figure 6.
Shallow trench created at the sand bed as a result of sand erosion (left). Top view of the water flume depicting the position of the three optical sensors represented by the cross markers (right).
Figure 7.
Spatial change of bathymetry as a result of Test 5. A negative value means erosion, while a positive value means deposition.
Figure 7.
Spatial change of bathymetry as a result of Test 5. A negative value means erosion, while a positive value means deposition.
Figure 8.
Effect of the flow rate in the main jet (left) and the flow rate in the secondary jet (right) on the erosion depth; is net erosion depth, is total erosion depth at the middle of flume width, d is the deposition depth.
Figure 8.
Effect of the flow rate in the main jet (left) and the flow rate in the secondary jet (right) on the erosion depth; is net erosion depth, is total erosion depth at the middle of flume width, d is the deposition depth.
Figure 9.
Effect of collector’s forward velocity on the erosion depth.
Figure 9.
Effect of collector’s forward velocity on the erosion depth.
Figure 10.
Effect of bottom clearance on the erosion depth.
Figure 10.
Effect of bottom clearance on the erosion depth.
Figure 11.
Image obtained by the high-speed camera illustrating the flow direction (Test 4). The horizontal and vertical rulers were used for camera calibration.
Figure 11.
Image obtained by the high-speed camera illustrating the flow direction (Test 4). The horizontal and vertical rulers were used for camera calibration.
Figure 12.
Comparison between estimated (
left) and real erosion rates (
right). For comparison’s sake, y-axis has the same limits in the two sub-figures (Van Rhee [
22] and Van Rijn et al. [
23]).
Figure 12.
Comparison between estimated (
left) and real erosion rates (
right). For comparison’s sake, y-axis has the same limits in the two sub-figures (Van Rhee [
22] and Van Rijn et al. [
23]).
Figure 13.
Logarithmic correlation between the flow impinging force and total erosion depth for the lab experiments of Weegenaar [
24].
Figure 13.
Logarithmic correlation between the flow impinging force and total erosion depth for the lab experiments of Weegenaar [
24].
Figure 14.
Water impingement on the sediment bed in the case of a vertical water jet (left) and the collector head (right).
Figure 14.
Water impingement on the sediment bed in the case of a vertical water jet (left) and the collector head (right).
Figure 15.
Logarithmic correlation between the flow impinging force and total erosion depth, , for the lab experiments conducted within this study.
Figure 15.
Logarithmic correlation between the flow impinging force and total erosion depth, , for the lab experiments conducted within this study.
Table 1.
A summary of the experiments conducted within this study. See
Section 4.1 for the definition of the experimental results
,
d and
.
Table 1.
A summary of the experiments conducted within this study. See
Section 4.1 for the definition of the experimental results
,
d and
.
| Test # | [L/s] | [L/s] | [L/s] | c [mm] | [cm/s] | [mm] | d [mm] | [mm] |
|---|
| 1 | 5.00 | 6.25 | 12.70 | 7.5 | 25 | 8.9 | 4.9 | 13.8 |
| 2 | 5.00 | 6.25 | 12.70 | 7.5 | 12.5 | 20.7 | 6.5 | 27.2 |
| 3 | 3.00 | 4.70 | 9.70 | 7.5 | 25 | 3.7 | 4.2 | 7.9 |
| 4 | 4.00 | 4.70 | 10.70 | 7.5 | 25 | 4.6 | 3.7 | 8.3 |
| 5 | 5.00 | 4.70 | 11.70 | 7.5 | 25 | 6.4 | 4.7 | 11.1 |
| 6 | 4.00 | 0.00 | 6.00 | 7.5 | 25 | 0.4 | 1.3 | 1.7 |
| 7 | 4.00 | 3.13 | 9.13 | 7.5 | 25 | 1.4 | 2.5 | 3.9 |
| 8 | 5.00 | 5.70 | 12.80 | 7.5 | 25 | 8.1 | 4.2 | 12.3 |
| 9 | 4.00 | 4.70 | 10.70 | 13.5 | 25 | 2.6 | 3.8 | 6.4 |
Table 2.
Properties of the sand used in the experiments.
Table 2.
Properties of the sand used in the experiments.
| | | | | | |
|---|
| 0.092 mm | 0.120 mm | 0.145 mm | 0.158 mm | 0.38 | 0.42 | 0.48 |
| Disclaimer/Publisher’s Note: The statements, opinions and data contained in all publications are solely those of the individual author(s) and contributor(s) and not of MDPI and/or the editor(s). MDPI and/or the editor(s) disclaim responsibility for any injury to people or property resulting from any ideas, methods, instructions or products referred to in the content. |
© 2023 by the authors. Licensee MDPI, Basel, Switzerland. This article is an open access article distributed under the terms and conditions of the Creative Commons Attribution (CC BY) license (https://creativecommons.org/licenses/by/4.0/).


