Article

Laboratory Studies of Internal Solitary Waves Propagating and Breaking over Submarine Canyons

1
Institute of Port, Coastal and Offshore Engineering, Ocean College, Zhejiang University, Zhoushan 316021, China
2
Engineering Research Center of Oceanic Sensing Technology and Equipment, Zhejiang University, Ministry of Education, Zhoushan 316021, China
3
Donghai Laboratory, Zhoushan 316021, China
4
Institute of Physical Ocean and Remote Sensing, Ocean College, Zhejiang University, Zhoushan 316021, China
5
Yuhang District Emergency Management Bureau, Hangzhou 310000, China
6
Zhejiang Institute of Hydraulics & Estuary (Zhejiang Institute of Marine Planning and Design), Hangzhou 310020, China
*
Author to whom correspondence should be addressed.
J. Mar. Sci. Eng. 2023, 11(2), 355; https://doi.org/10.3390/jmse11020355
Submission received: 16 December 2022 / Revised: 18 January 2023 / Accepted: 28 January 2023 / Published: 5 February 2023
(This article belongs to the Special Issue Frontiers in Physical Oceanography)

Abstract

:
This paper carried out laboratory experiments to study evolution of internal solitary waves (ISWs) over submarine canyons with a combination of PIV (particle image velocimetry) and PLIF (planar laser-induced fluorescence) techniques. Taking canyon angle θ and collapse height ∆H as variables, Froude number Fr, head position, energy loss, vorticity field and turbulence intensity when ISWs propagate to the canyon were analyzed. According to the Froude number Fr values, the study cases can be divided into three types: Fr > 1.7 means complete internal hydraulic jump (IHJ); 1 < Fr < 1.7 denotes wavy IHJ and Fr < 1 represents no IHJ. The greater canyon angle, collapse depth and amplitude of the incident wave more easily generate IHJs, which can lead to more energy loss, greater vorticity and turbulence intensity in the canyon area. Among all canyon cases, vorticity and turbulence intensity of the no IHJ case showing an obvious bimodal distribution are smaller than IHJ cases. For wavy IHJ, the energy dissipation is not obvious, and the average turbulent intensity performs a “sharp unimodal distribution”. Complete IHJ cases last for a long time and cause violent mixing, the average turbulent intensity is the largest and its distribution presents a “gentle single peak” pattern. For the 180° conditions (no canyon cases), less energy is delivered to the reflected wave and more energy is dissipated near the terrain, so the energy loss is the largest in comparison to other conditions. These findings will deepen our understanding of the evolution mechanisms of ISWs propagating over submarine canyons.

1. Introduction

Internal waves are produced within subsurface stratified layers of water bodies because disturbances created give rise to variations in temperature or salinity [1]. As a special internal wave phenomenon, internal solitary waves (ISWs) are nonlinear and large-amplitude waves existing in the oceanic pycnocline [2]. It is generally believed that one of the most common mechanisms of ISWs generation is due to interaction of barotropic tides with the bottom topography under favorable oceanic conditions, after which baroclinic tides radiate out of the generation site. Their wave fronts steepen and become more nonlinear, finally leading to formation of high-frequency nonlinear ISWs [3]. ISWs promote exchange of momentum, energy and suspended matters in the ocean and thus have a significant impact on the dynamic processes of the ocean [4].
ISWs are a kind of high-frequency interfacial fluctuation between two fluids, and their evolution process is particularly violent when they encounter bathymetric terrain during the propagation process. Helfrich [5] and Michallet [6] studied the shoaling and breaking process of depression ISWs on gentle uniform bottom slopes. They found that the ratio between characteristic lengths of ISWs and slope is the main influencing factor for the extent of wave–slope interaction and wave energy reflection ratio. Boegman and Imberger [7] introduced the dimensionless Iribarren number (the ratio of terrain slope S to wave slope (a/L), where a is wave amplitude and L is wavelength) from the field of surface waves to describe breaking type and energy loss of ISWs over slopes. When ISWs of first-order mode propagate through a ridge-shaped obstacle, a part of the ISWs will be transmitted and the other part will be reflected. As the blocking coefficient (the ratio of depth of terrain to lower fluid layer depth) increases, the amplitude of the first transmitted wave decreases and the amplitude of the reflected wave increases [8]. In a two-layer stratified fluid system, when ISWs propagate over a submarine ridge in a semicircular and triangular shape, wave characteristics (e.g., amplitude-based wave reflection, energy-based reflection, amplitude-based transmission and energy-based transmission) during wave–obstacle interaction demonstrate approximately linear relation with blocking coefficient [9,10].
When ISWs encounter seamounts, islands or submarine canyons, they will be shoaling and broken on the surface of the terrain and make surface water vertically mix with deep seawater. Wessels and Hutter [11] experimentally studied interactions between ISWs and triangular ridges and further analyzed the relationship between wave energy loss and ridge height. Their results showed in general that wave energy loss has pronounced dependence on degree of blocking coefficient. The experimental results of Huttemann and Hutter [12] revealed that dependence of energy loss on step height is not monotonic but has different maximum positions for different incident wave polarities. Talipova et al. [13] studied the interaction of an internal solitary wave with a bottom step and found that energy loss usually does not exceed 50% of the energy of an incident wave. Du et al. [14] investigated propagation of elevation ISWs over a large triangular ridge in a stratified fluid flume and concluded that wave energy decreases consistently during wave propagation, and the entire energy loss is about 30%–35% of the incident wave. Moore et al. [15] investigated formation of internal boluses (an internal water body) through run-up of periodic internal wave trains on uniform slope/shelf topography in a two-layer stratified fluid system. Over the range of wave forcing conditions, four bolus formation types are observed when wave Froude number Fr > 0.20 ( F r = ω a / g H , where ω is wave frequency, g is reduced gravity, H is total water depth and wave steepness parameter ka > 0.40 (k is the wave number); the generated boluses become more turbulent in nature. As wave forcing continues to increase further, boluses are no longer able to form. Through evolution of interfacial internal solitary waves on a triangular barrier, Mu et al. [16] found that wave instability creates dissipation of energy as it is transmitted from waves to turbulence. Rate of ISW energy dissipation, maximum turbulent dissipation and buoyancy diffusivity linearly increase with an increase in incident wave energy.
As a special submarine topographic structure, submarine canyons are important channels for movement of detritus from a continental margin to deep sea and are significant places for studying sea level fluctuation and tectonic evolution [17]. It is also the principal area for formation and accumulation of submarine oil and gas resources [18]. The most common profile shapes of submarine canyons are U-shaped and V-shaped, where the former belongs to sediment accumulation state and the latter relates to sediment erosion state [19]. Several studies have presented that submarine canyons are potential “hotspots” to trigger significant internal wave motions, such as enhanced turbulent dissipation and diapycnal diffusivity [20]. Kunze et al. [21] suggested that canyons are effective at funneling remotely generated internal wave energy, and energy fluxes and near-bottom velocities are strongly steered by sinuous canyon topography. Field observations showed that interaction of internal waves with canyons may cause resuspension of bottom sediment in Baltimore Canyon [22], and downward propagating internal waves are apparent in La Jolla Canyon [23]. In addition, canyon regions are known to be locations for enhanced upwelling [24], increased mixing [25] and are important for cross-shelf momentum and substance exchange [26]. Hotchkiss and Wunsch [27] proposed the classical theory of turbulence driven by internal waves in the canyon. They speculated that incident internal waves on the canyon range reflect downward from the steep sidewall and toward its nearshore terminus on an axis that slopes slowly along the canyon. Waves that encounter shaft slopes close to their own propagation angle are also expected to scatter and break near the bottom [28,29]. There are limited studies of wave reflections within canyons, but studies of reflections from steep continental slopes have shown that, on average, internal waves lose about 60% of their energy upon impacting continental margins, and 40% of the energy reflects to the ocean interior. These analyses indicate that most of the energy is likely consumed at large topographic features (e.g., continental slopes, seamounts and mid-ocean ridges), where it may elevate turbulent mixing [30]. Based on the ultra-high-resolution non-static internal wave numerical model, Min et al. [31] revealed the nonlinear evolution and dissipation process of internal tides and internal solitary waves under joint modulation of canyon terrain and the Kuroshio in the southwest of the East China Sea and emphasized the importance of nonlinear internal solitary waves in the small-scale canyon area for mixing of energy dissipation. Nazarian et al. [32] calculated the magnitude of mixing in each submarine canyon and determined the percentage of global internal tide energy budget that is dissipated in canyons. They found that, regardless of bathymetry, submarine canyons can dissipate a significant fraction of incident internal tide energy. Hamann et.al [33] observed mode-1 incident waves on the canyon reflect and scatter backward at a bend along the canyon axis and at the head of the canyon where the thalweg becomes steep. High-mode-reflected waves induce additional shear and strain, leading to enhanced turbulence at mid-depth near the canyon head. However, there is currently a lack of research on the evolution mechanism of ISWs in submarine canyons, which is the key to understand and clarify changes in hydrodynamic characteristics in real submarine canyons.
This paper aims to study evolution processes and energy properties of ISWs propagating over a submarine canyon and elucidate the main influencing factors of wave–canyon interaction. To achieve these goals, a series of laboratory experiments with different wave amplitudes and canyon angles were conducted to observe the ISWs evolutions, and particle image velocity (PIV) and planar laser-induced fluorescence (PLIF) were combined to obtain velocity and density fields of ISWs. The paper is organized as follows. Section 2 describes the experimental setup and relevant parameters. The comparison results are provided and discussed in Section 3. Finally, the main conclusions are provided in Section 4. The findings can provide a scientific basis for exploration, protection and exploitation of resources in an actual submarine canyon.

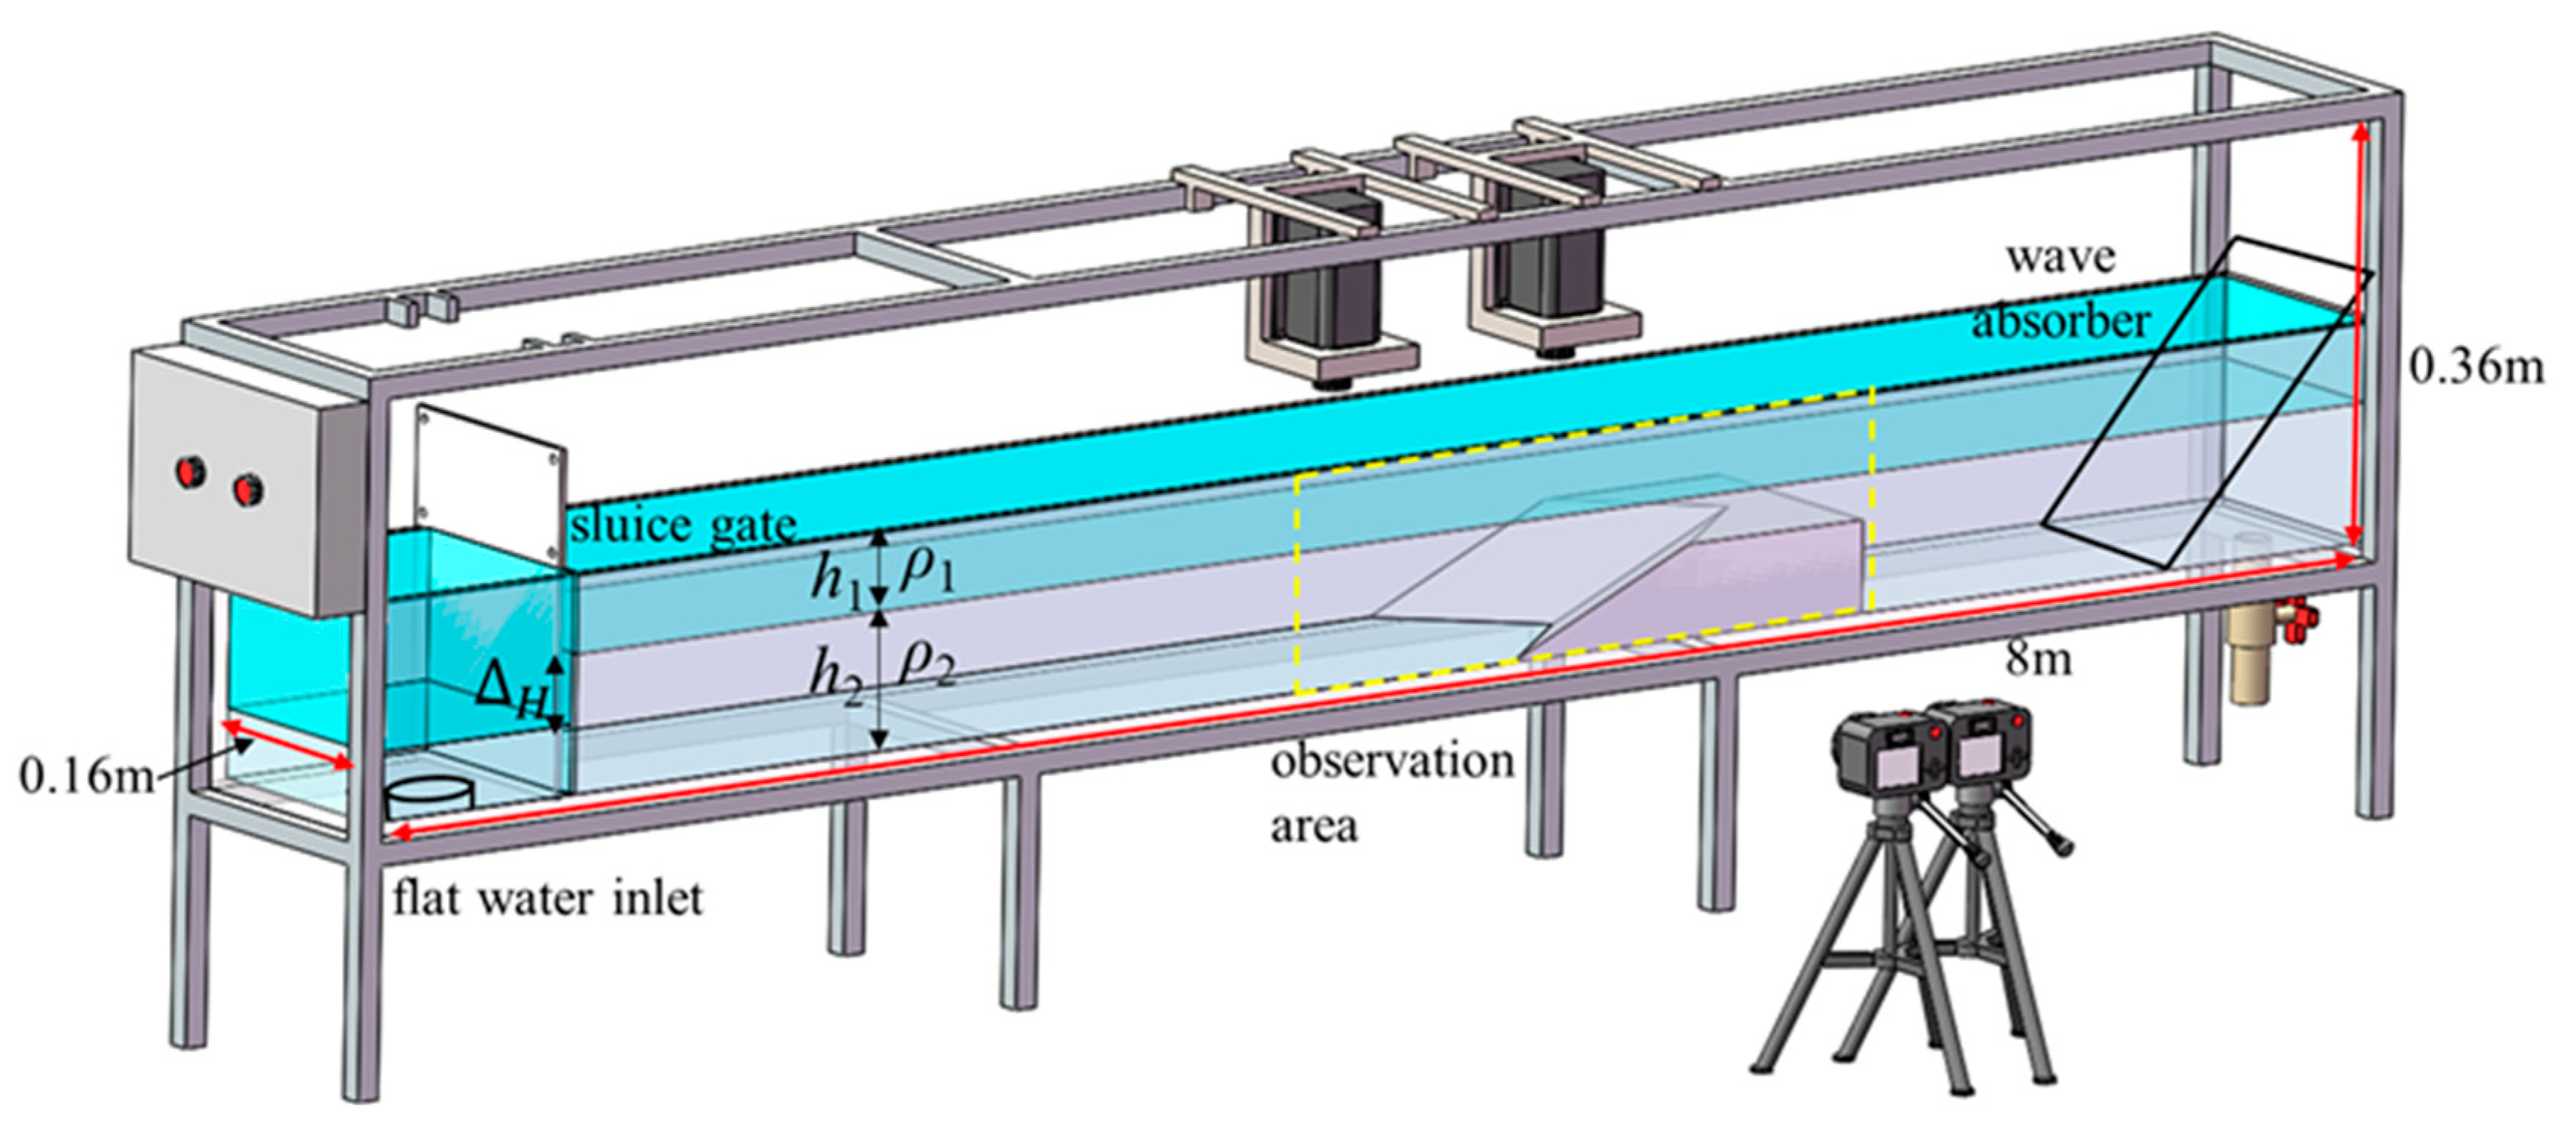
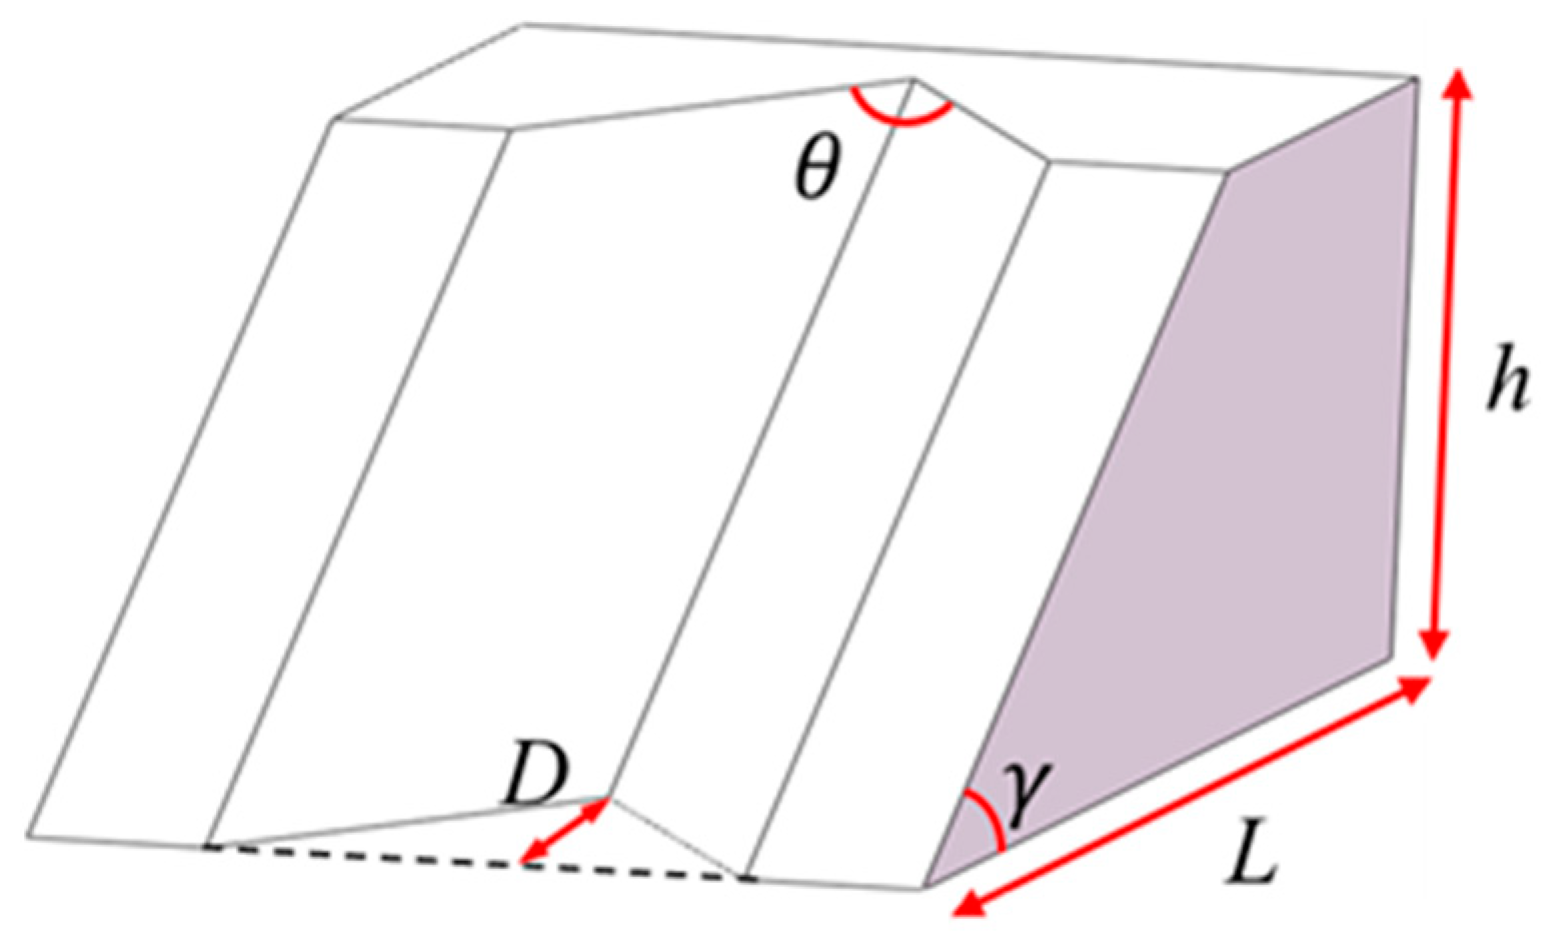
2. Materials and Methods

Laboratory experiments in this paper were carried out in a straight glass-walled tank of the Geophysical Ocean Laboratory, College of Oceanography, Zhejiang University, and the schematic diagram of the tank is shown in Figure 1, similar to the work completed by Lin et al. [34]. The total length of the water tank is about 8 m, the height is 0.36 m and the width is 0.16 m. The water tank is connected with a glass double tank that stores fluid mixed with PIV tracer particles. In the study, a two-layer stratified fluid environment was adopted, where the upper-layer fluid density ρ 1 was 1.030 kg/m3, while the lower-layer one ρ 2 was 1.050 kg/m3. The heights of two-layer fluid were kept the same in all cases, of which h1 = 3 cm and h2 = 10 cm. The interface thickness of upper and lower layers of fluid (called pycnocline) is approximately 0.6 cm. Δ H represents collapse height, which is the height difference of the lower fluid on the left and right sides of the sluice gate. In the experiment, the sluice gate is released at a uniform speed to generate internal solitary waves under action of gravity difference. The data acquisition system included two CCD (charge-coupled device) cameras. The cameras had a resolution of 2592 pixel × 2048 pixel and a frame per second (fps) of 40 and were placed in front of the flume, and the lens axis was perpendicular to the observation region, as shown in Figure 1. Two lasers emitting a wavelength of 532 nm with 3 W power and 3 mm thickness were placed above the tank and aligned with the centerline of the tank.
The middle part of the tank in Figure 1 is the experimental area, where the ISWs interact with the canyon. A canyon model was placed in this area to simulate the submarine canyon (Figure 2). In real ocean terrain, the side walls of the submarine canyon are high and steep, with a general slope of about 40°, and some valley walls are like cliffs [35]. In our experiment, due to the limitation of the water tank, the geometric dimensions of the model canyons were set to thalweg (the central axis of the canyon) slope γ = 30°; total length of the canyon L was 35 cm; canyon height h was 12 cm. The angle of canyon θ and the depth of canyon D were changed in this study. The canyon model was made of transparent acrylic, which will not hinder the view of experimental measurements.
The ISW was generated by lock-release method [6], and the length of the lock was set to 13 cm for all experimental runs. Before the experiment, first, the upper layer of fluid was added to the specified height, and then the lower layer of fluid was slowly put through a flat inlet at the bottom of the water tank. After the two-layer fluids were built and stood for a while, the sluice gate was lifted and the ISW was generated. To obtain the simultaneous velocity and density fields, particle image velocimetry (PIV) and planar laser-induced fluorescence (PLIF) methods were combined using two cameras as [36,37] adopted. In their method, different filters were installed in front of the lens of two cameras. Therefore, the laser light reflected on the PIV tracer particle and the fluorescence emitted by PLIF fluorescent dye can be separated, and PIV and PLIF images can be obtained, respectively. For the PIV method, polystyrene powder with a particle size of 20 μm and a density of 1.040 kg/m3 was added to the upper and lower fluids as tracer particles. PIVLab, a subroutine of commercial software MATLAB, was adopted to process images and obtain flow field information, such as velocity vector and vorticity. On the other hand, for the PLIF method, Rhodamine WT (ACROS ORGANICS) was chosen as the laser-fluorescent dye and added to the upper saline, and the gray value in the range of 200–220 could meet the measurement requirements. The fluorescent dye can excite the fluorescence of another wavelength under irradiation of the incident laser in a specific wavelength range. Local fluorescence intensity F excited by it is related to local excitation intensity I and local fluorescent dye concentration C, which satisfy the following relationship: FI × C [38]. During the experiment, the local excitation intensity of the laser is fixed. Once local fluorescence intensity F is measured, local dye concentration C can be inverted through calibration, and the density distribution of the entire flow field can thus be obtained.
This experiment focuses on formation and breaking of ISWs under different collapse heights and canyon angles. All experiments were carried out at the same heights of the two layers, that is, the upper layer h1 = 3 cm and the lower layer h2 = 10 cm. Previous studies [39] showed that, within a certain range, amplitude a of ISWs increases with an increase in collapse height. However, after reaching a certain threshold, amplitude a no longer becomes large as collapse height increases. Under the current two-layer setting, the pre-experiment found that ISW amplitude a reached the maximum value when collapse height Δ H = 8   c m [34]. Therefore, three collapse heights Δ H of 4 cm, 6 cm and 8 cm were selected to produce ISWs with different amplitudes. According to the repetitive experiment in the pre-experiment, 16 sets of internal solitary wave experiments with single collapse height were carried out, and the variation coefficient of ISW amplitude was about 2.7%, suggesting good repeatability of the experiments. Unlike surface waves, the restoring force of internal waves is not gravity but reduced gravity after the joint effect of gravity and buoyancy. Because the magnitude of reduced gravity is far less than that of gravity, amplitude of internal waves is generally greater than that of surface waves. g is defined as
g = 2 ρ 2 ρ 1 g ρ 1 + ρ 2
Interfacial wave is a wave on two kinds of media [40], and internal wave is one of the types. In this paper, internal wave refers to a wave below the water surface in a two-layer fluid system, which means it is the interfacial wave between two fluids.
Six canyon angles and three collapse heights Δ H were selected in the experiments. Therefore, there are totally eighteen experimental cases. The specific parameters for different cases are listed in Table 1.
During the experiment, the recorded images were processed by MATLAB subroutine PIVLab to obtain the velocity of the flow field, and then the corresponding physical quantities were calculated. The experimental images and three characteristic profiles are provided in Figure 3a, where profile 1, feature profile and profile 2 are used to calculate incident energy, Froude number of upper and lower fluids and outflow energy, respectively. In order to facilitate quantitative calculation, this paper introduces characteristic wave period tp, proposed by Zou [41], where tp includes only a complete incident wave and reflected wave. Figure 3b shows a complete incident wave and reflected wave, taking the vertical displacement of the pycnocline in profile 1 in Figure 3a as an example, where t1 (onset time) is defined as the zero-crossing point of vertical displacement η of profile 1 pycnocline and t2 (end time) is time when a complete reflected wave ends. Time difference between t1 and t2 is defined as characteristic wave period tp. In addition, between t1 and t2, local maximum displacement is split time tb, time corresponding to tb is boundary point between incident wave and reflected wave and time of local maximum displacement is t0.

3. Results and Discussion

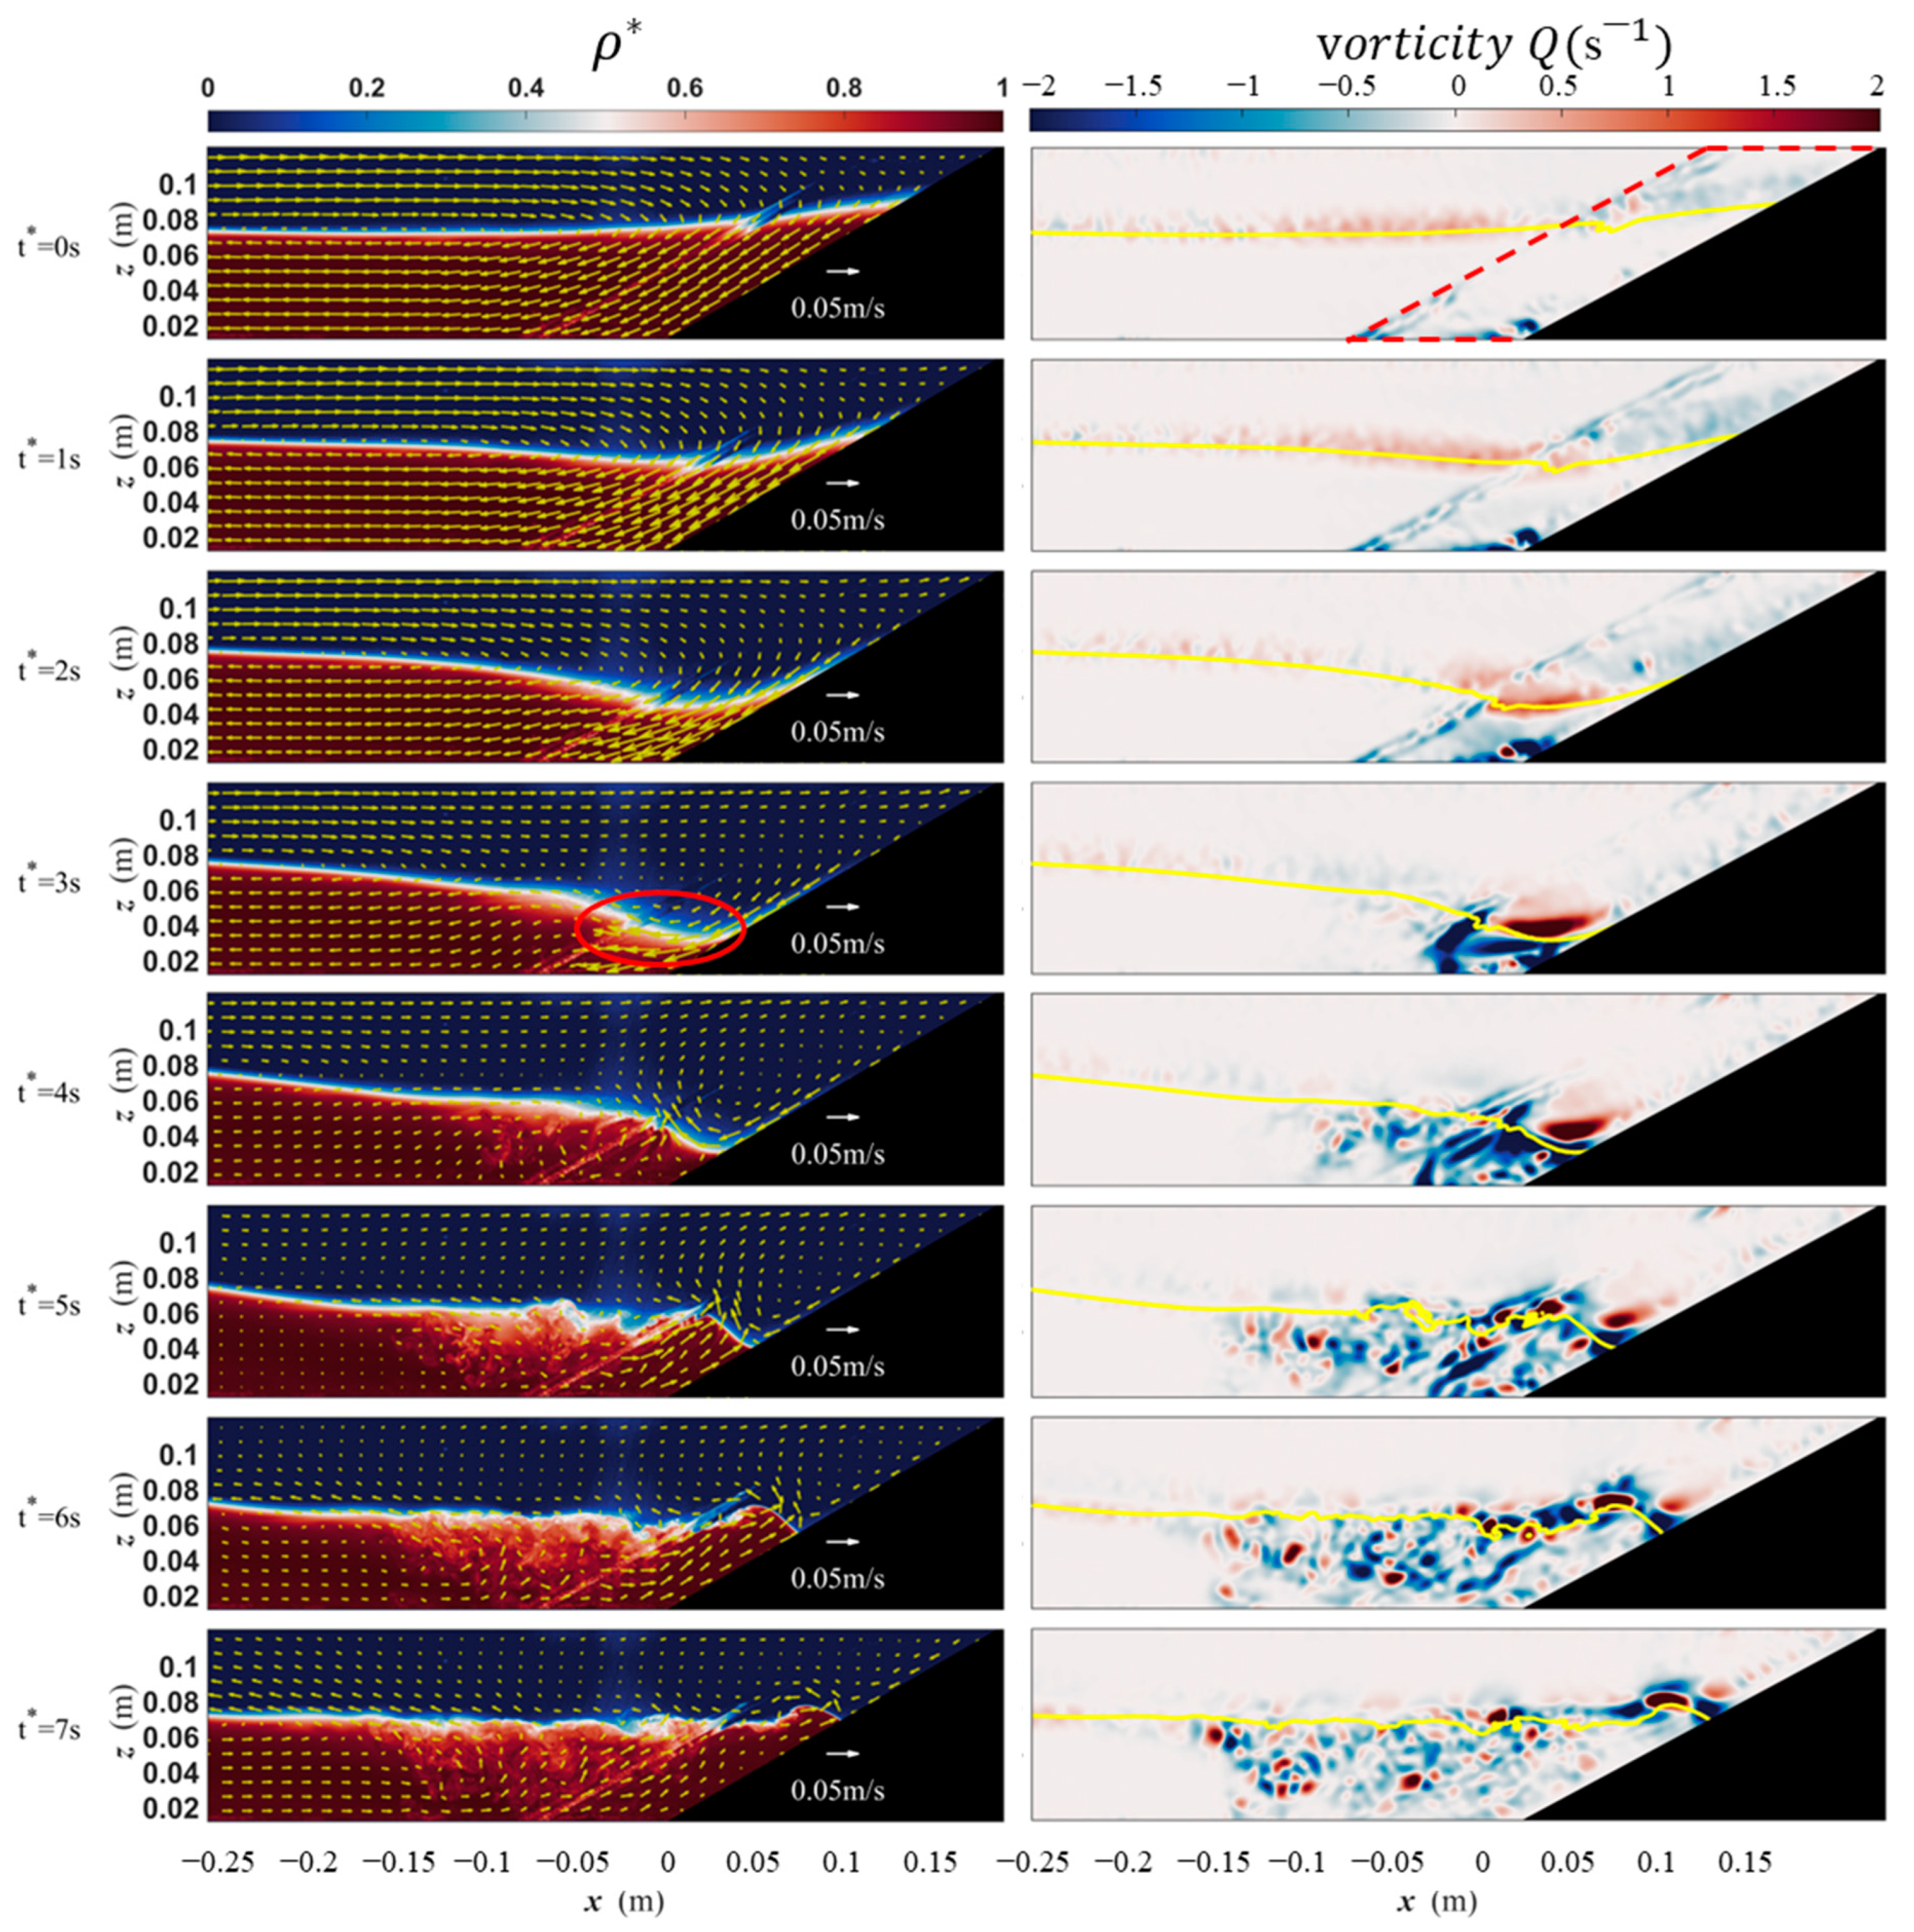
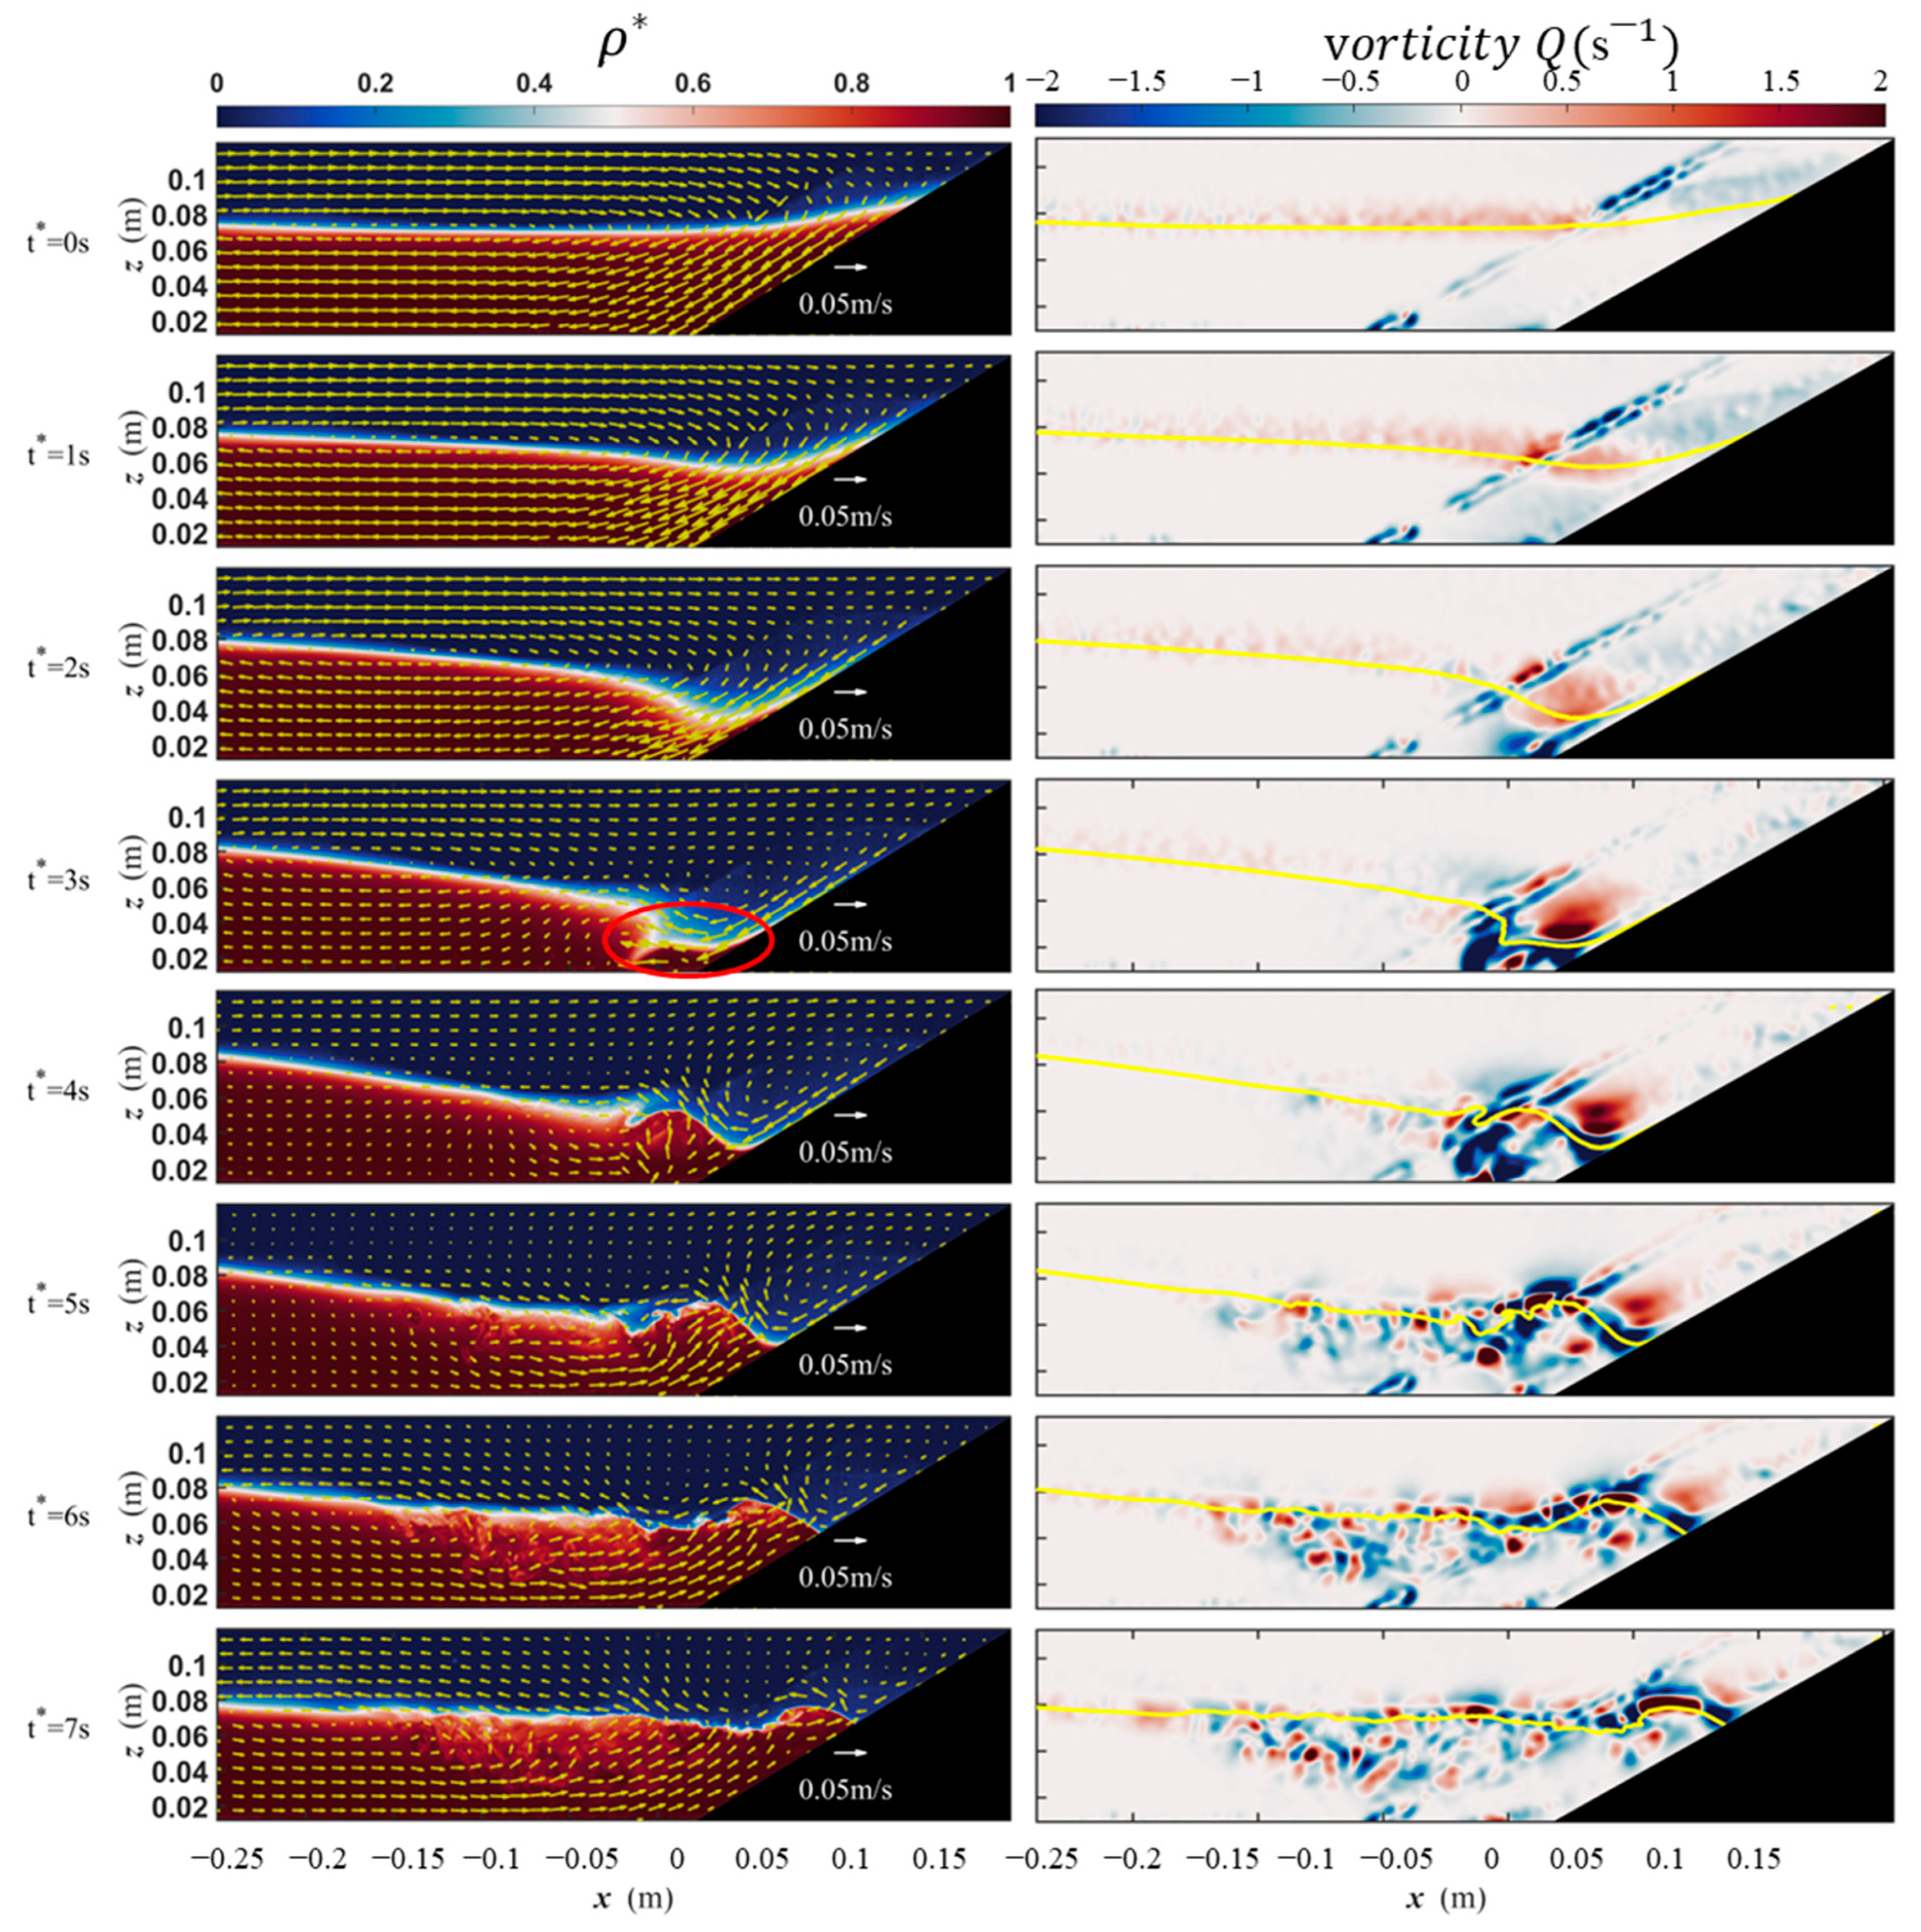
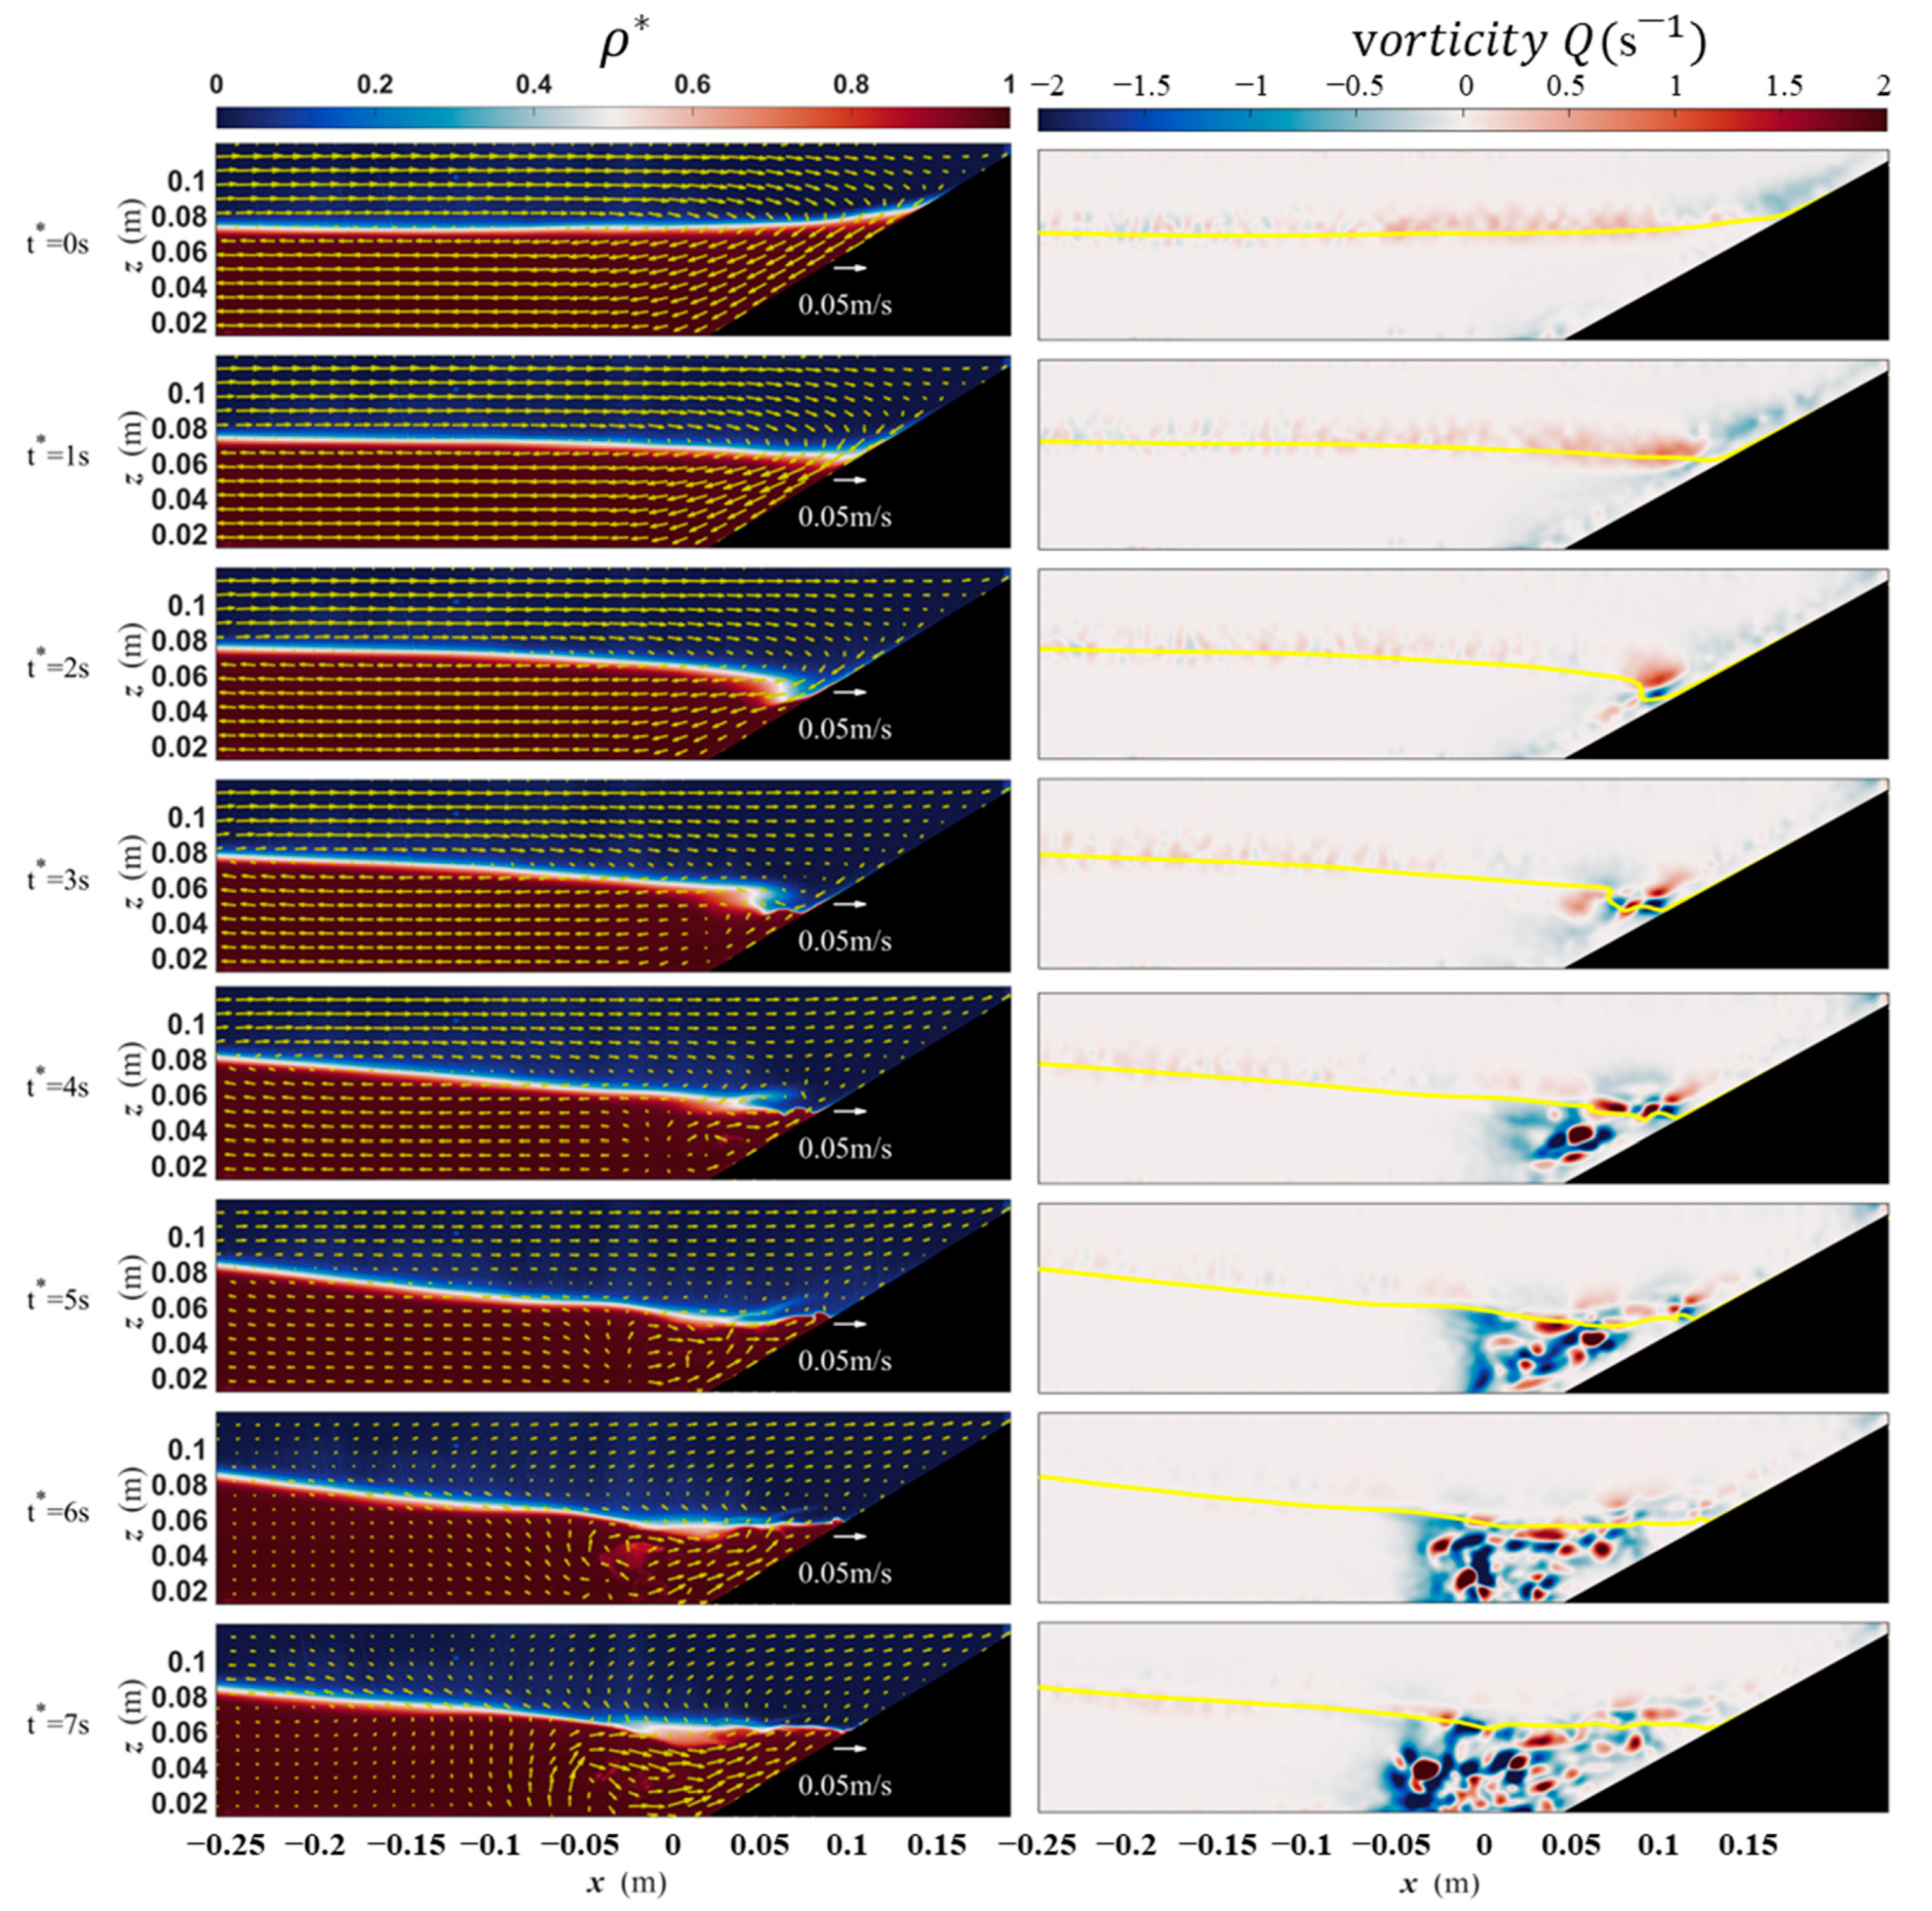
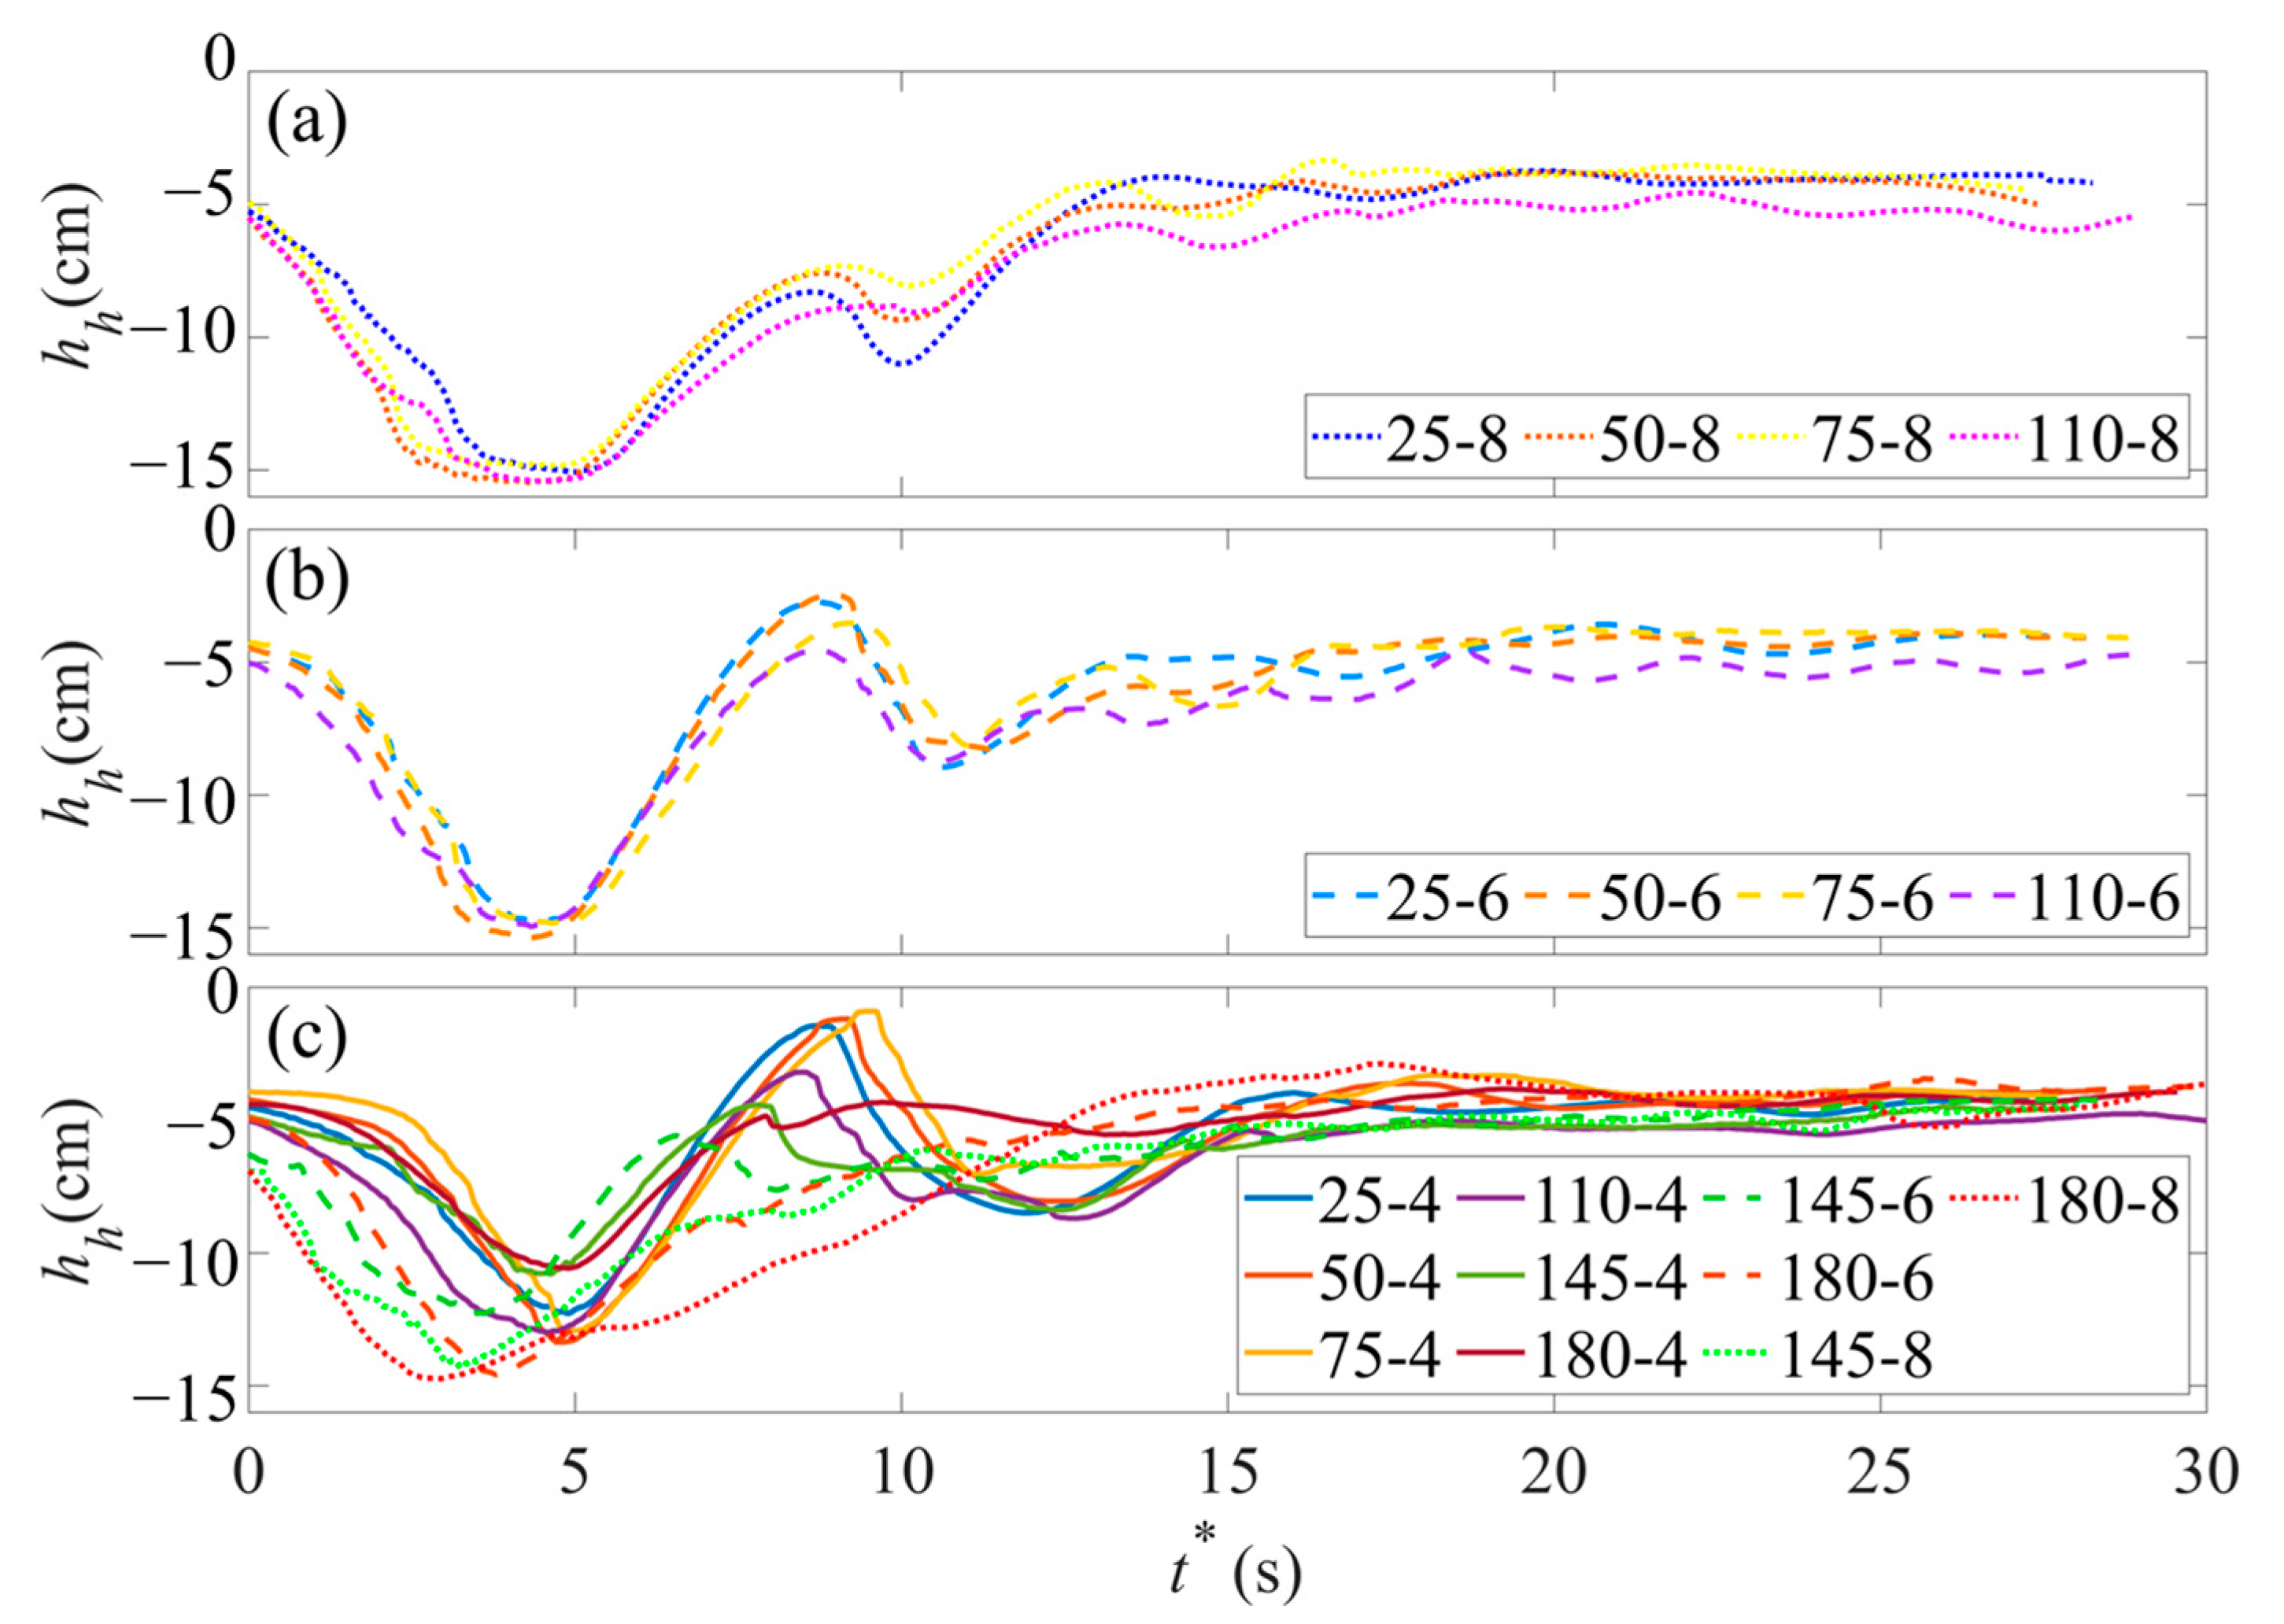
3.1. Evolution of ISWs

The vorticity method is the simplest method to describe vortices [42], but it is difficult to distinguish the vortices caused by rotation or shearing. In addition, it is unlikely to identify vortices with small vorticity but clear structure. Since the first generation of vortex identification methods cannot accurately capture and identify vortex structure, in order to more effectively identify the vortex structure, Hunt et al. [43] proposed the second Galilean invariant of the velocity gradient tensor to represent the vortex structure. For the two-dimensional case, the Stokes decomposition can be represented as:
V = A + B = u x         u z w x         w z  
A = V + V T 2
B = V V T 2
Q = 1 2 B F 2 A F 2
A F 2 = u x 2 + w z 2 + 1 2 u z + w x 2
B F 2 = 1 2 u z w x 2
Among them, u and w are horizontal and vertical flow velocity. B is rotation rate tensor, representing the antisymmetric part of the velocity gradient matrix. A is strain rate tensor, denoting the symmetric part of the velocity gradient matrix, and   F is the Frobenius Norm of the matrix. The Q criterion is a commonly used vortex extraction/recognition method with high calculation efficiency and good effect in vortex identification. Q > 0 indicates that the rotation rate in the local space is greater than the strain rate and there is a vortex existing at this point; otherwise, there is no vortex [44,45,46].
Figure 4, Figure 5 and Figure 6 show the density field and vorticity field of the ISWs for Run 25-8, 75-8 and 180-8, respectively. For each run, the position of the toe of the terrain is set as the origin, i.e., x = 0; t0 is the initial moment of the ISWs, and its propagation time t* is expressed as the time difference between arbitrary moment t and initial moment t0; i.e., t* = tt0. The process of ISWs breaking with different canyon angles can be approximately divided into two stages. For each run, when t* = 0 s, concave ISWs have not yet reached the canyon. At this time, the upper fluid moves to the right and the lower fluid flows to the left, forming a small vorticity band at the pycnocline because of the shearing action between the upper and lower fluids. When t* = 1 s, due to the blocking effect of the canyon on the upper and lower fluids, the wave surface is deformed and the front end of the wave is almost parallel to the canyon, producing a downward flow along the slope. In addition, a more obvious vorticity zone begins to appear in the lower half of the canyon, where the velocity shear is stronger. As the ISWs continue to flow down the slope, an internal hydraulic jump (the phenomenon of a local sudden change in the height of the lower fluid) occurs, as shown in Figure 4 and Figure 5; the fluid velocity in the canyon area increases sharply and a large vortex is produced in the area where the hydraulic jump occurs. The flow patterns of wavy hydraulic jump are not as obvious as the complete hydraulic jump. In addition, Figure 4, Figure 5 and Figure 6 compare the flow patterns at the same collapse height ( Δ H   = 8 cm). There is no wavy hydraulic jump occurring at this collapse height. Therefore, we do not provide the density and vorticity fields for the wavy hydraulic jump. After the sudden change, the fluid exhibits a strong upward motion and produces an internal water body (called bolus) that gradually expands in volume in Figure 4 and Figure 5 (t* = 2, 3, 4 s). It is found that, when the canyon becomes steeper, the position of the internal hydraulic jump occurring is closer to the bottom of the tank, and the bolus becomes more evident. Internal hydraulic jumps lead to mixing of the two fluid layers in the stratified water body; however, when the incident wave amplitude is small or the canyon angle is greater than 145°, the blocking effect of the canyon becomes weaker and no hydraulic jump occurs. On the other hand, in Figure 6, since downslope flow continues to increase, the upper fluid invades the lower fluid, the interface between the two layers overturns at this time and a fracture appears at the intersection with the slope. Due to the small velocity of the breaking point, only a small amount of fluid mixing occurs after the fluid contact between the upper and lower layers and a new layer of pycnocline is formed. To this extent, the first stage of the ISW evolution process caused by shear instability is completed.
After that, the inner bolus is continuously filled by the lower fluid behind it and forms a similarly hyperpycnal flow that climbs along the slope, as shown in Figure 4 and Figure 5 (t* = 5, 6, 7 s). When the canyon angle is larger, the initially formed head of the hyperpycnal flow becomes thicker. For the 180-8 Run, the generated vortex does not break away from the boundary layer under the action of pressure and the wrapped water mass also surges up along the slope, as shown in Figure 6 (t* = 3, 4 s). Moreover, for experimental runs (Figure 4, t* = 6, 7 s) where hydraulic jump occurs, they exhibit obvious Kelvin–Helmholtz instability and generate more K-H vortices when flows climb along the slope. Because there is a platform connected before and after the terrain, the pressure of the upper fluid is reduced and a negative pressure gradient is formed in the upper fluid, which makes the flow accelerate first and then decelerate when climbing upslope in each case. At the same time, the negative pressure gradient will also help the pycnocline to maintain a linear shape and eventually return to the initial equilibrium position, as shown in Figure 6 (t* = 5, 6, 7 s). The second stage of the ISWs evolution process consists of a hyperpycnal flow-like climbing process and a coherent structure caused by longitudinal velocity shear.

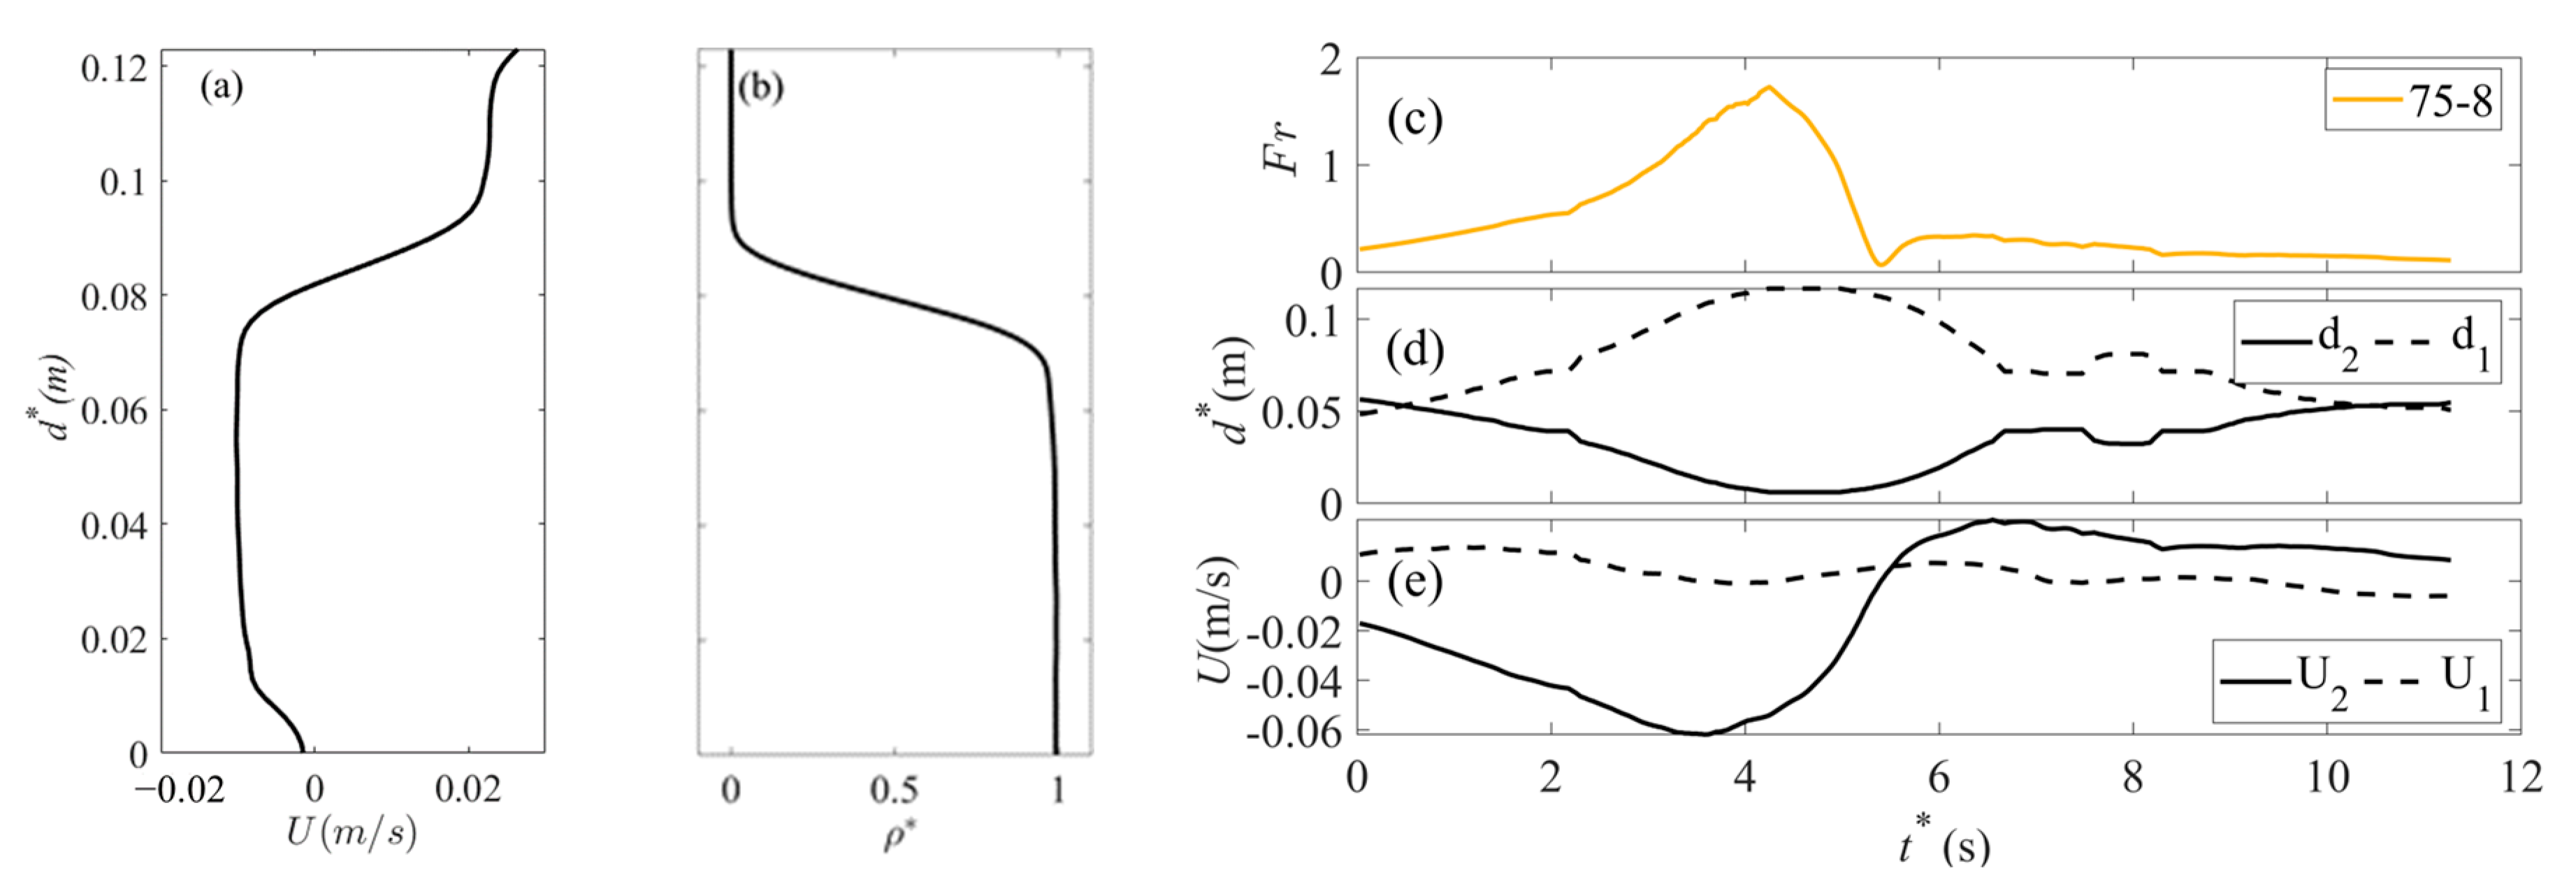
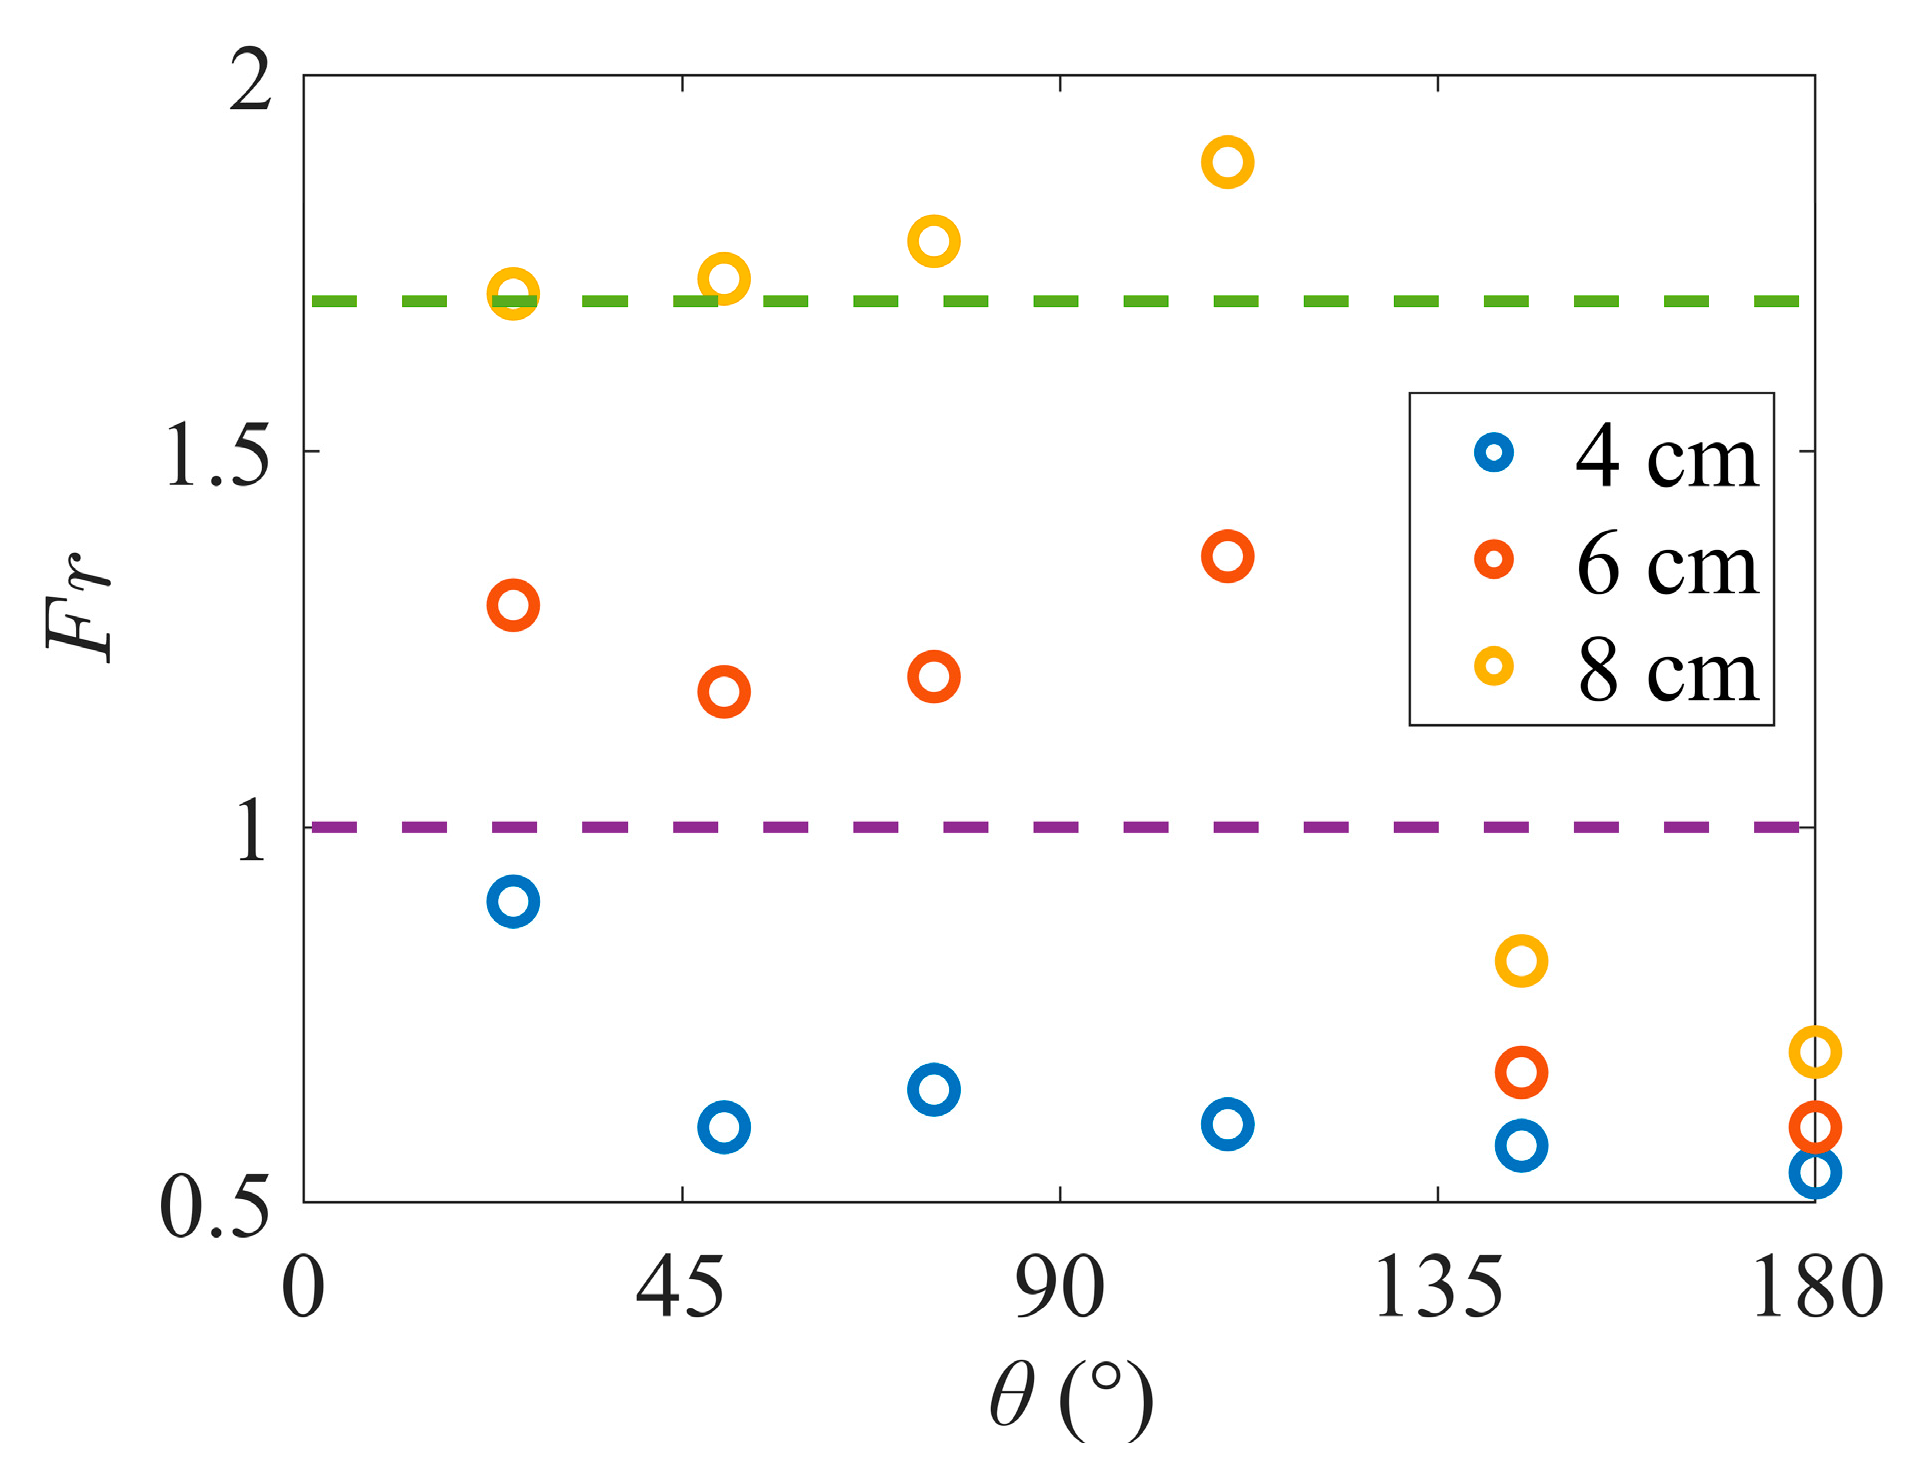
3.2. Internal Hydraulic Jump Classification
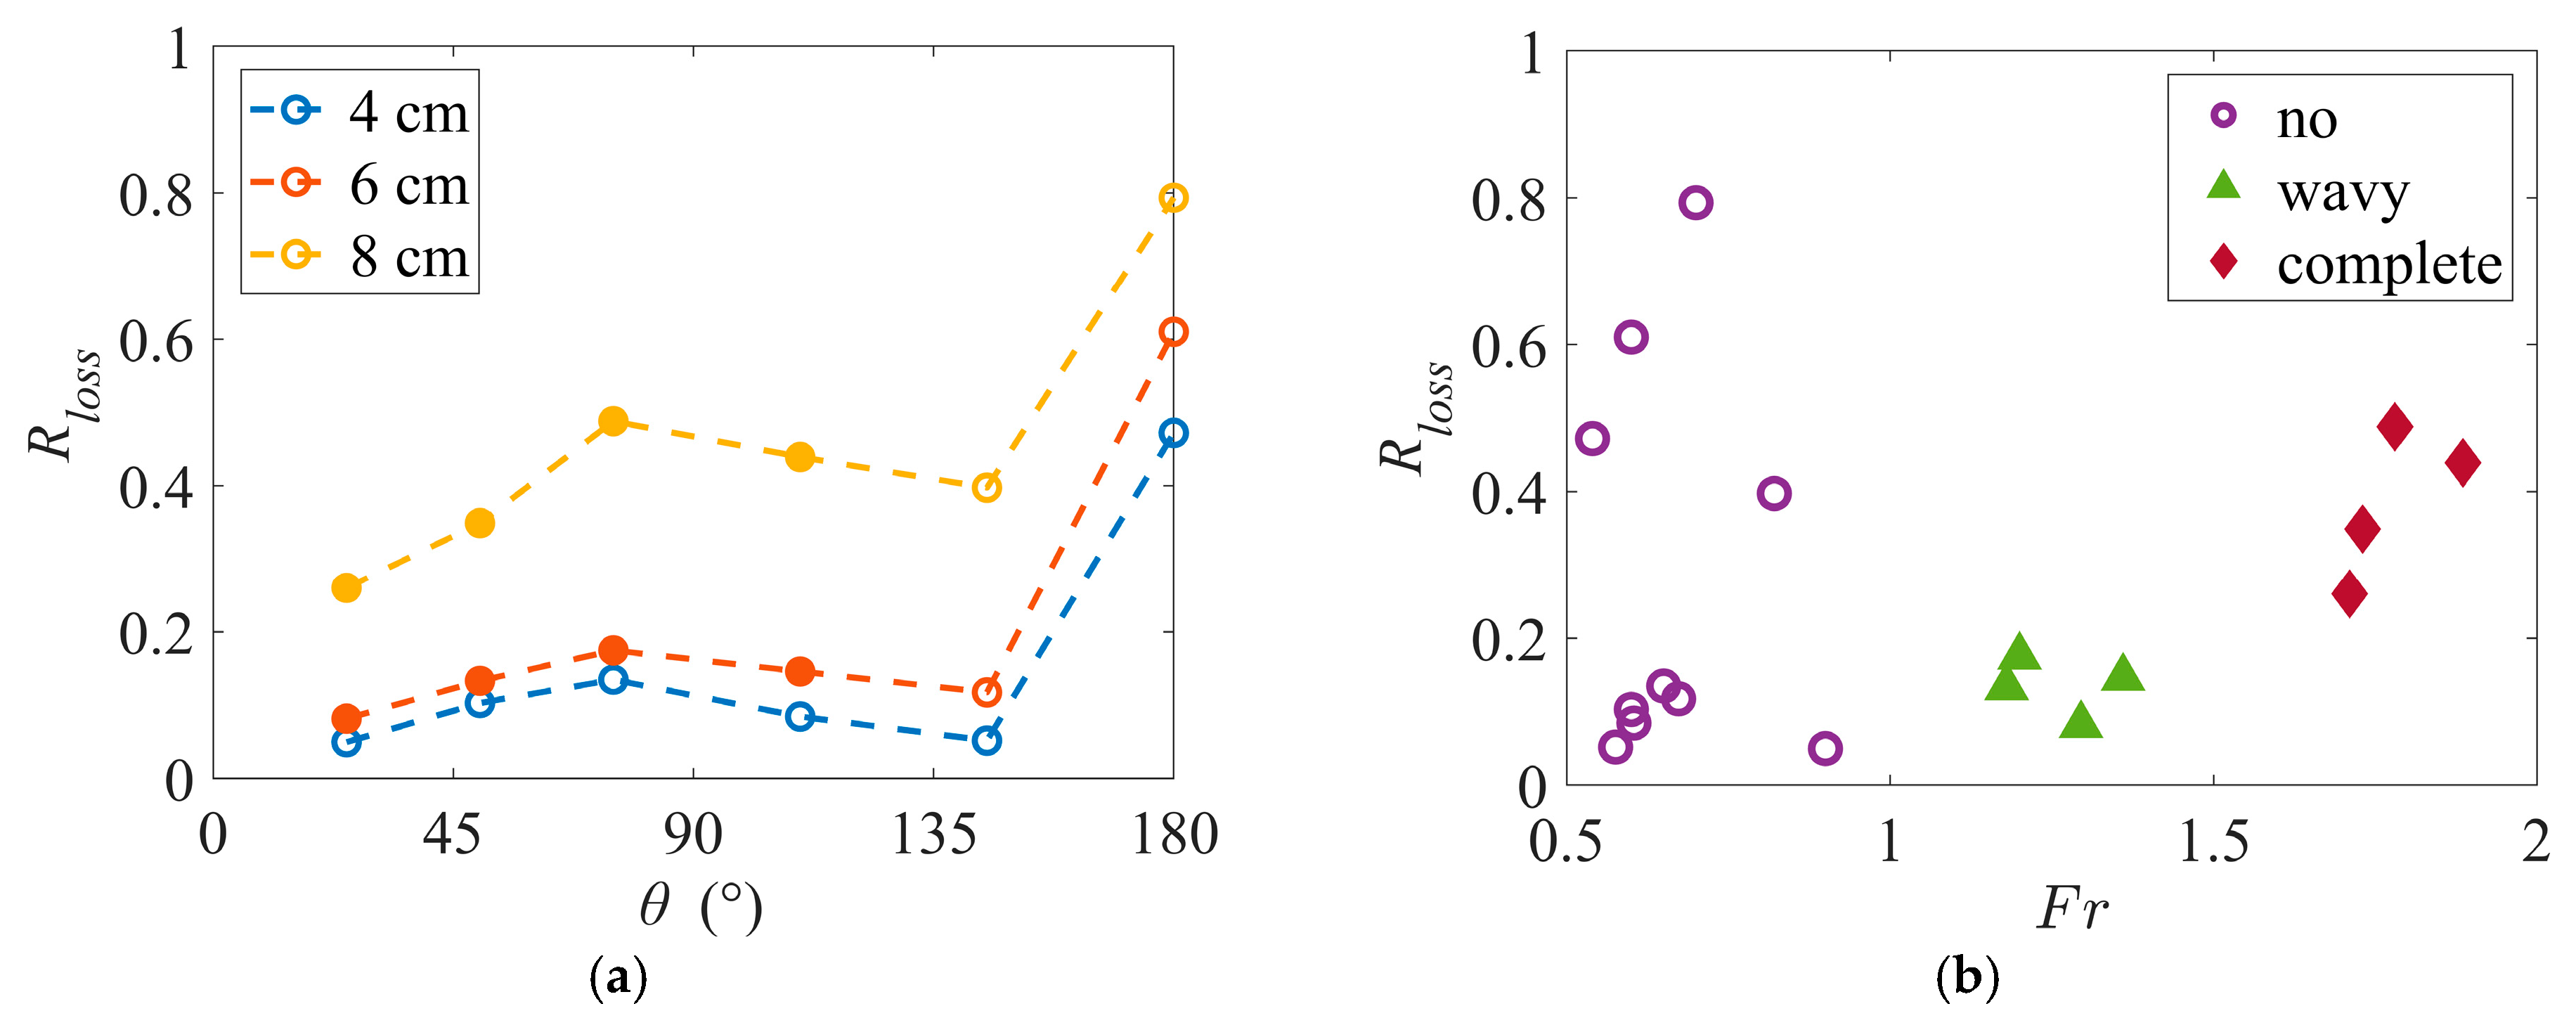
During evolution of the above-mentioned ISWs, bolus is caused by internal hydraulic jump. In a two-layer stratified fluid system, the critical condition for occurrence of hydraulic jump is Fr = 1 [47,48,49]. According to the classification standard of open channel flow for hydraulic jump, hydraulic jump is divided into two types according to its morphological characteristics and energy dissipation level by Froude number Fr, in which 1 < Fr < 1.7 is wavy hydraulic jump and Fr > 1.7 is complete hydraulic jump [50]. Therefore, it is defined in this paper that, when Fr < 1, there is no internal hydraulic jump, when 1 < Fr < 1.7, it is a wavy internal hydraulic jump and, when Fr > 1.7, it is a complete internal hydraulic jump.
The Froude numbers Fr1 and Fr2 of the upper and lower fluids at the feature profile (Figure 3a) were calculated using the following formula:
  F r 1 = U 1 / g 0   d 1
F r 2 = U 2 / g 0   d 2
F r = F r 1 2 + F r 2 2
Among them, U is the two-dimensional velocity magnitude along the centerline of the canyon, g 0   is the component of the reduced gravitational acceleration perpendicular to the slope of the canyon (z* axis), i.e., g 0 = g × c o s 30 ° , d * is the water depth in z* axis and subscripts 1 and 2 represent the upper and lower fluid, respectively. Figure 7a,b shows combined velocity and density at a certain moment in the 75° canyon feature profile.
For Run 75-8, time series of F r at the feature profile is shown in Figure 7c. During the whole process, the F r value varies from less than 1 to more than 1 and then less than 1. It means that there is an internal hydraulic jump occurring for this case. Figure 7d reveals the fluid depths change in the upper and lower layers at the feature profile. When the internal solitary wave propagates from upstream to downstream, the upper fluid becomes thicker before reaching the maximum crushing depth and then turns into smaller until the initial level is restored, while the lower fluid is the opposite. Figure 7e shows the average velocity of the upper and lower fluids at the feature profile, and the absolute value of velocity is taken when F r is calculated. First, the upper fluid flows to the right with a positive velocity, while the lower fluid flows to the left with a negative velocity. Then, when t* = 3–4 s, the velocity of the lower fluid starts to decrease after reaching the maximum velocity, and an internal hydraulic jump occurs. At this time, the upper fluid changes flow direction. Finally, the velocity of the lower layer fluid transitions from negative to positive, and the fluid is climbing up along the canyon centerline.
The maximum Froude number of each case is shown in Figure 8. It is shown that, when the amplitude of the incident wave is small, that is, ISWs generated by a collapse height Δ H of 4 cm, it will not have an internal hydraulic jump under any canyon angle conditions. This is because the flow velocity in the small amplitude condition is less than that in the large amplitude condition. When the depth of the lower fluid is the same, the flow velocity in the small amplitude condition is about 2/3 that in the large amplitude condition. Within a certain range (θ < 110°), the conditions of greater canyon angle and depth produce internal hydraulic jumps more easily. Moreover, larger amplitude of the incident wave results in larger flow velocity caused by the ISWs and the complete internal hydraulic jump. When the canyon angle is greater than 145°, due to the smaller depth of the canyon regions, the blocking effect of the terrain on the upper and lower fluids becomes weaker and there is no internal hydraulic jump occurring at any amplitude of the incident wave.
When the flow is climbing a slope, due to unsteady mixing and entrainment between two fluids, the current moves up and down along the slope by two or three times. Ordinate h h of Figure 9 is the depth along the centerline of the canyon valley, and h h = 0 represents the initial equilibrium position of pycnocline. For the complete hydraulic jump condition, as shown in Figure 9a, the height of the first climb is about half of the initial equilibrium position. At this time, the driving force of the current is large and the current only has a slight drop after reaching the maximum height. Since there is more dense fluid supplied from the back, the increased inertia keeps the current moving upslope. The hydraulic jump occurs before reaching the maximum breaking depth and lasts for a long time near the minimum depth. Moreover, the complete internal hydraulic jump consumes more energy, resulting in a slower speed when current climbs up the slope.
For the wavy hydraulic jump condition, as shown in Figure 9b, the effect of energy consumption is not obvious and the head of the current can climb to the equilibrium position under the action of gravity and then quickly fall back until the rear fluid supplies it to continue to climb. The duration of the hydraulic jump in this type is shorter than that of the complete hydraulic jump condition, so the change near the minimum depth is not as gentle as that of the complete hydraulic jump condition. Since the energy dissipation is not obvious, more energy is used for the current after breaking. Meanwhile, the climbing height of this case is about twice the complete internal hydraulic jump case.
For the condition without hydraulic jump (Figure 9c), the first climb height is far beyond the initial equilibrium position. However, for the six cases under the canyon angle of 145° and 180°, there are no obvious multiple climbing phenomena. In such conditions, strong instability occurs near the pycnocline close to the terrain. After rising to the vicinity of the equilibrium position, these mixed fluids gradually merge with the original pycnocline under the combined action of gravity and buoyancy, forming a second-mode solitary wave with small amplitude that continues to propagate upstream.

3.3. Energy Loss

Based on the definition in Section 2, ISWs energy can be calculated. During a characteristic wave period tp, incident energy E i n of the ISWs, i.e., the total energy, can be decomposed into reflected wave energy E r e f , outflow energy E o u t and energy lost E l o s s during the evolution of the ISWs as follows:
  E i n = E r e f + E o u t + E l o s s
Incident energy E i n is the sum of kinetic energy E k , i n and potential energy E p , i n of the ISWs at profile 1 (see Figure 3a), which can be calculated through vertical displacement η of the pycnocline at profile 1 given by [15]:
E i n = E p , i n + E k , i n = t 1 t b c g Δ ρ η t 2   d t + t 1 t b c a g Δ ρ η t d t
where c is the wave speed and Δ ρ is the density difference between the upper and lower layers of fluid.
The calculation method of reflected energy E r e f is the same as that of incident energy E i n , and the difference is that the calculation time interval is tb~t2.
Outflow energy E o u t on the right side of Equation (11) can be calculated as the energy of the fluid in profile 2 (see Figure 3a) during the entire wave period, and its expression is shown below:
E o u t = c t 1 t 2 y 1 y 2 1 2 ρ u 2 d y d t
For ISWs during the propagation process, the energy of the transmitted wave is small and only accounts for 0.5–3% of the total energy in each case. In order to objectively describe the energy loss, Zou [41] defined energy loss rate R l o s s as follows:
R l o s s = E l o s s E i n
Figure 10a shows variation in energy loss rate of ISWs with different canyon angles and collapse heights, and Figure 10b provides the relationship between energy loss and types of hydraulic jump. Figure 10a indicates that energy loss rate is positively correlated with incident wave amplitude and canyon angle, which determine if internal hydraulic jump occurs in each case. Therefore, energy loss rate is associated with occurrence of internal hydraulic jump, as shown in Figure 10b. For the cases of small Froude numbers and no internal hydraulic jump, the flow velocity caused by the small amplitude of the incident wave is small, which is not enough to initiate internal hydraulic jumps. The absence of internal hydraulic jumps weakens turbulent motions, weakens the coherent structure, reducing energy losses and delivering more energy to the reflected waves, resulting in smaller R l o s s values. For wavy hydraulic jump cases, with an increase in collapse height, the shoaling effect of the ISWs is enhanced and the amplitude of the reflected wave is increased. Therefore, the energy reflection in this condition is comparable to that in the no internal hydraulic jump case. Even though internal hydraulic jump promotes mixing of fluids, the energy dissipation of the wavy internal hydraulic jump is not obvious, so, overall, energy loss is less in wavy hydraulic jump conditions compared to that in complete hydraulic jump conditions. For completely internal hydraulic jump cases, the turbulent motions in flow are strong and the flow velocity distribution is extremely uneven. Due to energetic mixing, fluid particles with different density are constantly exchanged, resulting in a large amount of kinetic energy being consumed in the hydraulic jump region. The larger collapse height will lead to generation of a series of wake waves, thereby increasing energy loss. Meanwhile, complete hydraulic jump leads to generation of more coherent structures, further contributing to energy loss. Previous studies [28,29] showed that energy loss increases as canyon angle increases, and, when the canyon angle is 83°, the energy loss reaches the maximum. In our results, energy loss first increases and then decreases with an increase in canyon angle. When the canyon angle is 75°, the energy loss is the largest. However, due to a lack of experimental data for angles between 75° and 110°, the canyon angle at which energy loss is greatest cannot be accurately determined.
Compared with other canyon terrains, the reflected energy of the 180° case is very small at the same collapse height, less than half of other canyon angles (θ < 180°). More energy is continuously dissipated near the terrain, so the energy loss is greater compared to canyon terrain. In the experimental study of solitary waves over triangular terrain, Mu [15] found that energy loss is positively correlated with incident wave amplitude, consistent with our results for the 180° terrain condition.

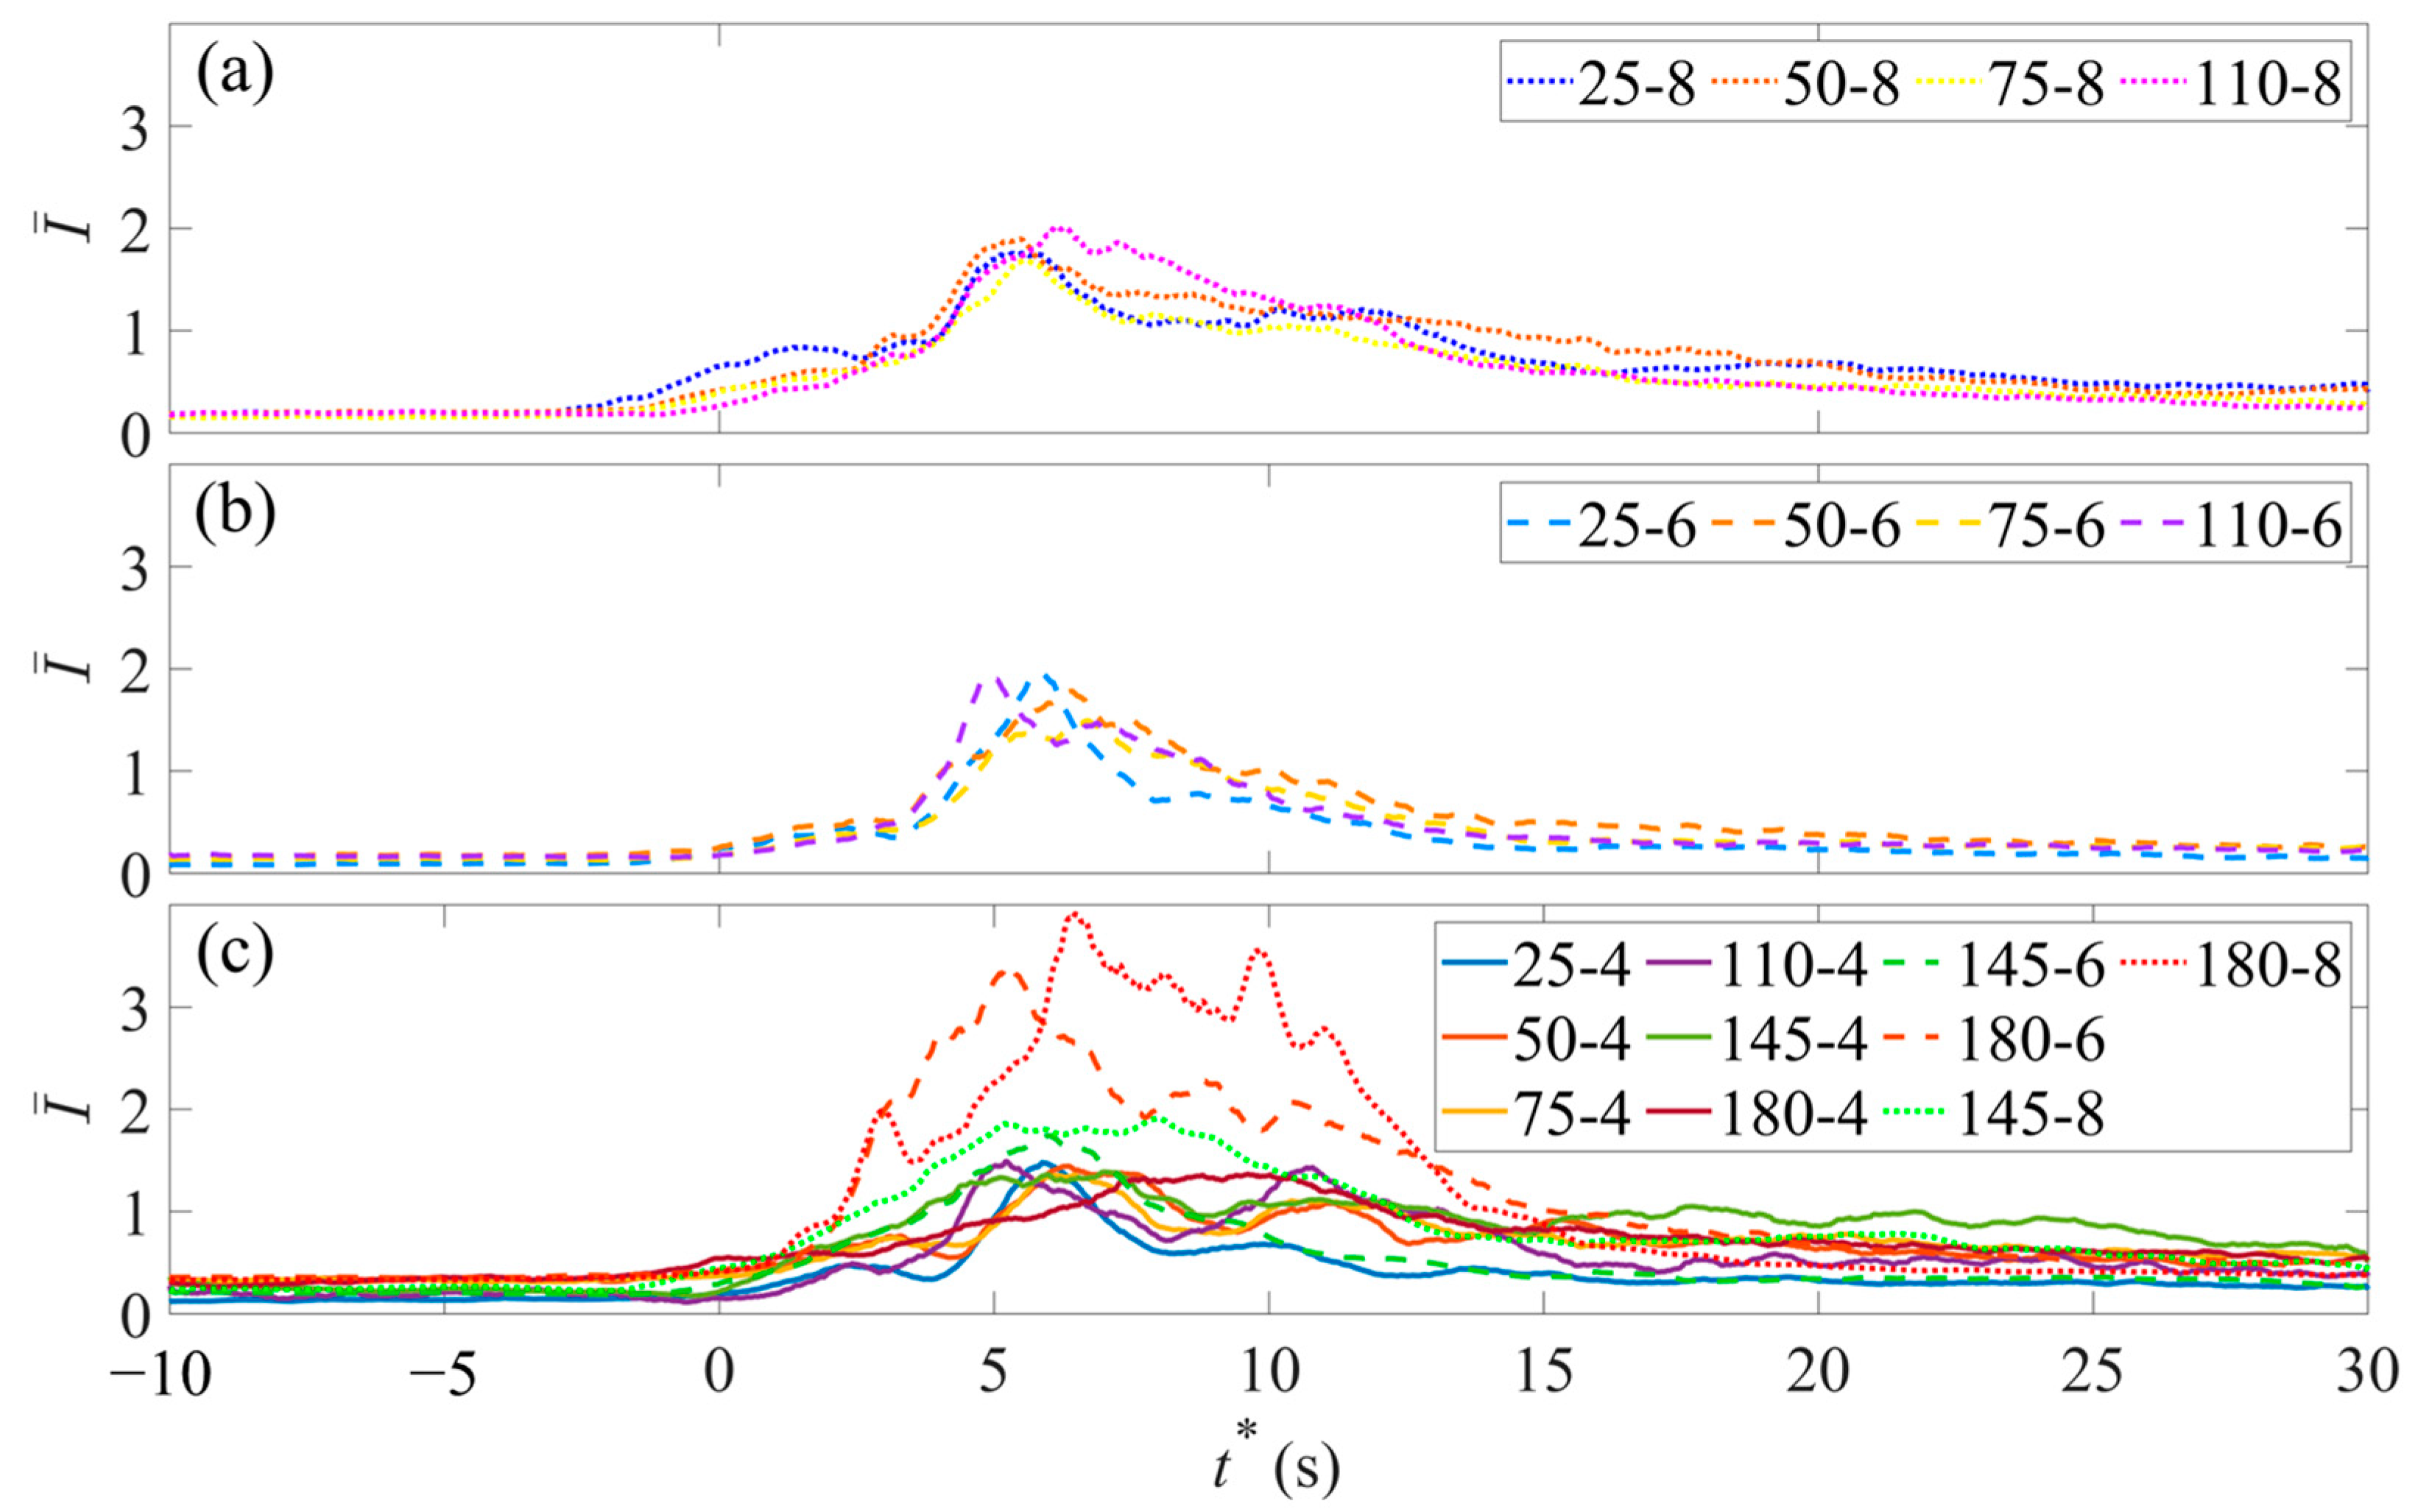
3.4. Evolution of Turbulence Intensity

During the whole breaking process, the incident energy of the ISWs is first transferred from the main flow to the turbulent flow, then to the smaller-scale eddies through the turbulent dissipation and finally becomes potential energy by the viscous effect of the fluid itself. The turbulence intensity can describe the above process well, which can be represented by average turbulent intensity I ¯ , defined by the following formula:
I ¯ = ε ¯ ν N 2
ε = 4 ν u x 2 ¯ + w z 2 ¯ + u x w z ¯ + 3 4 u x + w z 2 ¯
where ε is turbulent kinetic energy dissipation rate, N 2 is buoyancy frequency, N 2 = g ρ 0 ρ z , ρ 0 = ρ 1 + ρ 2 2 . ν = 1.01 × 10 6 (m2/s) is kinematic viscosity. ε ¯ is turbulent kinetic energy dissipation rate averaged over space (the red dashed box in Figure 4), which represents the average turbulent kinetic energy dissipation rate in the canyon region.
Figure 11 indicates that the time series of the average turbulence intensity of the internal hydraulic jump conditions mostly show a unimodal distribution, but, without internal hydraulic jumps, average turbulence intensity follows a bimodal distribution. The average turbulence intensity of the complete hydraulic jump condition is slightly larger than that of the wavy hydraulic jump condition and much larger than that of the no internal hydraulic jump condition (except for 180° canyon). The peak of the average turbulence intensity for all 180° cases occurs within 1–2 s after the maximum breaking depth. At this time, the superposition effect of the incident wave and the reflected wave is strong, which increases the turbulent dissipation, consistent with the conclusions obtained by Alberty et al. [51] from field observations of La Jolla Canyon; on the contrary, the enhanced dissipation in this region is due to near-bottom mixing in Monterey Canyon [52,53].
The average turbulence intensity remains basically unchanged after increasing to a certain value, the nonlinearity of ISWs increases after encountering the terrain and the average turbulence intensity begins to increase continuously. For no internal hydraulic jump conditions, the mean turbulence intensity performs a slightly decreasing trend when reaching the maximum breaking depth. It is possibly because the dissipation rate of the internal wave is greatly increased at the stage of nonlinear enhancement before breaking, while the dissipative rate in the pre-breaking stage is relatively small. After reaching the first maximum climbing height, the current head falls back down due to gravity and mixes with the fluid behind, so the average turbulence intensity increases, resulting in another smaller peak. For the wavy hydraulic jump condition, the duration of the process is short and the peak of the average turbulence intensity is relatively “sharp”. The energy dissipation in this condition is not obvious, so the turbulent dissipation decreases rapidly after reaching the peak value. For the completely internal hydraulic jump condition, the variation degree of the average turbulent intensity at the peak value is relatively moderate. Since the complete internal hydraulic jump lasts for a long time and causes violent mixing, the dissipation rate is relatively large over time. Moreover, occurrence of complete internal hydraulic jumps produces more eddies and coherent structures, and, therefore, the average turbulent intensity decreases slowly after reaching the peak.

3.5. Distribution of Vorticity Probability Density Distribution

Based upon the Q criterion defining vorticity in Equation (5), the vorticity in the canyon region (the red dashed box in Figure 4) was calculated. Figure 12 provides the probability density distribution of positive vorticity at different time instant for four runs. When the ISWs enter the field of view, the vorticity does not increase significantly due to the shearing effect of the upper and lower layers at the early stage. After encountering the terrain, the internal wave is shoaling and deformed, enhancing the wave nonlinearity. Before the internal wave breaks, the vorticity obviously increases as the initial collapse height increases. For the case without internal hydraulic jump (Figure 12a), the vorticity increases significantly at two time instants. The first one is when the internal wave reaches the maximum breaking depth. The second one is after the wave reaches the first maximum climbing height and the fluid in the wave head falls back down, mixing with the fluid behind to increase the vorticity.
For wavy internal hydraulic jump cases (Figure 12b), the time when vorticity increases significantly occurs is before a wave reaches maximum breaking depth, that is, when hydraulic jump occurs. For complete internal hydraulic jump cases (Figure 12c), the shape of the vorticity probability density distribution shows an evident unimodal distribution and the vorticity increases significantly from the occurrence of the hydraulic jump to the maximum breaking depth. After the hydraulic jump, the energy loss is large and the original continuous positive vorticity band is broken up. As seen in Figure 5 (t* = 5, 6 s), positive and negative vortex structures are generated and the vorticity decreases slowly, but it is considerably larger than the wavy internal hydraulic jump condition. For the 180° cases (Figure 12d), the energy transferred to the reflected wave is less than other canyon terrains, and more energy is dissipated near the terrain. After reaching the maximum breaking depth, the vorticity continues to increase and starts to decrease slowly after the pycnocline reaches the initial equilibrium position. This development trend is similar to that of [16] on the interaction between internal waves and triangular obstacles.

4. Conclusions

In this study, laboratory experiments were performed to investigate ISW propagation over canyon terrain with different collapse height and canyon angle by combining PIV and PLIF technology. The following conclusions were obtained:
(1) All the possible interactions between ISWs and canyon terrain are divided into three cases according to Froude number F r , namely F r < 1, no internal hydraulic jump, 1 <   F r < 1.7, wavy internal hydraulic jump and F r > 1.7, complete internal hydraulic jump. The greater canyon angle, collapse depth and amplitude of incident wave more easily generate internal hydraulic jumps. Under the experimental conditions set in this study, when canyon angle is greater than 145°, no internal hydraulic jump will occur under any incident wave amplitude conditions.
(2) Energy loss, vorticity and average turbulence intensity energy loss rate were compared among the conditions of no internal hydraulic jump, wavy internal hydraulic jump and complete internal hydraulic jump. For all canyon cases, vorticity and turbulence intensity showing obvious bimodal distribution are both the smallest in no internal hydraulic jump conditions. For the wavy internal hydraulic jump condition, energy dissipation is not obvious and the average turbulent intensity performs a “sharp unimodal distribution”. On the other hand, in complete internal hydraulic jump conditions, several wake waves and more coherent structures are generated, inducing the greatest energy loss. Since complete internal hydraulic jump lasts for a long time and causes violent mixing, the average turbulent intensity is the largest and its distribution presents a “gentle single peak” pattern.
(3) For 180° conditions (i.e., no canyon cases), less energy is delivered to the reflected wave and more energy is dissipated near the terrain, so the energy loss is the largest in comparison to other conditions. There is no secondary climbing phenomenon. When pycnocline rises to near the equilibrium position, the mixed fluid gradually merges with the original pycnocline, forming a second-mode solitary wave with small amplitude that continues to propagate upstream. Vorticity and turbulence intensity continue to increase until the pycnocline returns to its initial equilibrium position.

Author Contributions

Conceptualization, Y.-T.L. and Y.Y.; Methodology, Y.-T.L., B.S. and Y.Y.; Laboratory Measurement, L.L.; Data Analysis, Y.Y., L.L. and B.S.; Software, L.L.; Writing—Original Draft Preparation, Y.-T.L. and L.L.; Writing—Review and Editing, B.S., Y.Y. and K.H.; Funding Acquisition, Y.-T.L., Y.Y. and K.H. All authors have read and agreed to the published version of the manuscript.

Funding

This research was funded by the National Natural Science Foundation of China (Grant no. 41876089), the Science and technology plan project of Zhejiang Provincial Department of Water Resources (Grant No. RA2010), the Science Foundation of Donghai Laboratory (Grant No. DH-2022KF01016) and Zhejiang Provincial Natural Science Foundation of China (Grant no. LY20A020009),the science foundation of Hainan Observation and Research Station of Ecological Environment and Fishery Resource in Yazhou Bay (Grant No.HNOBYZ2201).

Institutional Review Board Statement

Not applicable.

Informed Consent Statement

Not applicable.

Data Availability Statement

All data, models or codes that support the findings of this study are available from the corresponding author upon reasonable request.

Conflicts of Interest

The authors declare no conflict of interest.

References

  1. Osborne, A.R.; Burch, T.L. Internal solitons in the Andaman sea. Science 1980, 208, 451–460. [Google Scholar] [CrossRef]
  2. Cai, S.; Xie, J.; He, J. An overview of internal solitary waves in the south China sea. Surv. Geophys. 2012, 33, 927–943. [Google Scholar] [CrossRef]
  3. Guo, C.; Chen, X. A review of internal solitary wave dynamics in the northern South China Sea. Prog. Oceanogr. 2014, 121, 7–23. [Google Scholar] [CrossRef]
  4. Klymak, J.M.; Legg, S.; Alford, M.; Buijsman, M.; Pinkel, R.; Nash, J. The direct breaking of internal waves at steep topography. Oceanography 2012, 25, 150–159. [Google Scholar] [CrossRef]
  5. Helfrich, K.R. Internal solitary wave breaking and run-up on a uniform slope. J. Fluid Mech. 1992, 243, 133–154. [Google Scholar] [CrossRef]
  6. Michallet, H.; Ivey, G.N. Experiments on mixing due to internal solitary waves breaking on uniform slopes. J. Geophys. Res. Oceans 1999, 104, 13467–13477. [Google Scholar] [CrossRef]
  7. Boegman, L.; Imberger, G. The degeneration of internal waves in lakes with sloping topography. Limnol. Oceanogr. 2005, 50, 1620–1637. [Google Scholar] [CrossRef]
  8. Vlasenko, V.I.; Hutter, K. Generation of second mode solitary waves by the interaction of a first mode soliton with a sill. Nonlinear Process. Geophys. 2001, 8, 223–239. [Google Scholar] [CrossRef]
  9. Chen, C.Y. Amplitude decay and energy dissipation due to the interaction of internal solitary waves with a triangular obstacle in a two-layer fluid system: The blockage parameter. J. Mar. Sci. Technol. 2009, 14, 499–512. [Google Scholar] [CrossRef]
  10. Chen, C.Y.; Hsu, J.R.; Kuo, C.F. Laboratory observations on internal solitary waves evolution over a submarine ridge. China Ocean Eng. 2006, 20, 61–72. [Google Scholar] [CrossRef]
  11. Wessels, F.; Hutter, K. Interaction of internal waves with a topographic sill in a two-layered fluid. J. Phys. Oceanogr. 1996, 26, 5. [Google Scholar] [CrossRef]
  12. Huttemann, H.; Hutter, K. Baroclinic solitary water waves in a two-layer fluid system with diffusive interface. Exp. Fluids 2001, 30, 317–326. [Google Scholar] [CrossRef]
  13. Talipova, T.; Terletska, K.; Maderich, V.; Brovchenko, I.; Jung, K.T.; Pelinovsky, E.N.; Grimshaw, R.H. Internal solitary wave transformation over a bottom step: Loss of energy. Phys. Fluids 2013, 25, 032110. [Google Scholar] [CrossRef]
  14. Du, H.; Wang, S.D.; Wang, X.L.; Xu, J.-N.; Guo, H.-L.; Wei, G. Experimental investigation of elevation internal solitary waves propagation over a ridge. Phys. Fluids 2021, 33, 042108. [Google Scholar] [CrossRef]
  15. Moore, C.; Koseff, J.; Hult, E. Characteristics of bolus formation and propagation from breaking internal waves on shelf slopes. J. Fluid Mech. 2016, 791, 260–283. [Google Scholar] [CrossRef]
  16. Mu, H.; Chen, X.; Li, Q. Laboratory Experiments on an interna solitary waves over a Triangular Barrier. Ocean Univ. China 2019, 18, 1061–1069. [Google Scholar] [CrossRef]
  17. Nittrouer, C.A.; Wright, L.D. Transport of particles across continental helves. Rev. Geophys. 1994, 32, 85–113. [Google Scholar] [CrossRef]
  18. Zhu, W.L.; Zhong, K.; LI, Y.C.; Xu, Q.; Fang, D. Characteristics of hydrocarbon accumulation and exploration potential of the northern South China Sea deep water basins. Chin. Sci. Bull. 2012, 57, 3121–3129. [Google Scholar] [CrossRef]
  19. Wang, C.S.; Zhu, J.J.; Zhao, D.D. Origin and evolution of submarine canyons. Mar. Geol. Front. 2021, 37, 1–15. [Google Scholar] [CrossRef]
  20. Burrier, D.A. The Internal Wave Dynamics of Barkley Submarine Canyon. Master’s Thesis, San Jose State University, San Jose, CA, USA, 2019. [Google Scholar] [CrossRef]
  21. Kunze, E.; Rosenfeld, L.K.; Carter, G.S.; Gregg, M.C. Internal waves in Monterey submarine canyon. J. Phys. Oceanogr. 2002, 32, 1890–1913. [Google Scholar] [CrossRef]
  22. Gardner, W.D. Periodic resuspension in Baltimore canyon by focusing of internal waves. J. Geophys. Res. Atmos. 1989, 94, 18185–18194. [Google Scholar] [CrossRef]
  23. Gordon, R.L.; Marshall, N.F. Submarine canyons: Internal wave traps? Geophys. Res. Lett. 1976, 3, 622–624. [Google Scholar] [CrossRef]
  24. Hickey, B.M. The response of a steep-sided, narrow canyon to time-variable wind forcing. J. Phys. Oceanogr. 1997, 27, 697–726. [Google Scholar] [CrossRef]
  25. Ledwell, J.R.; Montgomery, E.T.; Polzin, K.L.; Laurent, L.C.; Schmitt, R.W.; Toole, J.M. Evidence for enhanced mixing over rough topography in the abyssal ocean. Nature 2000, 403, 179–182. [Google Scholar] [CrossRef]
  26. Hickey, B.M.; Banas, N.S. Why is the northern end of the california current system so productive? Oceanography 2008, 21, 90–107. [Google Scholar] [CrossRef]
  27. Hotchkiss, F.S.; Wunsch, C. Internal waves in Hudson canyon with possible geological implications. Deep-Sea Res. Part A. Oceanogr. Res. Pap. 1982, 29, 415–442. [Google Scholar] [CrossRef]
  28. Nazarian, R.H.; Legg, S. Internal wave scattering in continental slope canyons, Part 1: Theory and development of a ray tracing algorithm. Ocean Model. 2017, 118, 1–15. [Google Scholar] [CrossRef]
  29. Nazarian, R.H.; Legg, S. Internal wave scattering in continental slope canyons, Part 2: A comparison of ray tracing and numerical simulations. Ocean Model. 2017, 118, 16–30. [Google Scholar] [CrossRef]
  30. Kelly, S.; Jones, N.; Nash, J.; Waterhouse, A. The geography of semidiurnal mode-1 internal-tide energy loss. Geophys. Res. Lett. 2013, 40, 4689–4693. [Google Scholar] [CrossRef]
  31. Min, W.; Li, Q.; Xu, Z.; Wang, Y.; Li, D.; Zhang, P.; Robertson, R.; Yin, B. High-resolution, non-hydrostatic simulation of internal tides and solitary waves in the southern East China Sea. Ocean. Model. 2023, 181, 102141. [Google Scholar] [CrossRef]
  32. Nazarian, R.H.; Burns, C.M.; Legg, S.; Buijsman, M.C.; Arbic, B.K. Calculating Global Dissipation of Internal Tides in Submarine Canyons. In Proceedings of the 23rd EGU General Assembly 2021, Online, 19–30 April 2021. EGU21-512. [Google Scholar] [CrossRef]
  33. Hamann, M.M.; Alford, M.H.; Lucas, A.J.; Waterhouse, A.F.; Voet, G. Turbulence Driven by Reflected Internal Tides in a Supercritical Submarine Canyon. J. Phys. Oceanogr. 2021, 51, 591–609. [Google Scholar] [CrossRef]
  34. Lin, Y.T.; Luo, Y.Y.; Yu, J.Y.; Song, J.B.; Yuan, Y.P. Laboratory investigation of turbulent dissipation in an internal solitary wave breaking over a submerged Gaussian ridge. Phys. Fluids 2021, 33, 096602. [Google Scholar] [CrossRef]
  35. Harris, P.T.; Whiteway, T. Global distribution of large submarine canyons: Geomorphic differences between active and passive continental margins. Mar. Geol. 2011, 285, 69–86. [Google Scholar] [CrossRef]
  36. Pawlak, G.; Armi, L. Vortex dynamics in a spatially accelerating shear layer. J. Fluid Mech. 1998, 376, 1–35. [Google Scholar] [CrossRef]
  37. Zhu, D.Z.; Lawrence, G.A. Holmboe’s instability in exchange flows. J. Fluid Mech. 2001, 429, 391–409. [Google Scholar] [CrossRef]
  38. Crimaldi, J.P. Planar laser induced fluorescence in aqueous flows. Exp. Fluids 2008, 44, 851–863. [Google Scholar] [CrossRef]
  39. Grue, J.; Friis, H.A.; Palm, E.; Rusås, P.O. A method for computing unsteady fully nonlinear interfacial waves. J. Fluid Mech. 2000, 351, 223–252. [Google Scholar] [CrossRef]
  40. Sutherland, B. Interfacial waves. In Internal Gravity Waves; Cambridge University Press: Cambridge, UK, 2010; pp. 74–140. [Google Scholar] [CrossRef]
  41. Zou, L.; Wen, Z.H.; Sun, T.Z.; Ma, X.Y.; Wang, X.Y. Experimental study on transformation and energy properties of depression internal solitary waves over a Bottom Step. Phys. Fluids 2021, 33, 032109. [Google Scholar] [CrossRef]
  42. Robinson, S.K. Coherent Motions in the Turbulent Boundary Layer. Annu. Rev. Fluid Mech. 1991, 23, 601–639. [Google Scholar] [CrossRef]
  43. Hunt, J.; Wray, A.; Moin, P. Eddies, streams, and convergence zones in turbulent flows. Studying Turbulence Using Numerical Simulation Databases, 2. Proceedings of the 1988 Summer Program. 1988, pp. 193–208. Available online: https://web.stanford.edu/group/ctr/Summer/201306111537.pdf (accessed on 16 November 2022).
  44. Holmén, V. Methods for Vortex Identification. Master’s Theses, Lund University, Lund, Sweden, 2012. [Google Scholar]
  45. Zhang, Y.N.; Liu, K.H.; Xian, H.Z.; Du, X.Z. A review of methods for vortex identification in hydroturbines. Renew. Sustain. Energy Rev. 2018, 81, 1269–1285. [Google Scholar] [CrossRef]
  46. Liu, J.M.; Liu, C.Q. Modified normalized rortex/vortex identification method. Phys. Fluids 2019, 31, 061704. [Google Scholar] [CrossRef]
  47. Wood, I.R.; Simpson, J.E. Jumps in layered miscible fluids. J. Fluid Mech. 1984, 140, 329–342. [Google Scholar] [CrossRef]
  48. Farmer, D.M.; Armi, L. Maximal two-layer exchange over a sill and through the combination of a sill and contraction with barotropic flow. J. Fluid Mech. 1986, 164, 53–76. [Google Scholar] [CrossRef]
  49. Lawrence, G.A.; Armi, L. Stationary internal hydraulic jumps. J. Fluid Mech. 2022. [Google Scholar] [CrossRef]
  50. Negm, A.M. Optimal roughened length of prismatic stilling basins. In Proceedings of the 5th International Conference on Hydro Science and Engineering Conference, Warsaw, Poland, 18–21 September 2002. [Google Scholar]
  51. Alberty, M.S.; Billheimer, S.; Hamann, M.M.; Ou, C.Y.; Tamsitt, V.; Lucas, A.; Alford, M.H. A reflecting, steepening, and breaking internal tide in a submarine canyon. J. Geophys. Res. Oceans 2017, 122, 6872–6882. [Google Scholar] [CrossRef]
  52. Wain, D.J.; Gregg, M.C.; Alford, M.H.; Lien, R.C.; Carter, G.S.; Hall, R.A. Propagation and dissipation of the internal tide in upper Monterey Canyon. J. Geophys. Res. 2013, 118, 4855–4877. [Google Scholar] [CrossRef]
  53. Carter, G.S.; Gregg, M.C. Intense, variable mixing near the head of Monterey Submarine Canyon. J. Phys. Oceanogr. 2002, 32, 3145–3165. [Google Scholar] [CrossRef]
Figure 1. Schematic diagram of the ISW experimental setup.
Jmse 11 00355 g001
Figure 2. Schematic diagram of the canyon model.
Jmse 11 00355 g002
Figure 3. Determination of initial moment and characteristic period. (a) Experimental image and locations of featured profiles; (b) time series of pycnocline displacement η in profile 1.
Jmse 11 00355 g003
Figure 4. Density field (left panel, ρ * = ρ 2 ρ 1 20   k g / m 3 ) and vorticity field (right panel) of ISW evolution processes in Run 25-8 (the yellow arrow in the left panel is the velocity vector, the red circle is the hydraulic jump area, the yellow curve in the right panel is the location of the pycnocline and the red dashed box is the canyon region).
Jmse 11 00355 g004
Figure 5. Density field and vorticity field of ISW evolution processes in Run 75-8.
Jmse 11 00355 g005
Figure 6. Density field and vorticity field of ISW evolution processes in Run 180-8.
Jmse 11 00355 g006
Figure 7. (a,b) Velocity and density profile and time series of (c) Froude number, (d) upper and lower depths and (e) velocity in upper and lower layers at the feature profile of Run 75-8.
Jmse 11 00355 g007
Figure 8. Maximum Froude number for each run (green and purple lines represent critical numbers Fr = 1.7 and = 1 ).
Jmse 11 00355 g008
Figure 9. Head position of ISWs when flow climbs along the slope in each case: (a) the complete hydraulic jump condition, (b) the wavy hydraulic jump condition and (c) no hydraulic jump condition.
Jmse 11 00355 g009
Figure 10. Variations in energy loss rate R l o s s with (a) canyon angle (hollow symbols mean that no internal hydraulic jump occurs) and (b) maximum Froude number.
Jmse 11 00355 g010
Figure 11. Temporal variations in average turbulence intensity: (a) complete hydraulic jump condition, (b) wavy hydraulic jump condition and (c) no hydraulic jump condition.
Jmse 11 00355 g011
Figure 12. Time series of vorticity probability density distribution: (a) Run 75-4 (no internal hydraulic jump), (b) Run 75-6 (wavy internal hydraulic jump), (c) Run 75-8 (complete internal hydraulic jump) and (d) Run 180-8 (no internal hydraulic jump). The dashed line indicates time when internal hydraulic jump occurs, and the double dotted line represents time for occurrence of maximum breaking depth. Data between Q = [−0.05, 0.05] were eliminated for better comparison.
Jmse 11 00355 g012
Table 1. Experimental conditions and relevant parameters.
Run ρ 1   ( k g / m 3 ) ρ 2   ( k g / m 3 ) θ   (°) D (cm) Δ H   (cm) a (cm)Internal Hydraulic JumpBolus
25-41.0301.050251041.513nono
25-61.0301.050251062.337wavyyes
25-81.0301.050251082.745completeyes
50-41.0301.050501041.267noyes
50-61.0301.050501062.203wavyyes
50-81.0301.050501082.448completeyes
75-41.0301.050751041.291noyes
75-61.0301.050751062.391wavyyes
75-81.0301.050751082.41completeyes
110-41.0301.0501105.441.373noyes
110-61.0301.0501105.462.279wavyyes
110-81.0301.0501105.482.466completeyes
145-41.0301.0501452.441.545nono
146-61.0301.0501452.462.378nono
145-81.0301.0501452.482.552nono
180-41.0301.050180041.478nono
180-61.0301.050180062.272nono
180-81.0301.050180082.454nono
Note: in the “Run” column, the first number represents the angle of the canyon and the second number means collapse height Δ H .
Disclaimer/Publisher’s Note: The statements, opinions and data contained in all publications are solely those of the individual author(s) and contributor(s) and not of MDPI and/or the editor(s). MDPI and/or the editor(s) disclaim responsibility for any injury to people or property resulting from any ideas, methods, instructions or products referred to in the content.

