Article

Comparison of Coherent to Incoherent Kirchhoff-Ray-Mode (KRM) Models in Predicting Backscatter by Swim-Bladder-Bearing Fish

1
College of Underwater Acoustic Engineering, Harbin Engineering University, Harbin 150001, China
2
Acoustic Science and Technology Laboratory, Harbin Engineering University, Harbin 150001, China
3
Fishery Resource Analysis and Monitoring Division, Northwest Fisheries Science Center, National Marine Fisheries Service, National Oceanic and Atmospheric Administration, Seattle, WA 98112, USA
4
School of Aquatic and Fishery Sciences, University of Washington, Seattle, WA 98195, USA
*
Author to whom correspondence should be addressed.
J. Mar. Sci. Eng. 2023, 11(3), 473; https://doi.org/10.3390/jmse11030473
Submission received: 18 January 2023 / Revised: 18 February 2023 / Accepted: 20 February 2023 / Published: 22 February 2023
(This article belongs to the Special Issue Marine Fish Farming Techniques: Current Status and Trends)

Abstract

:
The Kirchhoff-Ray-Mode (KRM) model has been used in fishery acoustics for more than two decades to predict backscatter by individuals or aggregations of swimbladdered fish. Backscatter contributions from a fluid-like fish body and gas-filled swimbladder are coherently summed to estimate backscatter from the whole fish. For field applications, where morphologies and orientations of individual fish and their swimbladders are unknown, the coherent KRM model based on a limited number of X-ray images containing precise morphological information on swimbladders, body sizes and orientations may not provide statistically stable and robust backscatter predictions. An incoherent KRM model is proposed, which is independent of the exact knowledge of body–swimbladder acoustic interactions. When backscatter contributions from fish bodies and swimbladders are comparable, differences in coherent and incoherent KRM model target strength (TS) predictions can be as high as a few decibels. Incoherent TS predictions as a function of frequency and orientation are statistically more stable and less sensitive to variations in anatomy among individual fish than those predicted using the traditional coherent KRM model.

1. Introduction

Acoustic models are used to characterize acoustic scattering (i.e., reflected energy) from fish and other aquatic organisms. Reflected energy amplitudes from single animals, termed target strength (TS), have been studied over the past 30 years [1]. Ensemble reflected energy or echo integration uses TS as a key quantity to determine fish density [2] and numerous in situ [3,4,5,6] and ex situ measurements have been conducted to study the TS of fish [7,8,9,10,11,12]. These observations have been used to validate empirical and theoretical acoustic models, to characterize acoustic backscatter, and to predict TS of individual scatterers [13,14,15,16]. Many studies have examined factors that affect TS values. While external factors are primarily dependent on incident frequencies [17,18,19,20,21], fish behavior, such as incident angle [11,22,23,24] and depth [25], along with internal factors, including fish physiology and anatomy, can also affect TS values [15,26,27]. All currently available acoustic scattering models were developed using a variety of assumptions and/or approximations. A quantitative study by [28] showed that the backscatter by fish swim bladders (SWB) contributes 90% or more of the total fish backscatter, where the size and shape of swim bladders are important factors influencing TS. A swim bladder is an air-filled cylindrical organ in many fish species that is used to control buoyancy. Anderson studied scattering from a fluid sphere and demonstrated the complex relationship between scattering and frequency [29]. Love [18] improved predictions of resonance scattering by a non-ideal spherical bubble, which included radiation, viscous, and thermal damping terms and incorporated Strasberg’s [30] resonance frequency prediction for a non-spherical bubble. Non-spherical scattering models, which are closer to swim bladder anatomy have been proposed to be more accurate [31,32]. However, the scattered fields from non-spherical objects are much more directional and have more side lobes compared to spherical objects. Ye [33] presented a theoretical scattering model using a surface average approximation to calculate the scattering by a prolate spheroidal swimbladder at low- or near-resonance frequencies. Furusawa and colleagues [34] proposed a prolate-spheroid model based on the exact modal series solution with truncated modes, which would not work well for higher frequencies. Stanton [35,36,37] developed approximate scattering models to characterize scattering by finite size with an arbitrary shape and a cylindrical cross section and contrasting boundary conditions, but this approach is only suitable for elongated (large aspect ratio) targets. Clay [19] used fluid-filled finite cylinders to approximate fish swimbladders and developed a low-resolution acoustic scattering model. He then found [20] that ka = 0.15 (where k = 2π/λ is the wave number, a is the spherical radius of equal volume, and λ is the wavelength) approximates the transition between the Kirchhoff approximation and modal series solutions (i.e., a ka mode solution). The mode solution gives the breathing mode via a gas-filled cylinder at ka << 1 (<0.15), while the Kirchhoff approximation is applied for ka ≥ 0.15.
In 1994, Clay and Horne proposed the Kirchhoff-Ray-Mode model (KRM) and calculated the TS of cod [38]. The KRM model incorporates variability in swimbladder shape, the capability to include a wide range of frequencies (i.e., from resonance and geometric scattering regions), the flexibility to include fish bodies and single- or multi-chambered swim bladders, and is computationally efficient. Exact numerical models, such as the boundary element method (BEM) and Fourier matching method (FMM), are used to compute scattering by non-spherical and homogeneous swim bladders (e.g., Foote and Francis; Reeder and Stanton [39,40]). Even though a non-spherical-shaped object such as a prolate spheroid is more anatomically appropriate to represent the shape of a swimbladder, exact numerical models are difficult and time consuming to implement and will not converge at high frequencies. All resonance scattering models mentioned above will not predict accurate results at frequencies that are much higher than resonance. The KRM model, even though approximate, can provide a reasonable tradeoff between computational complexity and accuracy when predicting backscatter from aquatic organisms [38]. As a result, the KRM model is widely used in fisheries acoustics [16].
The KRM model calculates backscatter by computing scattering contributions (i.e., scattering amplitude or scattering length) from a series of circular disks along the fish axis (i.e., sagittal axis lengthwise along fish body) as a function of length (l), frequency (f), tilt or roll angle (θ, ϕ), or wave number (k). When the frequency of an incident wave is very low (i.e., <a few kHz), swimbladders will resonate. Clay [19] used an equal-volume cylinder resonance model at ka < 0.15. At frequencies ka > 0.15, the total scattering length (L) consists of backscatter from the swim bladder (SWB,   L S W B ) and from the fish body (FB, L f b ) . The KRM model uses radiograph images of both FB and SWB to digitize fish morphology and then, for backscatter contributions, the two components are added coherently. Since morphologies and orientations of individual fish within a species are variable [41], a coherent KRM model may not provide adequate backscatter predictions due to a lack of information on the range of fish morphologies within a cohort, population, or species.
As an alternate approach, an incoherent KRM backscatter model eliminates the coherent interaction between the fish body and the swim bladder and may be more appropriate when estimating backscatter from aggregations of animals. To illustrate the application to aggregations of fish, we calculate and average predicted TS of many fishes that are similar in length and compare the results obtained from the proposed incoherent KRM model with those from the coherent KRM model.

2. Theory and Method

2.1. Coherent and Incoherent KRM Models

For an individual (whole) fish (WF), the KRM model [38] estimates scattering length (L), or scattering amplitude, as a coherent summation of the fish swim bladder (SWB) and the fish body (FB):
L w f ( f ) = L s w b ( f ) + L f b ( f )  
where L s w b ( f )   and   L f b ( f ) are scattering lengths of fish SWB and FB, respectively, and both are complex functions.
For a simultaneously insonified acoustic volume that includes N fish, the differential cross section (square of scattering length, i.e., | L | 2 ) averaged over these N fish is:
σ b s ( f ) =   1 N | n 1 N L w f n ( f ) | 2 = 1 N | n = 1 N ( L s w b n ( f ) +   L f b n ( f ) ) | 2     = 1 N n = 1 N | L s w b n ( f ) | 2 + 1 N n = 1 N | L f b n ( f ) | 2 + 1 N n = 1 N k = 1 k n N L s w b n ( f ) L f b n ( f )
The above equation is the coherent KRM model (Clay, [20] formalized by Clay and Horne, [38]). The first two terms in Equation (2) represent the incoherent summation; the 3rd term is the cross term that tends to approach zero assuming L s w b n ( f ) and L f b n ( f ) are uncorrelated, since individuals within the aggregation have random locations, sizes, and orientations. This assumption is extremely difficult to validate and then incorporate in scattering length calculations since the 3rd term in the equation requires exact shapes of SWB and FB and their relative positions for each fish within the insonified volume. Signal representation is in a complex form containing amplitude and phase information. Coherent summation includes both amplitude and phase components (1st and 2nd rows on the righthand side of Equation (2)) while incoherent summation adds only the real amplitude component (the first two terms in the 3rd row of Equation (2)). The terms coherent and incoherent are used to refer to the phases of scattered waves. Coherent scattered wavelets have non-random phases when reflected back to the source (i.e., in the receive direction). When predicting amplitudes and phases, the real and imaginary components are used in calculations. Incoherent wave scattering has random phases and the real component of the signal is used in calculations. However, according to the law of large numbers [42], the average differential cross section ( σ b s ( f ) ) approximates the real expected value if N 1 [43]. Consequently, if the number of fish in any aggregation is large (i.e., N 1 ), then the 3rd term representing the coherent interaction between SWB and FB can be assumed to approach zero. When the backscatter from aggregations of animals is estimated, variability in the position of the swim bladder relative to the fish body causes the average phase component to tend to zero. This approximation is very similar to the concept used in echo-integration, the conventional method used to acoustically estimate marine organism abundance [44,45].
By dropping the 3rd term, the average differential cross section can be approximated by an incoherent average or sum:
σ b s ( f ) 1 N n = 1 N | L s b n ( f ) | 2 + 1 N n = 1 N | L f b n ( f ) | 2
This incoherent KRM model can use SWB and FB morphological information from a few fish to estimate backscatter from an aggregation. Without the unpredictable cross term, the value of σ b s ( f ) changes relatively little due to anatomical variability among SWB and FB shapes and orientations and, assuming no multipath scattering, is not affected by the relative positions of individuals in the sample volume. This incoherent form of the KRM model (Equation (3)) is believed to be more robust when describing backscatter by swim-bladdered fish aggregations compared to the coherent average (Equation (2)). When predicting backscatter from a fish aggregation where the number of fish is very large, predicted TS values calculated using the coherent and incoherent KRM models are expected to converge as the number of fish in an aggregation increases.

2.2. Digitized Fish Images and Scattering Computations

Eighty dorsal and lateral radiograph images (cf. Henderson and Horne [12]) of Pacific hake (Merluccius productus) were digitized at 1 mm resolution, and their lengths, heights, and widths were measured. A representative example of hake radiographs includes dorsal and lateral X-ray images showing the SWB, FB, and other skeletal (e.g., skull, otoliths, spinal column) elements (Figure 1). The SWB is located below the vertebral column and appears darker because of reduced X-ray absorption. When digitized, the size, length, and angle of a SWB are also preserved. If the fish is not aligned along the sagittal axis when radiographed, the fish is digitally straightened to enable calculations of the finite cylinders.
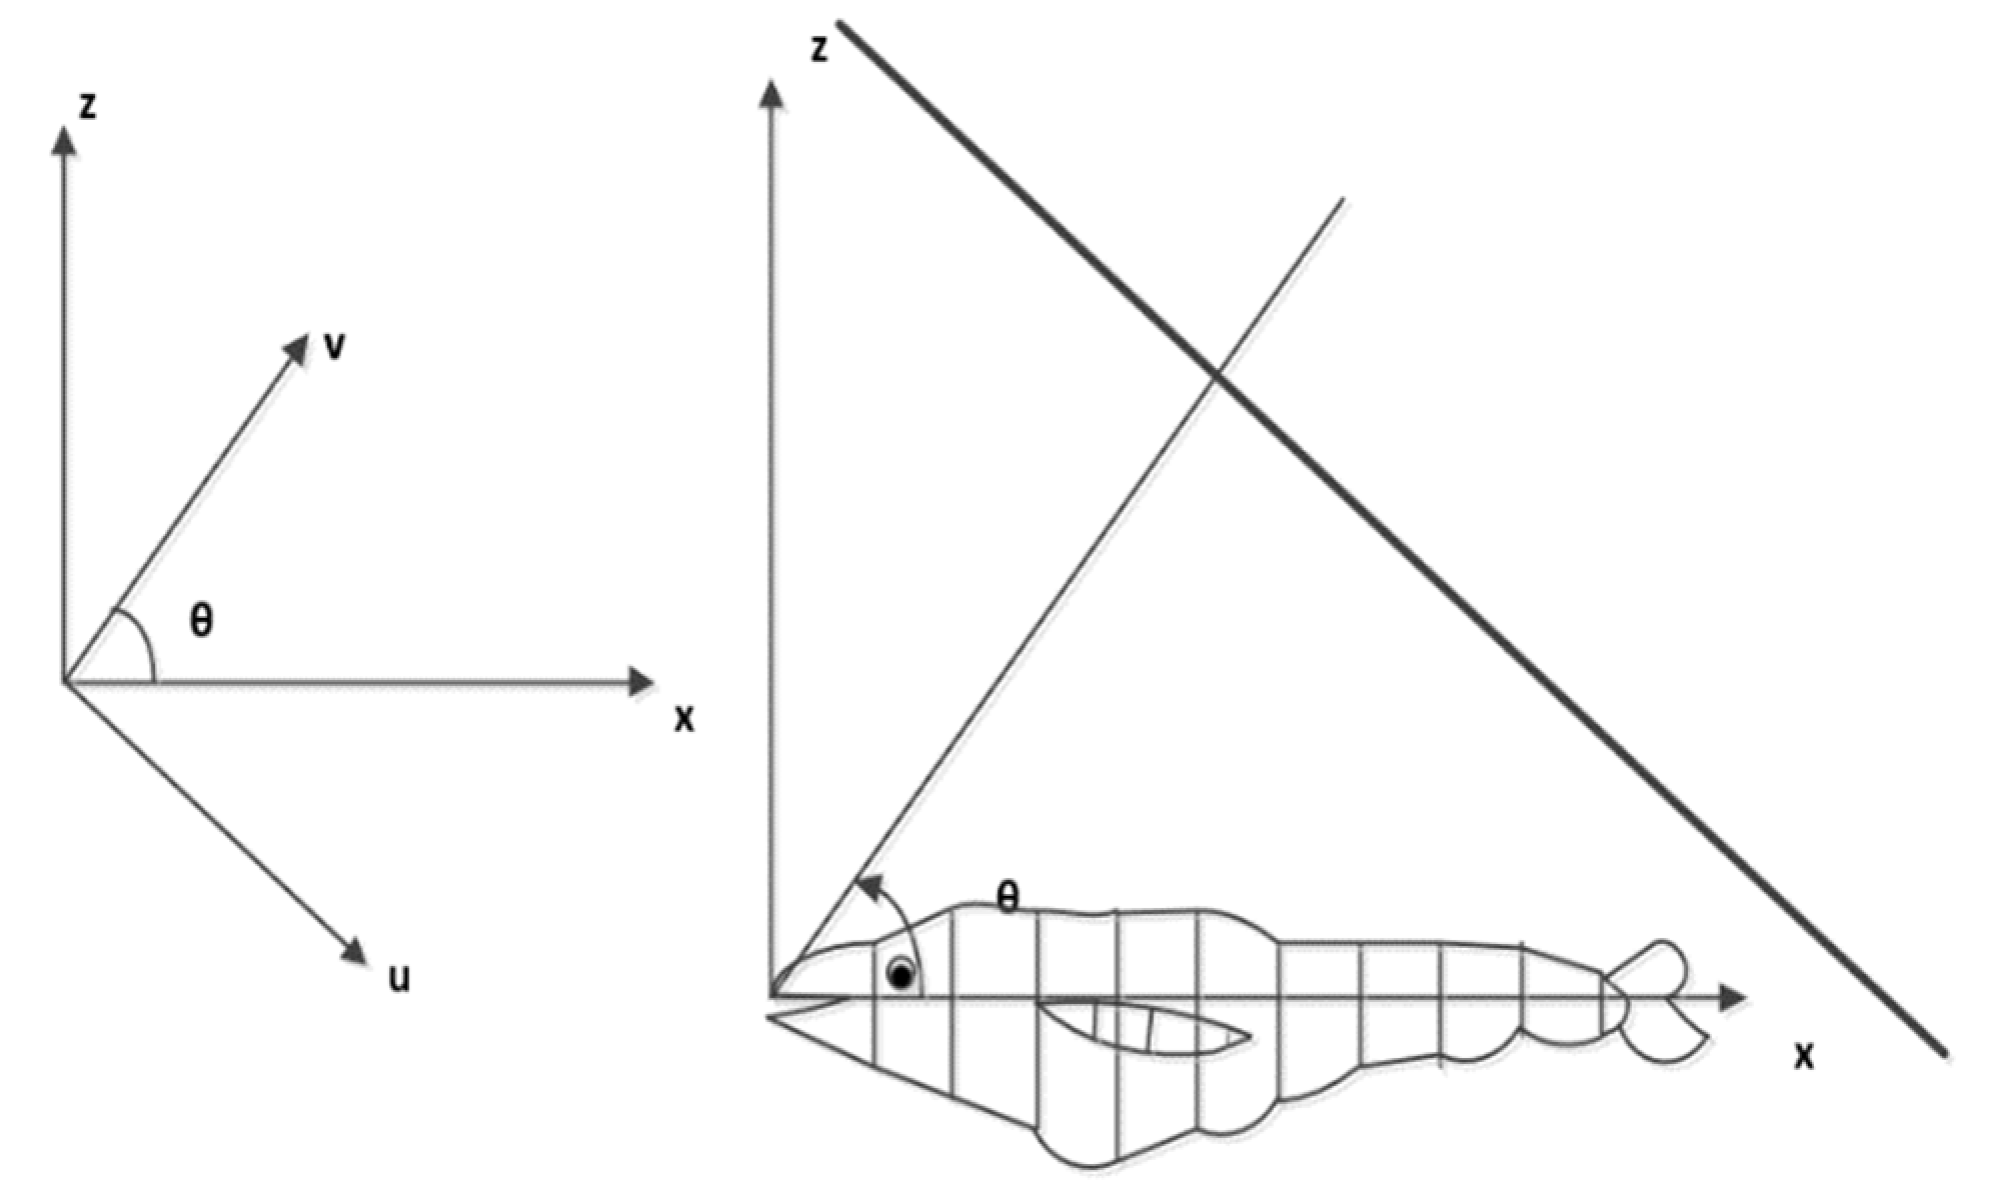
We will provide a brief summary of how to calculate the TS here. A more detailed description can be found in Clay and Horne [38] and Henderson and Horne [12]. All digital dimensions were determined using a 2-D coordinate system interpolated to a set of concentric 1 mm-thick circular disks. The x-y coordinates were transformed to a rotated u-v coordinate system relative to the incident wave front (Figure 2). Coordinate u is parallel to the incident wave, while coordinate v is parallel to the incident ray. In the x-z plane, the incident ray is at an angle θ   relative   to the x-axis. Δ u is the projection of Δ x along the x-axis onto the u-axis [38]:
Δ u = Δ xsin θ
Many factors influence backscatter amplitude or scattering length, such as acoustic frequency and shape, length, and orientations of the SWB and FB. Backscattered waves from the SWB and FB will also interact, resulting in constructive and destructive interference. Backscattering cross sections of each finite cylinder in the fish body and SWB are summed coherently. A low-mode cylinder solution is used when the value of SWB ka is less than 0.15, where k is the wave number and a is the equivalent cylindrical radius. In calculating backscatter from the SWB, only the lowest mode, or breathing mode, is used [19,20]. For ka > 0.15, the scattering length of the SWB  L s w b ( f ) [38] is:
L s w b ( f ) = i R f s ( 1 R w f 2 ) 2 π j = 0 M s w b 1 A s w b [ ( k a ( j ) + 1 ) sin θ ] 1 2 [ e i ( 2 k V U ( j ) + φ s w b ) ] Δ u ( j )
where M s w b is the number of circular disks in the SWB.   A s w b k a k a + 0.083 is the amplitude of the SWB scattering length, φ s w b k a 40 + k a 1.05 is the phase for small ka, k = 2 π λ is the wave number, λ is incident wavelength, and a is the radius of a circular disk. R f s and R w f   represent the reflection coefficients of two interfaces, FB/SWB and water/FB, and are calculated using the fish body density ( ρ f b ) and sound speed ( c f b ) in fish, the water density ( ρ w ) and sound speed ( c w ) in water, the SWB (air) density ( ρ s w b ), and sound speed ( c s w b ) in the SWB (i.e., air):
R f s = ρ s w b c s w b ρ f b c f b ρ s w b c s w b + ρ f b c f b
R w f = ρ f b c f b ρ w c w ρ f b c f b + ρ w c w
Equation (6) is the reflection coefficient of the FB to SWB interface and Equation (7) is the reflection coefficient of the water to FB interface. Δ u ( j ) is the length of each circular disk along the sagittal axis of the FB. The subscript cases fb, w, and swb indicate fish body, water, and swim bladder.
The scattering length of fish body L f b ( f ) can be expressed as
L f b ( f ) = i R w f   2 π j = 0 M f b 1 [ k a ( j ) sin θ ] 1 2 [ e i 2 k V u ( j )     ( 1 R w f 2 ) e i ( 2 k V u ( j ) + 2 k ( V U ( j ) V L ( j ) + φ f b ) ) ] Δ u ( j ) ,
where M f b is the number of circular disks of the fish body and φ f b = π k V u 2 ( π k V u + 0.4 ) is an empirical phase correction.
TS is a logarithmic representation of the backscattering cross section σ b s defined as (Medwin and Clay, 1998):
TS = 10 log 10 σ b s ( f )
TS will be used in simulations to quantify backscatter by individuals and by aggregations of Pacific hake. Simulations investigating differences between coherent and incoherent scattering models are presented in the next section, where two scenarios, one involving single fish and the other involving multiple fish, are evaluated.
Ten fish (200 ± 10 mm) are used to demonstrate differences between coherent and incoherent KRM model predictions as a function of the number of fish used in calculating backscatter amplitudes for a group (see Table 1). Groups consist of three, five, seven, and ten fish, with members of each group picked randomly from the ten digitized fish. The modeling exercise is repeated ten times for each group size. Average TS values are calculated using coherent and incoherent KRM models separately and then compared.

3. Results and Discussion

3.1. Comparison between Incoherent and Coherent TS Predictions of Individual Fish

3.1.1. Small Fish (<60 mm TL)

Incoherent TS predictions of small fish are significantly different from results estimated using the coherent model. Backscattered waves from fish SWB and body interact to strengthen (i.e., constructive) or weaken (i.e., destructive) the resulting wavefront (i.e., interference). As a result, this cross term may be positive or negative, depending on the morphologies of the SWB and FB, as well as their relative locations and orientations. Constructive interference results in a larger TS w f . Destructive interference reduces TS w f to values less than those from the swim bladder ( TS s w b ).
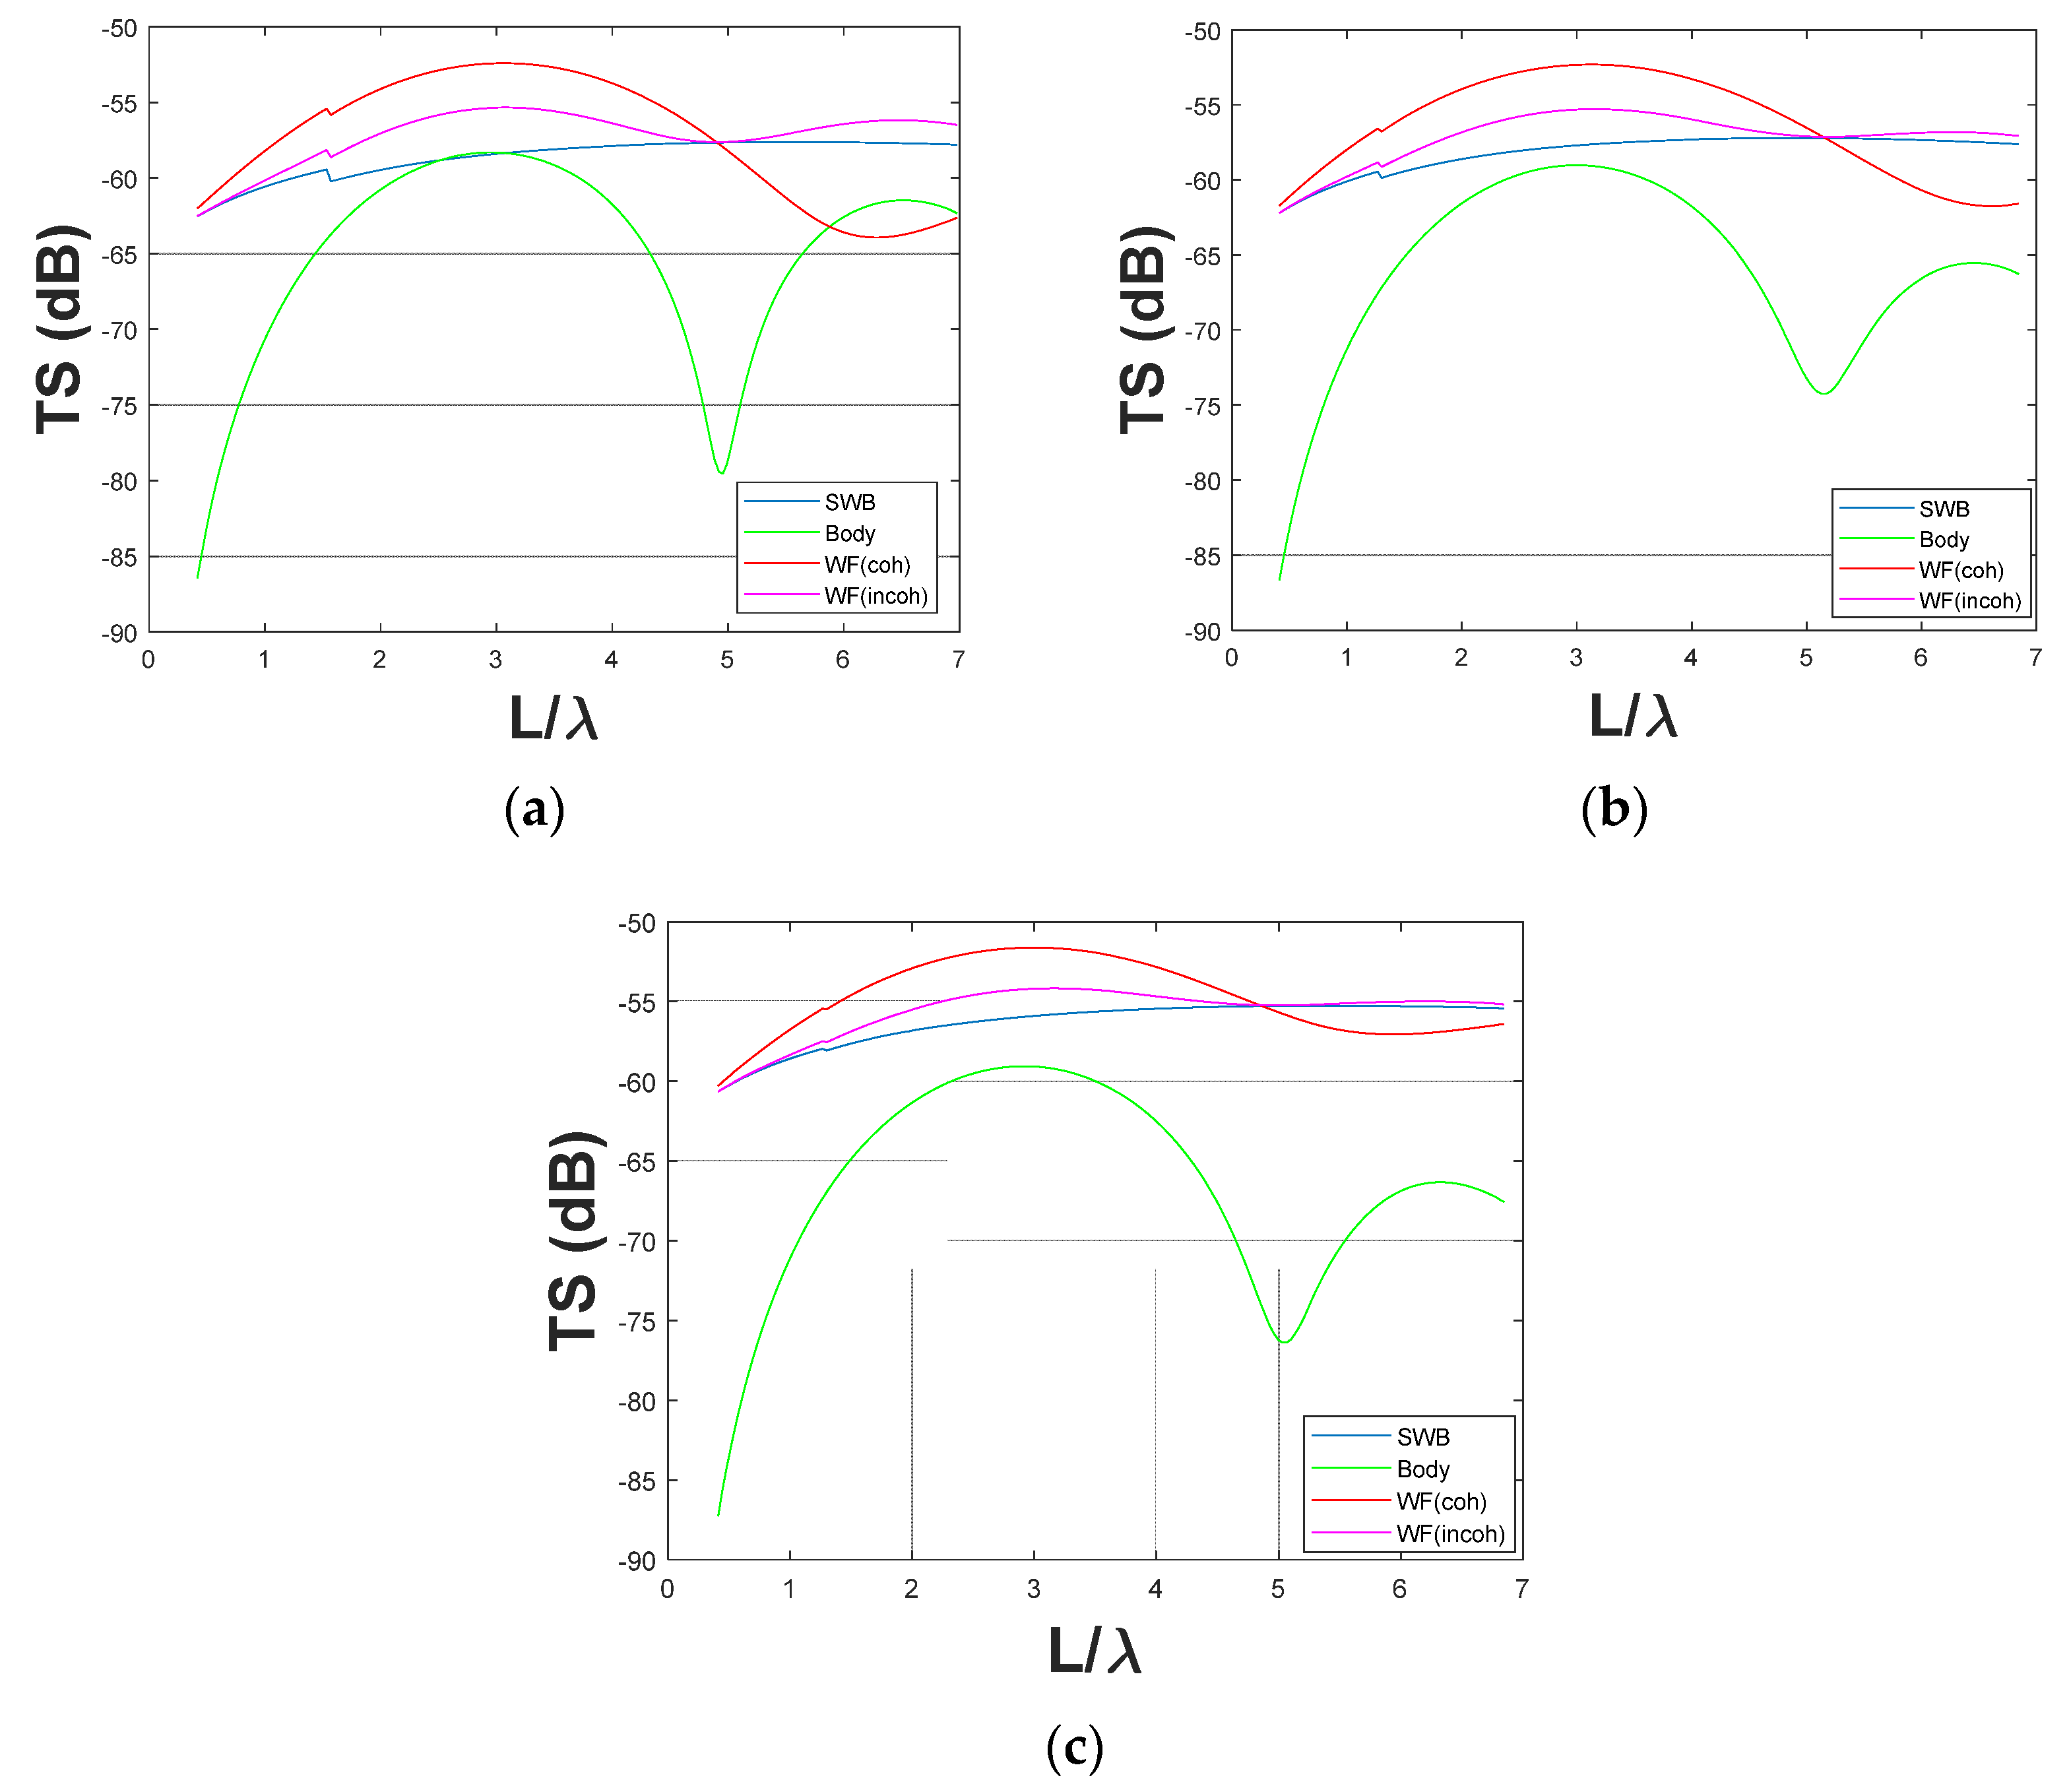
Differences between predictions from the two models (Figure 3) are illustrated using a set of numerical simulations from three 60 mm fish under three different scenarios. In fish ‘a’ at L / λ values from approximately 2.25 to 3.25, backscatter (TS) from the fish body is equivalent to that predicted from the swim-bladder (at a length of 60 mm, this represents a frequency of 75 kHz). Differences in backscatter predictions between the coherent and incoherent models are maximized at L / λ values around 3 and between 5 and 7. For case (b) (Figure 3b) and case (c) (Figure 3c), backscatter from the SWB is larger than that from the fish body over the same frequency range. Comparison of the whole fish backscatter curves for the three cases shows more variability in coherent model curves than those predicted using the incoherent model. This difference is attributed to the inclusion or exclusion of the frequency-dependent and phase-sensitive incoherent term (i.e., the third term in Equation (2)), especially at higher frequencies or ka values. Environmental conditions, such as temperature and pressure, will affect fish SWB shape and sound speeds in a FB and the surrounding water, which further influences the outcome from the cross term. As a result, the scattering length from coherent summation is expected to cause a larger difference and fluctuation. For example, if the velocity of sound in water is 1500 ms−1, the wavelength at 70 kHz is about 0.021 m, which is the same order of magnitude as the lengths of the SWB and FB. The incoherent KRM model, which is insensitive to the SWB and FB interference, is expected to provide less variable backscatter predictions across the range of modeled L/λ. Inspection of Figure 3 TS curves of the three SWBs ( TS s w b , blue) shows that the TS varies ~4–5 dB, but TS amplitudes of the whole fish ( TS w f , red) predicted from the coherent model vary more than 8 dB. When the scattering lengths of L s w b and L f b have the same sign ( L s w b , L f b   > 0 or L s w b ,   L f b < 0), the resultant backscatter interference between the two components will be constructive. This can be easily understood from Equation (1), L w f ( f ) = L s w b ( f ) + L f b ( f ) . For L s w b and L f b having the same sign, we obtain L w f 2 ( f ) > L s w b 2 ( f ) , which leads to a larger TS w f . Using three fish as an example is a small sample size, but it demonstrates that incoherent KRM model backscatter predictions have low variability over length and frequency ranges (see Table 2).

3.1.2. Large Fish (>200 mm)

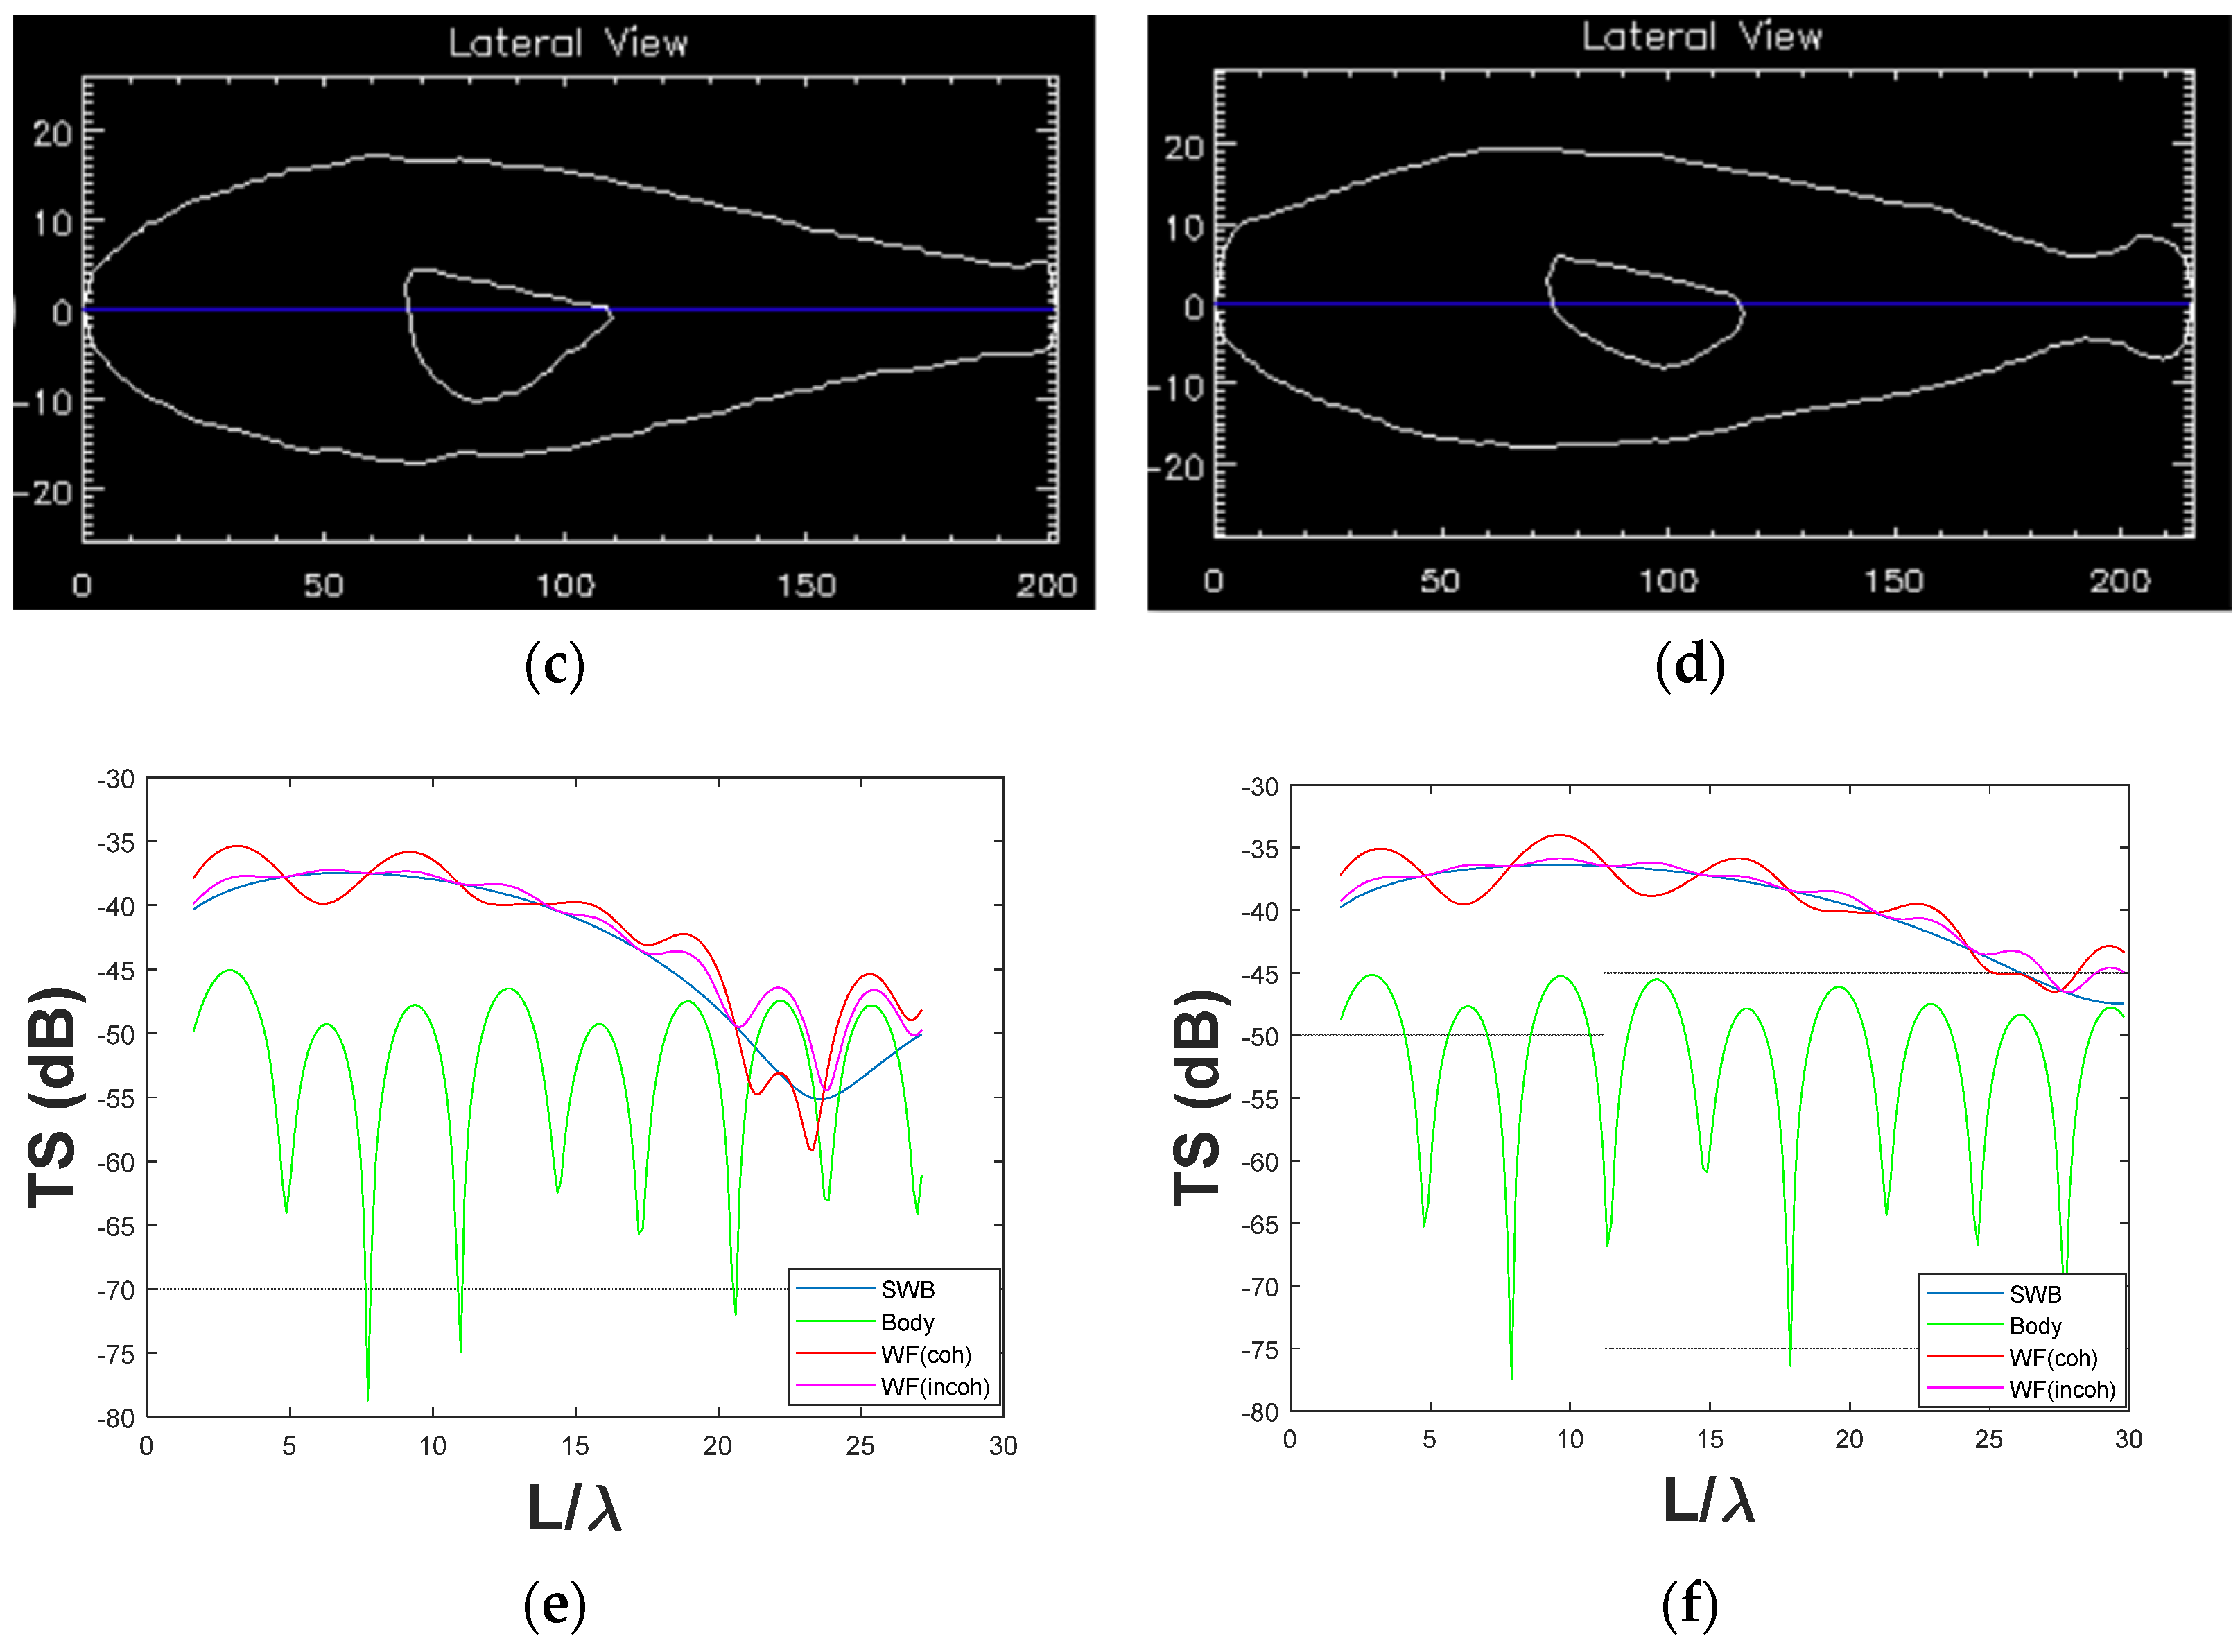
In large fish, most backscattered energy is derived from the SWB. The change in TS is caused by the shape of the SWB. Incoherent TS predictions of large fish show significantly different results from those estimated using the coherent model. At small (<0.15) ka values, scattering from the SWB at rather high frequencies is a function of A s w b and φ s w b (cf. Equation (5)), which are both dependent on ka. k a = 2 π a λ = 2 π e a L L λ , where e a L is the ratio of SWB radius to the total fish length, which is essentially constant for any fish. When ka > 0.15, backscatter estimated from the swim-bladder is calculated using the Kirchhoff integral, Equation (5), and results in a more complicated frequency response. To illustrate this, we calculated the TS frequency responses with an example involving two fish (designated Fish A and B) with similar lengths (~200 mm) and SWB position (Figure 4a–d). The frequency-dependent TS values calculated from the two models are shown in Figure 4e,f. TS values of the whole fish ( TS w f ) using the coherent KRM model have larger backscatter amplitude fluctuations overall and along the curves compared to backscatter predictions from the incoherent model. For orthogonal incidence (e.g., downward-looking echosounder), the frequency response from swim bladders primarily depends on the area and rugosity of the swim-bladder dorsal surface. The dorsal surface area of Fish A’s swim-bladder is larger compared to that of fish B. In this case, backscatter from the two fish bodies is predicted to have essentially the same overall TS (max ~−45dB) and frequency-dependent backscatter patterns. Differences in TS frequency responses are attributed to differences in the relative backscatter contributions from the swim-bladder and the fish body in each fish. For Fish A, the difference between the maximum and minimum TS using the coherent KRM model is 24 dB (Figure 4e), and only 17 dB predicted by the incoherent KRM model (see Table 3). The incoherent backscatter TS curve is much smoother than the coherent predicted backscatter curve. A smoother pattern is observed for Fish B (Figure 4f).

3.2. Comparison between Coherent and Incoherent TS Predictions with a Few Fish

To demonstrate differences in coherent and incoherent model predictions for aggregations of fish, ten fish of similar length (200 ± 10 mm) were used to demonstrate differences between coherent and incoherent KRM model predictions as a function of the number of fish used in calculating backscatter amplitudes for a group. Groups consist of three, five, seven, and ten fish, with members of each group picked randomly from the ten digitized fish and the modeling exercise repeated ten times for each group size. Average TS values are calculated using coherent and incoherent KRM models separately and then compared.
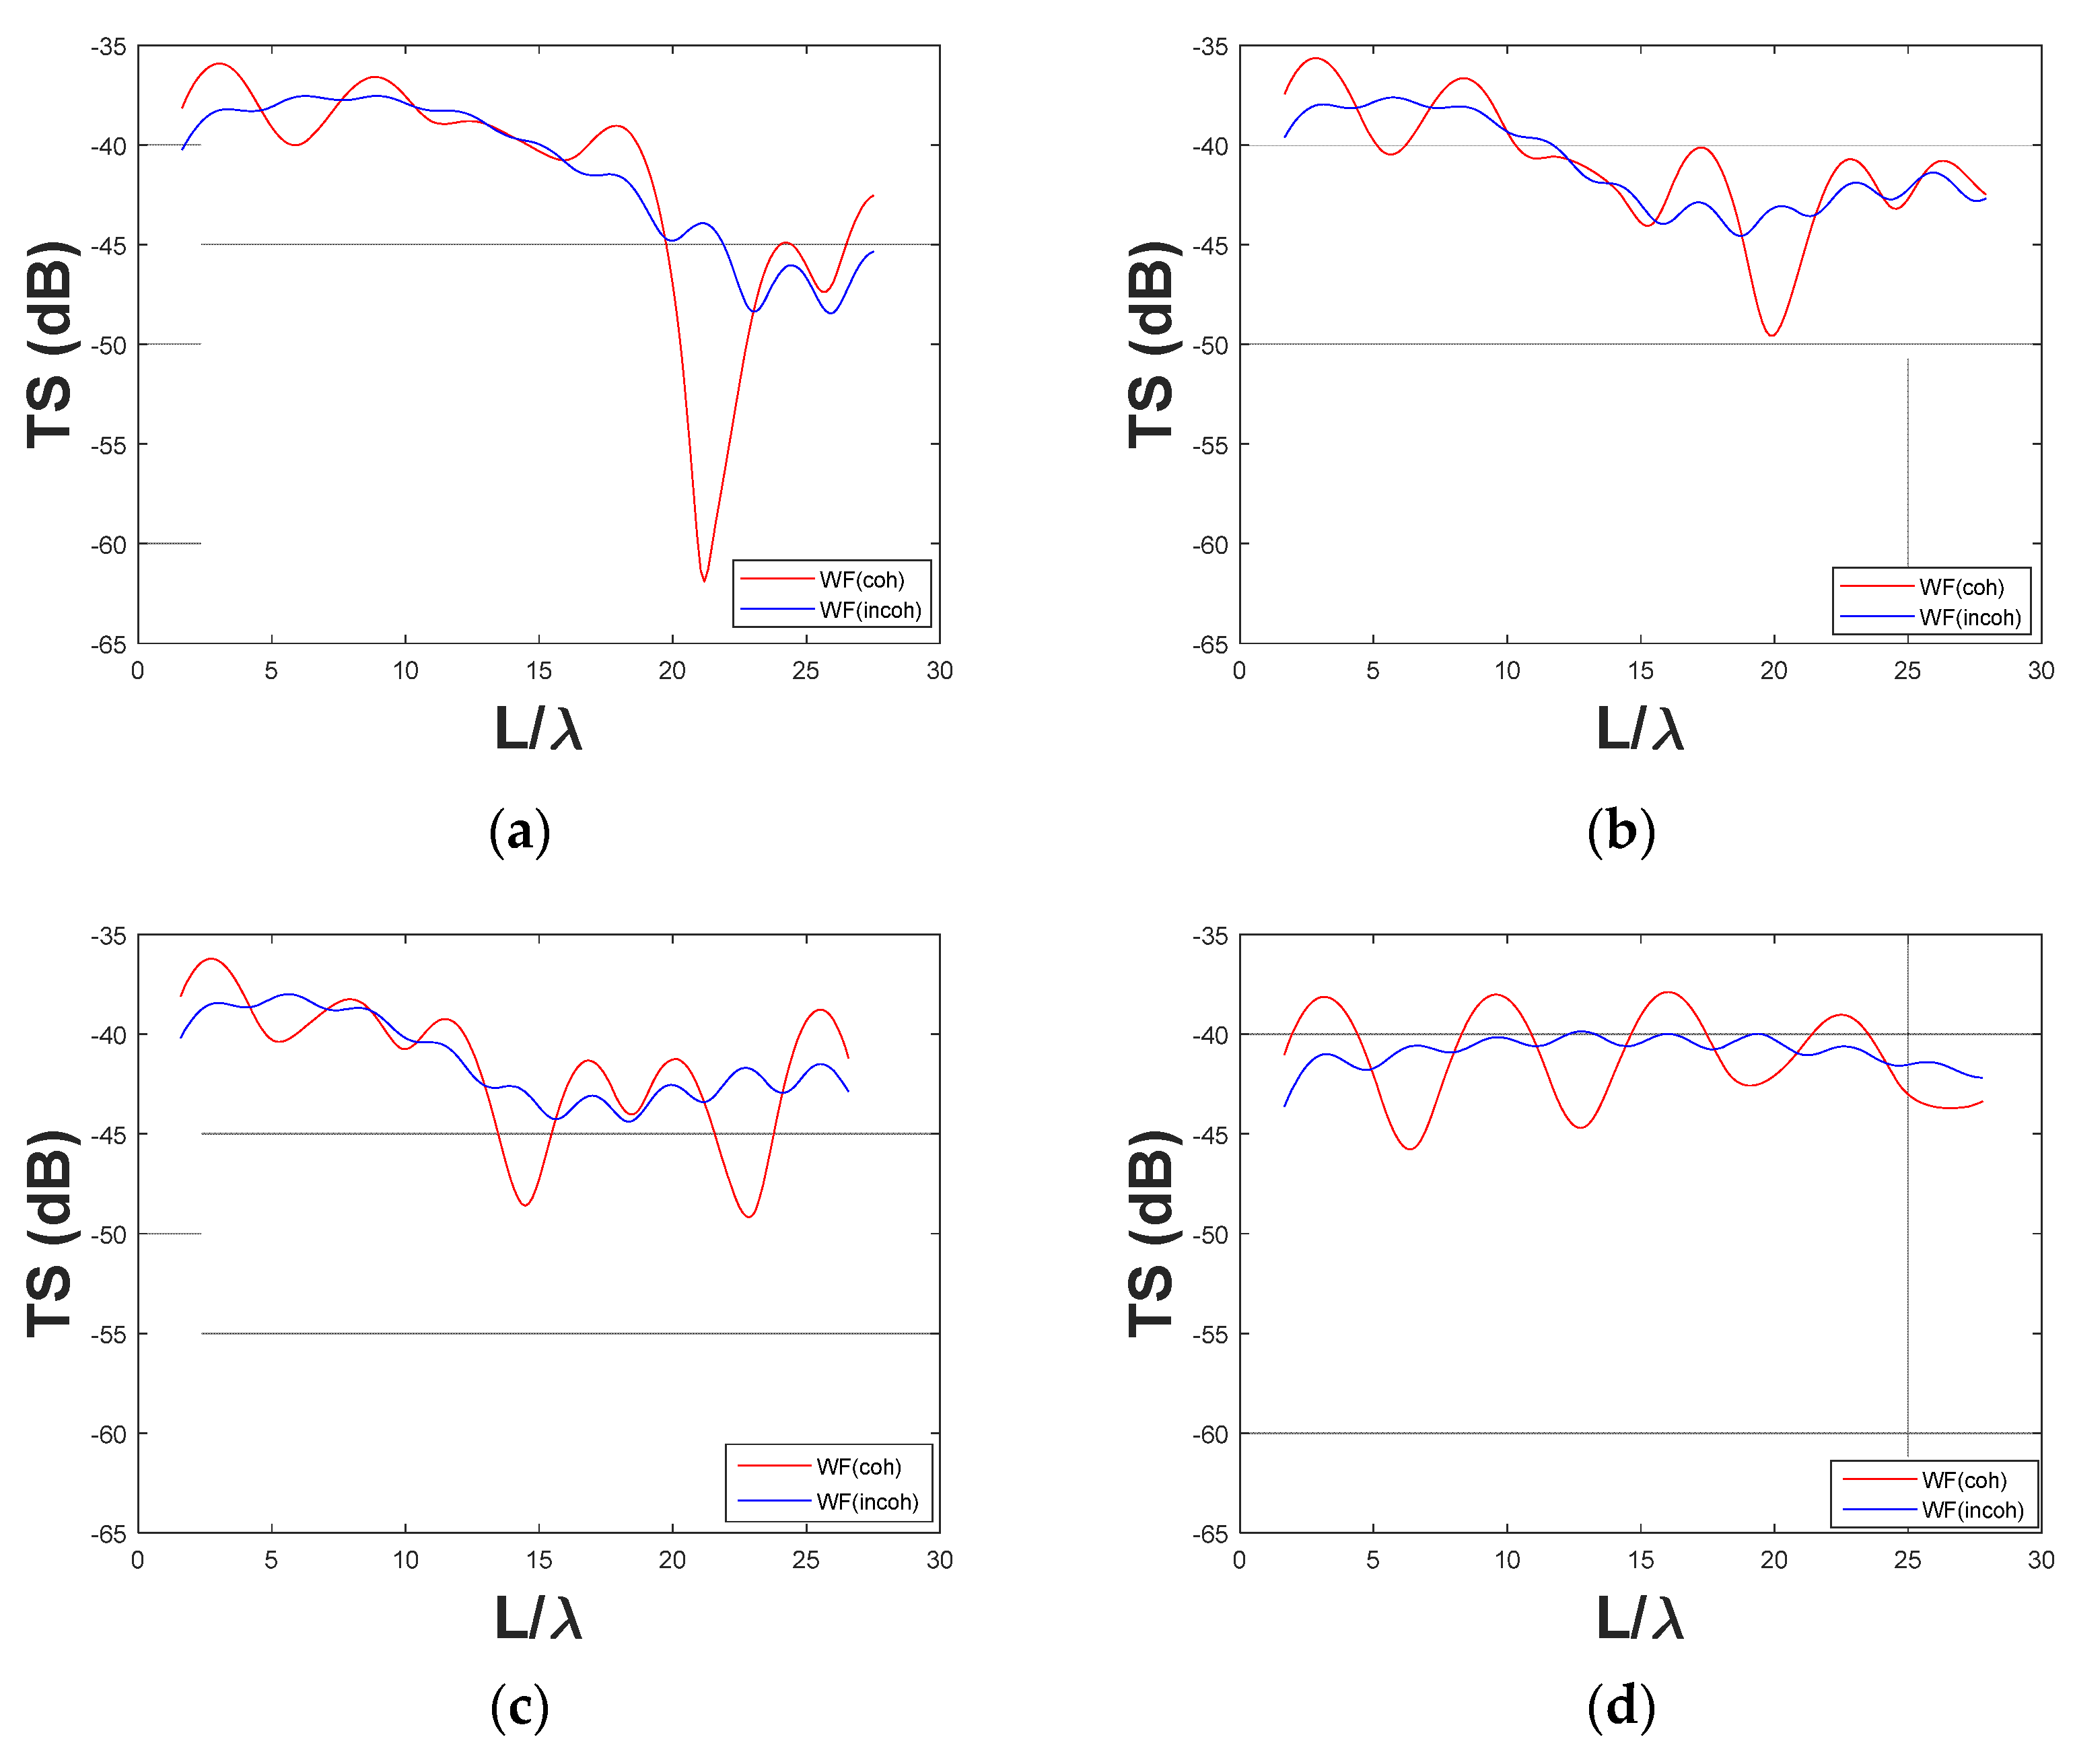
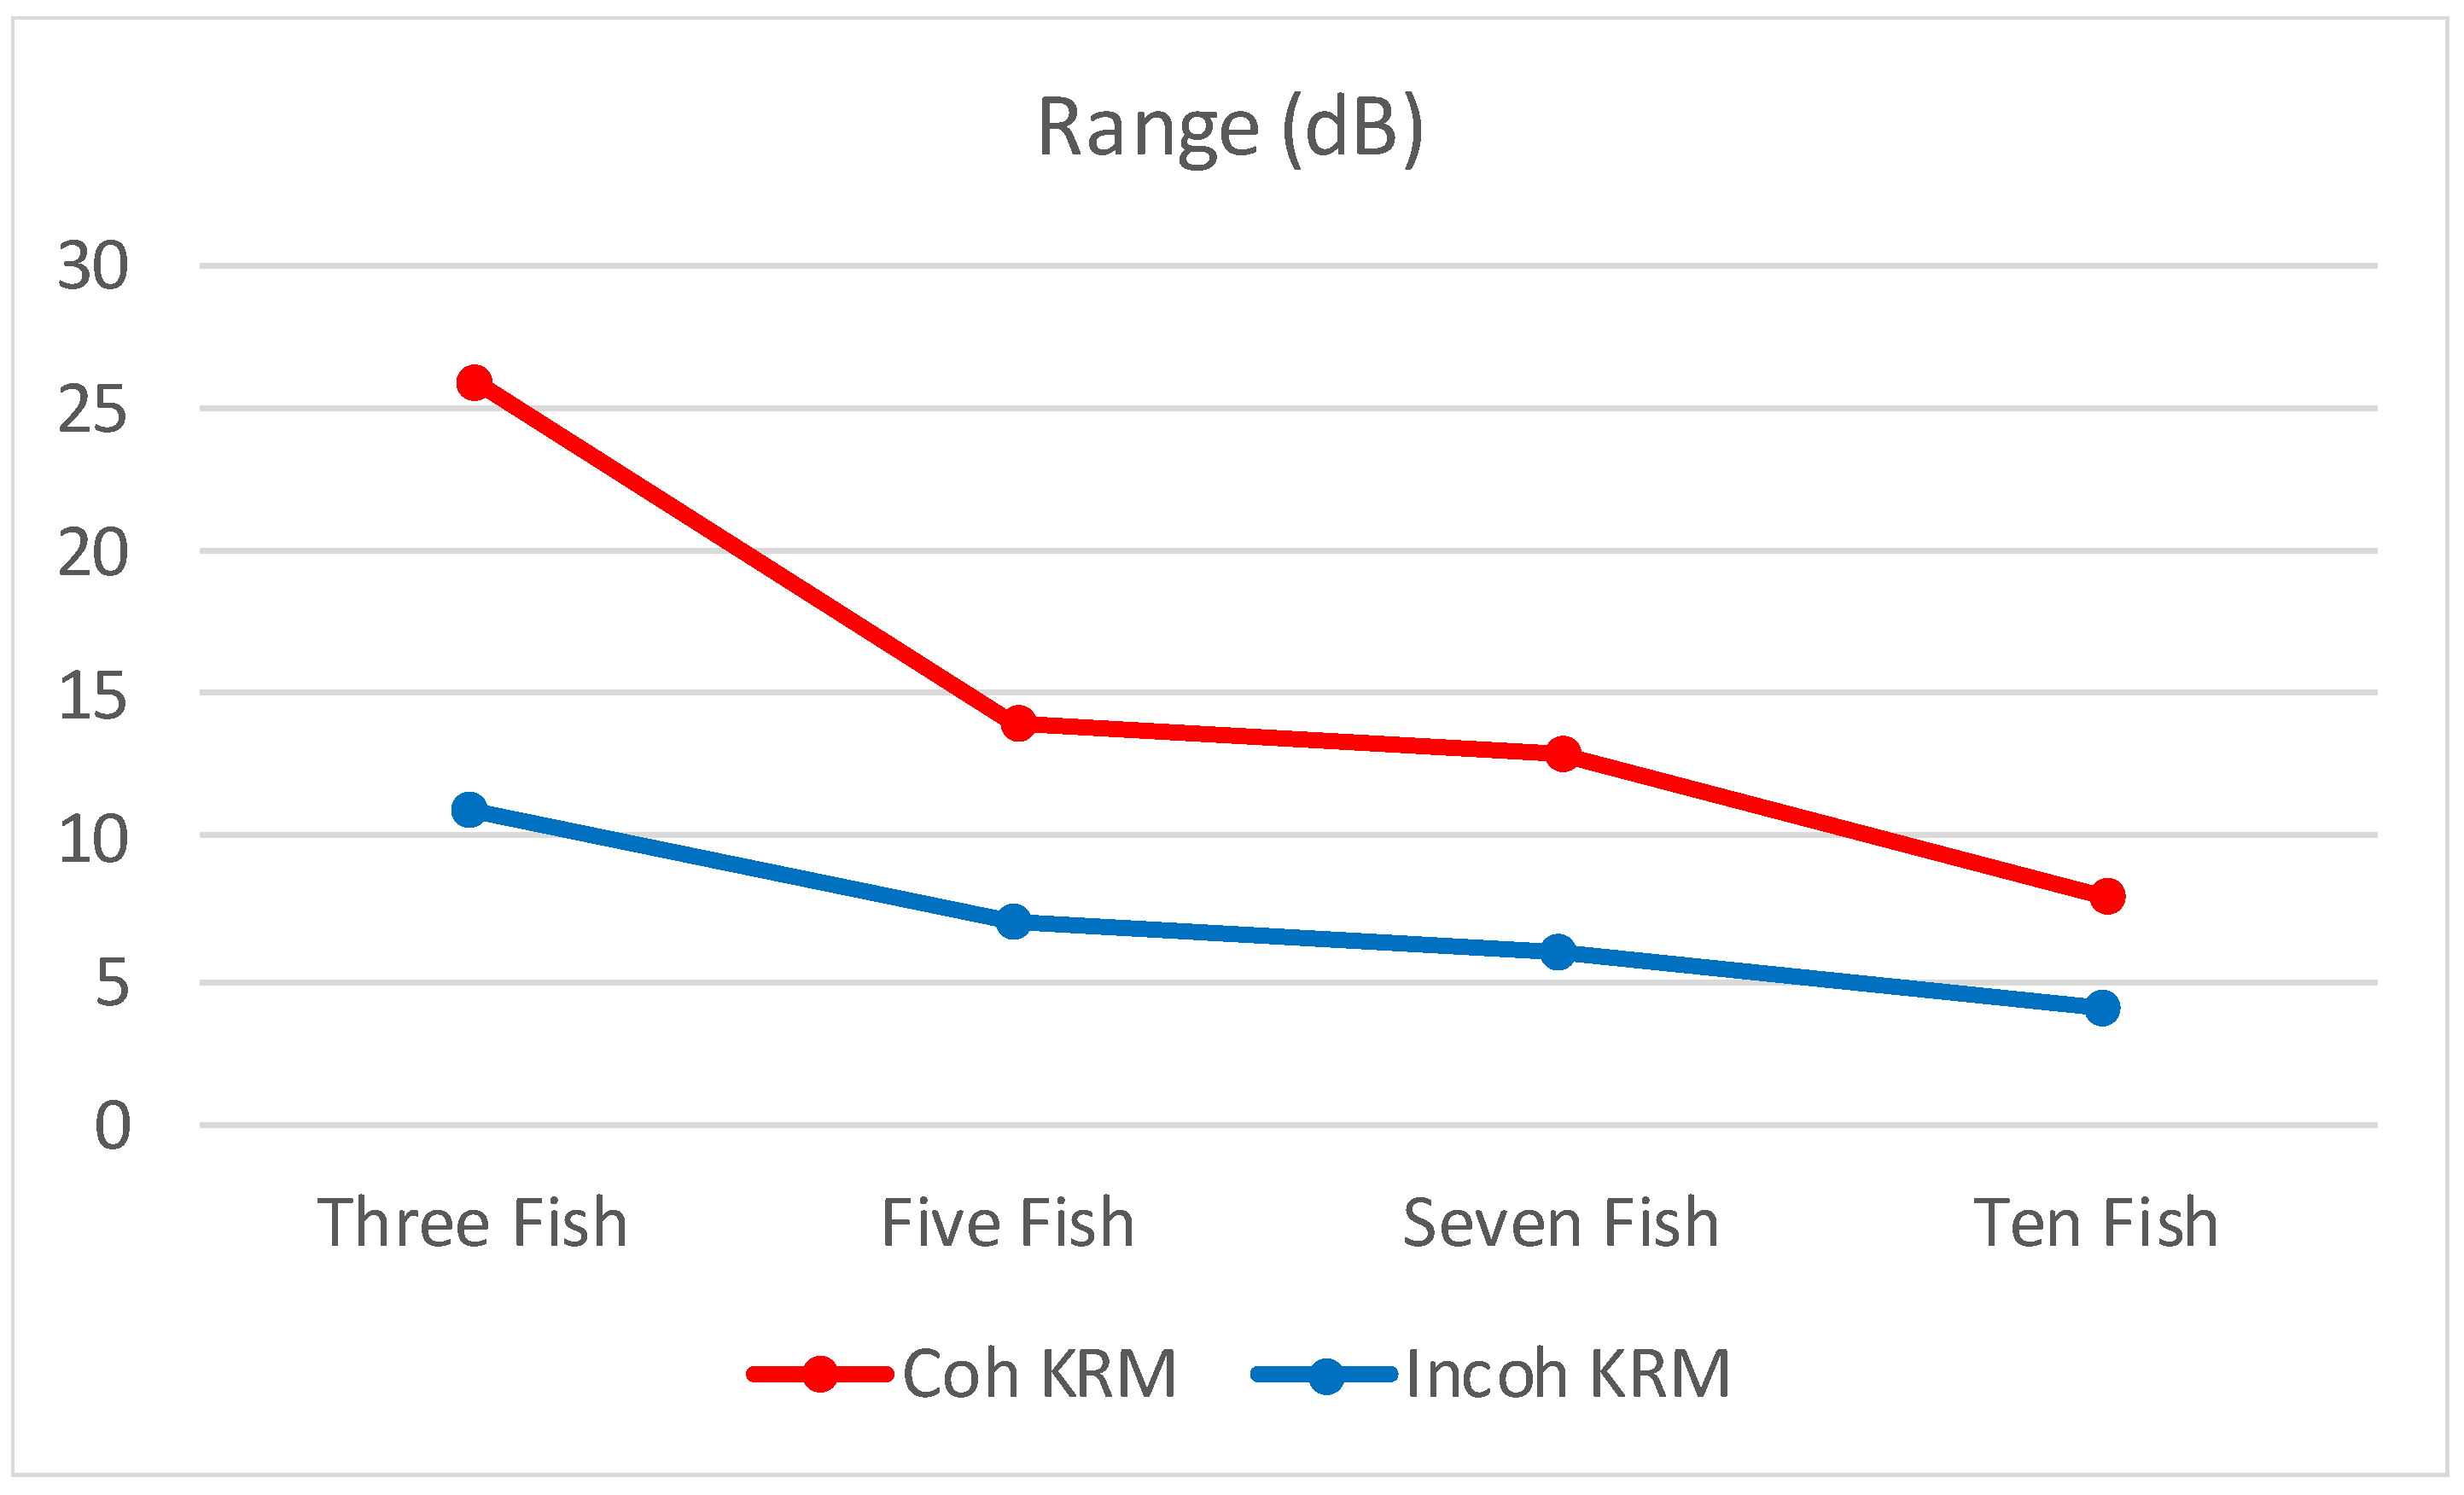
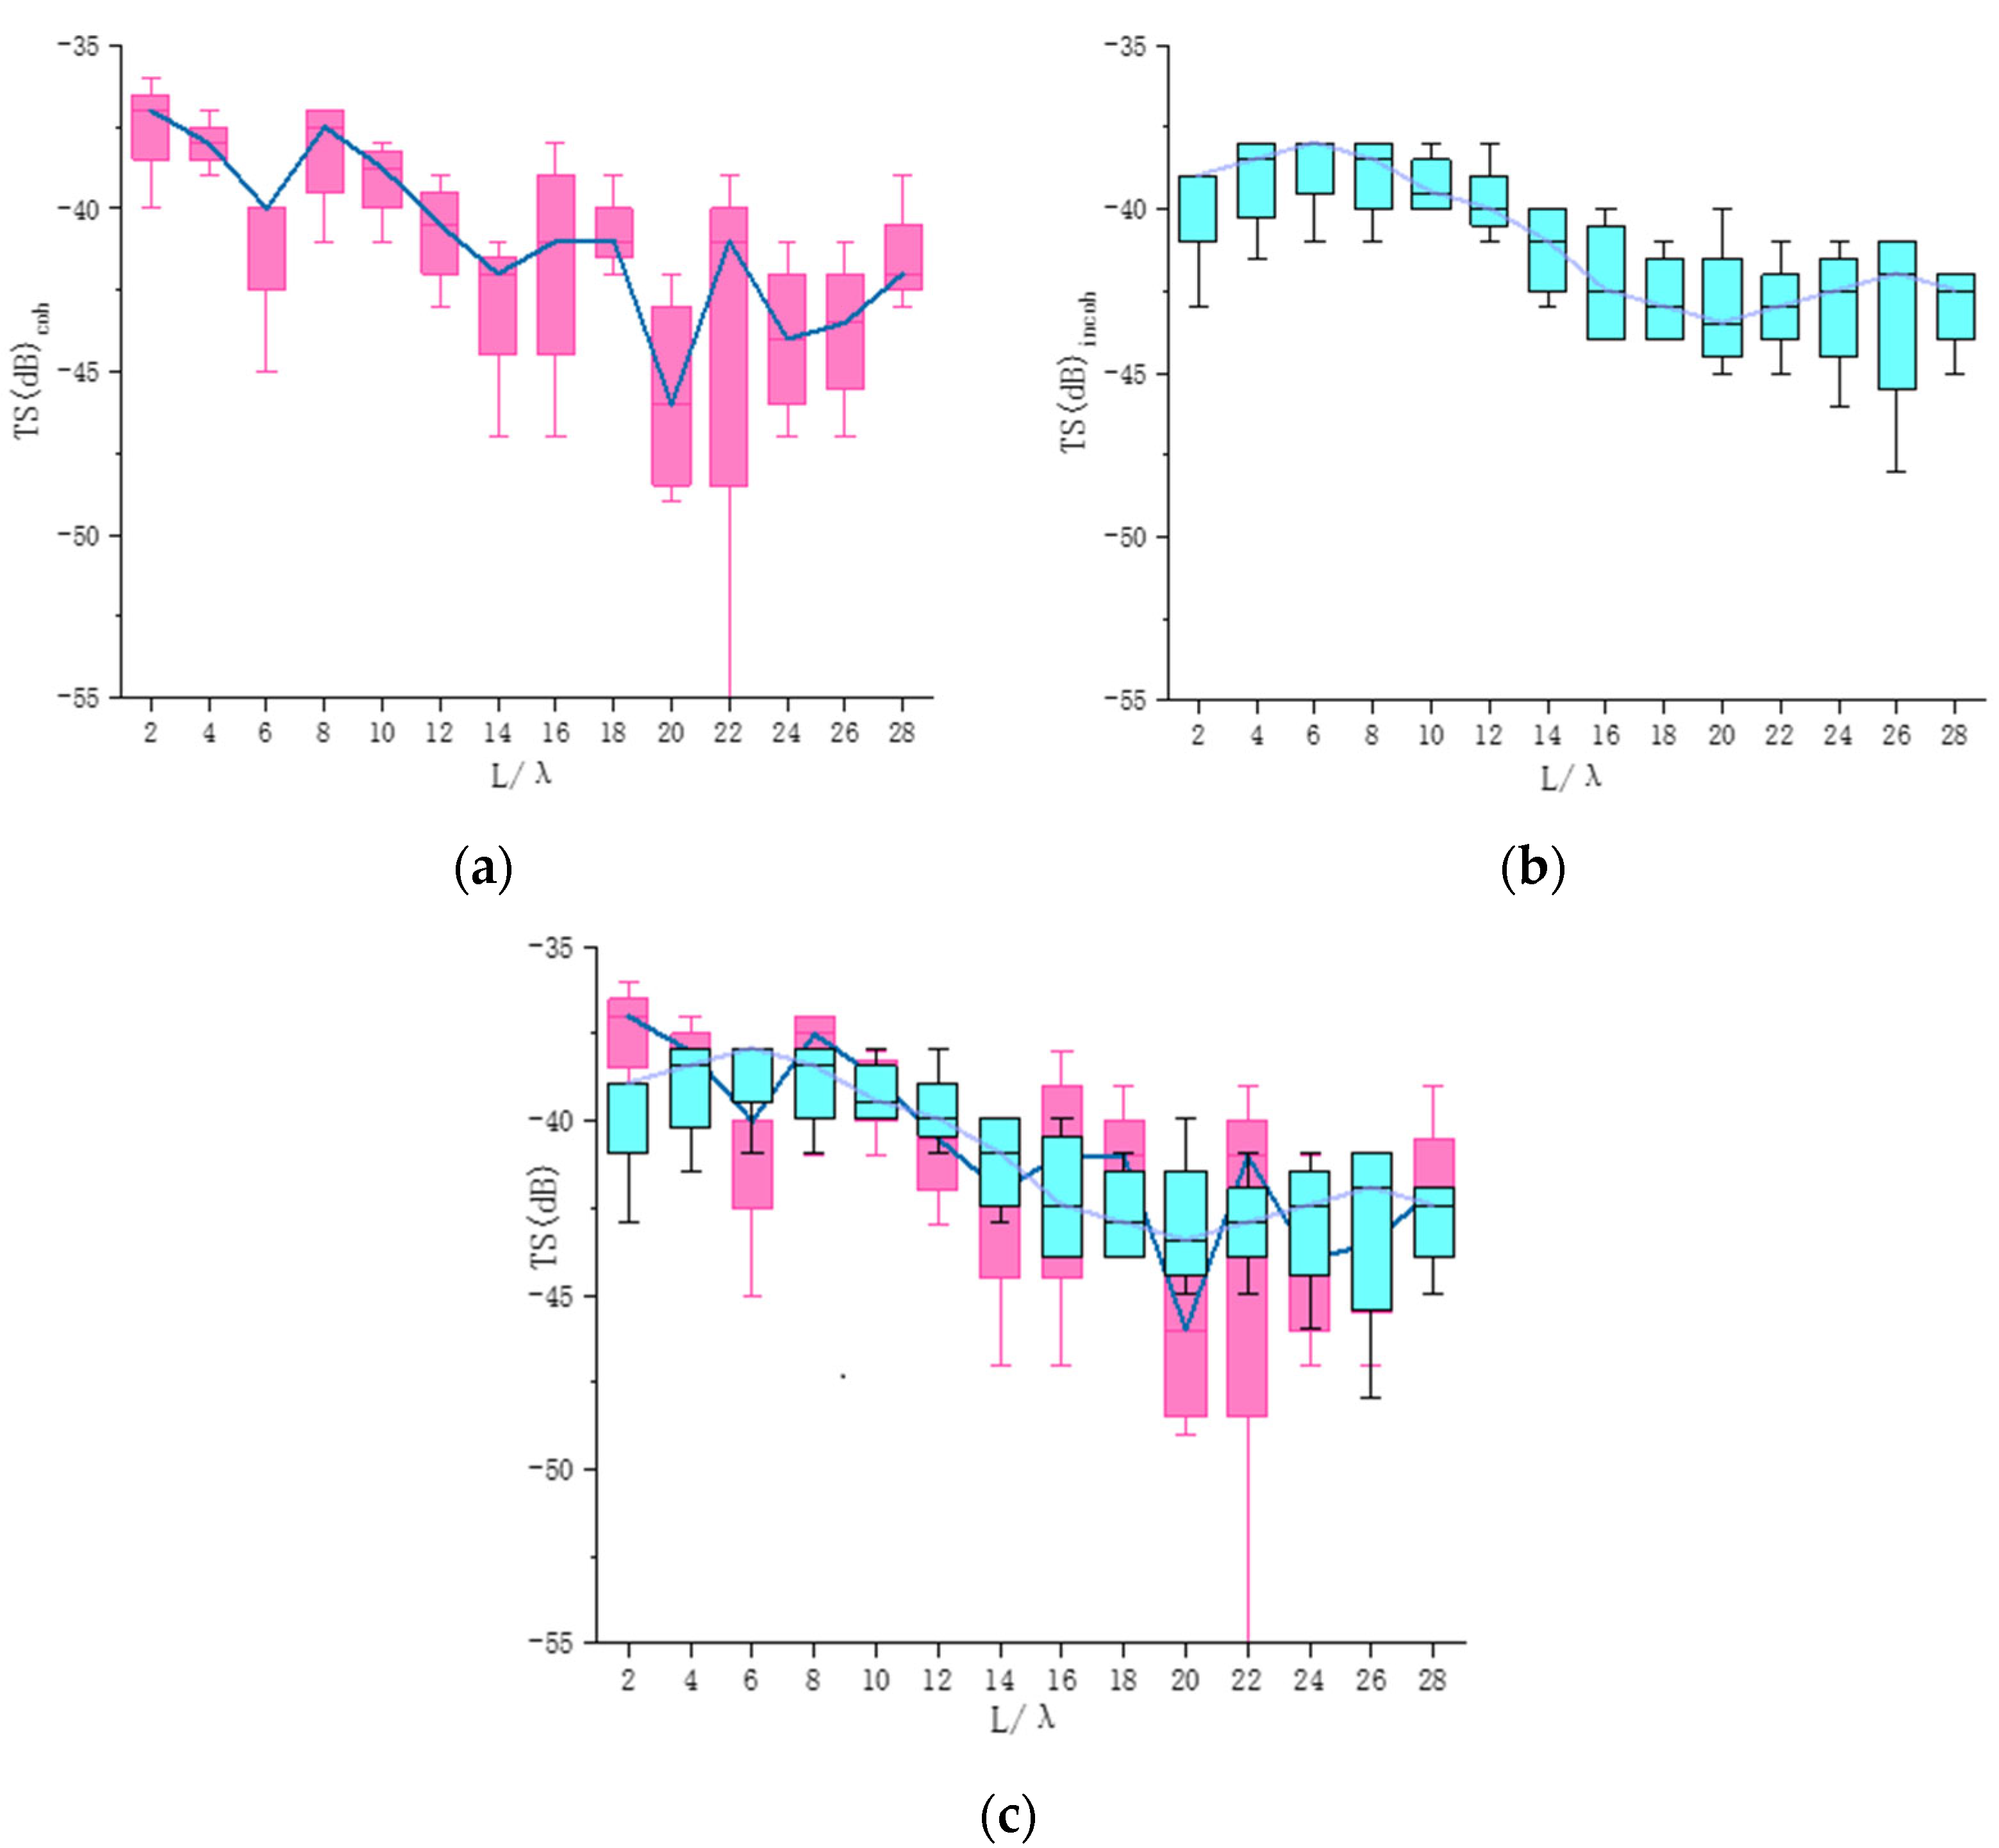
TS curves calculated with the incoherent KRM model always resulted in smoother frequency response curves and smaller amplitude fluctuations, indicating that the incoherent TS predictions are less variable and statistically more robust across the frequency range. As shown in Figure 5, both the amplitude range and the standard deviation decreased as the number of fish in each group increased, whereas mean and median TS values over the entire frequency range remain fairly constant (Table 4). According to the central limit theorem [46], when the sample size increases, the range and standard deviation should decrease (Figure 6 and Figure 7).
For fish aggregations, where the number of fish is very large, the cross term in Equation (2) is expected to approach 0. As a result, average TS curves calculated using coherent and incoherent KRM models are expected to converge. In addition, the incoherent KRM model does not need to compute the cross term, which makes it more computationally efficient, although, given the computational capability of modern computers, this difference is very small.

4. Conclusions

The incoherent KRM model is a revised version of the original KRM model proposed by Clay and Horne [38]. Incoherent KRM model predictions are independent of the relative position and angle of the SWB within the FB. The resulting predicted TS values are less variable compared to coherent KRM predictions, and, hence, less statistically variable. The incoherent KRM model parallels the approach used in the echo-integration technique in that both methods do not include coherent scattering among fish. Average TS values predicted by both models may not differ significantly if many fish are involved. When calculating backscatter from large numbers of fish where anatomical data do not exist, the incoherent KRM model would provide a statistically less variable and computationally efficient method to estimate reflected energy from the aggregation.
Both coherent and incoherent KRM models can be used to estimate fish density. When estimating TS of fish within aggregations, both models are effective. The choice of model formulation is dependent on the objectives. A coherent KRM model may be more appropriate for single fish model and ex situ measurement comparisons if the morphologies of the fish SWB and FB are known. However, the incoherent KRM model may be more appropriate for estimating fish backscatter for large aggregations when the amount of information on fish morphology is limited.

Author Contributions

Conceptualization, D.C. and C.L.; methodology, D.C. and C.L.; software, D.C., J.H. and C.L.; validation, D.C., J.H. and C.L.; formal analysis, D.C. and C.L.; investigation, H.L.; resources, H.L. and C.L.; data curation, J.H.; writing—original draft preparation, C.L.; writing—review and editing, D.C. and J.H.; visualization, D.C. and J.H.; supervision, D.C., J.H. and H.L.; project administration, H.L.; funding acquisition, H.L. All authors have read and agreed to the published version of the manuscript.

Funding

This research was funded by the NFSC-United Fusion Fund of Zhejiang grant number U1809212; also funded by the NFSC-United Fusion Fund of Shandong grant number U1906218 and Heilongjiang Natural Science Fund grant number ZD2020D001.

Institutional Review Board Statement

Not applicable.

Informed Consent Statement

Not applicable.

Data Availability Statement

Data is unavailable due to college regulation.

Acknowledgments

This work was supported, in part, by the NFSC-United Fusion Fund of Zhejiang under Grant U1809212 and supported, in part, by the NFSC-United Fusion Fund of Shandong under Grant U1906218. It was also supported, in part, by the Heilongjiang Natural Science Fund under Grant ZD2020D001.

Conflicts of Interest

The authors declare no conflict of interest.

References

  1. MacLennan, D.N.; Simmonds, E.J. Fisheries Acoustics; Chapman & Hall: London, UK, 1992. [Google Scholar]
  2. MacLennan, D.N. Acoustical measurement of fish abundance. J. Acoust. Soc. Am. 1990, 87, 1–15. [Google Scholar] [CrossRef]
  3. Nakken, O.; Olsen, K. Target strength measurements of fish. Rapp. Proces-Verbaux Reun. Cons. Int. Pour L`Explor. Mer. 1977, 170, 52–69. [Google Scholar]
  4. Traynor, J.J. Target-strength measurements of walleye pollock (Theragra rhnkoprnrna) and Pacific whiting (Merlctccicts productus). ICES J. Mar. Sci. 1996, 53, 253–258. [Google Scholar] [CrossRef] [Green Version]
  5. Foote, K.G.; Traynor, J.J. Comparison of walleye pollock target strength estimates determined from in situ measurements and calculations based on swimbladder form. J. Acoust. Soc. Am. 1988, 83, 9–17. [Google Scholar] [CrossRef] [Green Version]
  6. Bertrand, A.; Josse, E.; Masse, J. In situ acoustic target strength measurement of bigeye (Thunnus obesus) and yellowfin tuna (Thunnus albacares) by coupling split-beam echosounder observations and sonic tracking. ICES J. Mar. Sci. 1999, 56, 51–60. [Google Scholar] [CrossRef]
  7. Sawada, K.; Ye, Z.; Kieser, R.; McFarlane, G.A.; Miyanohana, Y.; Furusawa, M. Target strength measurements and modelling of walleye pollock and Pacific hake. Fish. Sci. 1999, 65, 193–205. [Google Scholar] [CrossRef] [Green Version]
  8. Kang, D.; Hwang, D. Ex situ target strength of rockfish (Sebastes schlegeli) and red sea bream (Pagrus major) in the Northwest Pacific. ICES J. Mar. Sci. 2003, 60, 538–543. [Google Scholar] [CrossRef] [Green Version]
  9. Kang, D.; Hwang, D.; Na, J.; Kim, S. Target strength of red seabream (Pagrus major). In Proceedings of the International Symposium on Advanced Techniques of Sampling Gear and Acoustic Survey for Estimation of Fish Abundance and Behaviour (ACOUSTGEAR2000), Hakodate, Japan, 20–21 October 2000; Volume 1, pp. 17–24. [Google Scholar]
  10. Kang, D.; Sadayasu, K.; Mukai, T.; Iida, K.; Hwang, D.; Sawada, K.; Miyashita, K. Target strength estimation of black porgy Acanthopagrus schlegeli using acoustic measurements and a scattering model. Fish. Sci. 2004, 70, 819–828. [Google Scholar] [CrossRef]
  11. Reeder, D.B.; Stanton, T.K. Acoustic scattering by axisymmetric finite-length bodies: An extension of a two-dimensional conformal mapping method. J. Acoust. Soc. Am. 2004, 116, 729–746. [Google Scholar] [CrossRef]
  12. Henderson, M.J.; Horne, J.K. Comparison of in situ, situ, and backscatter model estimates of Pacific hake (Merluccius productus) target strength. Can. J. Fish. Aquat. Sci. 2007, 64, 1781–1794. [Google Scholar] [CrossRef] [Green Version]
  13. Nero, R.W.; Thompson, C.H.; Love, R.H. Low-frequency acoustic measurements of Pacific hake, Merluccius productus, off the west coast of the United States. Fish. Bull. 1998, 96, 329–343. [Google Scholar]
  14. Gauthier, S.; Horne, J.K. Acoustic characteristics of forage fish species in the Gulf of Alaska and Bering Sea based on Kirchhoff-approximation models. Can. J. Fish. Aquat. Sci. 2004, 61, 1839–1850. [Google Scholar] [CrossRef]
  15. Pena, H.; Foote, K.G. Modelling the target strength of Trachurus symmetricus murphyi based on high-resolution swimbladder morphometry using an MRI scanner. ICES J. Mar. Sci. 2008, 65, 1751–1761. [Google Scholar] [CrossRef]
  16. Jech, J.M.; Horne, J.K.; Chu, D.; Demer, D.A.; Francis, D.T.; Gorska, N.; Jones, B.; Lavery, A.C.; Stanton, T.K.; Macaulay, G.J.; et al. Comparisons among ten models of acoustic backscattering used in aquatic ecosystem research. J. Acoust. Soc. Am. 2015, 138, 3742–3764. [Google Scholar] [CrossRef] [Green Version]
  17. Love, R.H. Dorsal-aspect target strength of an individual fish. J. Acoust. Sci. Am. 1971, 49, 816–823. [Google Scholar] [CrossRef]
  18. Love, R.H. Resonant acoustic scattering by swimbladder-bearing fish. J. Acoust. Soc. Am. 1978, 64, 571–580. [Google Scholar] [CrossRef]
  19. Clay, C.S. Low-resolution acoustic scattering models: Fluid-filled cylinders and fish with swim bladders. J. Acoust. Soc. Am. 1991, 89, 2168–2179. [Google Scholar] [CrossRef]
  20. Clay, C.S. Composite ray-mode approximations for backscattered sound from gas-filled cylinders and swimbladders. J. Acoust. Soc. Am. 1992, 92, 2173–2180. [Google Scholar] [CrossRef]
  21. Gorska, N.; One, E. Modelling the effect of swimbladder compression on the acoustic backscattering from herring at normal or near-normal incidences. ICES J. Mar. Sci. 2003, 60, 1381–1391. [Google Scholar] [CrossRef]
  22. Love, R.H. Target strength of an individual fish at any aspect. J. Acoust. Soc. Am. 1977, 62, 1397–1403. [Google Scholar] [CrossRef]
  23. Foote, K.G. Effect of fish behaviour on echo energy: The need for measurements of orientation distributions. J. Cons. Int. Explor. Mer. 1980, 39, 193–201. [Google Scholar] [CrossRef]
  24. Foote, K.G. Rather-high-frequency sound scattering by swimbladdered fish. J. Acoust. Soc. Am. 1985, 78, 688–700. [Google Scholar] [CrossRef]
  25. Francis, D.T.I.; Foote, K.G. Depth-dependent target strength of gadoids by the boundary-element method. J. Acoust. Soc. Am. 2003, 114, 3136–3146. [Google Scholar] [CrossRef] [PubMed] [Green Version]
  26. Ona, E. Physiological factors causing natural variations in acoustic target strength of fish. J. Mar. Biol. Assoc. 1990, 70, 107–127. [Google Scholar] [CrossRef]
  27. Horne, J.K. The influence of ontogeny, physiology, and behaviour on the target strength of walleye pollock (Theragra chalcogramma). ICES J. Mar. Sci. 2003, 60, 1063–1074. [Google Scholar] [CrossRef] [Green Version]
  28. Foote, K.G. Importance of the swimbladder in acoustic scattering by fish: A comparison of gadoid and mackerel target strengths. J. Acoust. Soc. Am. 1980, 67, 2084–2089. [Google Scholar] [CrossRef] [Green Version]
  29. Anderson, V.C. Sound Scattering from a Fluid Sphere. J. Acoust. Soc. Am. 1950, 22, 426–433. [Google Scholar] [CrossRef]
  30. Strasberg, M. The Pulsation Frequency of Nonspherical Gas Bubbles in Liquids. J. Acoust. Soc. Am. 1953, 25, 536–537. [Google Scholar] [CrossRef]
  31. Venkatarama, K. Probability and Random Processes; John Wiley & Sons, Inc.: Hoboken, NJ, USA, 2006; p. 259. [Google Scholar]
  32. Yeh, C. Scattering of Acoustic Waves by a Penetrable Prolate Spheroid. I. Liquid Prolate Spheroid. J. Acoust. Soc. Am. 1967, 42, 518–521. [Google Scholar] [CrossRef]
  33. Ye, Z. Acoustic scatter by prolate spheroidal fish swimbladders. J. Acoust. Soc. Am. 1995, 99, 785–792. [Google Scholar] [CrossRef]
  34. Furuswa, M.; Miyanohana, Y.; Ariji, M.; Sawada, Y. Prediction of Krill Target Strength by Liquid Prolate Spheroid Model. Fish. Sci. 1994, 60, 261–265. [Google Scholar] [CrossRef] [Green Version]
  35. Stanton, T.K. Sound scattering by cylinders of finite length. I. Fluid_cylinders. J. Acoust. Soc. Am. 1987, 83, 55–63. [Google Scholar] [CrossRef]
  36. Stanton, T.K. Sound scattering by cylinders of finite length. II. Elastic cylinders. J. Acoust. Soc. Am. 1987, 83, 64–67. [Google Scholar] [CrossRef]
  37. Stanton, T.K. Sound scattering by cylinder of finite length. III. Deformed cylinders. J. Acoust. Soc. Am. 1989, 86, 691–705. [Google Scholar] [CrossRef]
  38. Clay, C.S.; Horne, J.K. Acoustic models of fish The Atlantic cod (Gadus morhua). J. Acoust. Soc. Am. 1994, 96, 1661–1668. [Google Scholar] [CrossRef]
  39. Foote, K.G.; Francis, D.T.I. Comparing Kirchhoff-approximation and boundary-element models for computing gadoid target strengths. J. Acoust. Soc. Am. 2002, 111, 1644–1654. [Google Scholar] [CrossRef] [Green Version]
  40. Reeder, D.B.; Jech, J.M.; Stanton, T.K. Broadband acoustic backscatter and high-resolution morphology of fish: Measurement and modeling. J. Acoust. Soc. Am. 2004, 116, 747–761. [Google Scholar] [CrossRef] [Green Version]
  41. Horne, J.K.; Sawada, K.; Abe, K.; Kreisberg, R.B.; Barbee, D.H.; Sadayasu, K. Swimbladders under pressure: Anatomical and acoustic responses by walleye pollock. ICES J. Mar. Sci. 2009, 66, 1162–1168. [Google Scholar] [CrossRef] [Green Version]
  42. Grimmett, G.R.; Stirzaker, D.R. Probability and Random Processes, 2nd ed.; Clarendon Press: Oxford, UK, 1992; ISBN 0-19-853665-8. [Google Scholar]
  43. Medwin, H.; Clay, C.S. Fundamentals of Acoustical Oceanography (Applications of Modern Acoustics); Academic Press: New York, NY, USA, 1998. [Google Scholar]
  44. Foote, K.G. Linearity of fisheries acoustics, with addition theorems. J. Acoust. Soc. Am. 1983, 73, 1932–1940. [Google Scholar] [CrossRef]
  45. Simmonds, J.; MacLennan, D.N. Fisheries Acoustics: Theory and Practice; John Wiley & Sons: Hoboken, NJ, USA, 2005; 473p. [Google Scholar]
  46. Fischer, H. A History of the Central Limit Theorem; Springer: New York, NY, USA, 2010. [Google Scholar]
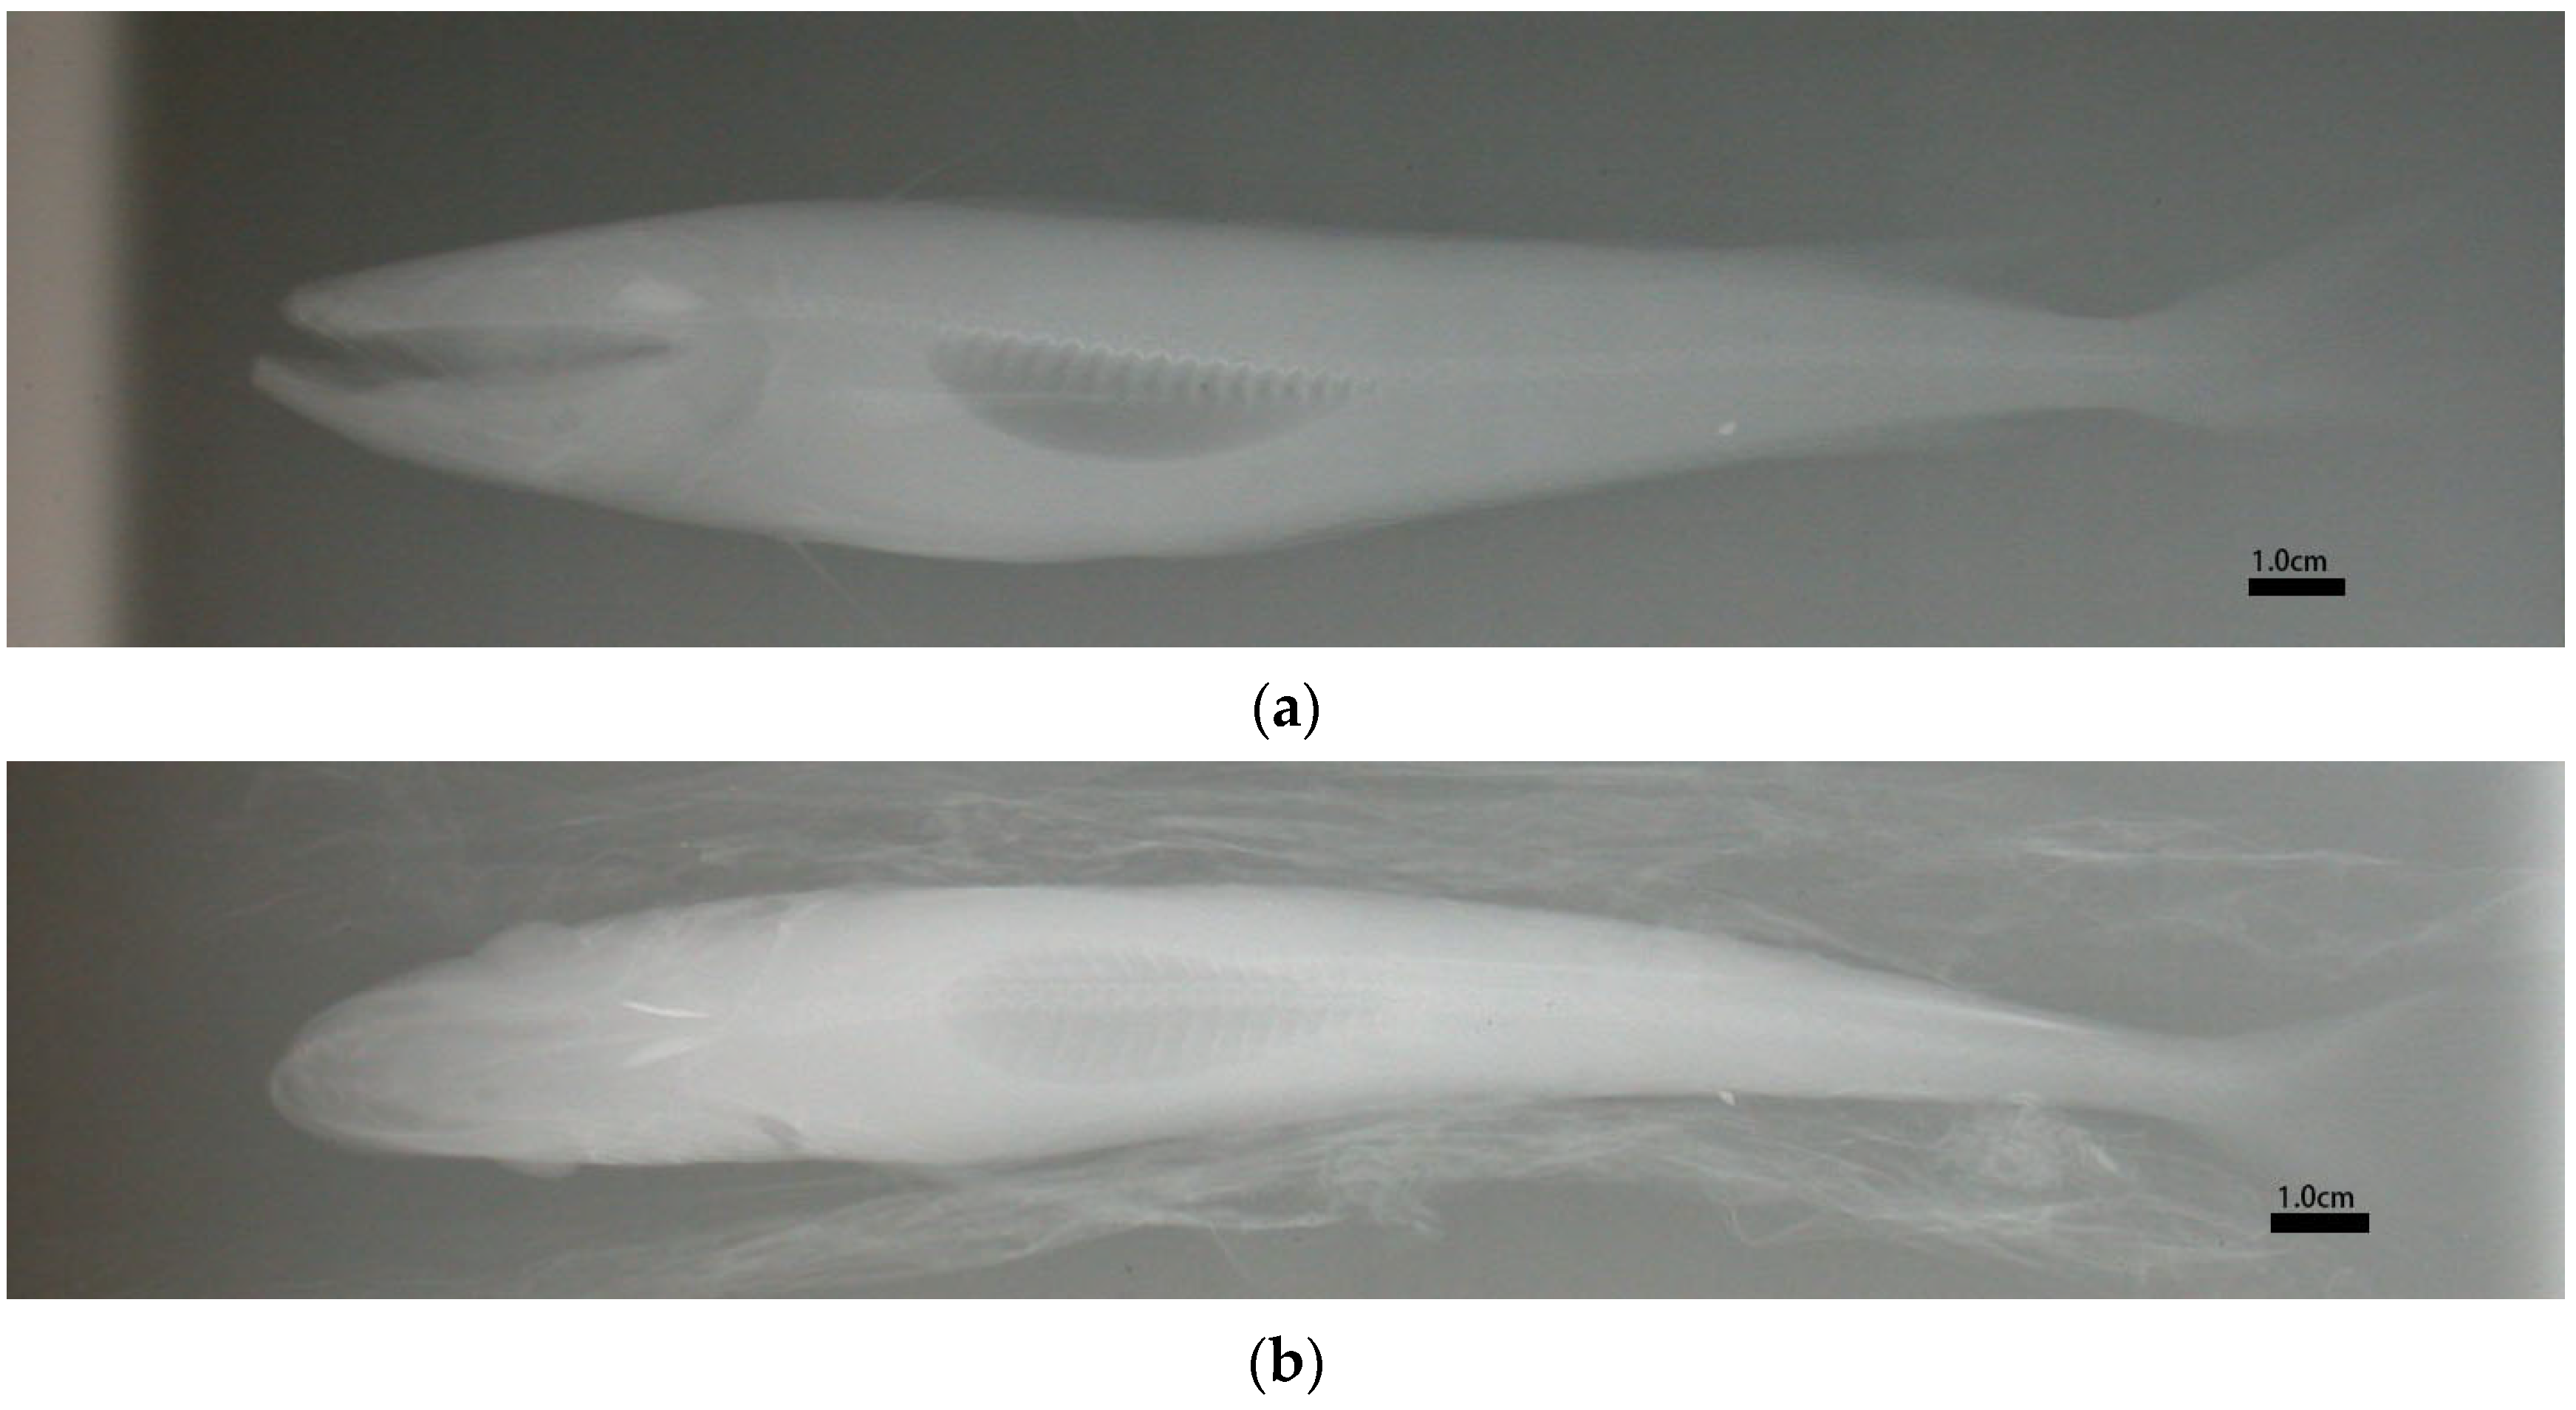
Figure 1. Representative X-ray images of Pacific hake: (a) lateral view; (b) dorsal view. Darker area within fish body represents the swim-bladder.
Jmse 11 00473 g001
Figure 2. Coordinate rotation from x-y plane to u-v coordinates (left) and a lateral view of a digitized fish image (fish body and SWB).
Jmse 11 00473 g002
Figure 3. TS backscatter curves for three individual (fish (ac)) Pacific hake (Merluccius productus) with standard lengths of 60 mm. In each plot, backscatter contributions from the swim bladder (SWB), fish body (FB), and whole fish (WF) are plotted and summed in the coherent (red) and incoherent (magenta) KRM models.
Jmse 11 00473 g003
Figure 4. Digital images and predicted backscatter curves of two 200 mm-length Pacific hake (Merluccius productus). (a,b) are the dorsal view of the two fish digital images; (c,d) are the lateral view; (e,f) are their TS curves as a function of frequency using coherent KRM model (red) and incoherent KRM model (magenta).
Jmse 11 00473 g004aJmse 11 00473 g004b
Figure 5. Comparison of TS frequency response for four groups of 200 mm Pacific hake using the coherent KRM model (red) and incoherent KRM model (blue). (a) Three fish; (b) five fish; (c) seven fish; (d) ten fish.
Jmse 11 00473 g005
Figure 6. Comparison of ranges of TS from multiple fish using coherent and incoherent Kirchhoff-ray-mode backscatter models.
Jmse 11 00473 g006
Figure 7. Box and whisker plots of (a) coherent and (b) incoherent Kirchhoff-ray-mode (KRM) predicted target strengths (TS) from ten fish of 200 mm length. (c) Comparison of the two plots. Median values plotted across the fish length to acoustic wavelength ratio (L/λ) match predictions from the incoherent KRM model.
Jmse 11 00473 g007
Table 1. Fish lengths (FL) and SWB length (SWB L) of ten Pacific hake (Merluccius productus) used in simulations.
FL (mm)SWB L (mm)
119128
219842
320038
419835
520243
620843
720546
820342
920541
1021042
Mean20240
Std5.254.90
Table 2. Differences between coherent and incoherent KRM model predictions for three Pacific hake (Merluccius productus). All the mean TSs are average over entire simulated frequency domain.
Fish A (TSSWB ≈ TSfb)Fish B (TSSWB > TSfb) (Little Larger)Fish C (TSSWB > TSfb)
(Much Larger)
KRM (coh)KRM (inc)KRM (coh)KRM (inc)KRM (coh)KRM (inc)
TSfb (dB)<−58><−59><−59>
TSSWB (dB)<−58><−58><−55>
TSmax (dB)−53−55−53−55−52−54
TSmin (dB)−64−58−62−58−60−60
Span (dB)1139386
Table 3. Differences in predicted target strengths (dB) predicted using a coherent and incoherent KRM model.
Fish AFish B
Coherent KRMIncoherent KRMCoherent KRMIncoherent KRM
TS max (dB)−35−37−34−36
TS min (dB)−59−54−46−46
Range (dB)24171210
mean (dB)−42−42−39−39
median (dB)−40−40−39−38
Std6.0034.8583.4023.151
Table 4. Target strength (TS) value differences of four group sizes from Coherent (Coh) and Incoherent (Incoh) Kirchhoff-ray-mode (KRM) backscatter models.
Three FishFive FishSeven FishTen Fish
Coh KRMIncoh KRMCoh KRMIncoh KRMCoh KRMIncoh KRMCoh KRMIncoh KRM
TS max (dB)−36−37−36−38−36−38−46−40
TS min (dB)−62−48−50−45−49−44−38−44
Range (dB)261114713684
Mean (dB)−42−41−41−41−42−41−41−41
Median (dB)−40−40−41−42−41−42−41−41
Std (dB)14.7869.63413.916.93912.966.3937.8913.781
Disclaimer/Publisher’s Note: The statements, opinions and data contained in all publications are solely those of the individual author(s) and contributor(s) and not of MDPI and/or the editor(s). MDPI and/or the editor(s) disclaim responsibility for any injury to people or property resulting from any ideas, methods, instructions or products referred to in the content.