Article

Effect of Wind-Wave-Current Interaction on Oil Spill in the Yangtze River Estuary

1
College of Civil Engineering, Tongji University, Shanghai 200092, China
2
State Key Laboratory of Marine Geology, Tongji University, Shanghai 200092, China
3
The Lyell Centre for Earth and Marine Science and Technology, Institute for Infrastructure and Environment, Heriot-Watt University, Edinburgh EH14 4AS, UK
*
Authors to whom correspondence should be addressed.
J. Mar. Sci. Eng. 2023, 11(3), 494; https://doi.org/10.3390/jmse11030494
Submission received: 31 December 2022 / Revised: 4 February 2023 / Accepted: 17 February 2023 / Published: 24 February 2023
(This article belongs to the Section Ocean Engineering)

Abstract

:
Oil spills are major threat to marine ecosystem and have long-lasting effect on marine life and water quality. In this study, a two-dimension hydrodynamic and oil spill transport model of the Yangtze River Estuary is established based on MIKE21 with a special attention to wind-wave-current interaction (WWCI). The model agrees well with the observed data on water level, current velocity, and the real oil spill event during Typhoon Fongwong. This study is mainly focused on the oil particle trajectory and spread. The model results show: (1) when the oil spill occurs during a typhoon period, the oil film can rapidly deposit under high WWCI, decreasing the swept area to about 20% compared with the normal weather condition; (2) strong current and large wave enlarge the oil film coverage whereas high wind speeds cause the oil particles to deposit in the shallow water area; and (3) the oil particles move farther and the swept area is far greater under the winter wind than under the summer wind, and the two times of the winter wind show the greatest effect on the oil spill. This study considers the drift, dispersion, evaporation, and emulsification of oil during the moving period under different wind, wave and current conditions, providing a good guidance for the oil spill prevention and mitigation in other estuaries.

1. Introduction

Oil spill events have become more frequent and more severe near the Yangtze River Estuary (YRE) in recent years [1,2], for example, the “Sanchi wheel” oil spill accident 300 km off Shanghai in 2018 [3]. The major causes of oil spills are marine shipping accidents, including collisions, reefing, grounding, sinking [4]. Oil spills often occurs during typhoon, hurricane and major storms (https://incidentnews.noaa.gov/ accessed on 15 December 2022). The National Power Corporation Power Barge 103 dislodged from its mount during Typhoon Haiyan, which resulted in 800,000 L oil leaking in Estancia, Iloilo, Philippines in 2013 [5]. Both oil film drift and the vertical turbulent dispersion are highly concerning. Oil film drift at the surface or subsurface [6] is a Lagrangian drift process under the combined action of wind, wave and current field. Additionally, turbulence induced by breaking waves also plays a major role in the horizontal and vertical dispersion of oil [7].
In recent years, the physical processes of oil transport have been studied extensively by numerical simulation and field observation. Jiang [8] established a two-dimensional oil spill model of the Huangpu River to study the transport and diffusion behavior of oil spills in a tidal channel and compare model results with physical model test results. Luo and Liu [9] theoretically analyzed the behavior of oil in water and summarized the theoretical principles, basic assumptions, and application scope of multiple oil spill models. Liu et al. [10,11] established a two-dimensional hydrodynamic model of Bohai Bay, and investigated the transport and weathering of oil spills in the Chengdao oilfield and Jiaozhou Bay. There model results compared well with satellite remote sensing images. Past studies of transport and weathering of oil spill in the YRE [1,12,13,14,15,16,17,18,19,20,21,22] used mathematical statistical methods or two- and three-dimensional hydrodynamic models. The contributions of winds, waves, and currents are considered individually for, under normal state. There is lack of understanding of the effect of strong nonlinear interaction of wind-wave and current on oil spills during extreme storms like typhoon.
Although wind-wave-current interaction (WWCI) in estuaries has been investigated widely, it is often neglected during typhoon events [23,24]. During the typhoon period, however, high winds, strong waves, and currents and their interaction can affect the estuarine dynamics considerably. High winds can induce strong waves and currents and affect breaking wave location and strength [25,26]. Meanwhile, currents can modify wave direction, height, and length, while the waves can affect the current speed and water elevation, which in turn can also significantly affect wave propagation in estuaries and coastal area [24,27,28,29]. Many studies applied the WWCI model to investigate hydrodynamics sediment and pollutions transport and coastal hazards. Xie et al. [30] and Zou and Xie [31] investigated wind-wave-current-surge interactions in the Gulf of Maine and found the relationship of the enhanced surge level to a wave setup of 0.2 m during the Patriots Day storm based on an ADCIRC-SWAN WWCI model on unstructured grid. Gong et al. [32] found that the effect of WCI on salinity transport was complicated and reported mechanism of salinity stratification modifications.
The coastal waters in China are often subject to threatened by tropical cyclones [33], especially typhoons. Much efforts have been devoted to better understanding of the hydrodynamics during typhoon events in the YRE close to Jiangsu and Zhejiang provinces that suffer from an average of 2.8 typhoon storms per year as shown in Figure 1, for example, Typhoon 9711, Typhoon 0012, Typhoon Fongwong (2014) [24,34]. The tide in the YRE is the dominant hydrodynamics driving force, with a mean ebb and flood tide duration of 7 and 5 h. The prevailing wind comes from the SE in summer and from NW in winter. The summer wind adjacent to the YRE is mild, with a magnitude lower than 5 m/s [35]. However, storms frequently visited the YRE in summer with a wind speed exceeding 20 m/s [36]. As one of the most important estuaries in China, the YRE provides more than 80% of the drinking water for the surrounding areas, and comprises many wetland natural conservation areas, therefore, particularly susceptible to water pollution [12].
In this study, we address the oil particles spilled at different stages of typhoon with WWCI in the YRE during the typhoon Fongwong. Typhoon Fongwong is a typical storm with unusual complicated path (shown in Figure 1) moved first to the west and then suddenly head to the east, made a landfall at Fengxian, Shanghai, on 22 September 2014 with the storm is characterized by strong winds of up to 16.8 m/s measured at Sheshan Station, Shanghai, which is approximately 70 km away from the oil spill site and varying direction provides a good study case for the oil dispersion. Various oil spill cases will be examined by a two-dimensional depth average wave-current coupling model using MIKE21. The main purpose of this study is to analyze the effect of wind, wave, and current interaction on the oil transport and spread. It was hypothesized that wind speed and direction may be the most vital factors for this complex estuary. The model results would be critical for emergency mitigation after marine accidents in the region.

2. Materials and Methods

2.1. Hydrodynamic Model

2.1.1. Hydrodynamic Simulation

MIKE 21 is a two-dimensional numerical model developed by the Danmark Hydrodynamic Institution based on a flexible, unstructured mesh system that is widely used within oceanographic, coastal, and estuarine environments. The model is based on the numerical solution of the two-dimensional incompressible Reynolds averaged Navier–Stokes equations with the Boussinesq assumption and hydrostatic pressure distribution. The spatial discretization of the primitive equations is performed using a cell-centered finite volume method. The spatial domain is discretized by subdivision of the continuum into non-overlapping elements/cells.
The mass conservation and momentum equations in the rectangular coordinate systemin the shallow water [37] are as follows:
h = η + d
h t + h u ¯ x + h v ¯ y = h S
h u ¯ t + h u ¯ 2 x + h v u ¯ y = f v ¯ h g h η x h ρ 0 p a x g h 2 2 ρ 0 ρ x + τ s x ρ 0 τ b x ρ 0 1 ρ 0 s x x x + s x y y + x h T x x + y h T x y + h u s S
h v ¯ t + h u v ¯ x + h v ¯ 2 y = f u ¯ h g h η y h ρ 0 p a y g h 2 2 ρ 0 ρ y + τ s y ρ 0 τ b y ρ 0 1 ρ 0 s y x x + s y y y + x h T x y + y h T y y + h v s S
The overbar indicates the average depth value. For example, u ¯ and v ¯ are the depth-averaged velocity components in the x and y directions defined by:
h u ¯ = d η u d z , h v ¯ = d η v d z
Txx, Txy, and Tyy are the lateral stresses, which include viscous friction, turbulent friction, and differential advection. They are estimated using an eddy viscosity formulation based on the average depth velocity gradients:
T x x = 2 S a u ¯ x , T x y = S a u ¯ y + v ¯ x , T y y = 2 S a v ¯ y
where Sa is the Smagorinsky subgrid scale eddy viscosity,
S a = c s 2 l 2 2 S i j S i j
where cs is a constant, l is a characteristic length, and the deformation rate is given by:
S i j = 1 2 u i x j + u j x i i , j = 1 , 2
where t is the time; x and y are the Cartesian co-ordinates; η is the surface elevation; d is the still water depth; h is the total water depth; f is the Coriolis parameter; g is the gravitational acceleration; ρ0 is the reference density of water; sxx, sxy, syx and syy are the components of the radiation stress tensor; pa is the atmospheric pressure; S is the magnitude of the discharge due to point sources; (us, vs) is the velocity at which the water is discharged into the ambient water. (τsx, τsy) and (τbx, τby) are the x and y components of the surface wind and bottom stresses.

2.1.2. Study Area and Parameters Setup

The estuarine and coastal hydrodynamic model, improved and developed by the author’s research group for many years, has been calibrated and verified in this study in the YRE [24,38]. The present model domain, which includes the entire YRE, Hangzhou Bay (HB), and adjacent marine area in order to better capture the hydrodynamics (see Figure 2). The model domain spans 810 km in the N-C direction from 26.9° N to 34.4° Nand 500 km in the W-E direction from 120.2° E to 125.6° E. The mesh system is composed of an unstructured triangular mesh with 18,887 nodes and 33,656 elements, with the coarsest mesh at the east ocean boundary and the finest mesh in the channels.
The model uses closed and open boundaries [39]. Boundary conditions include specified discharge in 2 river boundaries (Yangtze River and the Qiantang River of 28,484 and 952 m3/s, respectively) and specified water level [24] in east, south, and west ocean boundaries. In the model, the tidal potential defined by 11 constituents, comprising M2, O1, S2, K2, N2, K1, P1, Q1, Mf, Mm, and Ssa, is used to predict the water level at the open boundaries.
The wind data comes from, the fifth generation of atmospheric reanalysis production at ECMWF-ERA5 (the European Centre for Medium-Range Weather Forecasts, http://apps.ecmwf.int/datasets/data/interim-full-daily accessed on 30 October 2022) [40]. The time resolution is one hour, and the spatial resolution of wind input of u10 and v10 is 0.25° × 0.25°. The wind stress τ s = τ s x , τ s y is given by the following empirical relationship:
τ ¯ s = ρ a c d u w u ¯ w
where ρ a is the density of air, c d is the drag coefficient of air, and u w = ( u w , v w ) is the wind speed 10 m above the mean sea surface. The friction velocity associated with the surface wind stress is given by:
U τ s = ρ a c f u ¯ w 2 ρ 0
where cf is the drag coefficient, which can either be a constant value or depend on the wind speed. As the max wind speed is not much larger than 7 m/s, cf is set to a constant, 0.001255.
The bottom stress τ b at the sea bed is determined by a quadratic friction law as follows:
τ b = ρ 0 c f u b u b
where cf is the drag coefficient and u b is the flow velocity above the bottom. The friction velocity associated with the bottom stress is given by:
U τ b = c f u b 2
As the relative variation of water depth in YRE is large, the specific Manning number M is used as the drag coefficient.
c f = g M h 1 / 6 2
The waves is a significant contributing factor since during typhoon, high winds can result in storm surges, strong currents, and storm waves. The governing equation of wave action balance equation formulated in horizontal Cartesian co-ordinates:
N t + v N = S b σ
c x , c y = d x d t = c g + U
c σ = d σ d t = σ d d t + U x ¯ d c g k U s
c θ = d θ d t = 1 k σ d d m + k U m
σ = g k tanh k d = ω k U
c g = σ k = 1 2 1 + 2 k d sinh 2 k d σ k
where N x , σ , θ , t is the action density, which is related to the energy density; σ is the angular frequency; c is the phase velocity; c = σ/k, k = 2π/L, where k is the wave vector, L is the wave length; U is the current velocity vector; cg is the magnitude of the group velocity; x x , y is the Cartesian co-ordinates; v c x , c y , c σ , c θ is the propagation velocity of a wave group in the four-dimensional phase space x , σ, and θ, and Sb is the source term for the energy balance equation; is the four-dimensional differential operator in the x , σ, θ-space; s is the space co-ordinate in wave direction θ, and m is a co-ordinate perpendicular to s; x ¯ is the two-dimensional differential operator in the x -space.

2.1.3. Model Verification

The hydrodynamic module has been validated in the previous study of Wang et al. (2022) [24]. The model performance is quantified by the predictive Skill number (Skill). The equation of Skill is defined as below:
S k i l l = 1 i = 1 N M i D i 2 i = 1 N ( M i D ¯ + D i D ¯ ) 2
where Mi and Di are the ith model result and situ measured data; D ¯ is the mean value of the situ measured data; N is the number of observations. A Skill value of 1.0 indicates perfect performance of the model, excellent for Skill between 0.65 and 1, very good for Skill in the range of 0.5~0.65, good for Skill in the range of 0.2~0.5, and poor for Skill less than 0.2.
The measured data for the current velocity were from 28 February to 1 March 2014. The water level was validated by using the measured data at Chongming, Sheshan, Luchaogang, and Dajishan stations (positions shown in Figure 1) from 18 to 25 September 2014. Wave model was run from 15 August to 1 October 2014, and validated at Yangkougan. The verification results are shown in Figure 3 [24].

2.2. Oil Spill Model

The spilled oil changes its physical and chemical properties in a marine environment according to the properties of the oil, hydrodynamics forcing by wave and current, meteorological conditions (winds, solar radiation, etc.), and environmental conditions. The behavior and fate of an oil spill in the ocean are influenced by physical transport process and the weathering process.
The MIKE 21 Oil Spill Model is used for modelling the fate of oil discharged or accidentally spilled in lakes, estuaries, coastal areas, and open sea. The MIKE 21 Oil Spill Model can simulate spread, evaporation, dissolution, vertical dispersion, settling, biodegradation, and photooxidation of oil spills. It was found that Lagrangian models, which MIKE 21 Oil Spill used, are more suitable for fast simulation than Eulerian approaches. The basic idea behind the particle tracking is to transport particles according to a drifting current and adding dispersion by introducing a random walk term [41,42].

2.2.1. Physical Transport

The fate and behavior of an oil spill can be influenced by the physical transport processes, as well, such as wind drift, current transport, turbulent mixing, and resurfacing. The particle tracking technique for describing the transport and dispersion of particles follows the Langevin equation.
d X t = a t , X t d t + b t , X t ξ t d t
where a is the drift term; b is the diffusion term; ξ is a random number.
Particles exposed to wind at the water surface are affected differently by the wind regime: indirectly via the drift currents induced by wind, and directly by wind force on the particle. The particle velocity is in the top 5 cm of water column is described by:
U p a r t i c l e = U c u r r e n t + w i n d w e i g t h U w sin W i n d d i r e c t i o n π + θ w
V p a r t i c l e = V c u r r e n t + w i n d w e i g t h U w sin W i n d d i r e c t i o n π + θ w
where U p a r t i c l e and V p a r t i c l e are the particle velocity along x and y directions; U c u r r e n t and V c u r r e n t are the surface current speed in x and y directions; windweight is the calibration factor for wind drag on particle; U w is the wind speed 10 m above the water surface; Winddirection is the wind direction; θ w is the wind drift angle, caused by the Coriolis force, and turns to the right on the Northern Hemisphere. The wind drift angle is given by [43]:
θ w = β exp α U w 3 g γ w
where α = 0.3 10 9 , β = 28 3 8 ; γ w is the kinematic viscosity.
Assuming isotropic horizontal diffusion, the diffusion distance Sα in the α direction at a time step is expressed as:
S α = R 1 1 6 D α Δ t p
where R 1 1 is a random number between −1 and 1; Dα is the diffusion coefficient in the α direction; Δ t p is the diffusion time step.
The equation for the change in the sum of all particle track areas with time is shown as follows [44]:
d A d t = K s p r e a d A 1 3 V A 4 3
where Kspread is a rate constant, taken as 150 s−1; A = πR2 is the area of the oil particle, R is the oil film radius; V = πhsR2 is the volume of oil film, and hs is the initial oil film thickness.

2.2.2. Weathering of Spilled Oil

The physicochemical oil weathering processes include oil spreading, evaporation, dispersion, emulsification, dissolution, photo-oxidation, biodegradation, and sedimentation. In this study, we focus on evaporation, emulsification, and vertical dispersion.
In the first hours and days of the spill, evaporation at the surface of the slick is the dominant weathering process. The time-dependent evaporation loss is described by [45,46]:
l o s s % w e i g h t = A + B T ln t
where T is the oil temperature; t is the age of the oil; A is the oil specific constant; B is the oil specific constant for temperature dependency; here, A is 2.67 and B is 0.06 [47].
Emulsification is the process by which water is mixed into the oil. Emulsification tends to occur under conditions of strong winds and/or waves, and generally not until an oil spill has persisted in the water for at least several hours. The emulsification process are governed by [48]:
w a t e r u p t a k e = K e m U + 1 2 Y max Y w Y max
w a t e r r e l e a s e = α Y w
where Yw is the water fraction; Ymax is the maximum water fraction; U is the wind speed; Kem is the emulsification rate constant, here Kem is 2 × 10⁻⁶ s/m2 [49]; α is the water release rate related to the emulsion stability index Se.
α = α 0 α 0 α 0.67 S e / 0.67 α 0.67 1.22 S e / 1.22 0.67 0 f o r f o r f o r S e < 0.67 0.67 S e < 1.22 S e 1.22
where α0 and α0.67 are the water release rates for an unstable emulsion with Se = 0 and a mesostable emulsion with Se = 0.67, respectively.
In the equation (30), the stability index is given by:
S e = X a exp K a o 1 X a X w 2 + K a w X w 2 exp 0.04 T 293
where the subscripta a, w, and o represent asphaltenes, wax, and other components, respectively; Kao and Kaw are 3.3 and 200 at 293 K; Xa and Xw are the fractions of asphaltenes and wax; T is the water temperature.
Vertical dispersion is an important factor moving the oil across the water column. The strong winds, waves, and currents during typhoons facilitate the dispersion process. The key dispersion mechanism of oil droplets are breaking waves described by [50]:
Q d = C D 0.57 S F d 0.7 Δ d
where C = 4450N−0.4 is the entrainment coefficient, N is the kinematic viscosity; D is the wave energy dissipation; D = 0.0034ρwgHrms2, ρw is the density of sea water; Hrms is the root mean square value of the wave height; F is the fraction of sea surface covered by breaking waves per unit time, F = 0.032 (UwUth)/Tw, Uw is the wind speed; Uth is the threshold wind speed for the onset of breaking waves; F = 0 if Uw < Uth; d is the mean diameter of droplet size, d = 1818E−0.5N0.34, E is the energy dissipation rate for breaking wave; Δd is the droplet size interval.

2.2.3. Beaching and Shore Lock-Reflection

According to the study by Shen et al. [51], there may be three possibilities for the oil particles to be completely absorbed, partially absorbed, or completely reflected by the shore. In this study, according to the numerical model used in the simulation analysis of the YER oil spill accident [52,53] and to find out the maximum area after the oil spill, the probability of a particle being absorbed of 0 means it is completely reflected.

2.2.4. Oil Spill Simulation in the YRE

At about 16:45 on 30 December 2012, the Ship Shanhong 12 (the information is shown in Table 1), which carried approximately 400 tons of residual oil from Liuhe Estuary Port in Taicang to Jiangdu, sank in the waters about 500 m northwest of the B# 11 red buoy in the Baimaosha North Waterway of the Yangtze River [54,55] (the position shown in Figure 4). On the morning of 12 December 2012, the spilled oil affected Chongming Island. The beach from the head of Chongming Island to the Nange Sluice, the local water area, several groins, and longitudinal dikes were all polluted by oil to different extents. The 8 km long and up to 10 square km areas between Xinjian Sluice and Chongxi Sluice suffered the most severe pollution. Meanwhile, the 6, 7, 11, and 12 west groins of Xinjian Port, Xinjian Sluice, Chongming Sluice, and other hydraulic structures were polluted as well [56]. The simulation scenarios are shown in Table 2. In general, 10% of the total oil spill is the instantaneous oil spill, and 90% is a continuous oil spill [11]. Therefore, continuous oil spill at a rate of 600 t per hour was used in this simulation. Lacking specific types of oil spills, diesel fuel was selected [57], which is commonly used for ship fuel and includes 30% volatile and 70% heavy oil fractions in Mike OS.
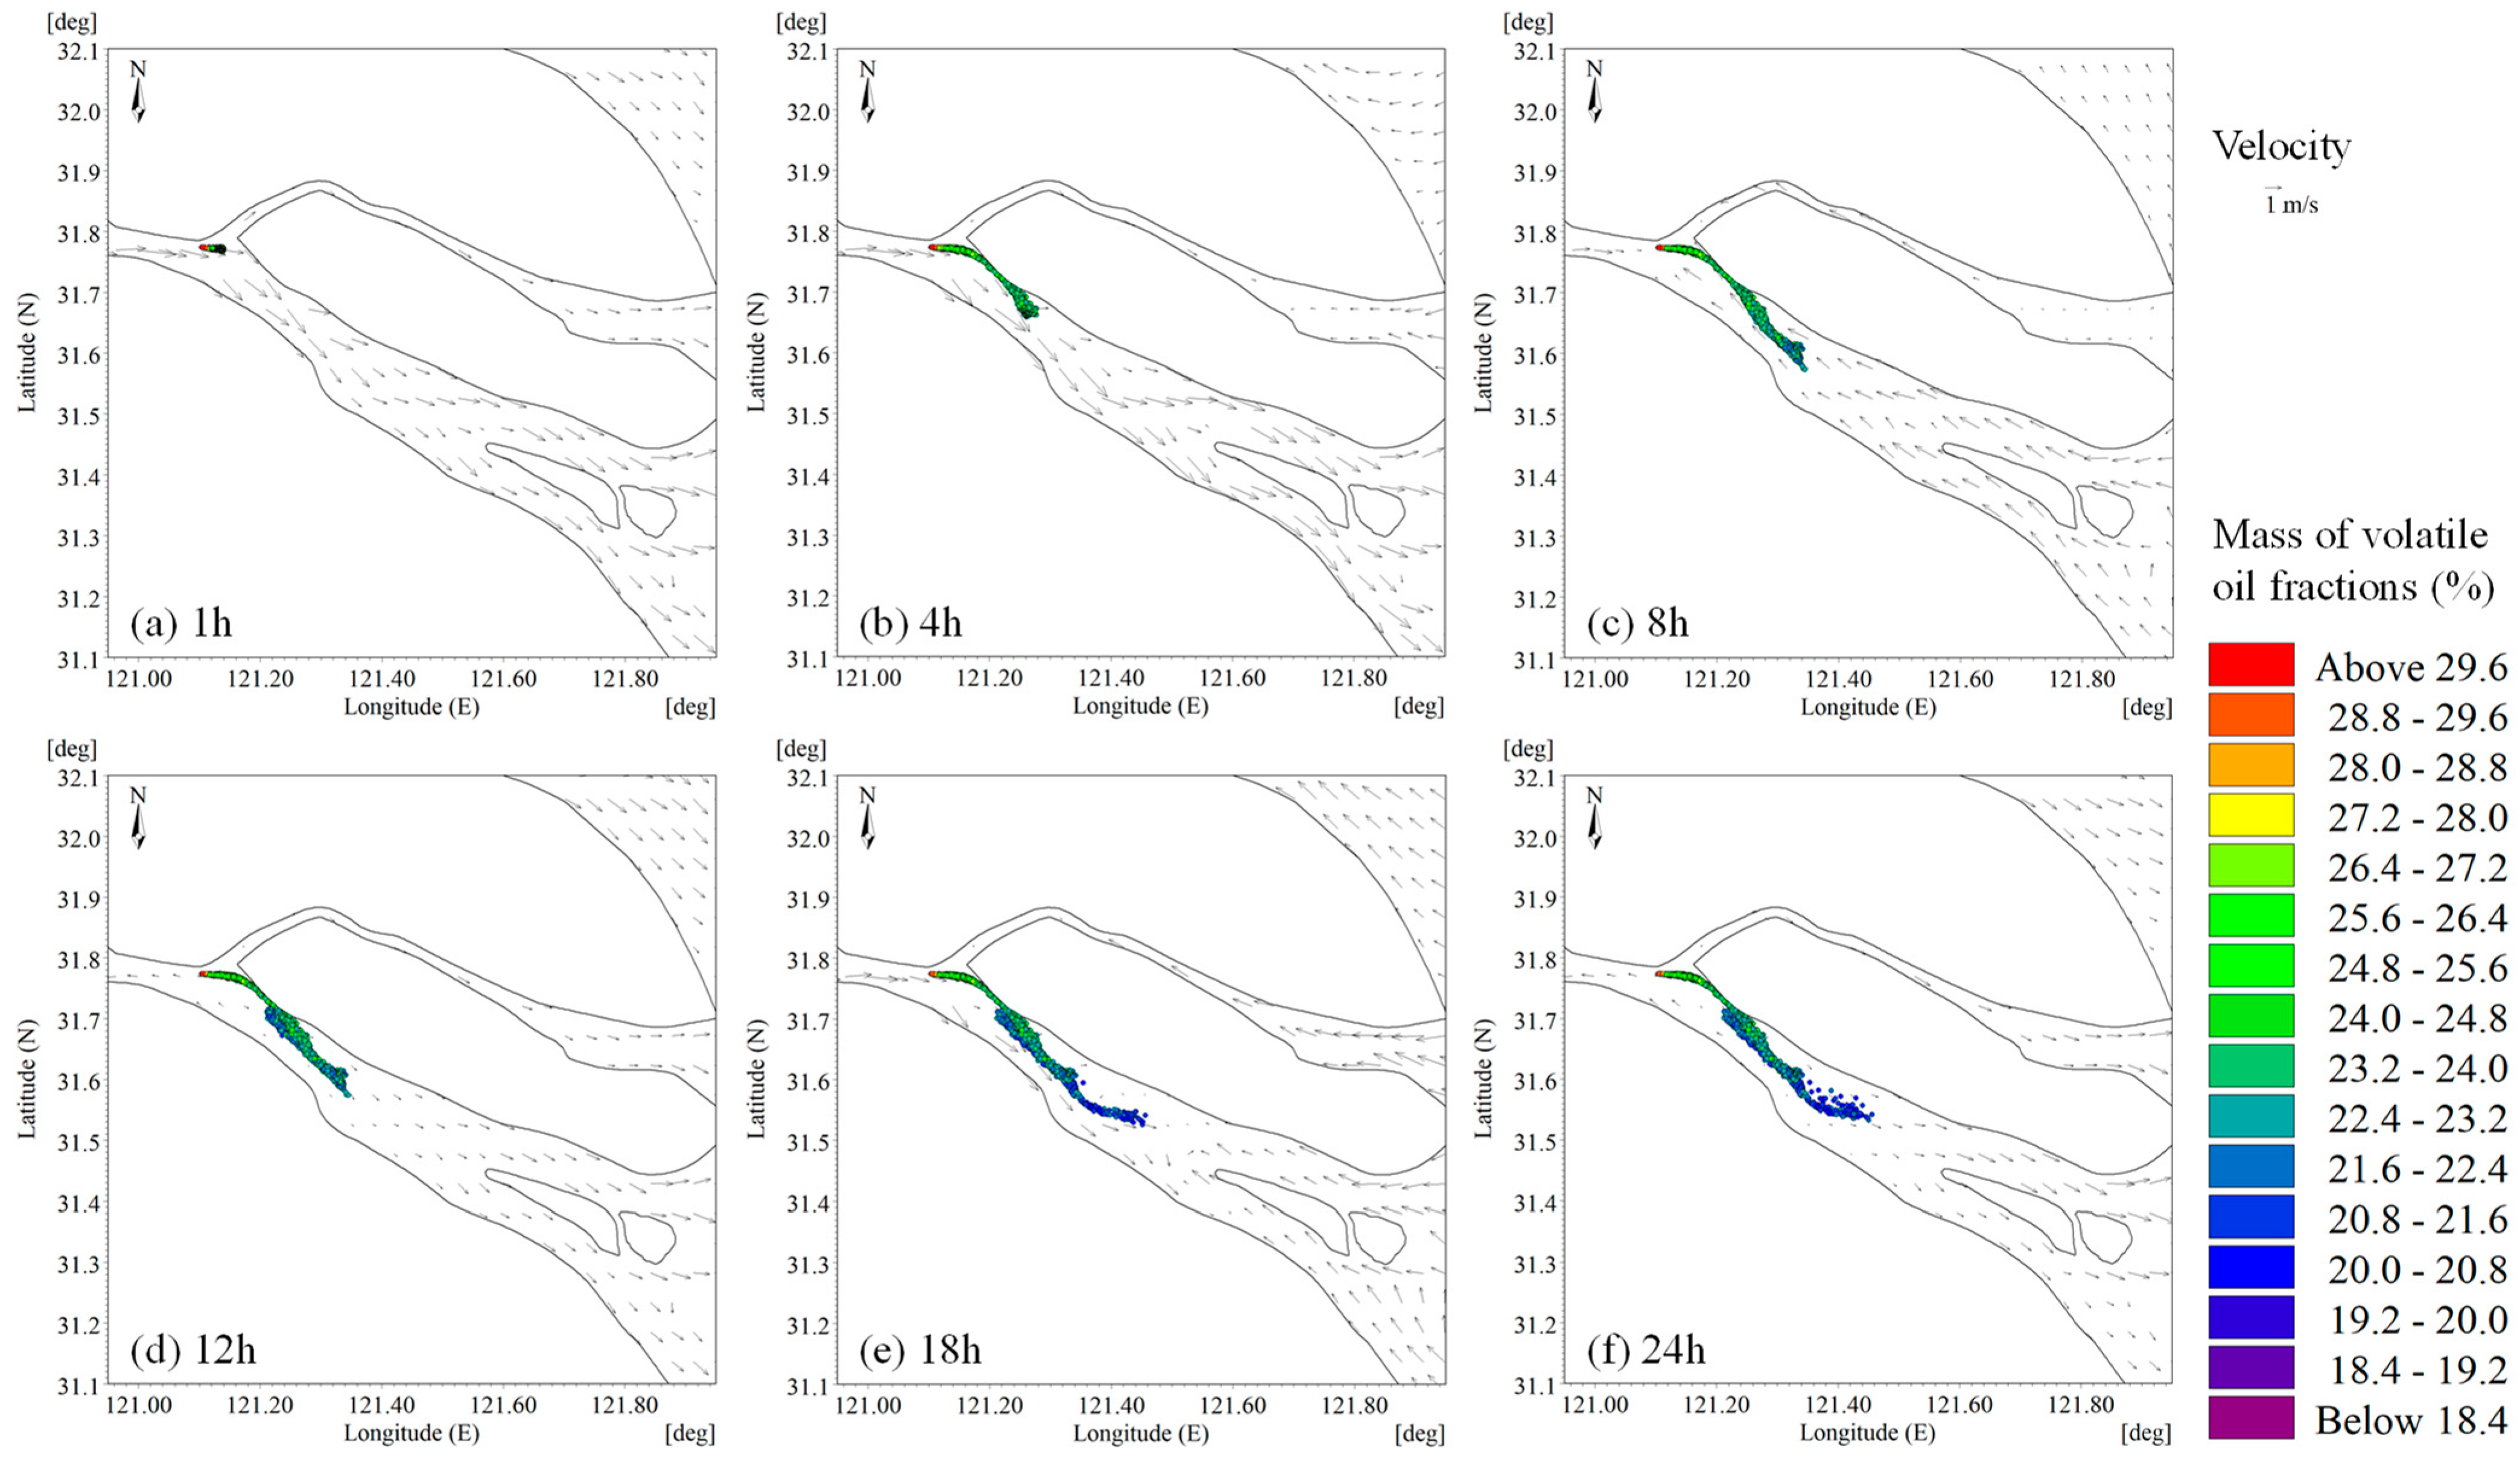
Figure 5 shows the predicted oil particle trajectory after the ship sinks. The tide condition of the YRE was high water slack at the time of the oil spill accident and ebbing tide after 1 h. About 2 h later, the oil film approached the land and polluted Chongxi Sluice, Dongfengxisha Reservoir, and Xinjian Sluice, which were the most polluted areas in this accident. According to the predicted effects of vertical dispersion, the oil particles almost settled in 24 h. Because of the semidiurnal tide phase in the YRE, there were two tides in 24 h to make suspended oil particles reciprocate twice in the south branch. The results show that the evaporation was less than 7% within 24 h, and it was rarely dissolved in water. The simulation results provide a fast and accurate basis for determining the follow-up study area and the initial accident mitigation.

3. Results

According to the data of the National Meteorological Centre (http://typhoon.nmc.cn/web.html accessed on 30 October 2022) and simulation of hydrodynamics, the influence of Typhoon Fongwong was mainly concentrated on 21–24 September 2014. In order to make the hydrodynamic conditions similar in the simulation, flood slack was selected as the oil particle release time as shown in Table 3. The simulation lasts 96 h to cover the whole typhoon duration.
Figure 6 shows the wind, wave, and current during the simulation process. The wind velocity during the typhoon is much higher than that before and after the typhoon with similar average velocity. As shown in Figure 6c, the significant wave height in the typhoon is much higher during typhoon and almost negligible before and after typhoon during normal situation. In the selected oil spill release time before and after the typhoon, the significant wave height is almost 0. It can be seen from Figure 6d that the current velocity gradually increases within the influence period of the typhoon and even lasts for a certain time after the typhoon. The current velocity after the typhoon is greater than that before the typhoon because of the spring tide.

3.1. Oil Spill Trace before, during, and after Typhoon

3.1.1. Before Typhoon Landed

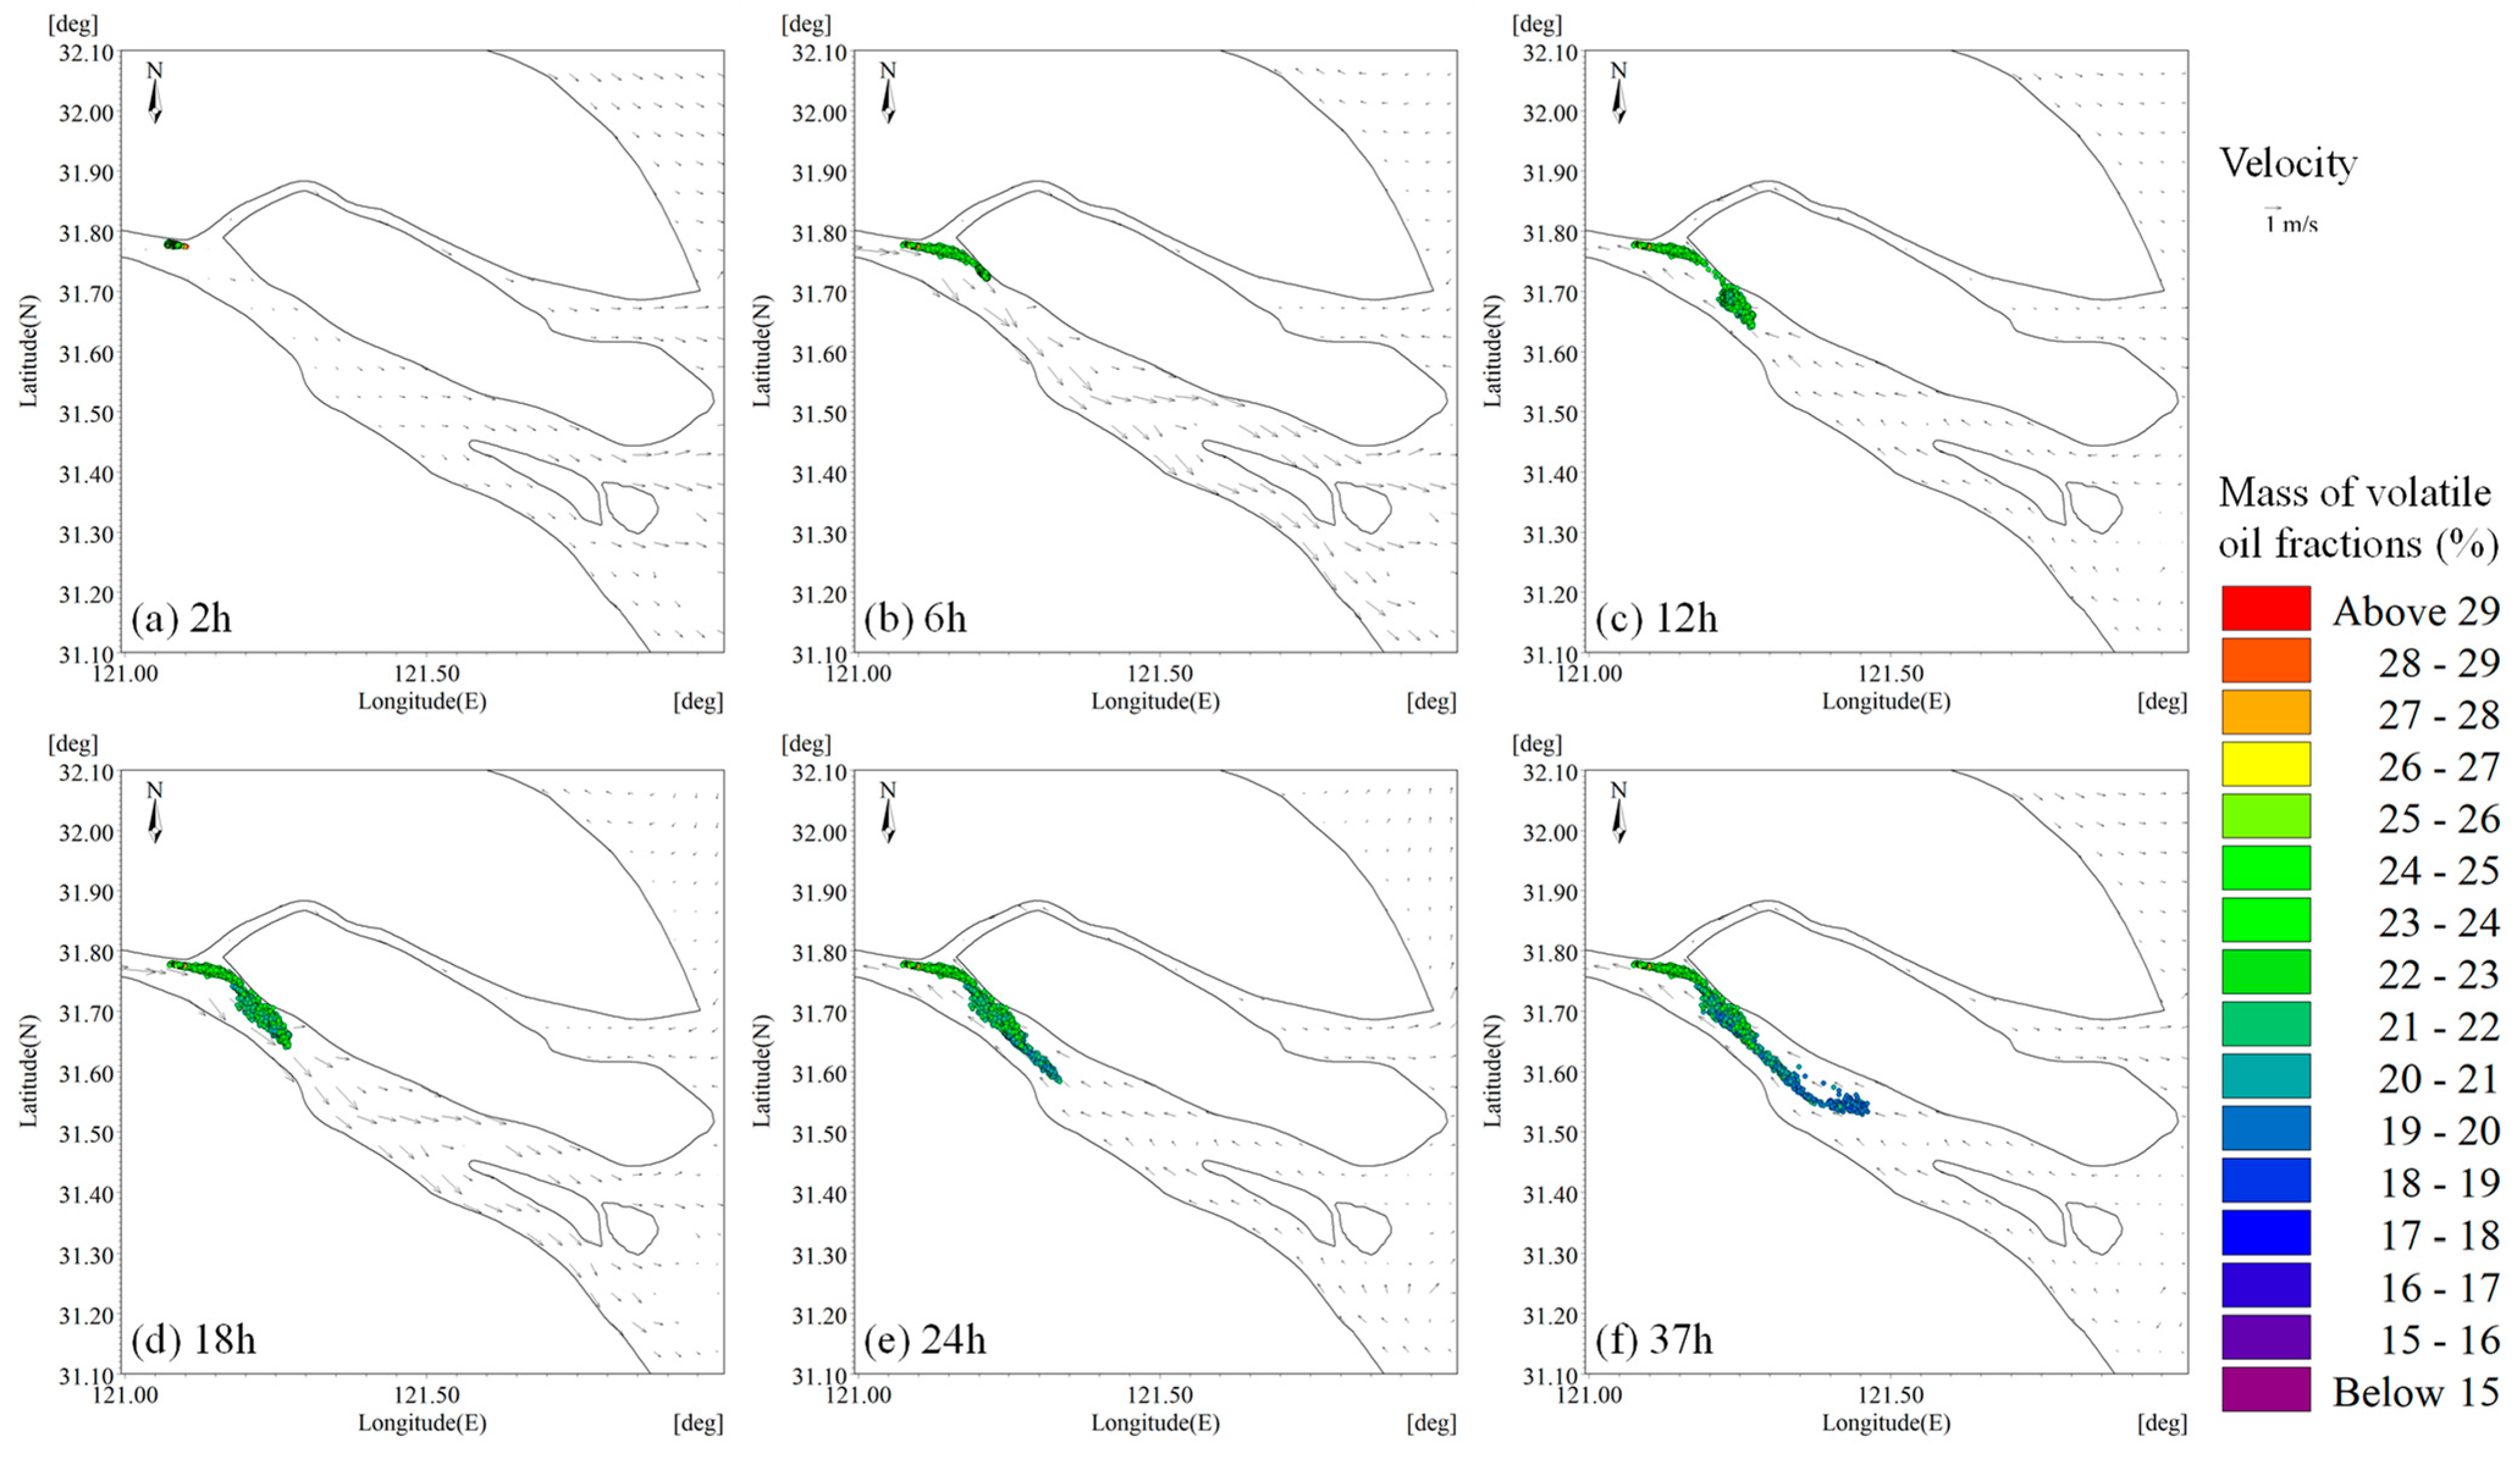
Oil particle track or oil released before the typhoon is shown in Figure 7. The oil particles arrived at Dongfengxisha Reservoir after about 6 h, while in the real accident, the oil arrived in just about 4 h. In this hydrodynamic simulation, there is a phenomenon where the current velocity decreases and then increases within a short flood tide in the first 2 h, resulting in a longer arrival time than that in the actual accident simulation. In about 37 h, oil particles almost sink to the bottom. The simulated particle trace compared with the real accident observations and the simulated and observed impact on the sensitive area is similar.

3.1.2. During Typhoon

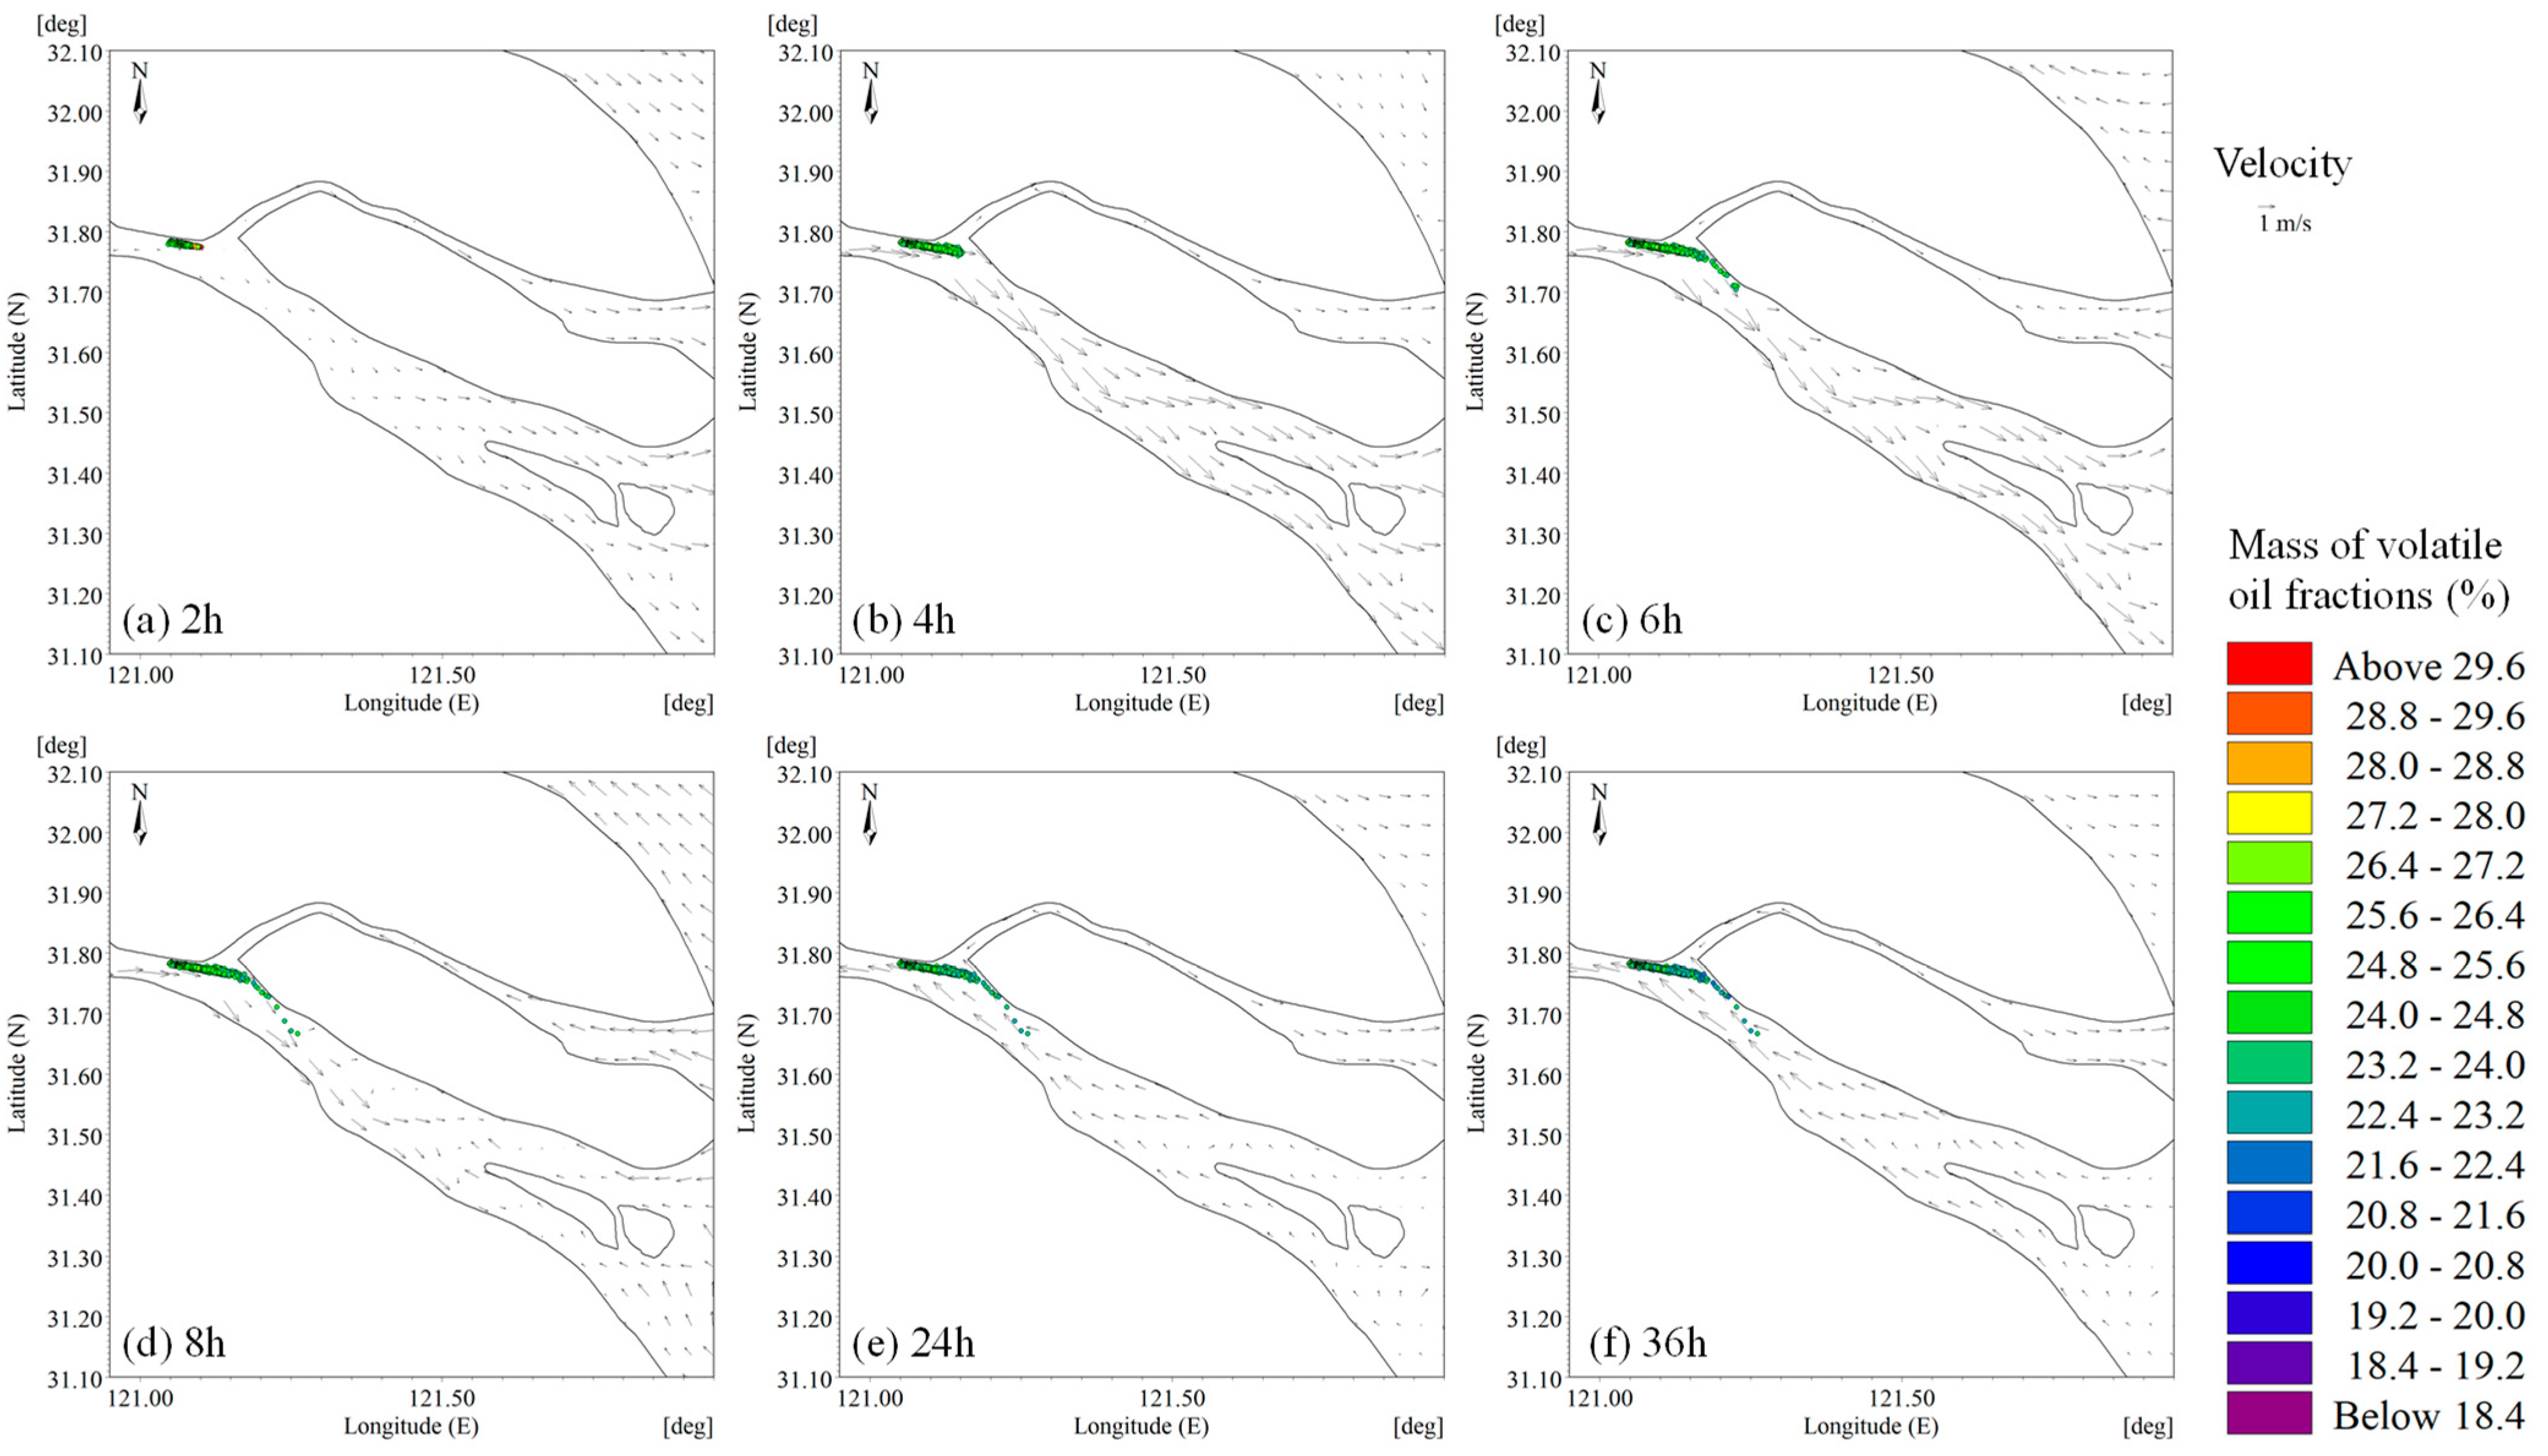
Figure 8 shows the oil particle track during the typhoon. There still exists a short flood tide period of about 2 h, and the oil particles move upstream. Due to the influence of strong wind and induced waves, the function of the WWCI strengthens, resulting in an intensification of the turbulence of the current. Meanwhile, the oil film is broken by waves induced by strong winds. Under the entrainment of wave and current, the oil particles basically sink into the bottom of water column in about 8 h, and only a very few particles reach the Dongfengxisha Reservoir. According to the results of the numerical simulation, when the oil spill occurs during the typhoon period, it would dive under the action of wave breaking and entrainment. Therefore, the suspended oil film has little effect on the oil spill vulnerable area; on the contrary, the sinked oil film would have a greater impact on benthos. In such cases, more attention should be paid not only to preventing the oil from sinking into the seabed but also to cleaning up the residual oil as soon as possible.

3.1.3. After Typhoon Passage

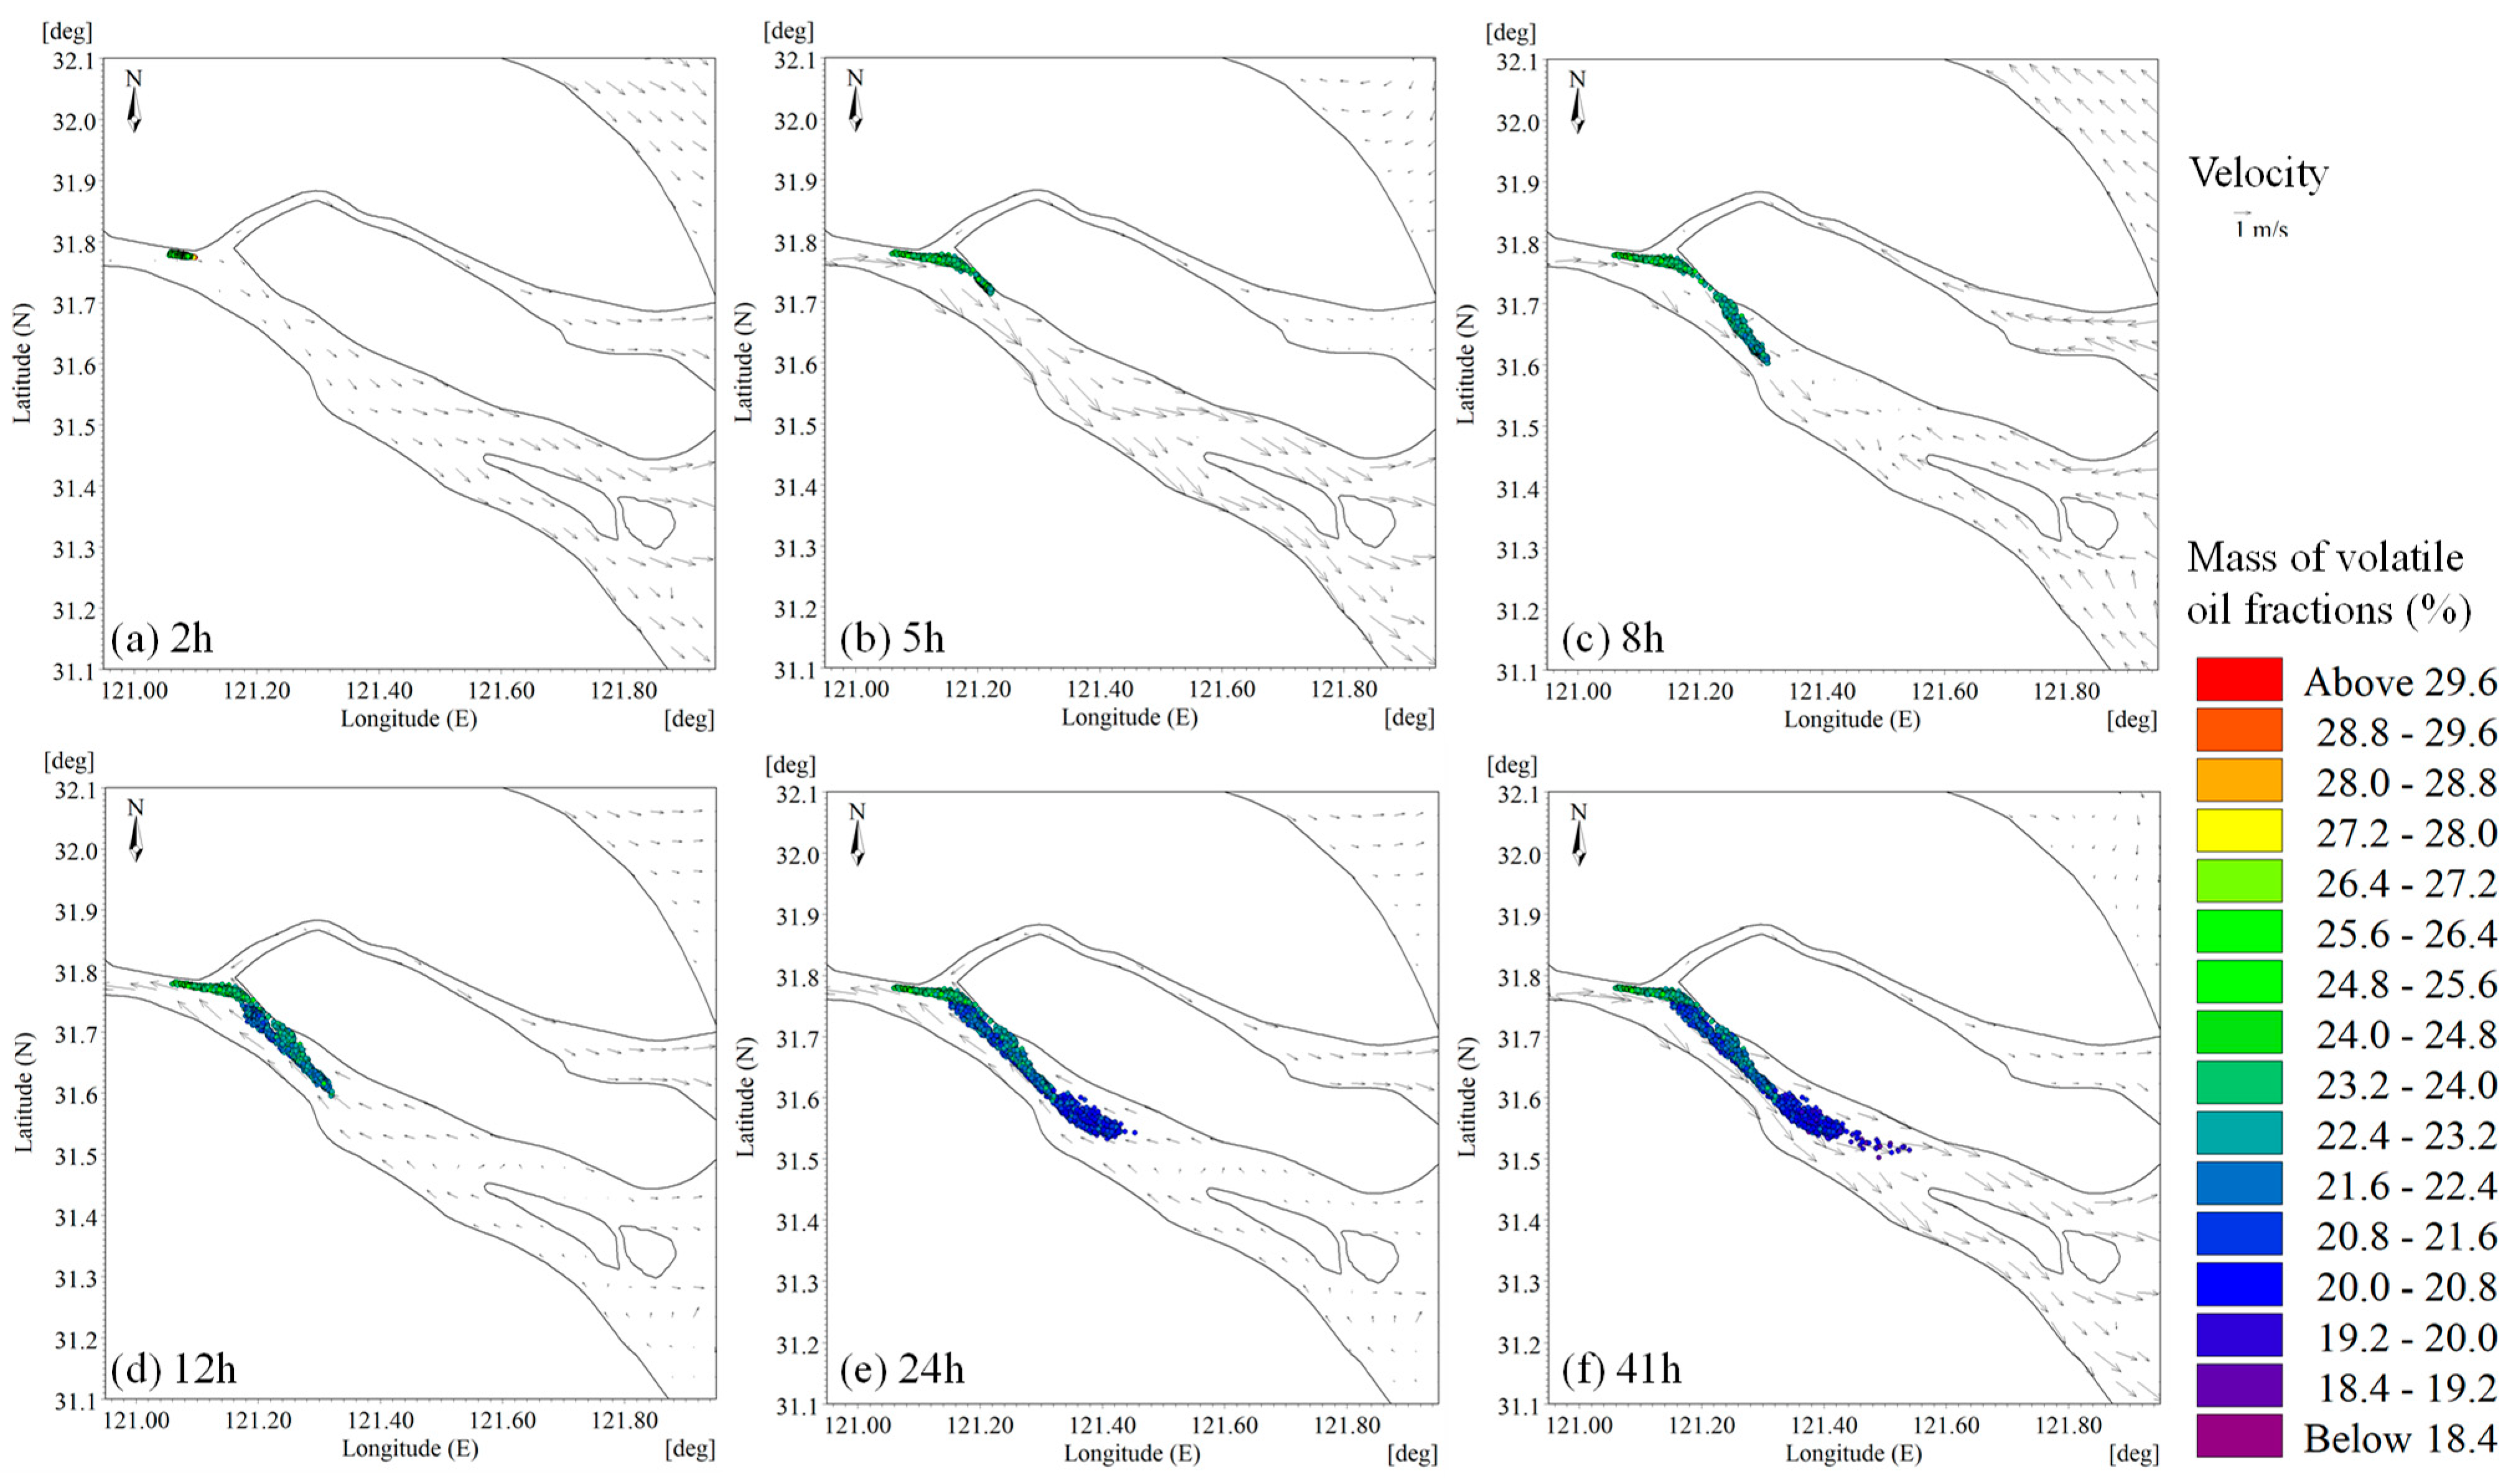
Figure 9 shows the traces of oil particles released after the typhoon. This period has a strong residual current; the oil particles began to affect the Dongfengxisha reservoir about 5 h, which is an hour earlier than that before the typhoon. Considering small waves are and therefore weakened vertical turbulence and dispersions, causing the oil to sink into the seabed after 41 h, 4 h later than before the typhoon. Additionally, the oil film moves farther, which can even impact the Qingcaosha Reservoir, suggesting that the dominating factor of strong current can strengthen the oil particle dispersion.

3.2. Oil Spill Spread and Slick Thickness

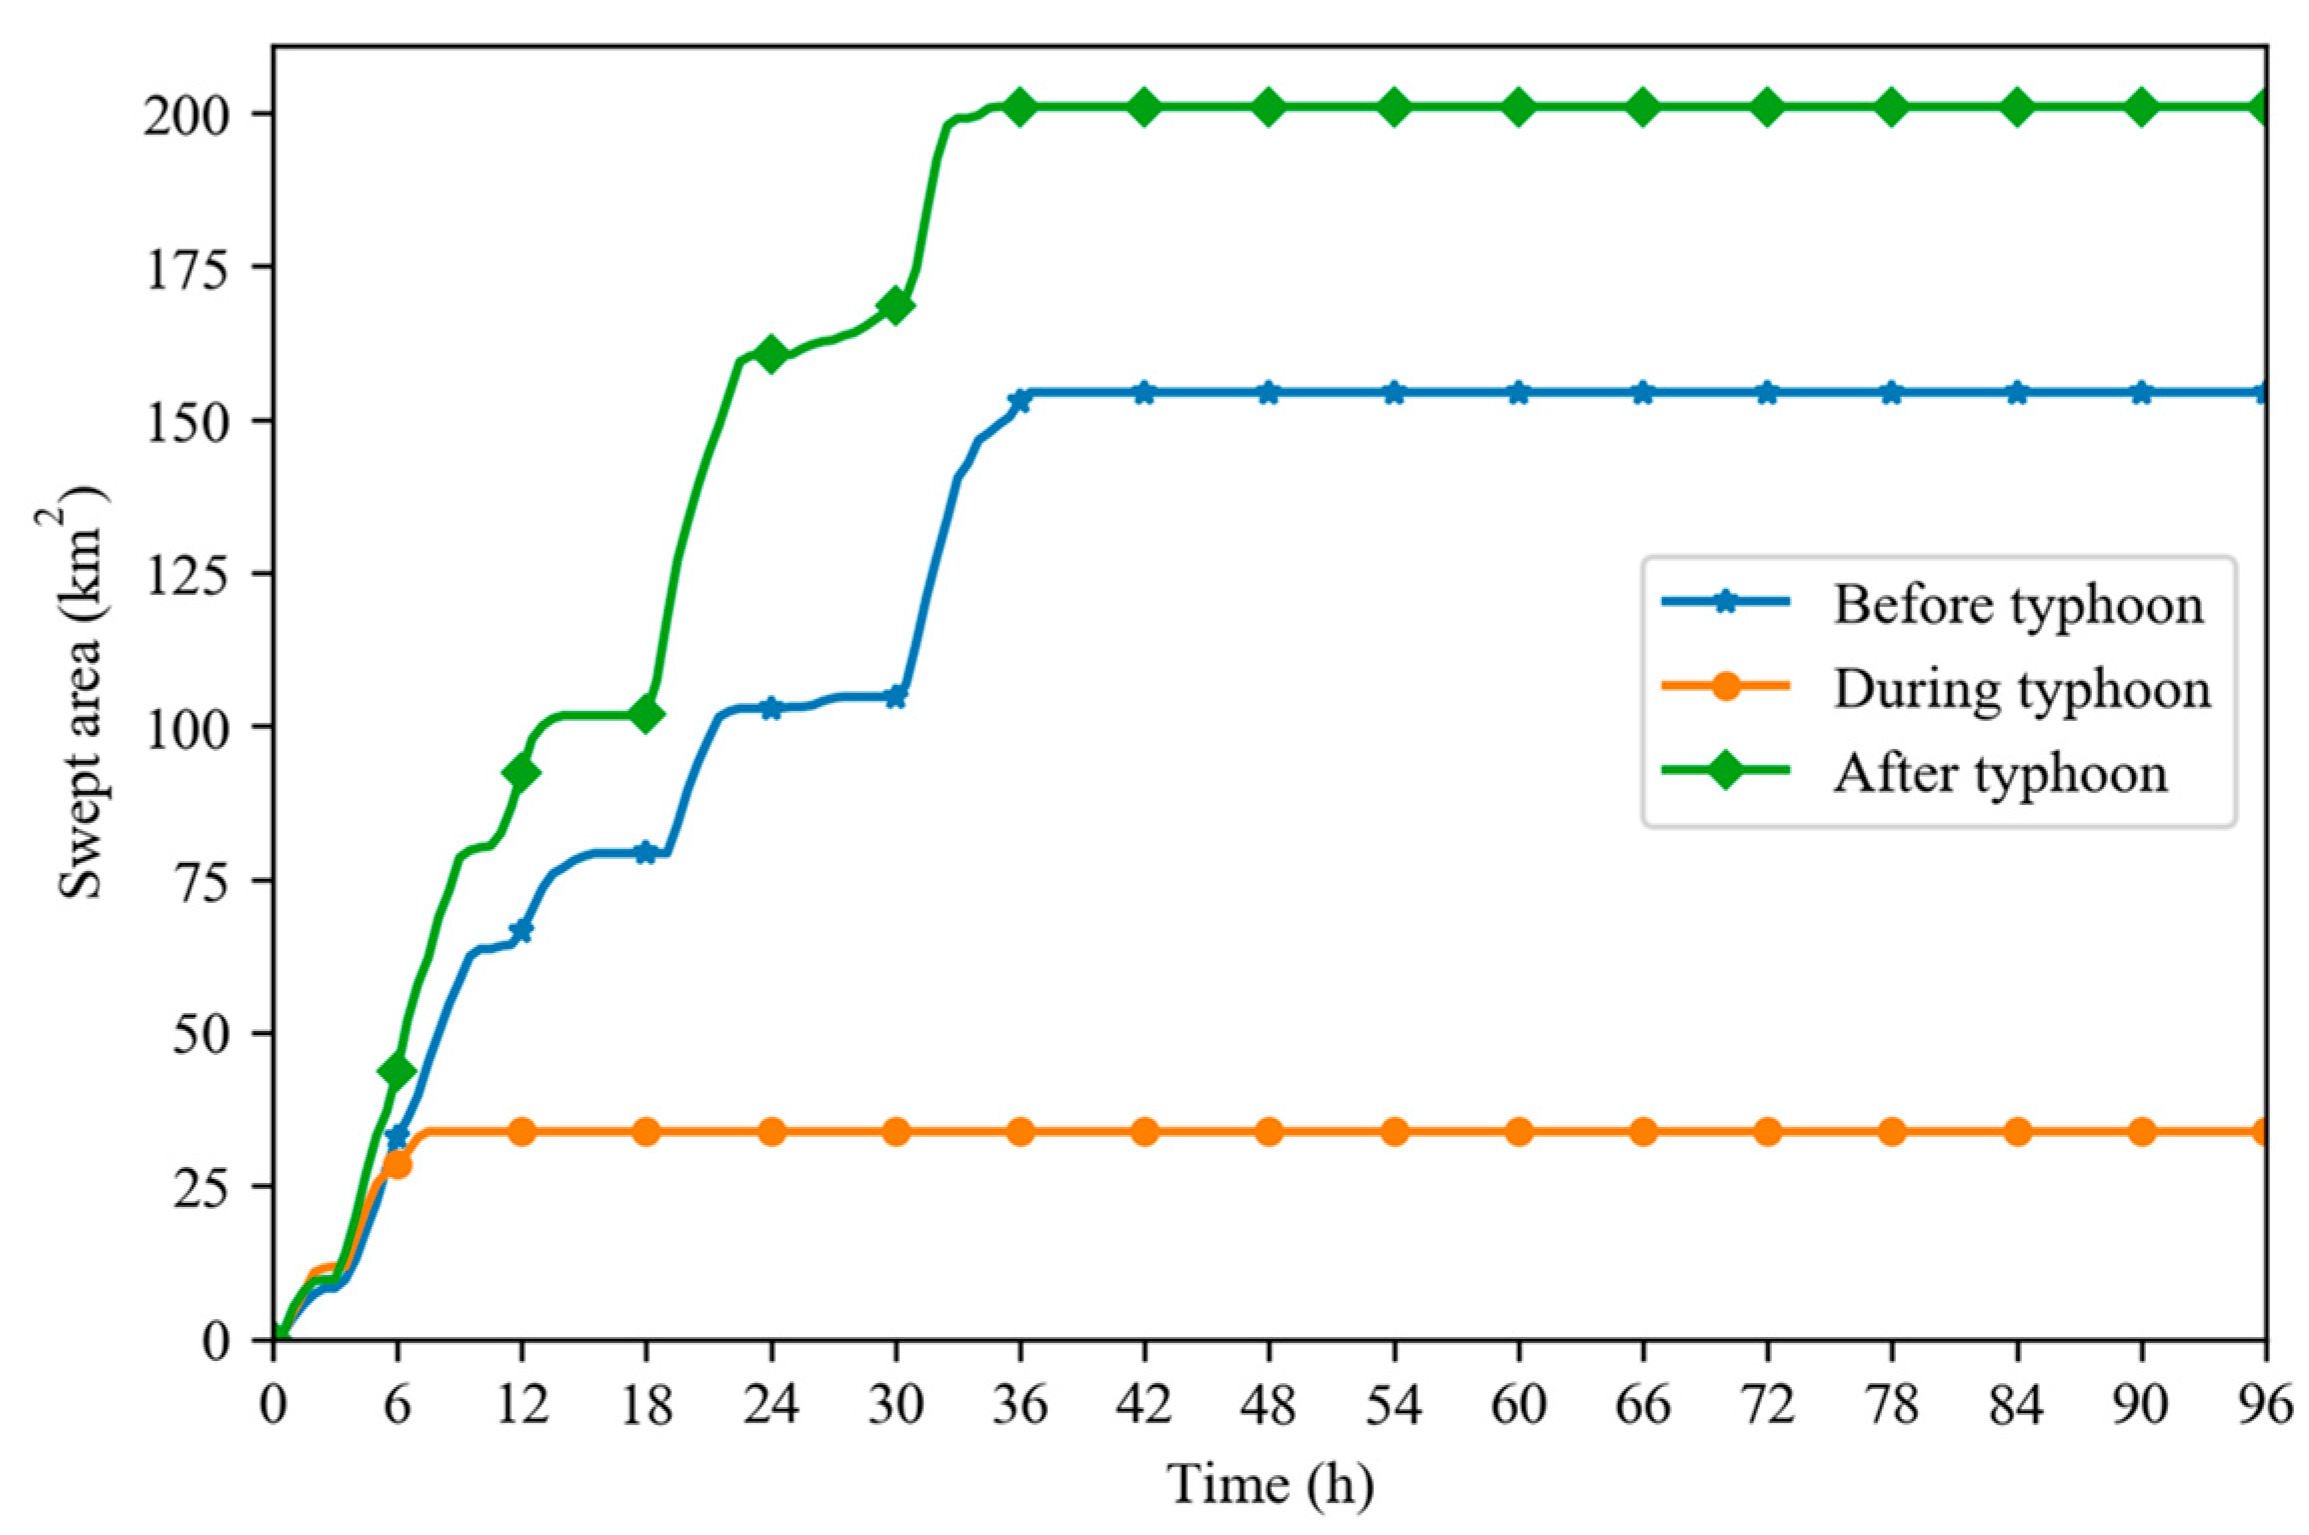
Figure 10 shows the spread area before, during, and after the typhoon period. The spread area is defined as the total area of the oil film swept through the sea with time. The maximum swept area is 154.44 km2, 33.82 km2, and 201.04 km2 before, during and after typhoon respectively. It can be seen that the spread area is the smallest when the oil is released during a typhoon; only 21.9% of that is released before the typhoon and 16.8% after the typhoon, which has little effect on the surface water of the YRE. When the particles release after a typhoon, the waves are small while the residual current velocity is the largest (1.06 m/s), and the swept area becomes the largest, indicating that this scenario causes the most threatening water pollution. The average current velocity before a typhoon is 0.84 m/s, which is 79.3% of that after a typhoon, with the swept area at about 76.8%. As can be seen from the figure, the swept area increases in a series of cascades due to the semi-diurnal tides. When the tides turn, the oil film will move to its previous position and the overlap area was excluded from the sea-swept area. The tide changes every 6 h, which is consistent with the growth rate of the swept area. Meanwhile, the swept area increases with increasing current speed.
Figure 11 shows the time evolution of thickness of the oil film. We can see in Figure 11b that when the oil particles are released during a typhoon, the oil film trace only reaches near the vulnerable area and has a distance of the calculated points, so the thickness is 0 mm. The thickness at the heavily polluted point of Chongxi Sluice in Figure 11a is more than 0.2 mm, while in Figure 11c Xinjian Sluice is the most polluted one where the oil slick reaches twice (6 h and 15 h). In summary, the oil film becomes thicker due to the small horizontal diffusion before the typhoon, while it becomes thinner when the diffusion is larger after the typhoon. However, the large current velocity brings the oil film back to the vulnerable sensitive area and causes secondary pollution. According to the simulation results, it is recommended to clean up the spreading oil within 3 h to prevent it from polluting vulnerable sensitive areas. In addition, if the current speed is high, special attention has to be paid to preventing secondary pollution from oil spills.

4. Discussion

In order to isolate the contribution of wave, another scenario is to simulate the condition without wave, which is based on the case of Section 2.2.4. Figure 12 shows the track of oil spilt over 24 h and the swept area of the oil particles. It indicates that the swept area with waves is larger than that without waves. The relative swept areas (RSA = n o   w a v e w a v e   i n d u c e d w a v e     i n d u c e d ) are calculated by Figure 12b,d with maximum values of 6.29% and 3.57%, respectively. It indicated that wave directions are against or along with the current and affect the movement of oil particles. Compared with the process of an oil spill during the typhoon period and a real case scenario of the oil spill accident under the WWCI situation of Figure 5 and Figure 8, the oil spread distance is similar, indicating that the wave is slightly affecting the oil spill when the accident point is inside the channel. It is because, under a normal weather, inside the channel has excellent wave barrier which can mitigate wave attacks. It is therefore appropriate to ignore the impact of waves in the following simulation.
After analyzing the 5-year wind velocity data of summer (June, July, and August) and winter (December, January, and February) downloaded from ERA5, the mean wind rose charts of the typical months of August and December [58,59] are shown in Figure 13. It is evident that the SE (135°) in summer and the NW (315°) in winter are the main directions, with mean speeds of 3.36 m/s and 3.29 m/s, respectively. Meanwhile, the speed varies from month to month. To make this study more meaningful for future accident prevention and mitigation, we will next mainly study the influence of wind speed and direction on the oil spill.

4.1. Influence of Wind Direction

To assess the effects of wind direction, we simulated another two cases during the typhoon period with two typical directions of 135° and 315°, and the results are shown in Figure 14a,b. In the summer wind direction, a part of the oil spreads a little to the North Branch (NB) and the other part disperses along the SB, but the displacement distance is small. On the contrary, the winter wind moves the oil spill to the SB, and in the middle part of the trace, it is close to the shoreline of the SB, and the oil spill can reach the South Channel (SC). This phenomenon due to current direction, which is also an important factor. The summer wind is opposite the current, which decreases the oil particle movement with the current, resulting in diverging at the head of Chongming Island. The winter wind follows the current, but the oil trace shows a similar pattern to the real situation. However, due to the angle, the oil particles move close to Taicang and Chenhang. Near the Wusongkou, the suspended oil particles deposit in the indentation due to the simplified branches and then move along the shoreline. The oil spill affected area covers almost all of the SC.
In addition, the swept area variations for two typical wind directions are shown in Figure 14c. The summer wind covers an area of 19.34 km2, less than the winter wind’s 144.51 km2. Because the growth of the sweeping area does not follow the tidal current variation as in Section 3.2, it follows that the influence of wind on the lateral expansion of the oil spill is greater than that of tidal current by almost a factor 7.5, indicating that the winter wind direction of 315° causes more severe oil spill pollution in the YRE.

4.2. Effects of Different Wind Speeds

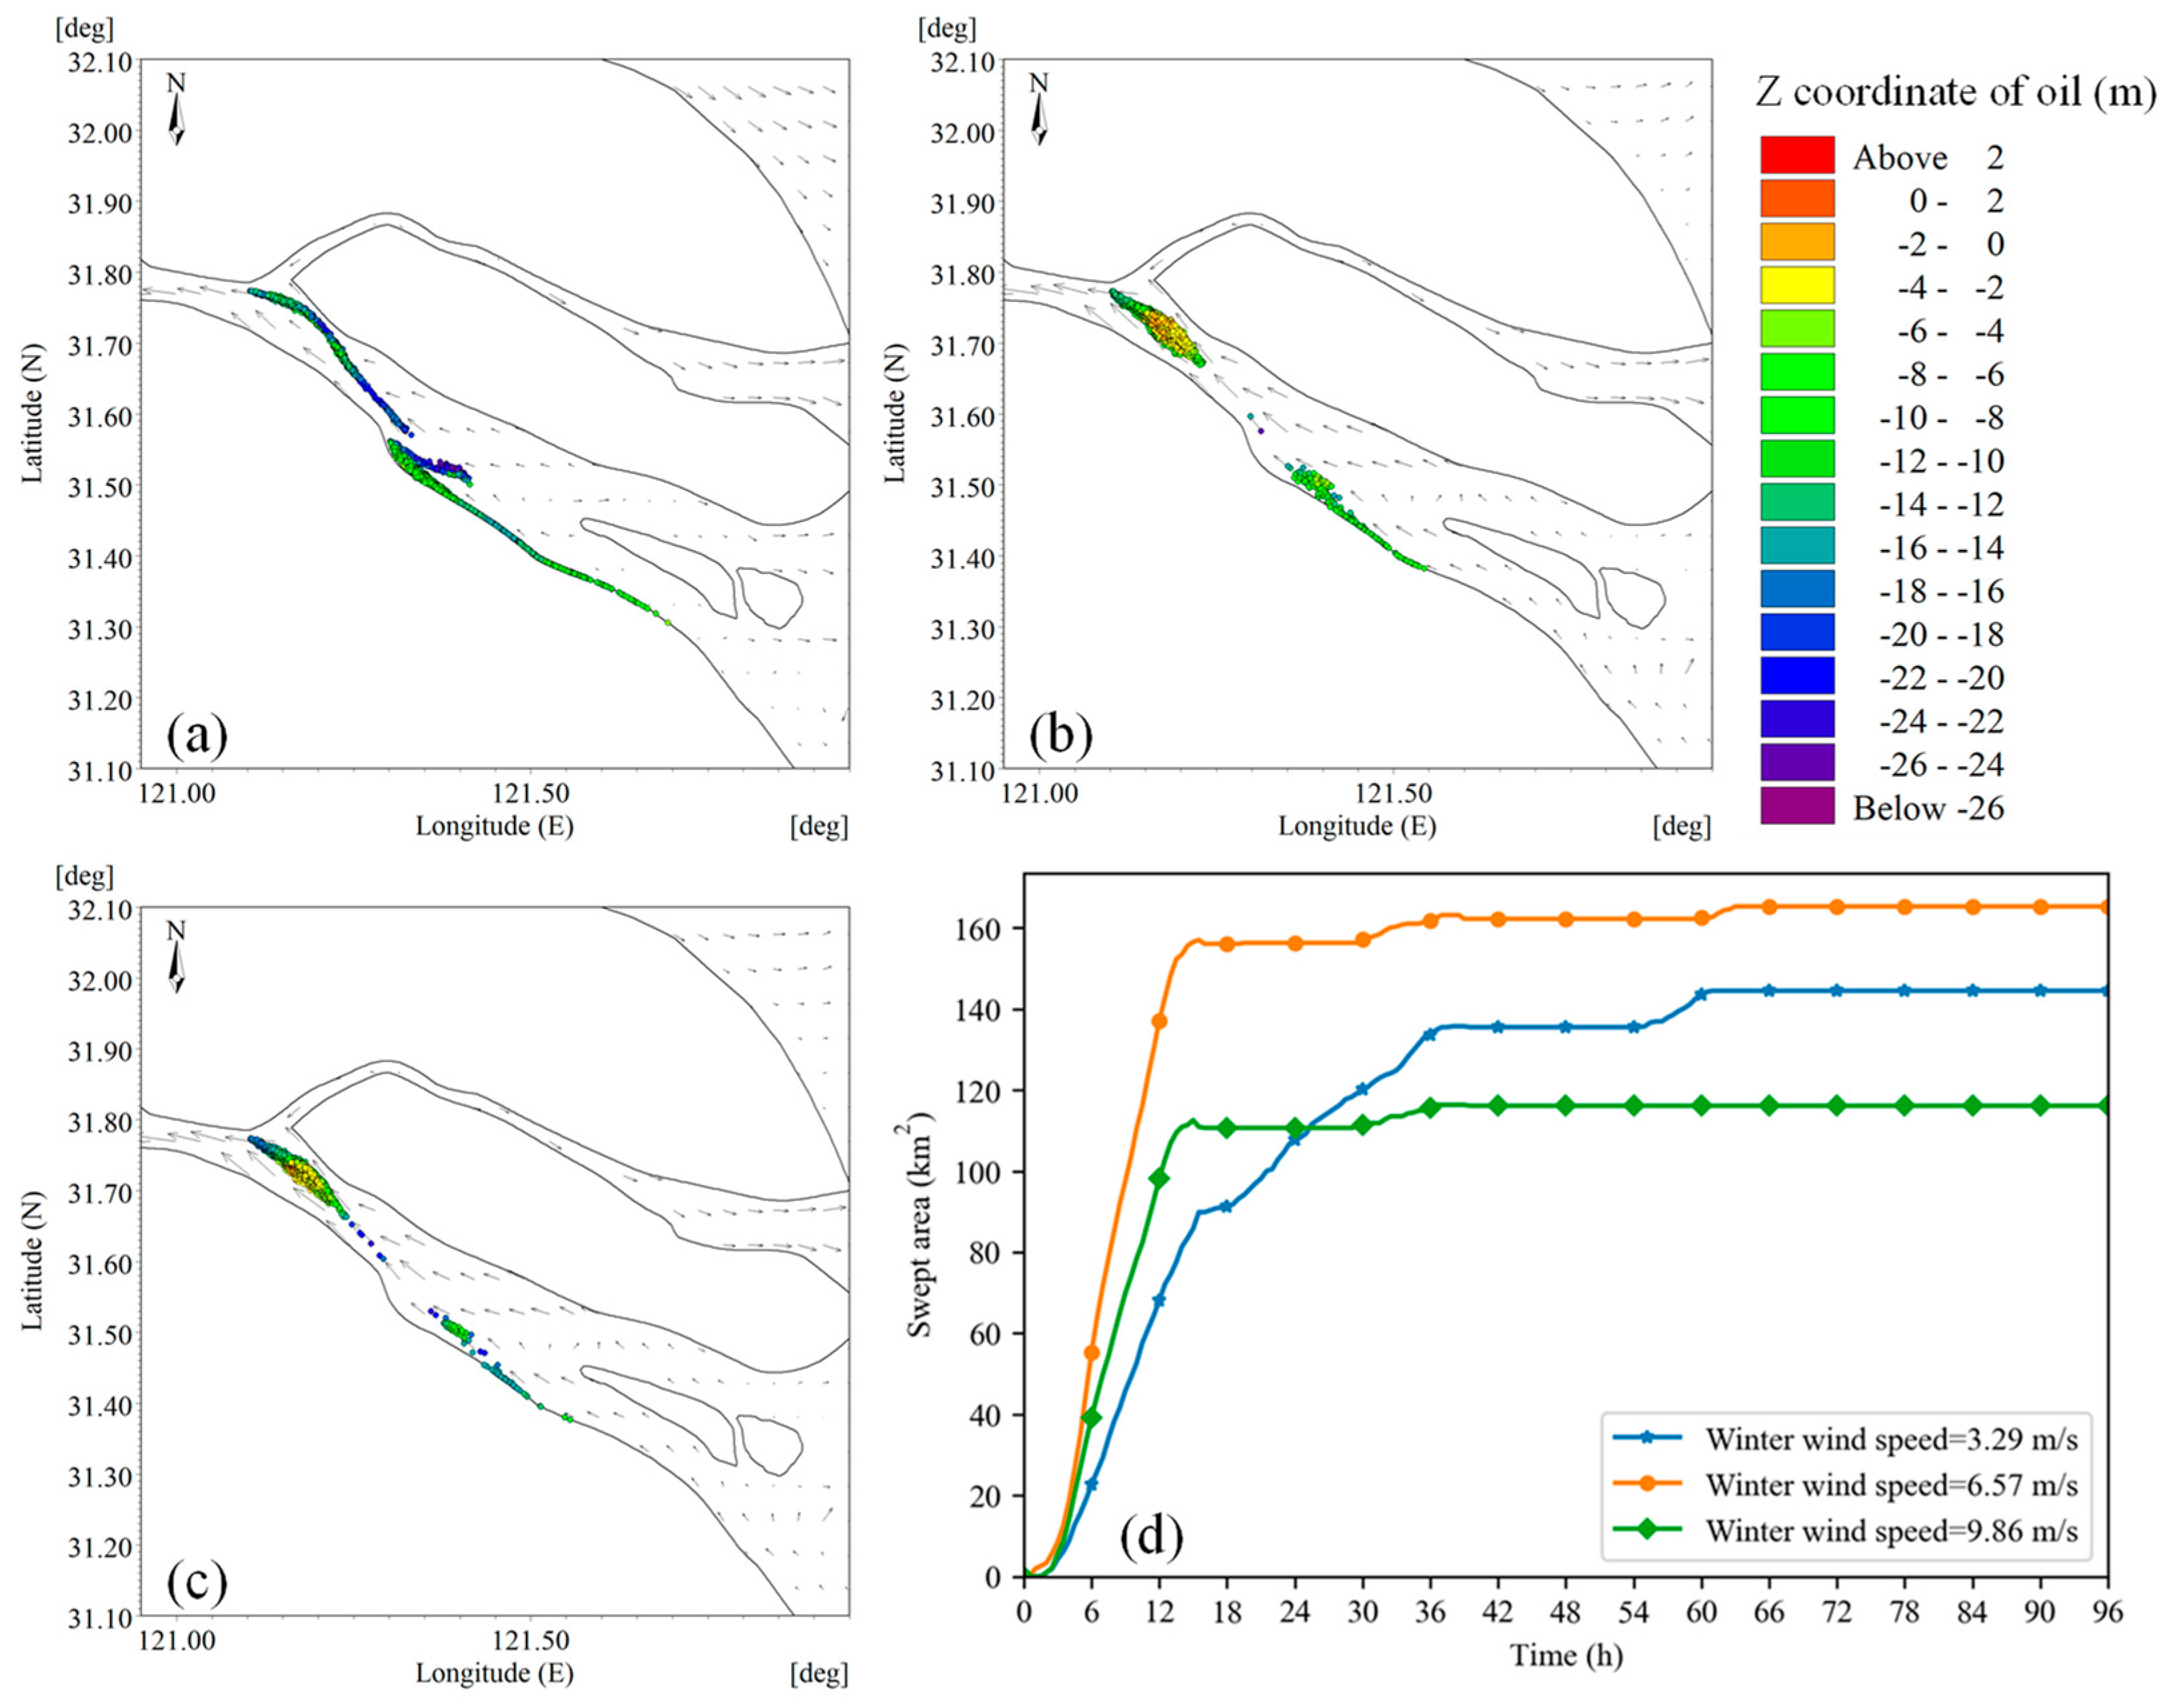
On the basis of what was mentioned before, we use twice and three times the average winter wind speed as the comparison case to investigate the wind speed influence on the oil spill. Figure 15 shows traces and swept areas under different wind speeds. As the wind speeds increase, the spread distance of oil particles becomes near zero, even cannot reach the SC (Figure 15c). Under the twice and three times speeds, the oil gathers more at the shallow area near the head of Chongming Island than in the normal situation because the contribution of wind is larger than that of current, moving the particles passing this area and deposit rapidly later on. Combined with Figure 15c, the twice wind speed has the biggest swept area and not the three times wind speed, meaning that increasing wind speed does not always increase the area. This interesting phenomenon may be explained by the coupled action of wind and current. Higher wind speeds can not only break the oil slick but also restrict the particles’ motion driven by current, stranding the oil at the Wusongkou.
A separation in the oil trajectory can be observed in Figure 15, especially from Figure 15b,c, to find out the single effect of wind and current in the oil transport. The current moves the oil particles into the deep channel where the oil will have more time to move and settle. Alternatively, the wind carries the oil particles along its direction, making oil particles more likely to move into shallow water depth depending on wind direction and settle more quickly. As is shown in Figure 15b,c, the separation part close to the oil spill site is a shallow area; most oil particles can concentrate in this area, while in Figure 15a, there is a line whose water depth is deeper.

4.3. Effects of Current Speeds

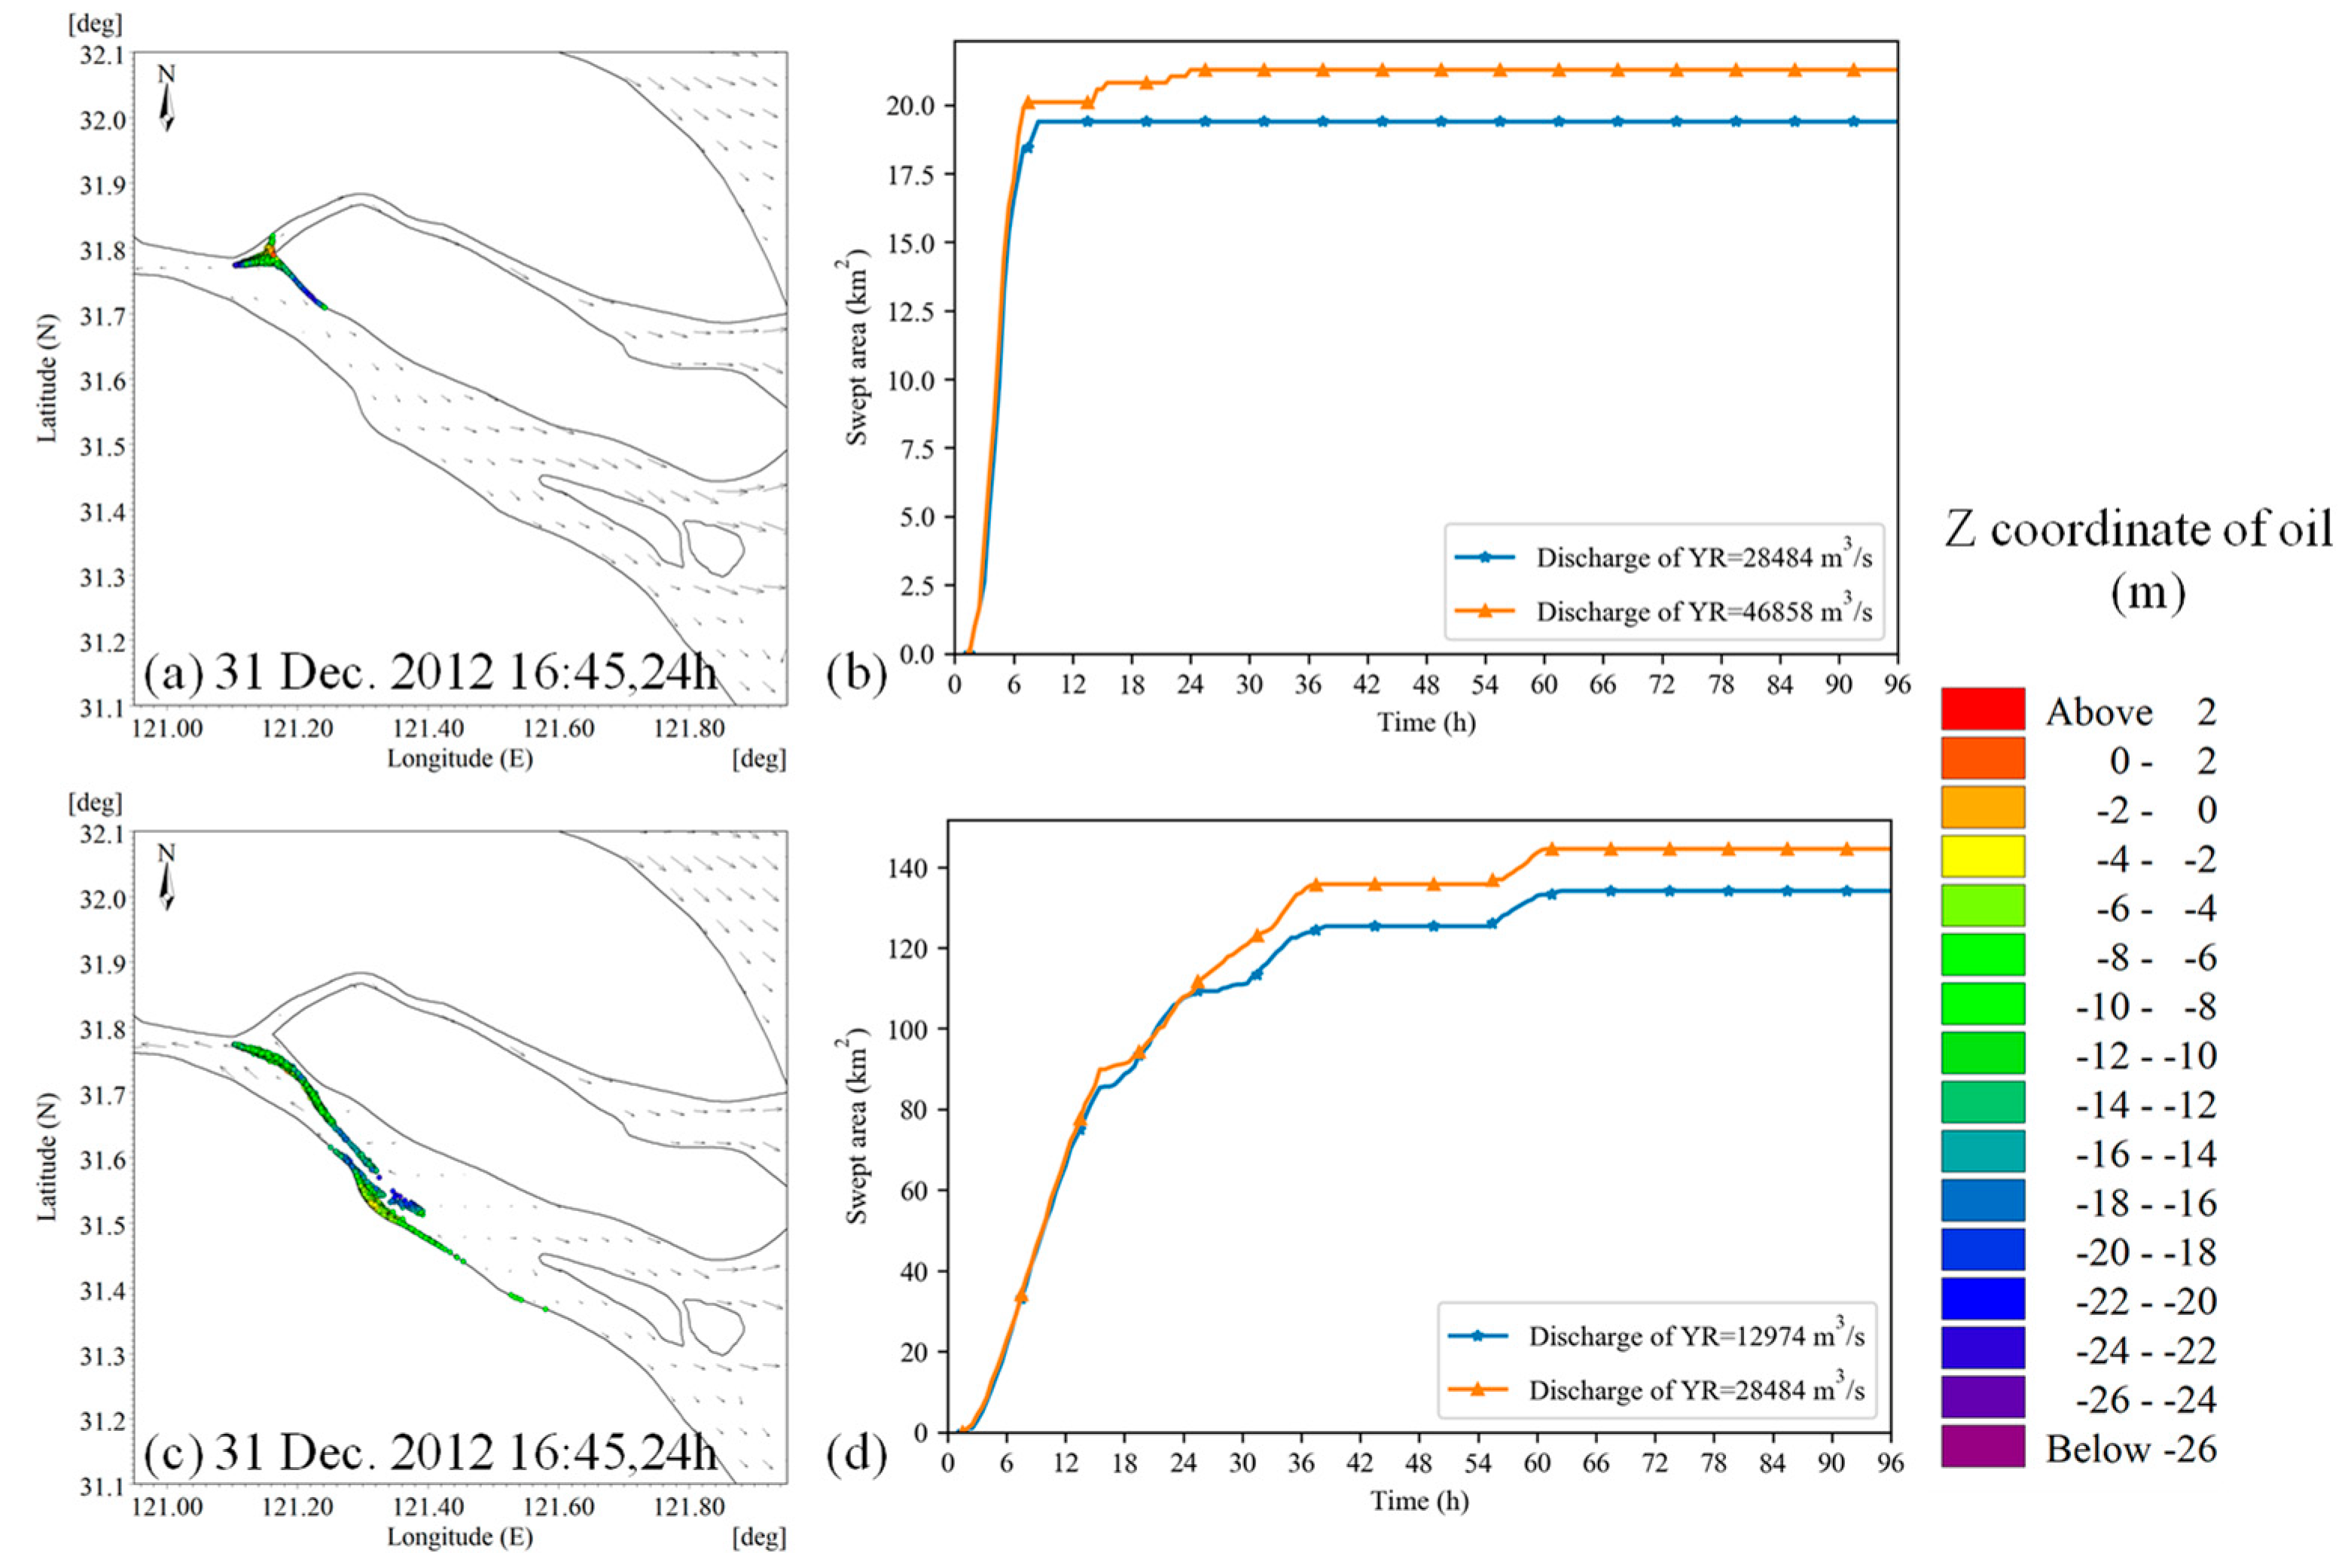
According to the statistics of the measured data at Datong station from 2004 to 2018, the peak flow appears in July and August, and the maximum flow is 46,858 m3/s; the valley flow appears in January and March of the dry season, and the minimum flow is 12,974 m3/s [60]. Due to the large variation of current in the YRE during the whole year, the current speeds are different in the dry season (winter) and wet season (summer).
Figure 16b,d shows the swept area with different river discharge in summer and winter. The RSA of Figure 16b,d are 8.88% and 7.20%, respectively. Both in winter and summer, the sea-swept area under high discharge is larger than that under low discharge. This is due to the fact that the current speed is faster during the ebb tide under conditions of high discharge, assuming that the channel width remains unchanged. Under the superposition of runoff and tidal current, the swept area is larger as the oil spill release time is at ebb tide.

5. Conclusions

In this study, the oil spills under different potential wind, current and wave situations in the Yangtze River Estuary are investigated by using the coupled wave and hydrodynamic module established by MIKE 21. The model is validated by measured water level, current velocity, and a real oil spill accident in the Yangtze River Estuary. A series of numerical experiments are conducted to study the effects of different factors and oil release positions and timing on the oil trace, swept area, and thickness, especially the influence of strong nonlinear wind-current-wave interaction during typhoon. The main findings are as follows:
(1)
In case the oil spill occurs when the typhoon lands. Due to the high waves and strong winds, the oil film dives faster under the action of wave breaking and entrainment, so that the oil spill at the water surface is only about 20% of the total. Most oil particles sink into the water columns towards the sea bed, it is therefore important to pay more attention to the cleaning of the seabed in a timely manner. If the mean wave direction is not against the current, the swept area is larger. In the case of small wind speeds, the influence of wave is slight. Even during the typhoon, wave directions affect not so large. For the oil spill that occurs after the typhoon, the current speed is large and can move the oil farther, which has a greater impact on the vulnerable area of the YRE. More timely and efficient measures should be taken to control the oil pollution.
(2)
Influence of wind direction: when only the summer wind is present only, the oil spill is relatively concentrated, and the affected area is limited because of the opposite current and wind direction. When the winter wind is present, which coincides with the current direction, the coupled action of wind and current can drive the oil farther, resulting in the swept area about seven times that during the summer.
(3)
The influence of wind speed: a stronger wind speed affects the movement of the oil film following the wind direction, instead of following the current to the deep trough. The oil film reaches the shallow water area and dive quickly, resulting in the separation and fragmentation of the oil film and increasing the uncertainty of the swept area prediction. Meanwhile, the wind will also make the oil film move closer to the shoreline, causing pollution in the coastal natural reserve and affecting water intake.
(4)
The influence of current speed: the impact area will be larger due to the superposition of runoff and tidal current.
This present study only considers one particular area under various wind, current and waves situations, especially during, before and after the typhoon period. There are still many vulnerable areas in the YRE where different current and wave conditions exist. Meanwhile, the vertical variation of oil sinks is also lacking due to 2D model simulation. In the future study, we will further examine the effect of an oil spill on other important areas in the YER under the influence of wind, wave and current interaction using a 3D model, forming a comprehensive theoretical reference for other regional estuaries to take efficient measures to prevent and mitigate oil spills.

Author Contributions

Conceptualization, C.K. and J.C.; methodology, C.K. and J.C.; software, J.W., J.F. and J.C.; validation, J.W.; writing—original draft preparation, J.C. and J.W.; writing—review and editing, C.K., R.Q. and Q.Z.; supervision, C.K., R.Q. and Q.Z.; funding acquisition, C.K., R.Q. and Q.Z. All authors have read and agreed to the published version of the manuscript.

Funding

This research was supported by the Interdisciplinary Project in Ocean Research of Tongji University (2022-2-ZD-04) and the Innovation Program of the Shanghai Municipal Education Commission (2021-01-07-00-07-E00093).

Institutional Review Board Statement

Not applicable.

Informed Consent Statement

Not applicable.

Data Availability Statement

Not applicable.

Acknowledgments

We are sincerely grateful to Fan Daidu for supporting the fieldwork and measuring data for the model validation. The last author has been supported by NERC grant NE/V006088/1.

Conflicts of Interest

The authors declare no conflict of interest.

References

  1. Pan, L.Z.; Lin, X.B.; Chang, J.F.; Zheng, X.Q.; Lv, X.; Wang, X.X.; Li, Y.S. Characteristics and Implications of Ship Oil-Spill Accidents in Changjiang Estuary and Coastal Areas of Shanghai Port. Trans. Oceanol. Limnol. 2016, 5, 37–43. [Google Scholar] [CrossRef]
  2. Li, Y.; Yang, Y.Q.; Pan, Q.Q. Review on the oil spill numerical forecasting technology. Mar. Forecast. 2017, 34, 89–98. [Google Scholar]
  3. Jin, G. Numerical Simulation of Oil Spill Based on Three-dimensional Tidal Flow Field; Dalian Maritime University: Dalian, China, 2019. [Google Scholar]
  4. Yang, H. The Study of Ecological Risk Zoning and Emergency Countermeasures of Oil Spills on Shanghai Ocean Area; Shanghai Ocean University: Shanghai, China, 2014. [Google Scholar]
  5. Alea, C.; Ruiz, C.I.; Yap, J.B.; Molina, E.F.; Saballa, A.J.; Ñuneza, J.S.; Bacharo, K.B.B. An Investigation of Aquatic Oil Spills in the Philippines from 2000 to 2021. Mar. Pollut. Bull. 2022, 185, 114241. [Google Scholar] [CrossRef] [PubMed]
  6. Malcolm, L. Spaulding State of the Art Review and Future Directions in Oil Spill Modeling. Mar. Pollut. Bull. 2017, 115, 7–19. [Google Scholar] [CrossRef]
  7. Fu, H.R. Study on the Submerging Mechanism of Floating Oil under Wave Action and Dispersant Treatment Technology; Dalian Maritime University: Dalian, China, 2020. [Google Scholar]
  8. Jiang, W.X. Study on the Simulation of Accidental Oil Spill in the Huangpu River; Tongji University: Shanghai, China, 2007. [Google Scholar]
  9. Lou, S.; Liu, S.G. Review in Theory and Study of Oil Spill Models. Environ. Sci. Manag. 2008, 10, 33–37+61. [Google Scholar]
  10. Liu, Z.K.; Chen, Q.; Zheng, C.; Han, Z.H.; Cai, B.P.; Liu, Y.H. Oil Spill Modeling of Chengdao Oilfield in the Chinese Bohai Sea. Ocean Eng. 2022, 255, 111422. [Google Scholar] [CrossRef]
  11. Liu, Z.K.; Chen, Q.; Zhang, Y.W.; Zheng, C.; Cai, B.P.; Liu, Y.H. Research on Transport and Weathering of Oil Spills in Jiaozhou Bight, China. Reg. Stud. Mar. Sci. 2022, 51, 102197. [Google Scholar] [CrossRef]
  12. Gu, J.H.; Zhu, J.R.; Jin, Z. Numerical simulation of oil film drift and diffusion after oil spill accident at the Baosteel wharf in the Changjiang Estuary. J. Trop. Oceanogr. 2022, 41, 159–170. [Google Scholar]
  13. Gui, Q.; Shi, Y.P.; Chen, J.H. Risk analysis of oil spills in Yangtze River Estuary on water intake of Dongfengxisha Reservoir. Yangtze River 2012, 43, 78–81. [Google Scholar] [CrossRef]
  14. Chen, H.; Lu, S.Q.; Shao, Y.P.; Wang, B.; Liu, Y. Study on oil spill risk zoning in the Yangtze River Estuary based on the visited probability method of sensitive targets. J. Environ. Eng. Technol. 2023, 13, 47–53. [Google Scholar] [CrossRef]
  15. Chen, Y.Z. Development and application of water pollution emergency response system in Yangtze River Estuary. Yangtze River 2013, 44, 5–9. [Google Scholar] [CrossRef]
  16. Huang, S.F. Study on Ecological Environmental Impact Assessment and Remediation Technical Scheme of Oil Spill Accident in Changjiang Estuary; Shanghai Academy of Environmental Sciences: Shanghai, China, 2015. [Google Scholar]
  17. Chen, S.Q. Three-Dimensional Numerical Simulation of the Influence of Accident-Induced Oil Film on the Water Source in Huangpu River and Changjiang Estuary; East China Normal University: Shanghai, China, 2012. [Google Scholar]
  18. Li, S.S.; Li, R.J.; Feng, Q.; Xiao, Q.L. Numerical simulation of oil spill risk in sea area near Gouqi Island in Yangtze River estuary. Yangtze River 2014, 45, 65–69. [Google Scholar] [CrossRef]
  19. Li, Y.S.; Pan, L.Z. Numerical simulation of oil spill trajectory in Yangtze River estuary. J. Shanghai Ocean Univ. 2014, 23, 238–244. [Google Scholar]
  20. Yin, J.; Chen, Z.Z.; Liang, S.S. Numerical Simulation of Oil Spill Accident Influence on Drinking Water Source of Qingcaosha Reservoir in Yangtze Estuary Region. Water Purif. Technol. 2014, 33, 41–48+77. [Google Scholar] [CrossRef]
  21. Yang, H.; Liu, C.X.; Li, Y.S.; Ding, L.L. Numerical simulation of oil-spill in the south channel of the stuary Yangtze River estuary. Mar. Sci. Bull. 2013, 32, 345–351. [Google Scholar]
  22. Yang, H.; Liu, C.X.; Li, Y.S.; Pan, L.Z.; Ding, L.L. Simulation of oil spill in anchorage out of Yangtze River Estuary based on GNOME. J. Shanghai Ocean Univ. 2013, 22, 384–390. [Google Scholar]
  23. Niu, Q.; Xia, M. The Role of Wave-Current Interaction in Lake Erie’s Seasonal and Episodic Dynamics. J. Geophys. Res. Ocean. 2017, 122, 7291–7311. [Google Scholar] [CrossRef]
  24. Wang, J.; Kuang, C.P.; Chen, K.; Fan, D.D.; Qin, R.F.; Han, X.J. Wave–Current Interaction by Typhoon Fongwong on Saline Water Intrusion and Vertical Stratification in the Yangtze River Estuary. Estuar. Coast. Shelf Sci. 2022, 279, 108138. [Google Scholar] [CrossRef]
  25. Zou, Q.; Chen, H. Wind and Current Effects on Extreme Wave Formation and Breaking. J. Phys. Oceanogr. 2017, 47, 1817–1841. [Google Scholar] [CrossRef]
  26. Chen, H.; Zou, Q. Geometry of Deep and Intermediate Water Breaking Waves Influenced by Wind Speed and Direction. Phys. Fluids 2022, 34, 087126. [Google Scholar] [CrossRef]
  27. Olabarrieta, M.; Warner, J.C.; Kumar, N. Wave-Current Interaction in Willapa Bay. J. Geophys. Res. Ocean. 2011, 116, C12014. [Google Scholar] [CrossRef] [Green Version]
  28. Chen, H.; Zou, Q. Characteristics of Wave Breaking and Blocking by Spatially Varying Opposing Currents. J. Geophys. Res. Oceans 2018, 123, 3761–3785. [Google Scholar] [CrossRef]
  29. Chen, H.; Zou, Q. Effects of Following and Opposing Vertical Current Shear on Nonlinear Wave Interactions. Appl. Ocean Res. 2019, 89, 23–35. [Google Scholar] [CrossRef]
  30. Xie, D.; Zou, Q.; Cannon, J.W. Application of SWAN+ADCIRC to Tide-Surge and Wave Simulation in Gulf of Maine during Patriot’s Day Storm. Water Sci. Eng. 2016, 9, 33–41. [Google Scholar] [CrossRef] [Green Version]
  31. Zou, Q.; Xie, D. Tide-Surge and Wave Interaction in the Gulf of Maine during an Extratropical Storm. Ocean Dyn. 2016, 66, 1715–1732. [Google Scholar] [CrossRef]
  32. Gong, W.; Chen, Y.; Zhang, H.; Chen, Z. Effects of Wave–Current Interaction on Salt Intrusion During a Typhoon Event in a Highly Stratified Estuary. Estuaries Coasts 2018, 41, 1904–1923. [Google Scholar] [CrossRef]
  33. Wu, L.; Wang, B.; Geng, S. Growing Typhoon Influence on East Asia. Geophys. Res. Lett. 2005, 32, L18703. [Google Scholar] [CrossRef] [Green Version]
  34. Xia, M.Y.; Xu, F.M.; Wen, Y.C. Study of storm surge distribution along the Yangtze River and Estuary under different typhoon tracks. Ocean Eng. 2022, 40, 115–122. [Google Scholar] [CrossRef]
  35. Xu, M.; Chang, C.P.; Fu, C.; Qi, Y.; Robock, A.; Robinson, D.; Zhang, H. Steady Decline of East Asian Monsoon Winds, 1969–2000: Evidence from Direct Ground Measurements of Wind Speed. J. Geophys. Res. Atmos. 2006, 111, D24111. [Google Scholar] [CrossRef] [Green Version]
  36. Yihui, D. Monsoons over China; Springer: Dordrecht, The Netherlands, 1994; ISBN 978-90-481-4161-6. [Google Scholar]
  37. Hydrodynamic and Transport Module Scientific Documentation, MIKE 21 FLOW MODEL FM; MIKE by DHI: Copenhagen, Denmark, 2014.
  38. Kuang, C.P.; Chen, K.; Wang, J.; Wu, Y.L.; Liu, X.; Xia, Z.L. Responses of Hydrodynamics and Saline Water Intrusion to Typhoon Fongwong in the North Branch of the Yangtze River Estuary. Appl. Sci. 2021, 11, 8986. [Google Scholar] [CrossRef]
  39. Sleigh, P.A.; Gaskell, P.H.; Berzins, M.; Wright, N.G. An unstructured finite-volume algorithm for predicting flow in rivers and estuaries. Comput. Fluids 1998, 27, 479–508. [Google Scholar] [CrossRef]
  40. Hersbach, H.; Bell, B.; Berrisford, P.; Hirahara, S.; Horányi, A.; Muñoz-Sabater, J.; Nicolas, J.; Peubey, C.; Radu, R.; Schepers, D.; et al. The ERA5 Global Reanalysis. Q. J. R. Meteorol. Soc. 2020, 146, 1999–2049. [Google Scholar] [CrossRef]
  41. Oil Spill Model User Guide, MIKE-21/3 Oil Spill; MIKE by DHI: Copenhagen, Denmark, 2014.
  42. Particle Tracking Module Scientific Documentation, MIKE 21 & MIKE 3 FLOW MODEL FM; MIKE by DHI: Copenhagen, Denmark, 2014.
  43. Al-Rabeh, A.H. Estimating Surface Oil Spill Transport Due to Wind in the Arabian Gulf. Ocean Eng. 1994, 21, 461–465. [Google Scholar] [CrossRef]
  44. Mackay, D.; Paterson, S.; Trudel, K.; Reed, M.; Johansen, Ø.; Brandvik, P.; Daling, P.; Lewis, A.; Fiocco, R.; Prentki, R. A Mathematical Model of Oil Spill Behaviour. Environment Canada Report EE7; Environmental Protection Service: Ottawa, ON, Canada, 1980. [Google Scholar]
  45. Fingas, M. The Evaporation of Oil Spills: Prediction of Equations Using Distillation Data. Spill Sci. Technol. Bull. 1996, 3, 191–192. [Google Scholar] [CrossRef]
  46. Fingas, M.F. Studies on the Evaporation of Crude Oil and Petroleum Products: I. the Relationship between Evaporation Rate and Time. J. Hazard. Mater. 1997, 56, 227–236. [Google Scholar] [CrossRef]
  47. Fingas, M.F. Modeling Evaporation Using Models That Are Not Boundary-Layer Regulated. J. Hazard. Mater. 2004, 107, 27–36. [Google Scholar] [CrossRef] [PubMed]
  48. Xie, H.; Yapa, P.D.; Nakata, K. Modeling Emulsification after an Oil Spill in the Sea. J. Mar. Syst. 2007, 68, 489–506. [Google Scholar] [CrossRef]
  49. Sebastião, P.; Guedes Soares, C. Modeling the Fate of Oil Spills at Sea. Spill Sci. Technol. Bull. 1995, 2, 121–131. [Google Scholar] [CrossRef]
  50. Delvigne, G.A.L.; Sweeney, C.E. Natural Dispersion of Oil. Oil Chem. Pollut. 1988, 4, 281–310. [Google Scholar] [CrossRef]
  51. Shen, H.T.; Yapa, P.D.; Wang, D.S.; Yang, X.Q. A Mathematical Model for Oil Slick Transport and Mixing in Rivers; Cold Regions Research and Engineering Lab.: Hanover, NH, USA, 1993. [Google Scholar]
  52. Xie, F.; Yan, H.Y.; Wang, X.H. Numerical Simulation Research and Application of Oil Spill Accident in Taicang Section of the South Branch of the Yangtze River Estuary. China Resour. Compr. Util. 2021, 39, 65–69. [Google Scholar]
  53. Huang, R.; Han, L.X.; Zhang, F.X. Numerical Modelling of Oil Spill Accidents in the Yangtze River. J. Yangtze River Sci. Res. Inst. 2019, 36, 9–13. [Google Scholar] [CrossRef]
  54. Wu, J. Study on Pollution Stress and Ecological Damage Assessment of Oil Spill in Estuarine Tidal Flat Ecosystem; East China Normal University: Shanghai, China, 2017. [Google Scholar]
  55. Zhao, C. Accident Investigation about Self Sink of MV “Shanhong 12” on 30th December in Jiangsu. China Marit. Safety 2015, 2, 43. [Google Scholar]
  56. Du, N.; Zhang, R.B.; Wei, F.S. Thoughts on Repairing Baimaosha Water Area after Oil Spill Accident. China Water Resour. 2015, 4, 45–46. [Google Scholar]
  57. Zhang, X.; Li, D.Y. Research on density correction method of ship fuel. Ship Sci. Technol. 2021, 43, 126–128. [Google Scholar]
  58. Dai, R.; Zhu, J.R. Statistical analysis of the wind at the Chongming eastern beach. J. East China Norm. Univ. (Nat. Sci.) 2015, 4, 17–25. [Google Scholar] [CrossRef]
  59. Wu, Q.Y. Characteristics and Variation Trend of Wind and Waves in the Yangtze Estuary and Adjacent Seas over the Past 40 Years; East China Normal University: Shanghai, China, 2020. [Google Scholar]
  60. Fan, M.Y.; Li, J.H.; Wan, Y.Y.; Guo, H. Effect of runoff change on hydrodynamic characteristics of the Yangtze River estuary. Ocean Eng. 2020, 38, 81–90. [Google Scholar] [CrossRef]
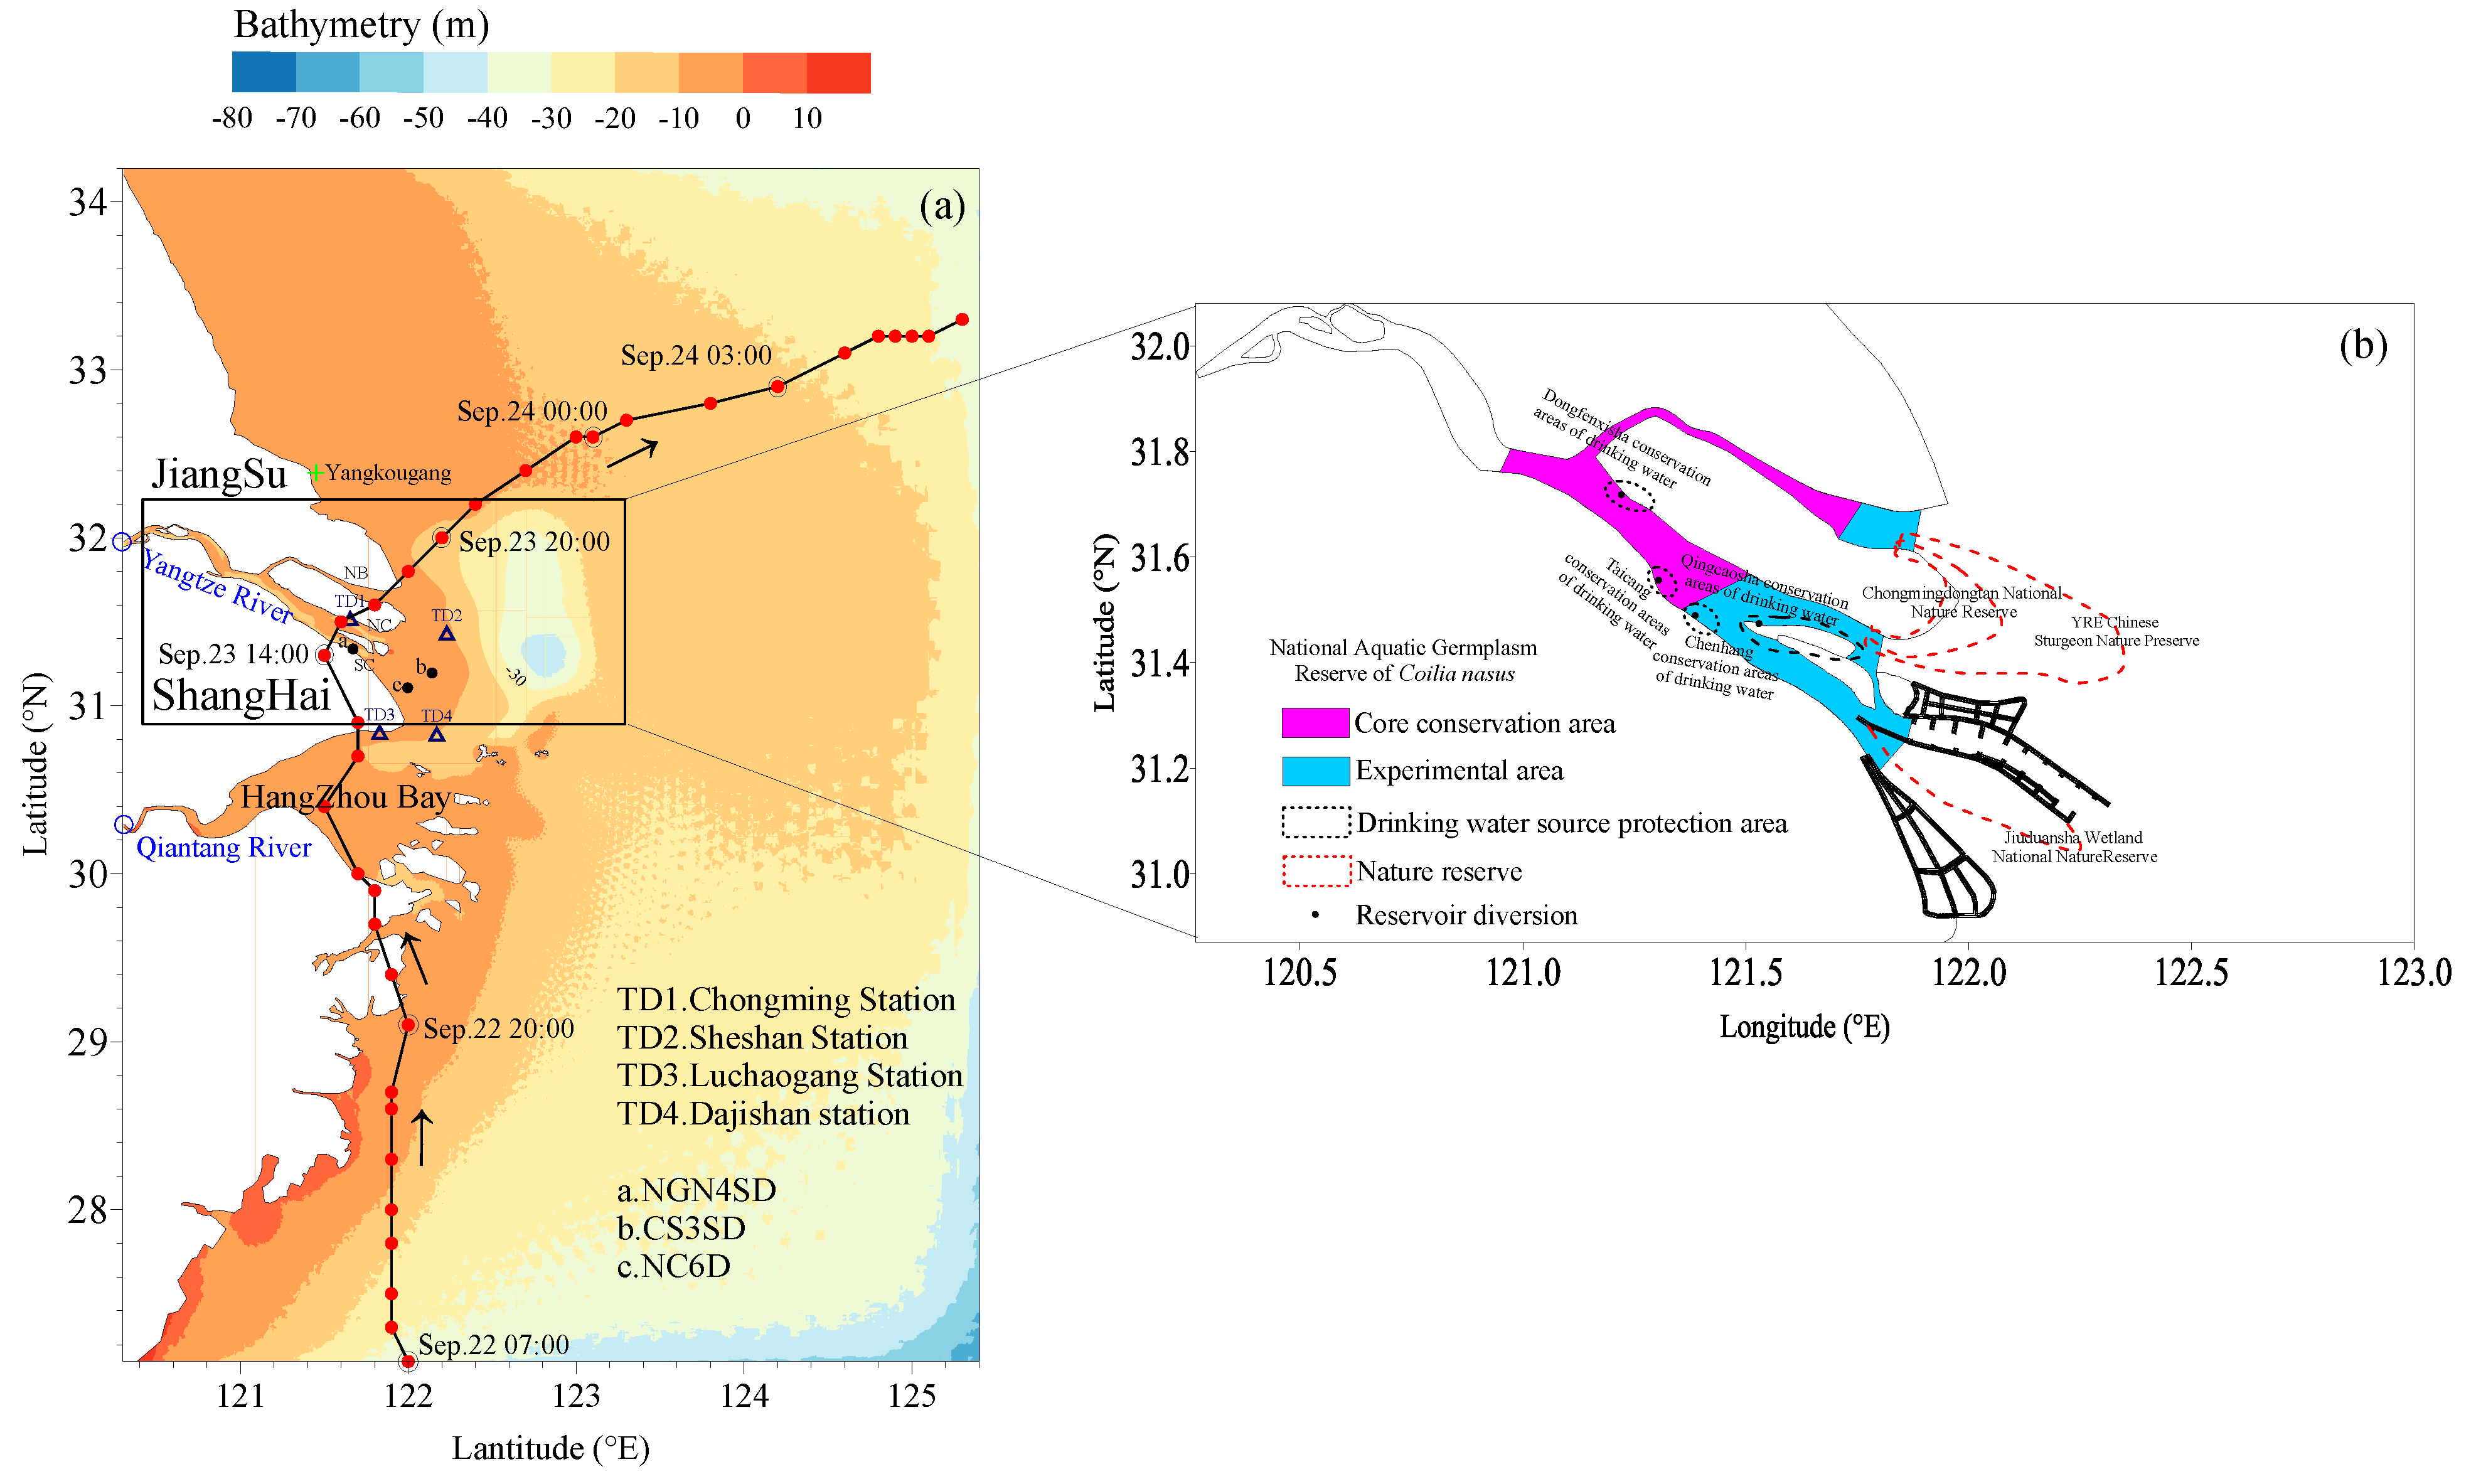
Figure 1. (a) Study area (the red circles represent the typhoon track center; the black arrows guide the typhoon’s move direction; the black circles, blue triangles, and green cross indicate the field stations of current, water level, and wave); (b) the major environmental area of the YRE vulnerable of oil spills.
Jmse 11 00494 g001
Figure 2. Study area and mesh. (a) the whole unstructured mesh of the model lies between a latitude of 26.9° and 34.4° N and a longitude of 120.2° to 125.6° E; (b) the finer mesh in the South Branch (SB) of Yangtze River.
Jmse 11 00494 g002
Figure 3. The verification of (a) current speed and direction; (b) water level and (c) significant wave height and wave period.
Jmse 11 00494 g003
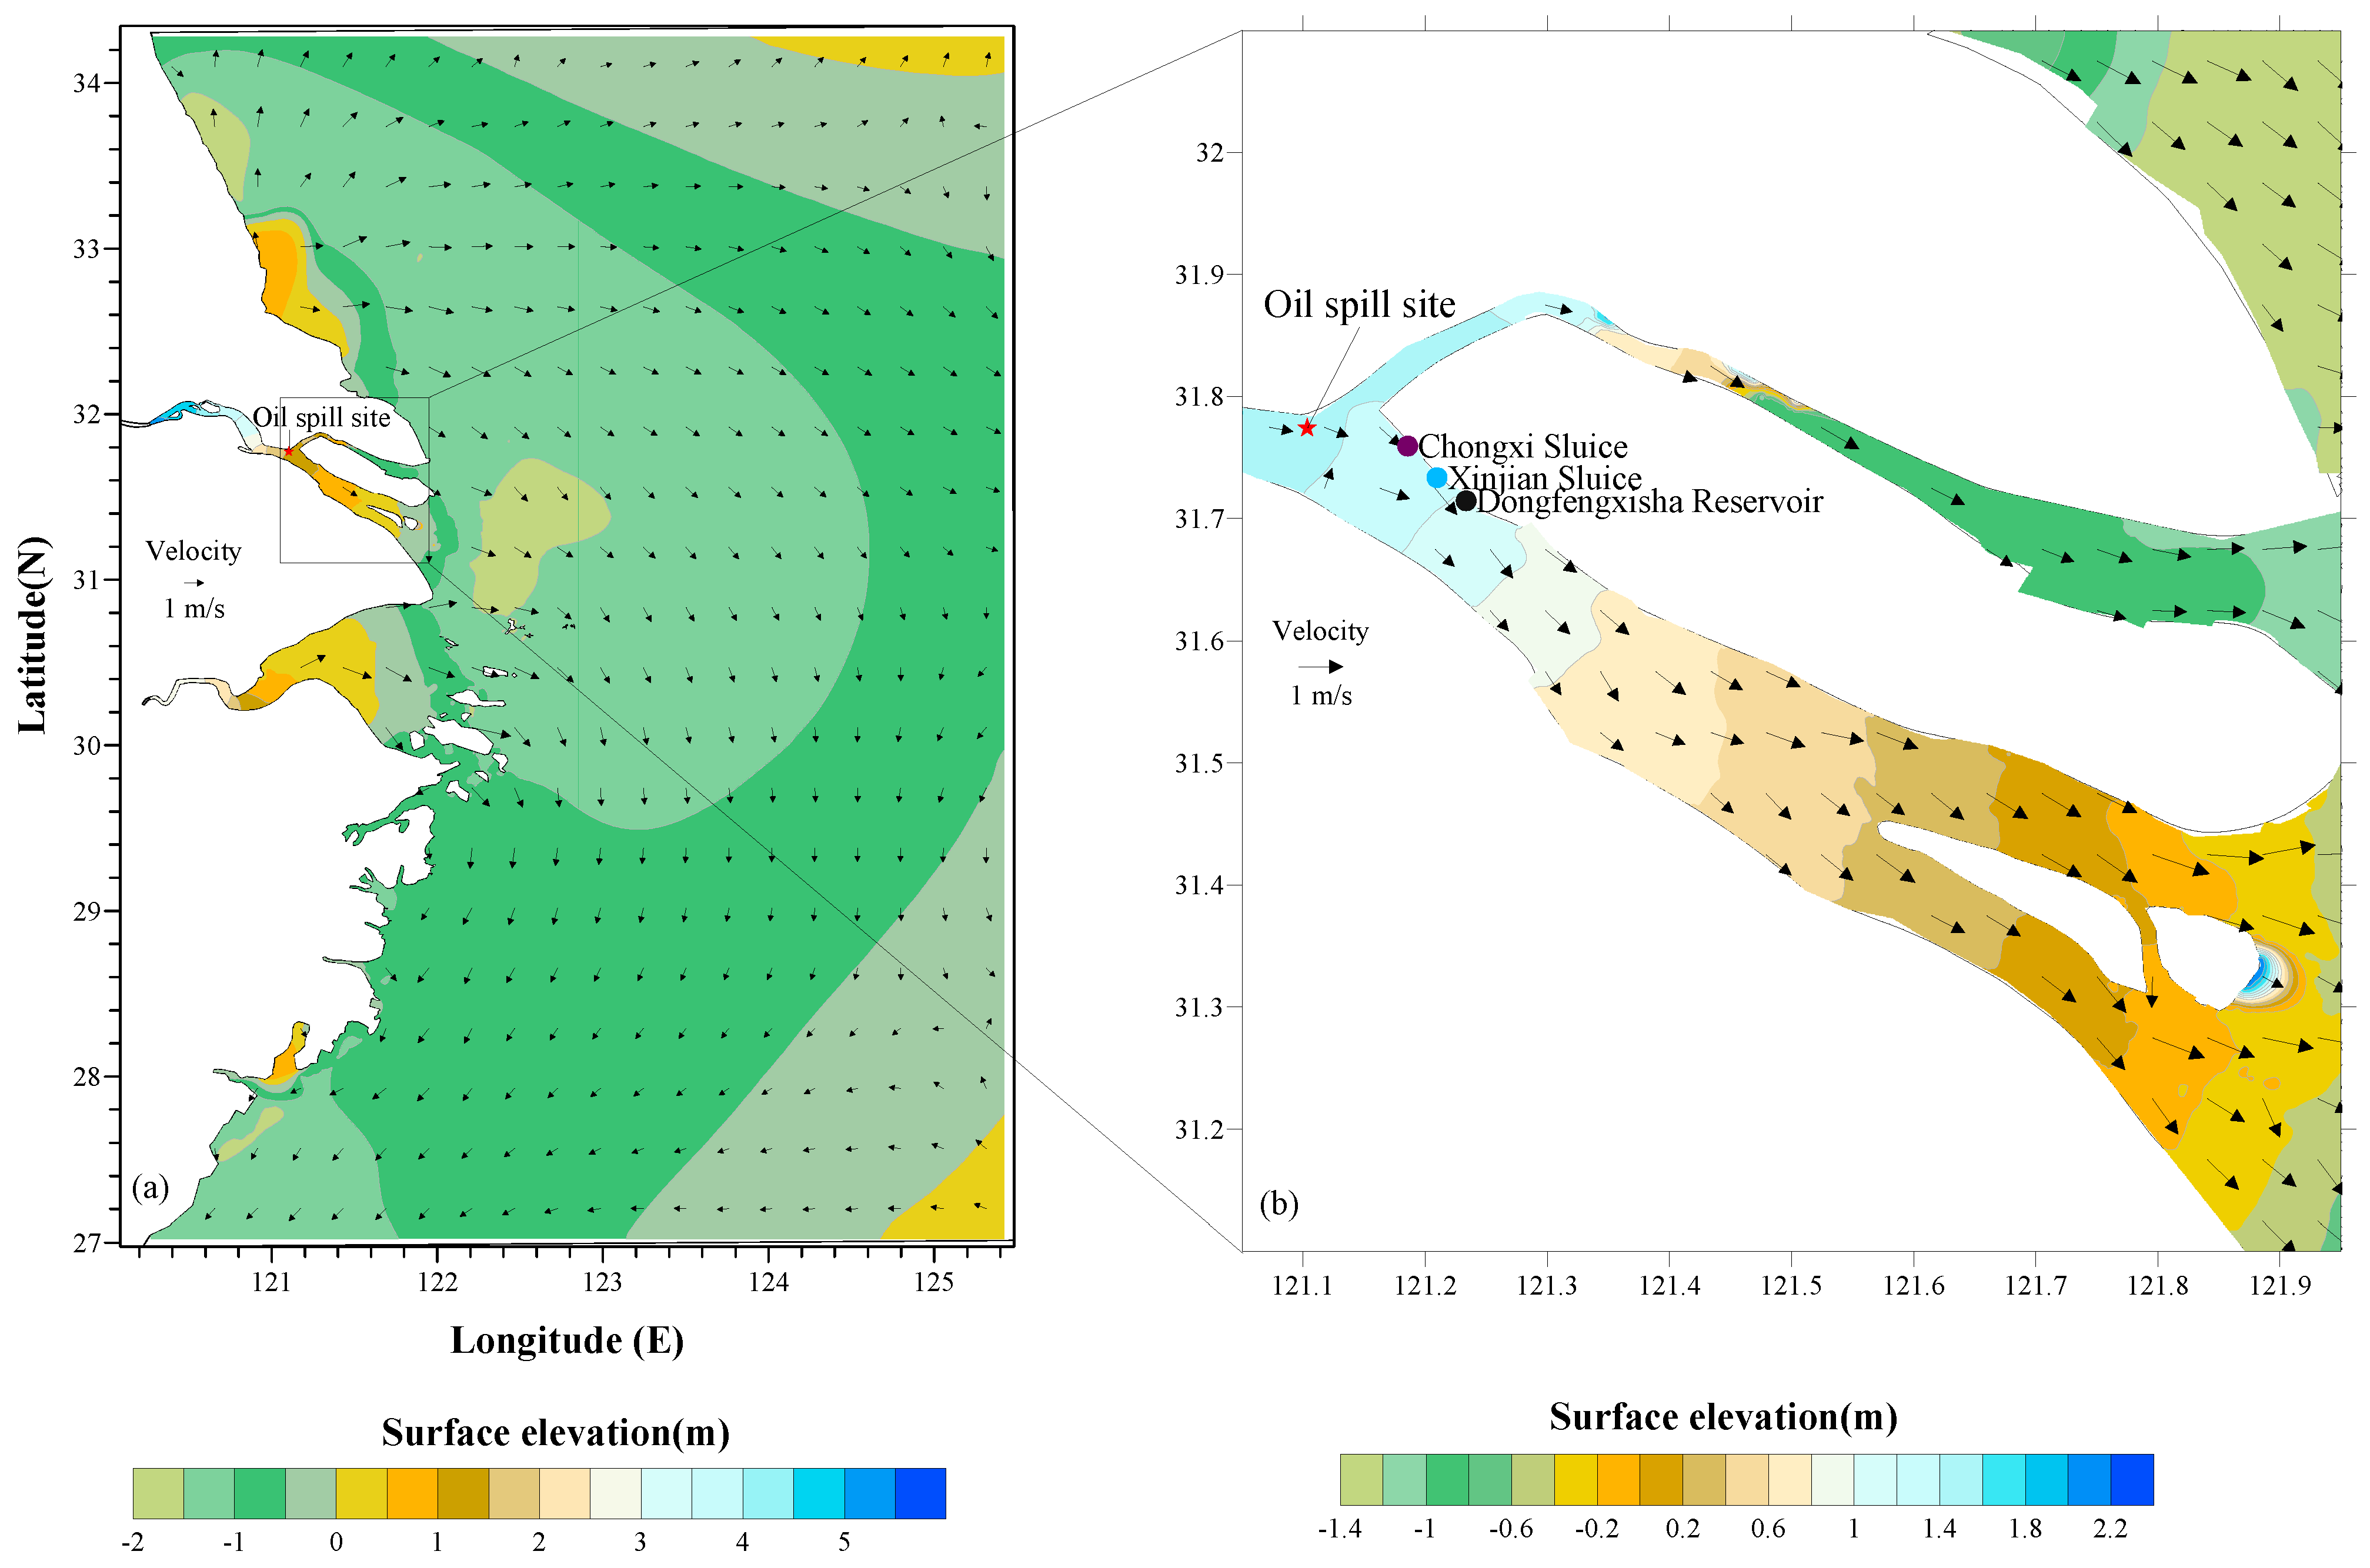
Figure 4. (a) The ebb current field; (b) the oil spill site and 3 main sensitive areas.
Jmse 11 00494 g004
Figure 5. (af) Time evolution of oil particle track within 24 h after the accident which was at 16:45 on 30 December 2012 in the YRE. The color of circles indicates the mass of volatile oil fractions whose weight is below 160 g/mol, boiling point well below 300 °C.
Jmse 11 00494 g005
Figure 6. Time history of (a) surface elevation, (b) wind velocity, (c) significant wave height (SWH) and (d) current speed. The blue, orange and green shadow color means before, during and after typhoon. The star, upper triangular, and diamond markers in (a) correspond to the simulation start times shown in Table 3.
Jmse 11 00494 g006
Figure 7. (af) Time evolution of oil particle track within 37 h starting at 23:00 on 19 September 2014 before Typhoon Fongwong affected the YRE. The color of circles indicates the mass of volatile oil fractions whose weight is below 160 g/mol, boiling point well below 300 °C.
Jmse 11 00494 g007
Figure 8. (af) Time evolution of oil particle tracks within 36 h starting at 1:00 on 23 September 2014 during Typhoon Fongwong affected the YRE. The color of circles means the mass of volatile oil fractions whose weight is below 160 g/mol, boiling point well below 300 °C.
Jmse 11 00494 g008
Figure 9. (af) Time evolution of oil particle track within 41 h starting at 2:00 on 25 September 2014 after Typhoon Fongwong affected the YRE. The color of circles indicates the mass of volatile oil fractions whose weight is below 160 g/mol, boiling point well below 300 °C.
Jmse 11 00494 g009
Figure 10. Time evolution of swept area (km2) before, during, and after typhoon. Time is the hour after the release of the oil spill.
Jmse 11 00494 g010
Figure 11. Thickness of oil slick near 3 main sensitive areas in the 36 h after oil spill. (ac) represent slick thickness with time before, during and after typhoon, respectively.
Jmse 11 00494 g011
Figure 12. (a,c) oil particle tracks during typhoon and real accident, respectively. Furthermore, (b,d) the swept areas (km2) of simulation, including wave or without wave, corresponding to (a,b). The inserted plots are the wave-rose charts after oil spills in 24 h, and the SWH and mean wave direction of (b,d) are 0.35 m, 70.63°, and 0.11 m, 274.67°, respectively. The color of circles indicates the z coordinate of oil particles.
Jmse 11 00494 g012
Figure 13. Five-year mean wind rose charts for the YRE in August and December, and in each direction of the polar coordinates, the frequency of the wind direction is expressed by the length of the polar coordinates. At the same time, the distribution of wind speed in different wind directions is expressed by the color change from deep to shallow.
Jmse 11 00494 g013
Figure 14. (a,b) oil particle trajectories under the influence of summer and winter monsoon, respectively; (c) swept area (km2) change with two wind directions. The color of circles indicates the z coordinate of oil particles.
Jmse 11 00494 g014
Figure 15. (ac) oil particle trajectories under the influence of wind speeds of 3.29 m/s, 6.57 m/s, and 9.86 m/s, respectively; (d) swept area (km2) change with three different wind speeds. The color of circles indicates the z coordinate of oil particles.
Jmse 11 00494 g015
Figure 16. (a,c) oil tracks after oil spill in 24 h under summer discharge of 46,858 m3/s and winter discharge of 12,974 m3/s, respectively; (b,d) swept areas change with different discharges in summer and winter. The color of circles indicates the z coordinate of oil particles.
Jmse 11 00494 g016
Table 1. Main technical data of ships.
NameValue
Ship nameShanhong 12
Port of registryBengbu, Anhui Province, China
TypeOil tanker
Tonnage336 tons for gross tonnage and 188 tons for net tonnage
Main enginesOne for 200 kW
Table 2. Simulation conditions.
Operating ParametersSpecific Descriptions
Simulation time30 December 2012–2 January 2013
Environment conditionHistorical wind, current, and wind-driven wave fields data
Scene settingSpill site (121.11° E, 31.77° N); continuous oil spill; 4000 oil particles; spill volume of 400 tons; horizontal dispersion coefficient of 1 m2/s; vertical dispersion coefficient of 0.15 m2/s
Table 3. Specific time interval of simulation.
Simulation Start TimePeriod
19 September 2014 23:00Before typhoon
23 September 2014 01:00During typhoon
25 September 2014 02:00After typhoon
Disclaimer/Publisher’s Note: The statements, opinions and data contained in all publications are solely those of the individual author(s) and contributor(s) and not of MDPI and/or the editor(s). MDPI and/or the editor(s) disclaim responsibility for any injury to people or property resulting from any ideas, methods, instructions or products referred to in the content.