Abstract
Microplastics (MPs) are found to be omnipresent in marine environments and their production and disposal are constantly increasing. In order to control and mitigate their negative effects on the environment, it is important to understand the processes involved in their transport and sinking. Most of the conducted experimental studies on MP in water have focused on exploring the settling behavior of MP particles under static flow conditions. This paper presents the results of an experimental study of MP particles in a horizontal stream of water. A series of laboratory experiments were carried out to measure the drag coefficient of quasi-radially-symmetric MP particles with different shapes (spheres, cubes, and crosses) and sizes (1.5 to 3.0 mm). In the study, the relationship between the drag coefficient and flow conditions represented by the local Reynolds number is investigated. The experimental procedure was validated, and a total of 400 measurements were performed. Values of the measured drag coefficient ranged from 0.8 to 2.5 for the values of Re from 40 to 300. The results show that the shape of MP particles in the water stream considerably influences the particle drag coefficient, with a rather complex relationship between the drag coefficient and flow conditions.
1. Introduction
Increasing industrial production and uncontrolled anthropogenic impacts result in large amounts of plastic waste ending up in rivers and oceans each year [1,2]. Numerous studies have confirmed that the presence of plastic in aquatic environments negatively affects the existing ecosystem [3,4,5,6,7]. According to the Organization for Economic Co-operation and Development report [8], the amount of globally produced plastic waste is on track to almost triple by the year 2060. Today’s production of plastic waste is estimated at 460 Mt per year, while in 2060, the production of over 1200 Mt per year is expected, unless global demand is significantly reduced.
The most widely accepted definition of microplastics (MPs) recognizes them as polymer particles smaller than 5 mm [9]. The density of MPs can vary significantly, but studies such as Morét-Ferguson S. et al. [10] show that more than half of the plastic waste produced has a density greater than the density of water, making it predominantly negatively buoyant. For negatively buoyant MPs, settling processes dominantly affect its transport in water [11].
The main parameters of MP particles affecting the settling process are shape, size, and density [12]. MP particles are characterized by a large range of different shapes [13]. Some of the characteristic shapes are: fibers, pellets, filaments, film, foams, microbeads, and granules [14]. As for the particle size and shape [15,16], their influence on the dynamics of particle transport in a fluid is usually homogenized by the drag coefficient [17,18], which is used as a parameter in quantifying the resulting friction force. This paper deals with the problem of determining the values for MP particles and putting them in relation to the flow conditions represented by the Re number.
One of the first experimental studies of MP was conducted by Khatmulina L. et al. [19]. In their work, they measured terminal settling velocity for multiple types of MP of different sizes and shapes, using a glass column to establish static experimental conditions. The results showed that the reliability of existing theoretical predictions developed for natural sediments varies significantly depending on the shape of the particles. Waldschlager K. et al. [20], in their experimental analysis, also confirmed that MP differs significantly from sediment in its behavior. They developed new formulas to determine settling and rising velocities, which can now be used to more accurately describe MP behavior using numerical simulations. Since the experiment was also conducted in static conditions, it was concluded that for the successful use of numerical simulations, it is necessary to examine the transport of MP in moving water. Wang Z. et al. [21] conducted a dynamic experiment for determining the settling velocity of irregularly-shaped MP particles. For testing settlement behavior under vortex conditions, a water column container was fixed on a shaking instrument. Results show that the settling velocity is lower under dynamic conditions than under static conditions. Furthermore, it was confirmed that MP particle shape and size significantly affect settling velocity. In related research, the influence of turbulence on the drag coefficient of settling particles was analyzed by Xia Y. et al. [22].
Melkebeke M. et al. [23] analyzed and compared 11 different drag models to determine values of sinking MP particles. This study was the first in this field to include film particles in the experimental analysis. Data used in their paper was obtained by an experimental model in static water conditions. Each drag model was empirically derived for a specific range of Re numbers. To describe particle shape, seven dimensionless shape parameters were used in these drag models. Circularity and sphericity were found to be appropriate shape descriptors for one and two dimensional particles. The results highlighted the importance of MP shape description.
Experiments, the results of which are presented in this paper, were conducted with the aim to analyze sinking conditions of MP particles in a horizontal stream of water. To test the influence of particle geometry characteristics on sinking conditions, particle size and shape were controllably varied by producing MP particles of various geometries on a 3D printer. Furthermore, in order to control the input parameters of the experimentally examined physical process, a specially designed ramp for inserting particles into the experimental flume was made. Steady fluid flow was established by a pump operating in a closed loop system. Recordings were obtained by using a high-precision camera in order to accurately assess the sinking trajectory of MP particles of different shapes and sizes in a steady fluid flow. On the basis of the obtained experimental results, an estimation of the of MP particles of several different geometries under steady flow conditions is proposed.
2. Materials and Methods
2.1. Experimental Equipment
An experimental flume (Figure 1) within the Hydrotechnical laboratory of the Faculty of Civil Engineering University of Rijeka was used for the investigation of the sinking of MP particles in water stream conditions. The channel is 12.5 m long, with a 309 mm wide and 450 mm high rectangular cross section. In order to ensure the reproducibility of the experiment, it is necessary to control the conditions of the flow. This is accomplished by controlling the geometric and kinematic characteristics of the flow, which are represented by: flow discharge, channel slope, and water level. Flow discharge and water level inside the flume are controlled by a pump and a downstream weir, which is positioned 12 m from the beginning of flume. Slope of the channel was set to zero.
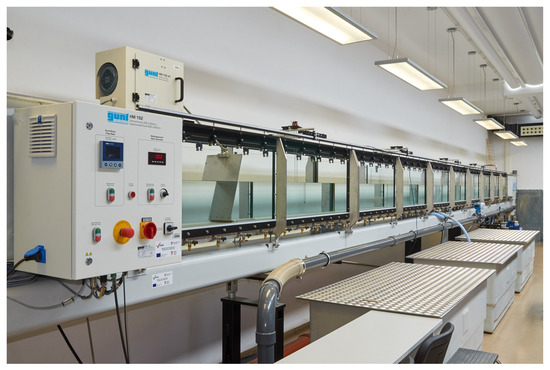
Figure 1.
Experimental flume as part of the Hydrotechnical Laboratory at the University of Rijeka.
To ensure the control over MP geometry and also to achieve the repeatability of the experiment, a high-precision 3D printer was used for the production of MP particles. The printer in question can print with a precision of up to 32 microns and a minimum sample size of 0.4 mm. The 3D printer was also used for production of a dosing ramp that was used to insert particles into the water stream in a way that minimized the impact of surface tension and ensured the entry of particles without additional linear and angular momentum, so that a particle’s entire momentum would be obtained from the fluid (Figure 2).
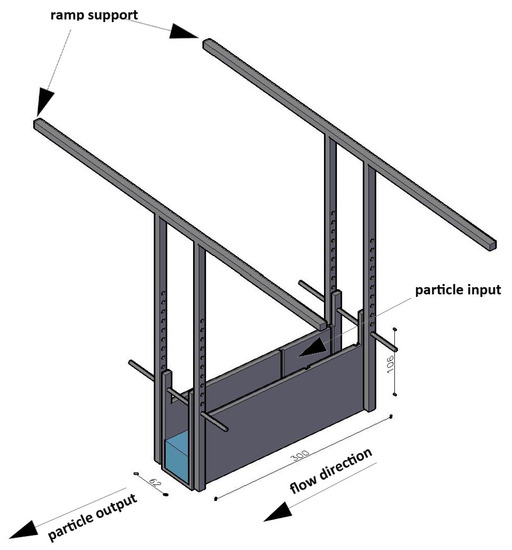
Figure 2.
A 3D sketch of dosing ramp used for inserting particles into water stream (dimensions in mm).
Video equipment was used to track the position of the particles during sinking. The videos of each experimental run were recorded at 60 frames per second in 4K video quality using a Sony IMX582 camera. Sony IMX582 has a 4000 × 3000 resolution and a focal length of 4.71 mm. The recording of the experimental run of each MP particle shape was submitted to analysis using the Open Source Computer Vision Library (OpenCV), specifically the Python module OpenCV version 4.5.5. The OpenCV video analysis entailed obtaining the trajectories and sinking times of each MP particle using the Mixture of Gaussians 2 (MOG2) background subtractor algorithm for motion detection, specifically the createBackgroundSubtractorMOG2 function. This function allows detecting and marking of the shadows on the background model that represent moving MP particles. The length of the history parameter of MOG2 was set to 100 for all analyses, while the varThreshold parameter was varied between 300 and 800, depending on the size of the MP particle, with smaller values corresponding to smaller shapes. Threshold parameter describes the distance between the pixel and the model, which is used to decide whether a pixel is well described by the background model.
Constant flow conditions in the flume are ensured by means of an inlet pump and a 350 mm high weir, positioned 7.5 m downstream from the dosing ramp. The achieved consistent water depth on the channel section used for tracking particles was 415 mm measured from the bottom of the flume.
Flow rate in the channel was 72 m3/h, water depth at the point of measurement was 41 cm, and average flow velocity was 1.57 m/s. Velocity profile in the flume was determined by experimental measurements using Nortek Vectrino velocimeter. Measurements were performed at a total of three positions in the flow direction relative to the entrance ramp. Position 1 was located at a distance of 0.5 m upstream of the dosing ramp, position 2 at a distance of 0.5 m downstream of the dosing ramp, and position 3 at 1.5 m downstream of the dosing ramp. At each of the three positions, the measurement was performed on a total of 8 vertically distributed points in the central axis of the flume (vertical points at a distance of 5 mm from each other, starting with a point at 5 mm from the bottom of the flume). The performed measurements did not detect secondary currents, i.e., the transverse component of the velocity was negligible.
2.2. Particle Characteristics
Three different shapes of MP particles were printed for this experiment: spheres (type A), cubes (type B), and crosses (type C) (Figure 3 and Figure 4). The density of the plastic used to print the samples was 1185 kg/m3. Printed particles are housed in a supporting material that has been removed prior to the further particle treatment (Figure 5). The support material was water soluble and was removed using a solution of acetone and water to obtain smooth particles for experiment. Due to the large number of possible shapes of MP, it was necessary to parameterize the shape of the particles [24,25,26]. Particle shape was parameterized by characteristic length to allow for mutual comparisons (Table 1).
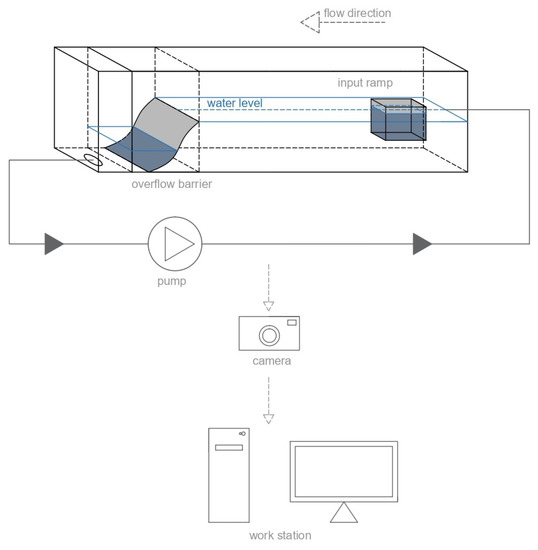
Figure 3.
Schematic representation of the experimental tool used.
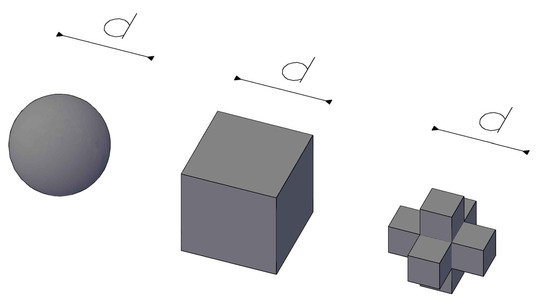
Figure 4.
A 3D models of MP particles (left to right): particle groups A, B, and C.
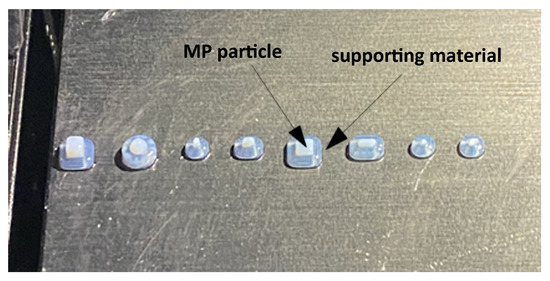
Figure 5.
Example of printed MP particles (white) in the supporting material (semi-transparent).

Table 1.
Specification of shape and characteristic length of MP particles.
For particle group A, the characteristic length d is the radius of the sphere; for particle group B, it is the length of the edge of the cube; and for particle group C, it is the full length of one side of the cross (Table 1, Figure 4). By the size of the characteristic length d, the particles were divided into four groups, which were of equal size for spheres, cubes, and crosses. MP particle sizes used in previous experimental research were 0.5 to 5 mm in Khatmulina L. et al. [19], 0.3 to 5 mm in Waldschlager K. et al. [20], and 0.1 to 5 mm in Wang Z. et al. [21]. The experimental scenario of particles sinking in a water stream imposes the need to ensure a sufficient available length of the channel so that all used MP particles can sink to the bottom of the flume before they reach the weir placed near the channel end. Due to the limitation of the length of the channel and the fact that the shape and size of MP particles affect the sinking time and trajectory, the MP particle sizes chosen for this experiment were 1.5, 2.0, 2.5, and 3.0 mm. The chosen dimensions meet the condition that all MP particles are deposited within the length of the flume.
It is reasonable to expect some deviations in the kinematic functions of the MP particle trajectories recorded within the experiment. Deviations occur due to (i) the perturbations in the initial conditions as per varying the initial amount of motion, (ii) local fluctuations of the water flow rate, (iii) some micro-imperfections of the MP samples, and (iv) other influences due to the measurement conditions. For this reason, conclusions for a particular group of particles must be formed on the basis of a statistical analysis, which imposes the need to test a larger number of particles. A total of 30 samples of each shape and size were printed and used to conduct the experiment.
2.3. Calculation of the Drag Coefficient
An analytical expression was derived for the calculation of the based on the collected experimental data on the particle trajectory. Dominant forces acting on the MP particle during the sinking process are gravity (G), resistance (), and buoyancy (), defined as:
where m is particle mass, is water density, V is particle volume, g is gravitational acceleration, is drag coefficient, is particle velocity in the z (vertical) direction, and A represents the area of the projection of the surface of the particle on a plane perpendicular to the direction of motion, which changes as particle rotates.
At low settling velocities, which characterize this experiment, the secondary flow can be neglected, i.e., a particle maintains a constant orientation along the trajectory. Hence, for the particle groups A, B, and C, the areas A are calculated as:
The second Newton’s law of motion allows for the sinking of a particle to be described by the following equation:
i.e.,
In the settling of MP particles, the settling velocity increases until the particle acceleration reaches zero and the velocity achieves terminal settling velocity. During trial experiments it was observed that the terminal velocity of the particle is reached almost instantaneously, thus it follows that
which in turn allows for explicitly expressing
This formula can now be used for the calculation of the drag coefficient of MP particle sinking in a water stream. For this calculation, water density was adopted as m3/kg and MP density was kg/m3.
The average vertical rate of fall of an individual particle can be determined from the measurement results based on the starting and ending positions of a particular particle:
where and are the vertical positions of a particle at the beginning and end of the measurement. In order to minimize the influence of the boundary layer on the measurement, was taken as a height of 100 mm from the channel bottom, and to avoid the influence of particle insertion procedure and surface-related effects was set to 300 mm. Furthermore, by narrowing the vertical range for tracking particles in this manner, the particle tracking was confined to the water depths of approximately constant horizontal flow velocity, as per the measured velocity profile. So as to experimentally assess drag coefficient values corresponding to the flow conditions, it was necessary to calculate Re values for each experimental scenario.
Re number was calculated as
where is kinematic viscosity of the fluid [m2/s].
3. Results and Discussion
Several experiments were performed and the obtained measurements were statistically analyzed. On the basis of the measurements, a calculation of drag coefficient was conducted as per (10). In order to test the validity of the experimental setup, the first test was carried out for spherical MP particles.
3.1. Validation of Experimental Setup
Based on the experimental results, the function for spheres (particle group A) was determined and then compared with the results from the literature. For the validation of the experiment, the expression for according to Morrison was chosen [27]. This expression spans the entire range of Reynolds numbers (both creeping flow and strongly turbulent flow) and captures the drag coefficient versus Reynolds number for values of Re up to 106.
As part of the statistical processing, the mean and median of the data set were calculated. Besides the mean values of the calculated drag coefficient, standard deviation was also examined, to take into account measurement variation. The blue colored area in Figure 6 represents the range covered by the mean value of the data.
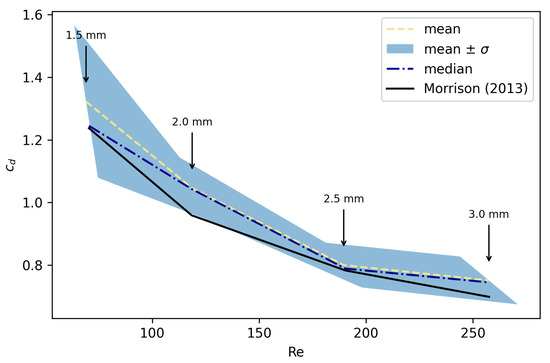
Figure 6.
Correlation of drag coefficient and Reynolds number for particle group A.
The experimental results show that the values calculated by the Morrison expression are within the statistical error of the measurements, as described by the values. Moreover, the experimental results show a reasonably good agreement between Morrison values and median measurement values. Thus, a conclusion was made that the experimental procedure is valid and that the experimental testing may advance to the quasi-radially-symmetric particles, namely particle groups B and C.
3.2. Experimental Results
In the conducted laboratory experiments, around 400 measurements with various MP particle shapes and sizes were made. The dependence of on the Re number was analyzed for each particle group and is presented in Figure 6 (particle group A), Figure 7 (particle group B), and Figure 8 (particle group C). The values of the measured drag coefficient ranged from 0.8 to 2.5 and Reynolds number ranged from 40 to 300. From the test results for spherical MP particles, it can be observed that the function had an expected, concave shape (Figure 6). For the largest particles with mm, the Reynolds number of 290 corresponded with a below 0.8. The results for the smallest particles show that the Reynolds number falls below 100 and is approximately 1.2. The increase in also manifests itself through a larger value of settling velocity for the smaller particles in flowing water.
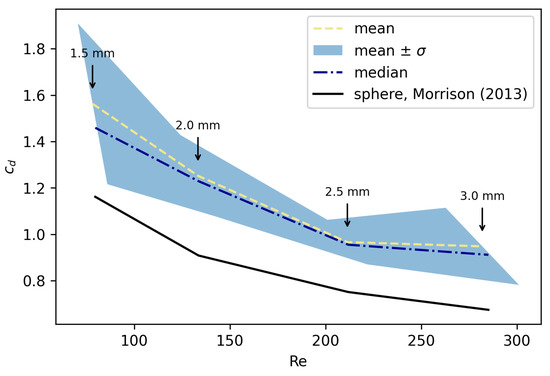
Figure 7.
Correlation of drag coefficient and Reynolds number for particle group B.
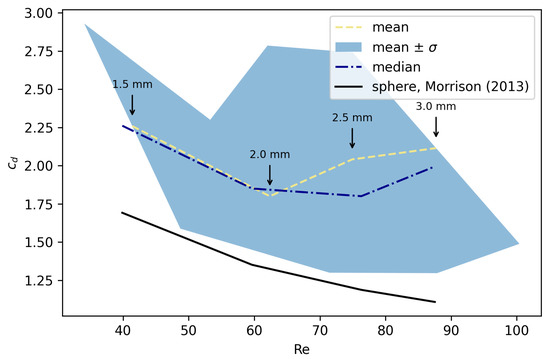
Figure 8.
Correlation of drag coefficient and Reynolds number for the group C particles.
The second experimental scenario was conducted with cubical particles and unchanged flow conditions. Figure 7 shows results for cube-shaped particles compared with the results for the spheres according to the Morrison model. The blue-colored area on the graph represents the standard deviation of the experimental results. The comparison with the model proposed by Morrison [27] was only used to better illustrate the increase in drag coefficient. There was a significant increase in the drag force, manifested through the values of compared to the Morrison’s expression for the spherically-shaped MP. Statistical analysis was performed in the same way as for A particles.
The increase in for particles of group B was dominantly caused by the change in the shape of particles. The cube shape is less hydro-dynamically efficient than the sphere. This is due to the separation of the boundary layer occurring earlier in the case of a cubic particle sinking in the fluid stream under the same conditions as the spherical particle.
Equal characteristic lengths of the particles allow us to compare the shapes and slopes of the curves. Compared to the group A particles, the curve retained its concave shape. The local slopes of the curve were also preserved, where we can see that the relative increase in was strongest between particles of and mm, which mirrors the results for particles A. In this case, however, the largest particles reached Re values up to 300 and around 1, while for the smallest particles, Re fell below 100, with . This was expected due to the symmetry of the cube, equal characteristic lengths, and relative similarity to the spherical geometry of the group A particles.
The last experiment of this research was conducted for group C particles, which are cross shaped (Figure 8). The characteristic length in this case is the side length of symmetric cross-like particles. The results of this experiment were also compared with the Morison model for the sphere.
The drag coefficients achieved in this case show higher values than the previous two experiments, but the curve retains its concave shape. The Re number values for all observed sizes of the cross-shaped particles were below 100, while in all four cases. The drag coefficient value was almost double that of the spherical particles, which is to be expected due to the shape of particles in group C. A greater standard deviation is indicative of a stronger sensitivity of cross-shaped particle trajectories on the interactions with the fluid, which is also expected considering this geometry is significantly more complex than the geometry of the other two particle groups.
A summary of the results presented in the graphs is given in numerical form in Table 2, Table 3 and Table 4. The abbreviation SEM used in the tables stands for standard error of the mean.
Table 2.
Experimental data for particle group A.
Table 3.
Experimental data for particle group B.
Table 4.
Experimental data for particle group C.
4. Conclusions
The goal of this study was to investigate the sinking behavior of MP particles in a horizontal water stream. A series of laboratory experiments were conducted using MP particles of different shapes and sizes. To account for the effects of horizontal flow on a settling particle, an experimental assessment of the drag coefficient was carried out. The experiments were conducted over a range of Re from 40 to 300, and three groups of (quasi-)radially-symmetric particles were used: spheres, cubes, and crosses of 1.5 to 3.0 mm size. To ensure the repeatability of the experiments under horizontal flow conditions, a novel experimental methodology was developed, based on 3D printing of MP particles, which allowed for strict control of particle geometry.
Previous experiments regarding the sinking of MP particles and the forces acting on them have been predominantly conducted for static water conditions [5,6,7], which do not often occur in a real-world scenario. The research presented in this paper confirmed the considerable influence of particle shape on settling behavior of MPs in a water stream. The study showed that the shape of MP particles of a specific size was a dominant factor influencing their sinking dynamics in flowing water. Experimental results showed that shape deviation away from a perfect sphere significantly increases drag coefficient and as a consequence the drag force, thus affecting the transport and settling process of MPs. Furthermore, the results illustrate a rather complex relationship between drag coefficient and flow conditions (i.e., Re number) for non-spherical shapes.
The results of this study have practical implications for improving our understanding of MP transport and the development of numerical models for predicting MP movement in water bodies. Planned future studies will focus on other common shapes of MPs found in nature [2]. Dominant MP particle shapes such as fibers and foams [4] will be investigated using the developed experimental setup. Extending the range of analyzed shapes would demand a more sophisticated particle shape parameterization. The behavior of particles with one or two dominant dimensions in a water stream is expected to be particularly interesting and also important for practical purposes.
Author Contributions
T.H. designed the experiments, performed experiments, and prepared original draft of the paper; V.T. conducted the analysis of the video material, analyzed results, and revised the paper; S.D. designed the experiments, analyzed results, and revised the paper; D.H. designed the experiments, administered the project, and revised the paper. All authors have read and agreed to the published version of the manuscript.
Funding
This research article is a part of the project Computational fluid flow, flooding, and pollution propagation modeling in rivers and coastal marine waters—KLIMOD (grant no. KK.05.1.1.02.0017), and is funded by the Ministry of Environment and Energy of the Republic of Croatia and the European structural and investment funds.
Institutional Review Board Statement
Not applicable.
Informed Consent Statement
Not applicable.
Data Availability Statement
The data presented in this study are available on request from the corresponding author.
Acknowledgments
The authors would like to thank Marta Alvir, Luka Grbčić, Ante Sikirica, and Duje Kalajžić for their help in conducting laboratory experiments and measurement data analysis.
Conflicts of Interest
The authors declare no conflict of interest. The funders had no role in the design of the study; in the collection, analyses, or interpretation of data; in the writing of the manuscript, or in the decision to publish the results.
References
- Petersen, F.; Hubbart, J.A. The occurrence and transport of microplastics: The state of the science. Sci. Total Environ. 2021, 758, 143936. [Google Scholar] [CrossRef] [PubMed]
- Andrady, A.L. Microplastics in the marine environment. Mar. Pollut. Bull. 2011, 62, 1596–1605. [Google Scholar] [CrossRef] [PubMed]
- Kumar, R.; Sharma, P.; Verma, A.; Jha, P.K.; Singh, P.; Gupta, P.K.; Chandra, R.; Vara Prasad, P.V. Effect of physical characteristics and hydrodynamic conditions on transport and deposition of microplastics in riverine ecosystem. Water 2021, 13, 2710. [Google Scholar] [CrossRef]
- Eerkes-Medrano, D.; Thompson, R.C.; Aldridge, D.C. Microplastics in freshwater systems: A review of the emerging threats, identification of knowledge gaps and prioritisation of research needs. Water Res. 2015, 75, 63–82. [Google Scholar] [CrossRef] [PubMed]
- Yadav, S.; Rout, S.; Tiwari, M.; Mhatre, S.; Karpe, R.; Pulhani, V.; Kumar, A.V. Simulated experimental investigation of microplastic weathering in marine environment. J. Environ. Sci. Health 2022, 57, 575–583. [Google Scholar] [CrossRef]
- Fuente, R.; Drótos, G.; Hernández-García, E.; López, C.; Van Sebille, E. Sinking microplastics in the water column: Simulations in the Mediterranean sea. Ocean Sci. 2021, 17, 431–453. [Google Scholar] [CrossRef]
- Fytianos, G.; Ioannidou, E.; Thysiadou, A.; Mitropoulos, A.C.; Kyzas, G.Z. Microplastics in mediterranean coastal countries: A recent overview. J. Mar. Sci. Eng. 2021, 9, 98. [Google Scholar] [CrossRef]
- OECD.org. Available online: https://www.oecd.org/environment/global-plastic-waste-set-to-almost-triple-by-2060.htm (accessed on 12 June 2022).
- Li, J.; Liu, H.; Chen, J.P. Microplastics in freshwater systems: A review on occurrence, environmental effects, and methods for microplastics detection. Water Res. 2018, 137, 362–374. [Google Scholar] [CrossRef]
- Morét-Ferguson, S.; Law, K.L.; Proskurowski, G.; Murphy, E.K.; Peacock, E.E.; Reddy, C.M. The size, mass, and composition of plastic debris in the western North Atlantic ocean. Mar. Pollut. Bull. 2010, 60, 1873–1878. [Google Scholar] [CrossRef]
- Yu, Z.; Yang, G.; Zhang, W. A new model for the terminal settling velocity of microplastics. Mar. Pollut. Bull. 2022, 176, 113449. [Google Scholar] [CrossRef]
- Horton, A.A.; Dixon, S.J. Microplastics: An introduction to environmental transport processes. Wires Water 2017, 5, e1268. [Google Scholar] [CrossRef]
- Khatmullina, L.; Chubarenko, I. Transport of marine microplastic particles: Why is it so difficult to predict? Can. Sci. Publ. Anthr. Coasts 2019, 2, 293–305. [Google Scholar] [CrossRef]
- Chubarenko, I.; Bagaev, A.; Zobkov, M.; Esiukova, E. On some physical and dynamical properties of microplastic particles in marine environment. Mar. Pollut. Bull. 2016, 108, 105–112. [Google Scholar] [CrossRef]
- Dietrich, E.W. Settling velocity of natural particles. Water Resour. Res. 1982, 18, 1615–1626. [Google Scholar] [CrossRef]
- Shamskhany, A.; Li, Z.; Patel, P.; Karimpour, S. Evidence of microplastic size impact on mobility and transport in the marine environment: A review and synthesis of recent research. Front. Mar. Sci. 2021, 8, 760649. [Google Scholar] [CrossRef]
- Hongli, Y.; Minqiang, F.; Airong, L.; Lianping, D. General formulas for drag coefficient and settling velocity of sphere based on theoretical law. Int. J. Min. Sci. Technol. 2015, 25, 219–223. [Google Scholar]
- Haider, A.; Levenspiel, O. Drag coefficient and terminal velocity of spherical and non-spherical particles. Powder Technol. 1988, 58, 67–70. [Google Scholar]
- Khatmullina, L.; Isachenko, I. Settling velocity of microplastic particles of regular shapes. Mar. Pollut. Bull. 2017, 30, 871–880. [Google Scholar] [CrossRef]
- Waldschlager, K.; Schuttrumpf, H. Effects of particle properties on the settling and rise velocities of microplastics in freshwater under laboratory conditions. Environ. Sci. Technol. 2019, 53, 1958–1966. [Google Scholar] [CrossRef]
- Wang, Z.; Dou, M.; Ren, P.; Sun, B.; Jia, R.; Zhou, Y. Settling velocity of irregularly shaped microplastics under steady and dynamic flow conditions. Environ. Sci. Pollut. Res. 2021, 28, 62116–62132. [Google Scholar] [CrossRef]
- Xia, Y.; Yu, Z.; Pan, D.; Lin, Z.; Guo, Y. Drag model from interface-resolved simulations of particle sedimentation in a periodic domain and vertical turbulent channel flows. J. Fluid Mech. 2022, 944, A25. [Google Scholar] [CrossRef]
- Melkebeke, M.; Janssen, C.; Meester, S. Characteristics and sinking behavior of typical microplastics including the potential effect of biofouling: Implications for remediation. Environ. Sci. Technol. 2020, 54, 8668–8680. [Google Scholar] [CrossRef] [PubMed]
- Wadell, H. Volume, shape, and roundness of rock particles. J. Geol. 1932, 40, 443–451. [Google Scholar] [CrossRef]
- Komar, P.D. Settling velocities of circular cylinders at low Reynolds numbers. J. Geol. 1932, 88, 327–336. [Google Scholar] [CrossRef]
- Dioguardi, F.; Mele, D.; Dellino, P. A new one-equation model of fluid drag for irregularly shaped particles valid over a wide range of Reynolds number. J. Geophys. Res. Solid Earth 2017, 123, 144–156. [Google Scholar] [CrossRef]
- Morrison, F.A. An Introduction to Fluid Mechanics; Cambridge University Press: New York, NY, USA, 2013. [Google Scholar]


Disclaimer/Publisher’s Note: The statements, opinions and data contained in all publications are solely those of the individual author(s) and contributor(s) and not of MDPI and/or the editor(s). MDPI and/or the editor(s) disclaim responsibility for any injury to people or property resulting from any ideas, methods, instructions or products referred to in the content. |
© 2023 by the authors. Licensee MDPI, Basel, Switzerland. This article is an open access article distributed under the terms and conditions of the Creative Commons Attribution (CC BY) license (https://creativecommons.org/licenses/by/4.0/).