Abstract
Liquefied natural gas (LNG)-fueled ships have the effect of reducing most pollutants, which is advantageous for responding to strict regulations. Because boil-off gas (BOG) is generated in the LNG storage tank of an LNG-fueled ship, a BOG re-liquefaction system is required. The representative systems for LNG-fueled ships were proposed by Kwak and Shen, but their exergy efficiencies were only 19.6% and 24.9%, respectively. To improve the system, this paper proposes novel BOG re-liquefaction systems combined with the fuel gas supply system. The systems utilize LNG cold energy in the BOG stream and N2 reverse Brayton cycle, respectively. The proposed systems were simulated using a commercial program and were optimized using a genetic algorithm. The results of energy, exergy, and economic (3E) analyses performed for comprehensive evaluation of the proposed system show that the system in which LNG cold energy is applied to the BOG stream has the best performance. Specific energy consumption, exergy efficiency, and total annual costs of this system were improved by up to 78.6%, 69.2%, and 68.2%, respectively, compared to those of the existing systems. The overwhelmingly superior system is expected to greatly contribute to the improvement of the BOG re-liquefaction system for LNG-fueled ships.
1. Introduction
Recently, the International Maritime Organization (IMO) has strengthened regulations on pollutants generated from ships through the International Convention for the Prevention of Pollution from Ships (MARPOL). In particular, the new IMO regulations introduced in 2020 limit the sulfur content of ships to 0.50 wt%, which requires appropriate measures for the shipping industry [1]. SOx reduction technologies include dual fuel combustion, the use of alternative fuels, seawater flue gas desulphurization, non-thermal plasma, and the scrubber [2]. Among them, the scrubber and the use of liquefied natural gas (LNG) as sulfur-free fuel are the most representative and common. The scrubber is relatively simple equipment for ships using high-sulfur oil. However, it requires expensive installation costs and is relatively bulky. On the other hand, the use of LNG as a ship fuel is considered one of the effective alternatives to respond to environmental regulations [3].
Here, the LNG-fueled ships’ propulsion systems require a considerable initial investment for the installation of facilities, such as a fuel gas supply system. However, such ships do not emit SOx and reduce CO2, NOx, and particulate matter; as a result, they present excellent advantages in adhering to upcoming regulations [4]. Therefore, LNG, an eco-friendly fuel, is emerging as a countermeasure to ship exhaust gas regulations, and the number of ships using LNG fuel is continuously increasing [5,6].
LNG-fueled ships must be equipped with LNG storage tanks as bunker tanks to supply LNG to the main engine. LNG, a cryogenic fuel, is stored in an insulated tank at 111 K and atmospheric pressure. However, a significant amount of LNG is vaporized owing to the heat transferred from the surrounding environment, and boil-off gas (BOG) is generated [7]. In the case of a 3000 m3 LNG storage tank, assuming a boil-off rate (BOR) of 0.15%/day, the BOG generation rate during the voyage is 2000 kg/day [4]. BOG causes a pressure rise in the LNG storage tank. To ensure the safety of the tank, the generated BOG must be treated properly when the tank pressure exceeds the allowable value.
The BOG re-liquefaction system condenses the BOG from the gaseous to liquid state and then returns it to the LNG tank to maintain constant pressure in the tank [8]. There are various methods in the on-board BOG re-liquefaction system, and the process of full re-liquefaction of BOG using the refrigeration cycle is generally used.
The main studies on on-board BOG re-liquefaction systems are as follows. Moon et al. [9] comparatively analyzed the refrigeration cycles of Claude and Kaptiza for a BOG re-liquefaction system and reported that the Kaptiza cycle is more effective than the Claude cycle in terms of operability and cost. Shin and Lee [10] designed a BOG re-liquefaction system for an LNG carrier based on the reverse Brayton cycle and performed dynamic simulations for all operating modes, including start-up and idle. Sayyaadi and Babaelahi [11] optimized the exergetic efficiency of an on-board BOG re-liquefaction system and performed a thermodynamic analysis. As a result, the thermodynamic performance of the optimized system was improved. Nekså et al. [12] developed, analyzed, and experimentally tested a BOG re-liquefaction plant for small gas carriers and obtained successful results in terms of efficiency and operation. Romero et al. [13] investigated the Brayton cooling cycle as a BOG re-liquefaction process. Through thermodynamic research, the conditions, parameters, and energy consumption of the process were analyzed and evaluated according to various factors. Gomez et al. [14] explained various types of on-board LNG re-liquefaction technologies (Jamal, TGE, MarkⅠ EcoRel, MarkⅢ, MarkⅢ Laby-GI, and TGE Laby-GI) and compared the characteristics of each technology. Kochunni and Chowdhury [15] compared and analyzed the reverse Brayton and Kapitza cycles for LNG BOG re-liquefaction through exergy analysis. When the reverse Brayton cycle caused exergy loss through the vent, the exergy efficiency of the Kapitza cycle was higher than that of the reverse Brayton cycle with the same heat-exchanger size. Gomez et al. [16] studied a BOG re-liquefaction plant using a cascade vapor compression cycle with propylene and ethylene as refrigerants and evaluated the system through energy and exergy analyses. Thus, it was observed that the recovery of BOG cold energy and rejection of BOG compression heat are useful for improving the efficiency. Tan et al. [7] proposed and analyzed a novel system using a dual mixed refrigerant cycle to improve the efficiency of the existing BOG re-liquefaction system. The proposed system was able to improve the energy and exergy performance compared to existing systems. Tan et al. [17] proposed a BOG re-liquefaction system for liquefied natural gas (LNG) carriers using ejectors. The results indicated that the application of ejectors could improve the thermodynamic efficiency of existing BOG re-liquefaction systems. Kim et al. [18] performed an economic optimization of the fuel supply system for LNG carriers using the Joule–Thomson cycle-based BOG re-liquefaction system. In this study, when the LNG price exceeded 4 USD/MMBtu, the proposed systems could improve the economic feasibility compared to the reference corresponding to the fuel supply system without BOG liquefaction. Yin and Ju [19] proposed and optimized two nitrogen expansion cycles corresponding to the parallel and serial nitrogen expansion processes to improve the BOG re-liquefaction system for small LNG ships. The parallel nitrogen expansion process showed higher exergy efficiency and lower energy consumption. In addition, Yin and Ju [20] proposed a process using the BOG re-liquefaction system for LNG ships combined with an absorption refrigeration cycle and performed economic and performance analyses. The proposed system exhibited better results than those of the classical system. Cao et al. [21] proposed a novel cascade N2 expansion BOG re-liquefaction system and compared it to the parallel nitrogen expansion process presented by Yin and Ju [19]. Each system was optimized, and composite curve, exergy, and economic analyses were performed. Consequently, the proposed system exhibited better results than the system proposed by Yin and Ju [19].
As such, the abovementioned studies suggested various and novel refrigeration cycles for the BOG re-liquefaction system of LNG carriers. However, the studies were for large-scale LNG carriers with a cargo hold of 150,000 to 250,000 m3. On the other hand, the fuel tank capacity of an LNG-fueled ship is only 1000 to 10,000 m3. For this reason, the BOG re-liquefaction systems of an LNG-fueled ship must be designed in a small scale. In addition, due to space constraints, it is economical, efficient, and feasible to configure the BOG re-liquefaction system for LNG-fueled ships with a compact system consisting of minimum amount of equipment [4]. However, studies on BOG re-liquefaction systems for LNG-fueled ships are insufficient.
The refrigeration cycle mainly used in the BOG re-liquefaction system for LNG-fueled ships is the reverse Brayton cycle, using N2 as the working fluid. This cycle is known to have a lower thermal efficiency than the complex refrigeration cycles generally used for LNG carriers. Nevertheless, this cycle is preferred in the field of BOG re-liquefaction for LNG-fueled ships because it is safe, and non-flammable N2 is used as the working fluid. Compared to other cycles, the system is simple, remains compact, and requires less equipment to function. In addition, it operates only in the gaseous state without a phase change in the working fluid throughout the entire process [4,14].
The few studies on BOG re-liquefaction systems for LNG-fueled ships are as follows. Kwak et al. [4] pointed out the lack of research on small-scale BOG re-liquefaction systems for LNG-fueled ships and proposed systems using the reverse Brayton cycle. After simulating each system, thermodynamic analysis and optimization were performed. Figure 1 shows a schematic of the case with BOG compressors proposed by Kwak et al. [4]. The optimized performance of this system showed the specific energy consumption (SEC), which is 1.41 kWh/kgLBOG.
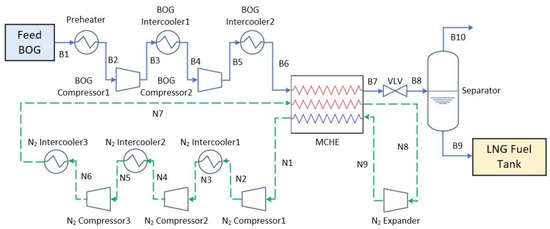
Figure 1.
Schematic of the BOG re-liquefaction system presented in Kwak et al. [4].
Son and Kim [22,23,24] presented several research results on the BOG re-liquefaction system for LNG-fueled ships. First, an operability study was performed to analyze the dynamic behavior of the systems proposed by Kwak et al. [4,22]. In addition, a dual-expansion system was proposed to improve the system shown in Figure 1, and it was compared and analyzed using a single-expander system [23]. As a result, the minimum SEC of dual expander systems was 1.09 kWh/kgLBOG, which corresponds to a 23% reduction compared to the base system (Figure 1). In addition, to increase energy efficiency, BOG re-liquefaction systems of the precooling cycle using CO2 and NH3 were proposed and analyzed [24]. Consequently, the SEC of the process with CO2 precooling was 1.31 kWh/kgLBOG, while the process with NH3 precooling showed 1.30 kWh/kgLBOG. Shen et al. [25] proposed three BOG re-liquefaction systems using a BOG self-expansion precooling system. Figure 2 shows a schematic of the system showing the best performance in the study by Shen et al. [25]. This system showed improved performance compared to the existing systems proposed by Kwak et al. [4] and Son and Kim [24]. Specifically, the SEC of this system was 1.11 kWh/kgLBOG.
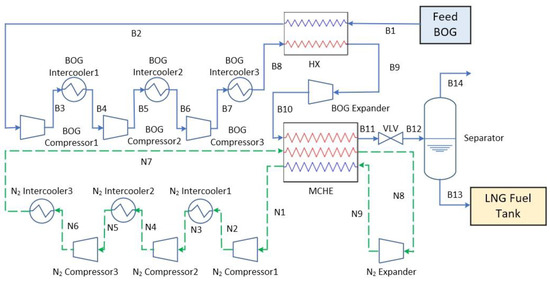
Figure 2.
Schematic of the BOG re-liquefaction system presented in Shen et al. [25].
The virtue of LNG cold energy utilization is well known in various fields, and the related research are as follows. He et al. [26] presented a system in various fields using LNG cold energy and showed its prospects and challenges. In the study, it was mentioned that LNG cold energy greatly improves the thermodynamic efficiency of the system. Bian et al. [27] proposed BOG re-liquefaction systems without an external refrigeration cycle for LNG carriers. Among the proposed systems, a system that directly utilizes LNG cold energy for BOG re-liquefaction was introduced, and the SEC and exergy efficiency of the system were 0.7012 kWh/kgLBOG and 37.63%, respectively.
Research using LNG cold energy in systems related to LNG-fueled ships has recently attracted attention [3,28,29,30]. In the study of Lee [3], the cargo hold refrigeration system using LNG cold energy was able to reduce power consumption significantly compared to the existing compression refrigeration system. In addition, a power generation system using LNG cold energy as a heat sink for an organic Rankine cycle was studied. Yin et al. [28] proposed the concept of BOG treatment combined with air liquefaction. A system for recovering cold energy of BOG and fueled LNG from LNG gasification was designed and analyzed. Lim and Choi [29] simulated a system using LNG cold energy as a heat sink for the organic Rankine cycle and performed thermodynamic analysis using various working fluids. Lim et al. [30] added double stage organic Rankine cycle systems and performed energy, exergy, and economic analyses. In these systems, LNG fuel is used as a heat sink for the organic Rankine cycle, passes through a reheater, and then flows into the dual fuel engine.
Meanwhile, there is no research on the application of LNG cold energy to BOG re-liquefaction systems for LNG-fueled ships so far. BOG re-liquefaction system of an LNG-fueled ship must release a certain amount of heat for the condensation of BOG. In addition, a certain amount of heat must be supplied to the fuel gas supply system to produce the fuel gas flowing into the engine. It is clear that the performance of the fuel gas supply system as well as the BOG re-liquefaction system can be improved if the energy released from the BOG re-liquefaction system is used in the fuel gas supply system. This study will be pioneering research that specifically addresses these issues. However, this study primarily focuses on the BOG re-liquefaction system of LNG-fueled ships. In other words, it was studied how much quantitative improvement is achieved by using the cold energy of LNG in the BOG re-liquefaction system of an LNG-fueled ship compared to the existing re-liquefaction system. To explore this research objective, this study proposed two novel systems that utilize the cold energy of LNG fuel in the BOG re-liquefaction system. Specifically, one system applied the cold energy of LNG fuel to the BOG stream, while the other system applied it to the N2 reverse Brayton cycle.
The purpose of this study is to propose the new concept of the above-mentioned systems and thoroughly demonstrate the performance improvement of the BOG re-liquefaction system using LNG cold energy. The configurations to achieve the above purpose are as follows: In Section 2, the new BOG re-liquefaction systems integrated with the fuel gas supply system were proposed, and the differences from the existing systems were explained. The following Section 3 presents analysis conditions and models for the evaluation of the proposed systems. In addition, it includes the detailed descriptions of system optimization performed to find the maximum performance level of the proposed systems. The optimization results are shown in Section 4. In Section 5, the performance of the presented systems is evaluated by comparing it with that of existing systems (Figure 1 and Figure 2) through energy, exergy, and economic (3E) analysis. Although the 3E analysis is a comprehensive evaluation method of the system, it has not often been performed for BOG re-liquefaction systems of LNG-fueled ships.
2. System Description
2.1. Fuel Gas Supply System
In this study, a small LNG-fueled ship system was considered. Therefore, a ship using dual-fuel diesel electric (DFDE) suitable for small- and medium-sized gas fuel engines was selected for the study. A DFDE is a low-pressure (6 barg) and four-stroke dual fuel engine, and depending on the situation, gas fuel or heavy fuel oil (HFO) can be used [3]. As this engine is a type of generator, it generates electricity and drives an electric motor to propel the ship. Therefore, it must be operated at all times, whether sailing or berthing.
Figure 3 shows the LNG fuel gas supply system for the DFDE proposed in this study. On the other hand, the existing system is shown in Figure 4. Although DFDE can use dual fuel, it is desirable to avoid using HFO whenever possible owing to stringent environmental regulations and energy depletion concerns. Therefore, in this study, it is assumed that the DFDE continuously used LNG fuel during sailing or berthing. That is, to operate the DFDE in the assumed system, LNG fuel must be vaporized and supplied 24 h a day.
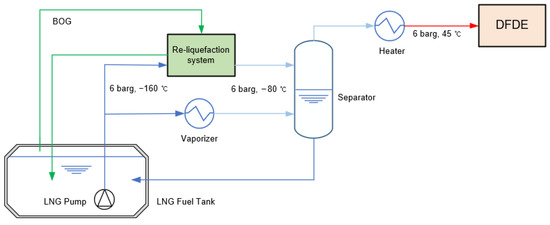
Figure 3.
Proposed LNG fuel gas supply system for the DFDE Engine.

Figure 4.
Existing LNG fuel gas supply system for the DFDE Engine.
Meanwhile, this system requires devices such as a vaporizer and heater to vaporize LNG fuel [3]. These devices supplied latent heat of evaporation to the fuel to vaporize the LNG. The difference between this study compared to the studies reporting on the existing DFDE gas fuel supply system is that a part of this latent heat of evaporation was obtained from the BOG re-liquefaction system. That is, a part of the LNG fuel was introduced into the BOG re-liquefaction system to vaporize it, and at the same time, the cold energy of the LNG fuel was used for the BOG re-liquefaction. Here, the condition (6 barg, −160 °C) of LNG fuel flowing into the vaporizer and its condition (6 barg, −80 °C) flowing out of the vaporizer refer to the study by Lee [3]. The conditions of the LNG entering and leaving the re-liquefaction system were the same as those for the vaporizer. After the fuel passed through the separator, only the gas was supplied to the DFDE through the heater.
2.2. BOG Re-Liquefaction System
The BOG re-liquefaction system for the fuel gas supply system presented in this study was as follows. Figure 5 and Figure 6 show the schematic and T-s diagrams of the base case of the BOG re-liquefaction system, assuming that LNG cold energy is not used in this study. The difference between this system and that proposed by Kwak et al. [4] (Figure 1) is that a heat exchanger (HX) was installed so that the feed BOG (B1) and B8 facing the main cryogenic heat exchanger (MCHE) could exchange heat with each other. That is, the BOG supplied to the system flowed into the compressor in the preheated state (B2) and into the MCHE in the precooled state (B9) from the opposite end. This method was shown to be effective by Shen et al. [25]. Meanwhile, this system did not use a BOG expander, unlike the system proposed by Shen et al. [25] (Figure 2). As this study proposed a system that used LNG cold energy, an additional heat exchanger was for heat transfer. Therefore, the expander was not used to prevent space shortages and excessive costs owing to excessive equipment installation. Figure 6a is the T-s diagram showing the BOG process for the base case. BOG entering from B1 is heated by HX. BOG is then reaching B8 due to compressors with intercoolers. BOG is then fully condensed by MCHE. Meanwhile, Figure 6b shows the N2 process of the base case. Nitrogen in state N1 is brought to state N7 by compressors with intercoolers. After that, the nitrogen is cooled by MCHE to the temperature of N8. The nitrogen goes through the expander and then returns to state N1 from the MCHE.
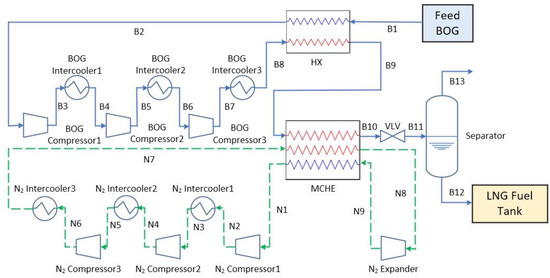
Figure 5.
Schematic of the BOG re-liquefaction system for a base case.
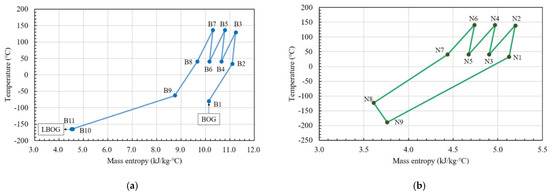
Figure 6.
T-S diagram of the BOG re-liquefaction system for a base case: (a) BOG, (b) N2.
Case 1 and Case 2 proposed in this study were systems that utilized the cold energy of LNG fuel supplied to the DFDE, as shown in Figure 3. The aforementioned Kwak et al. [4], Shen et al. [25], and base case do not use LNG cold energy at all, but Case 1 and Case 2 utilize the cold energy of LNG in the BOG stream and N2 reverse Brayton cycle, respectively. In the case of a small LNG-fueled ship with a limited space, the complexity of the system made it difficult to design, manufacture, install, and operate [4]. In this study, LNG cold energy was used with minimal equipment to reduce the complexity of the system and easily satisfy the operating conditions.
Figure 7 and Figure 8 show the schematic and T-s diagrams corresponding to Case 1 of the BOG re-liquefaction system presented in this study. The LNG fuel supply line in Figure 3 is coupled to the HX-2 in Figure 7. This system utilized LNG cold energy for the BOG. That is, B9 precooled through HX-1 exchanged heat with LNG fuel (L1) in HX-2. In HX-2, the LNG inlet/outlet conditions (L1 and L2) satisfied the temperature and pressure, as shown in Figure 3. B10 occurs after heat exchange with LNG fuel flows into the MCHE, allowing it to be completely condensed by the N2 re-liquefaction cycle. Because this system had the characteristic that LNG cold energy consumed most of the BOG condensation’s latent heat, the power required to be supplied to the N2 re-liquefaction cycle could be greatly reduced. If LNG fuel was not used, the heat exchange in HX-2 could be ignored and could be considered as the base case. Figure 8a shows the T-s diagram for the BOG process described above. The N2 process in Figure 8b for Case 1 is analogous to that of the base case.
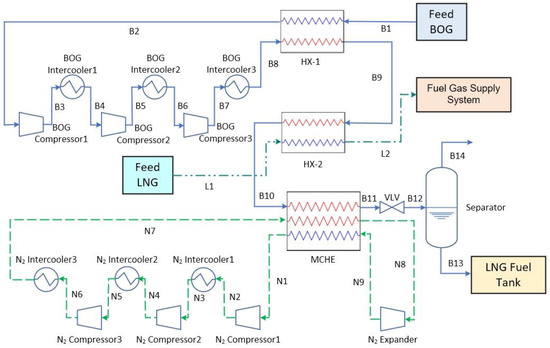
Figure 7.
Schematic of the BOG re-liquefaction system for Case 1.
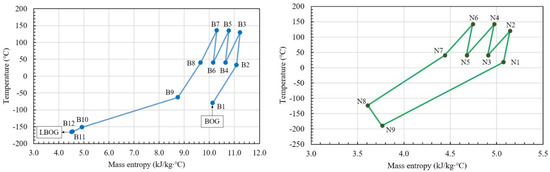
Figure 8.
T-S diagram of the BOG re-liquefaction system for Case 1: (a) BOG, (b) N2.
Figure 9 and Figure 10 show the schematic and T-s diagrams corresponding to Case 2 of the BOG re-liquefaction system presented in this study. The LNG fuel supply line in Figure 3 is connected to the HX-2 in Figure 9. This system utilized LNG cold energy in the N2 reverse Brayton cycle. In the N2 reverse Brayton cycle, the mass flow of N7 under high pressure was divided into N8 flowing into the MCHE and N10 flowing into HX-2. The N2 reverse Brayton cycle, which was a type of refrigeration cycle, required a cooling process after the compression of the working fluid. In this system, a part of N2 (N10) was cooled using the cold energy of the LNG fuel (L1) flowing into HX-2. This made it possible to reduce the duty cycle required for the cold stream of the MCHE. Because the exchange duty was reduced in the MCHE, the power required for the N2 reverse-Brayton cycle could be reduced. The divided streams (N8 and N10) were mixed again in the mixer after each heat exchange was completed (N9 and N11). When LNG fuel was not used, the heat exchange in HX-2 was ignored by allowing all mass flow from N7 to N8. The system became identical to the base case by stopping the use of the N2 preheater installed in front of the N2 compressor. Figure 10a is the T-s diagram showing the BOG process for Case 2, which is very similar to the base case. Figure 10b is the T-s diagram for the N2 process of Case 2 described above.
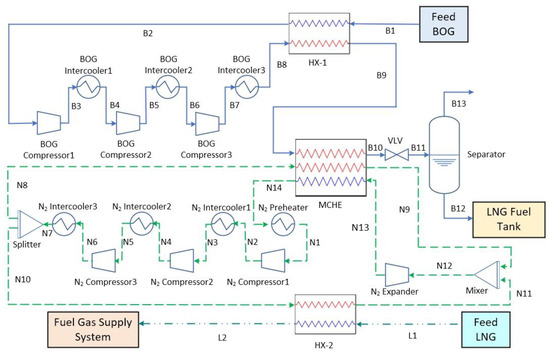
Figure 9.
Schematic of the BOG re-liquefaction system for Case 2.
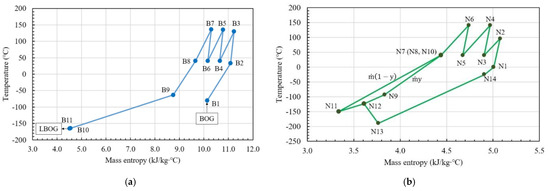
Figure 10.
T-S diagram of the BOG re-liquefaction system for Case 2: (a) BOG, (b) N2.
3. System Modeling
3.1. System Simulation Conditions
The proposed systems were simulated using the commercial program Aspen HYSYS v12.1 [31] and analyzed under a steady state. The process simulation conditions have been described by Kwak et al. [4], Shen et al. [25], and Lee [3]. Table 1 lists the conditions of the LNG tank, BOG, and LNG fuel. As shown in Table 1, LNG is composed of methane, ethane, and nitrogen. In the study of Piña-Martinez et al. [32], Peng and Robinson (PR) pertinently predicted the properties of LNG. In addition, the equation of state (EOS) has been mainly used for process analysis using LNG [6]. Therefore, the EOS of the working fluid was used by PR.

Table 1.
LNG tank, BOG, and LNG fuel conditions for the BOG re-liquefaction systems.
Table 2 lists the simulation conditions for the main components of the system, based on Kwak et al. [4] and Shen et al. [25]. These conditions correspond to both the BOG process and N2 reverse Brayton cycle. It is assumed that seawater at 25 °C and 50 kg/s flows into the preheater and cooler. The pressure drop of each stream in the MCHE was assumed as 10 kPa, and the pressure drop and heat loss in the other components and pipes were ignored. The separator only discharges liquefied BOG (LBOG). That is, the mass flow of the gas leaving the separator is assumed to be 0 kg/h.
Table 2.
Main component simulation conditions for the BOG re-liquefaction systems [4,25].
3.2. Energy and Exergy Model
Each thermodynamic state of the BOG re-liquefaction system was determined using various independent variables. In this study, energy and exergy models based on the first and second laws of thermodynamics were used to analyze the nonlinear system. For the control volume of each component constituting the system, mass and energy conservation were established, as shown in Equations (1) and (2) [33]. Energy analysis makes it possible to calculate the power () or heat-transfer rate () of each component using the continuity equation and energy balance.
In steady state, the exergy balance of the control volume is given by Equation (3) [34]. Exergy analysis can be used to calculate the exergy destruction () generated in the component by considering the exergy balance of the components.
In the exergy analysis in this study, the specific exergy (e) was defined as the physical exergy and is expressed as Equation (4). Here, and are the mass enthalpy and mass entropy in the reference state (1 atm, 25 °C).
The energy and exergy models of each component are as follows: the required power () and exergy destruction () of the compressor can be expressed by Equations (5) and (6), respectively.
The power () and exergy destruction () of the expander are expressed by Equations (7) and (8), respectively.
The heat-transfer rate () of the heat exchanger is given by Equation (9). The heat transfer rates at which the hot and cold streams were exchanged are the same. The exergy destruction () of the heat exchanger is defined by Equation (10).
The heat-transfer rate () of the heat exchanger can be expressed using Equation (11), using the heat transfer coefficient (), heat transfer area (), and logarithmic mean temperature difference ().
The heat-transfer rate (, ) and exergy destruction (, ) of the preheater and intercooler are defined by Equations (12)–(15).
The heat-transfer rate (, ) and exergy destruction (, ) of the splitter and mixer are expressed by Equations (16)–(19).
The enthalpy () and exergy destruction () at the throttle valve are expressed by Equations (20) and (21), respectively.
In this study, the SEC and exergy efficiency () were considered as performance indicators for energy and exergy analyses. SEC is a performance indicator generally used in BOG re-liquefaction systems for LNG-fueled ships and is defined by Equation (22) [4,25]. This equation is the ratio of the total power consumption of the compressors in the system required for BOG re-liquefaction to the mass flow rate of LBOG, which was finally re-liquefied and flows into the LNG fuel tank.
The exergy efficiency is defined by Equation (23) [25,34]. This expression is defined as the ratio of the exergy difference between the feed BOG and product LBOG to the total power consumption.
3.3. Economic Model
In this study, a cost evaluation model based on the total capital investment (TCI) was used to analyze the economic feasibility of the system. The TCI consisted of the purchased equipment cost (PEC), direct costs (DC), and indirect costs (IC). PEC was the purchase price of the major components of the system. The DC was the cost associated with equipment installation, piping, electricity, instrumentation, and control. IC was the cost associated with engineering, supervision, construction, and other factors. IC and DC could be predicted based on the PEC [21]. Table 3 lists the equations for calculating TCI.
Table 3.
Equations of total capital investment for the BOG re-liquefaction systems [21].
In this study, after calculating the TCI, the economic feasibility of the system was evaluated using the annual capital investment (ACI), operating costs (OC), and total annual costs (TAC). ACI can be expressed by Equation (24) [18]. Here, referring to the study of Cao et al. [21], the ACI was calculated with an interest rest () and plant lifetime () of 5.7% and 20 years, respectively.
The OC can be expressed by Equation (25), and the electricity cost () was set to 0.1 $/kWh [21]. The annual work operation () required to obtain the ACI was 8640 h [24].
Using the ACI and OC values obtained from Equations (24) and (25), the TAC can be defined by Equation (26).
4. System Optimization
4.1. Optimization Method
After the systems proposed in this study were simulated, they were analyzed using energy, exergy, and economic models. To obtain a state with excellent performance, optimization was performed using a genetic algorithm (GA). In this study, Aspen HYSYS v12.1 [31] and MATLAB R2022a [38] were used for system optimization as shown in Figure 11. Through GA execution in MATLAB, the system can be optimized in Aspen HYSYS. Specifically, independent variables provided by MATLAB are input into Aspen HYSYS. Then, system simulation is performed by Aspen HYSYS. MATLAB accesses the simulation results and selects new input variables. This process is repeated until GA finds the minimum of the objective function. The objective function of the GA was selected as the SEC specified in Equation (22). The optimization was performed by setting the parameters of the GA to default values provided by MATLAB R2022a [38], and the main information is shown in Table 4.
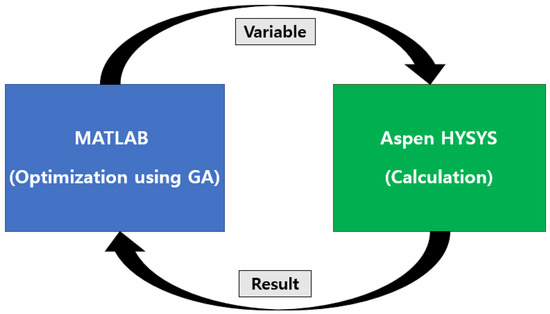
Figure 11.
Schematic of optimization process using Aspen HYSYS and MATLAB.
Table 4.
Genetic algorithm parameter setting for system optimization.
The boundary ranges of the independent variables for the GA optimization were selected using Equations (27)–(33), referring to Shen et al. [25]. Equation (33) was a condition applicable only to Case 2 and was the flow ratio () of the splitter in the system.
Referring to the study of Kwak et al. [4], the constraints for the pinch point temperature difference (PPTD) of the MCHE and the superheat of the expander in the N2 reverse Brayton cycle are expressed as Equations (34) and (35). Variables are optimized so that the objective function is minimized while satisfying the boundary ranges and constraints.
4.2. Optimization Results
Table 5 and Table 6 list the thermodynamic states of the BOG and LNG streams and N2 streams, respectively, in the system optimized using the GA.
Table 5.
Thermodynamic parameters of BOG and LNG streams in the optimized systems.
Table 6.
Thermodynamic parameters of N2 streams in the optimized systems.
As shown in Table 5, in the BOG streams, the states between the base case and Case 2 did not show a substantial difference. However, in the case of Case 1 using LNG cold energy for BOG, it could be seen that the B10 stream temperature was greatly reduced to −151.5 °C by comparing how the BOG temperature at the front of the MCHE was −63.1 °C in the base case and in Case 2. Through this effect, the heat flow required for MCHE for BOG re-liquefaction could be greatly reduced. As shown in Table 6, the thermodynamic states of N2 are different in each case. In particular, a significant difference in N2 mass flow was clearly revealed in each case. In Case 2, where a part of the high-pressure N2 was cooled using LNG cold energy, the flow ratio from the splitter to N8 was approximately 58% of the total mass flow in the N2 cycle. That is, 42% of the total mass of N2 flowed into N10, which was cooled using LNG cold energy, thereby reducing the heat flow of the MCHE. As such, Case 1 and Case 2 required less N2 mass flow compared to the base case because the heat flow of the MCHE was reduced using LNG cold energy. In Case 1 and Case 2, the total mass flow in the N2 cycle was only 14.3% and 52.2% of that of the base case, respectively. This result is expected to reduce the power required for the N2 reverse Brayton cycle.
Figure 12 shows the composite curves of the MCHE for each optimized case. It was optimized with different heat flows and composite curves in the MCHE among the cases. In the base case, the heat flow represented 68.7 kW. As mentioned above, the heat flow of Case 1 and Case 2 were only 10.0 kW and 31.0 kW, respectively. It can be seen that they were reduced compared with those of the base case. The hot composite consisted of two streams. The left side was related to the BOG stream, and the right side was related to the hot N2 stream. The cold composite corresponded to a cold N2 stream. Here, in the base case and Case 2, inflection occurred in the hot composite by the dew point of the BOG. On the other hand, in Case 1, the BOG temperature was greatly reduced owing to the LNG cold energy, and an inflection occurred in the hot composite owing to the temperature difference between the BOG stream and the hot N2 stream.
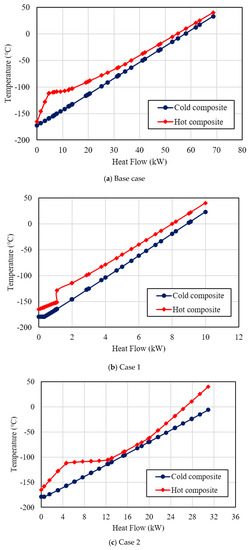
Figure 12.
Composite curves of the MCHE: (a) Base case, (b) Case 1, (c) Case 2.
Meanwhile, looking at Table 5, the mass flow rates of LNG fuel required in Case 1 and Case 2 were 80.5 kg/h and 90.2 kg/h, respectively. Each mass flow rate was lower than the amount of approximately 1000 kg/h required by the DFDE [3]. Therefore, the systems proposed in this study could fully utilize a portion of the LNG fuel supplied to the DFDE for BOG re-liquefaction.
5. Analysis of Optimization Results
In this study, energy, exergy, and economic analyses were performed on the optimized results for each case. These results were compared with those of the systems presented by Kwak et al. [4] (Figure 1) and Shen et al. [25] (Figure 2). To evaluate the systems proposed in this study, the systems presented by Kwak et al. [4] and Shen et al. [25] were simulated, the same models were applied, and the results are presented in Table 7. It can be observed from Table 7 that the simulated systems agreed well with the values presented by Kwak et al. [4] and Shen et al. [25].
Table 7.
Simulation results of previous studies [4,25].
5.1. Energy Analysis
In this study, the duties of the components constituting each system were examined, and an energy analysis was performed based on the total power consumption and SEC required for BOG re-liquefaction. Table 8 lists the duties of the components in each optimized case. When comparing each case, there was no significant difference in the component duty of the BOG stream, but there was a gap in the N2 cycle. In the cases of Case 1 and Case 2 using LNG cold energy, it could be observed that as the MCHE duty decreased, the power consumption of the compressor required in the re-liquefaction cycle decreased.
Table 8.
Duty of components in the optimized systems.
Figure 13 shows the total power consumption and SEC of Kwak et al. [4], Shen et al. [25], the base case, Case 1, and Case 2. Low power consumption and SEC indicated high thermodynamic efficiency. The total power consumption and SEC of the base case without cold energy were 100.6 kW and 1.2 kWh/kgLBOG, respectively, which were lower than those of the system proposed by Kwak et al. [4]. However, these values were higher than those reported by Shen et al. [25] for the BOG self-expansion precooling method. The total power consumption and SEC of Case 1 and Case 2 using cold energy were 26.0 kW, 54.1 kW and 0.3 kWh/kgLBOG, 0.6 kWh/kgLBOG, respectively. These values were much lower than those calculated for the systems proposed by Kwak et al. [4] and Shen et al. [25]. In particular, in Case 1 which used LNG cold energy for BOG, the power consumption required for BOG re-liquefaction could be significantly reduced compared with the existing systems. In other words, it could be seen that BOG re-liquefaction using LNG cold energy is a great benefit in terms of energy efficiency.
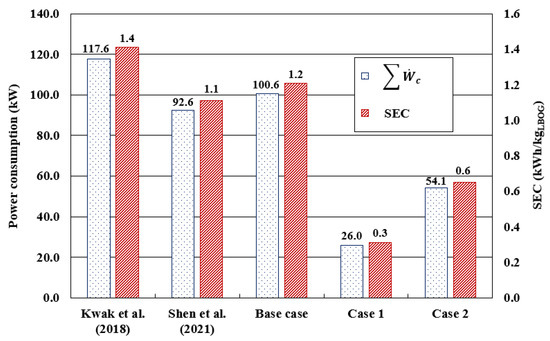
Figure 13.
Power consumption and SEC of the BOG re-liquefaction systems [4,25].
5.2. Exergy Analysis
Figure 14 shows the exergy efficiency and total exergy destruction of Kwak et al. [4], Shen et al. [25], the base case, Case 1, and Case 2. Here, a higher exergy efficiency and lower exergy destruction were systematically advantageous. The exergy efficiency and total exergy destruction of the base case were 23.0% and 62.0 kW, respectively, which were superior to those of Kwak et al. [4], but inferior to those of Shen et al. [25]. The exergy efficiency and total exergy destruction of Case 1 and Case 2 were 88.8%, 42.7% and 16.9 kW, 42.2 kW, respectively. These systems showed significantly higher exergy efficiency and lower exergy destruction compared to the existing systems. That is, it could be seen that the utilization of LNG cold energy is a great benefit not only in terms of energy but also exergy.
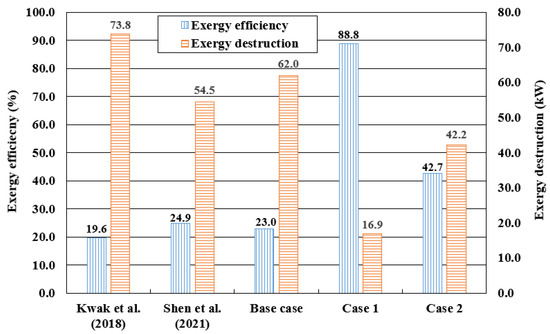
Figure 14.
Exergy efficiency and exergy destruction of the BOG re-liquefaction systems [4,25].
Figure 15 shows the exergy destruction by each component of the optimized base case, Case 1, and Case 2. In the base case, the largest exergy destruction occurred in the compressor, which corresponded to 19.4 kW. In Case 1 and Case 2, the largest exergy destruction occurred in the heat exchanger, which corresponded to 6.3 kW and 17.9 kW, respectively. This is obviously because the heat exchangers in Cases 1 and 2 had an additional flow of LNG fuel. Therefore, the exergy destruction of the heat exchangers in Case 1 and Case 2 occupies a relatively high significance compared to that of the base case. Nevertheless, the total exergy destruction was the largest in the base case and the lowest in Case 1 as shown in Figure 14. Again, the overall exergy destruction was significantly reduced compared to that of the base case.
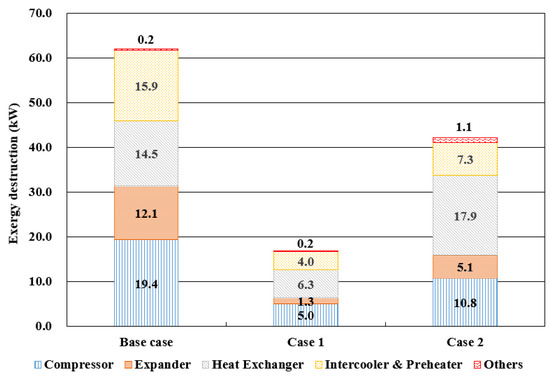
Figure 15.
Exergy destruction of components in the optimized systems.
Figure 16 shows the exergy flow of the optimized base case, Case 1, and Case 2. The total exergy inputs of the base case, Case 1, and Case 2 were 102.1 kW, 50.8 kW, and 81.7 kW, respectively. The total exergy input consists of the exergy inputs of the BOG, LNG fuel, and compressor. In Case 1 and Case 2, despite the presence of LNG fuel exergy input, the compressor power consumption was low, so the total exergy input was the largest in the base case. The total exergy was divided into the LBOG exergy output, exergy destruction, LNG fuel exergy output, and expander work output. The rates of exergy destruction compared to the total exergy input in the base case, Case 1, and Case 2 were 60.7%, 33.3%, and 51.6%, respectively. That is, it can be seen that the system using LNG cold energy is advantageous in terms of exergy efficiency because it destroys the input exergy at a relatively small rate.
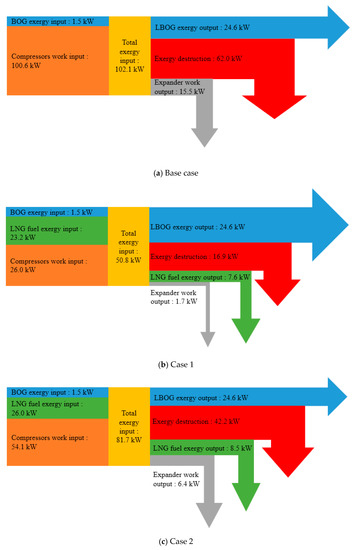
Figure 16.
Exergy flow of the optimized systems: (a) Base case, (b) Case 1, (c) Case 2.
5.3. Economic Analysis
The annual costs of each system were evaluated to perform economic analysis. Figure 17 and Table 9 compare the ACI, OC, and TAC of Kwak et al. [4], Shen et al. [25], the base case, Case 1, and Case 2. The energy and exergy efficiencies of the base case were better than those of Kwak’s system, but not as good as those of Shen’s system. Therefore, the annual costs of the base case shown in Figure 17 and Table 9 were between the costs required by Kwak’s and Shen’s systems. As the results of the economic analysis, Case 1 and Case 2 were found to be very superior to the existing system. TAC of Case 1 was only 31.8% and 38.1% of the costs of Kwak’s and Shen’s systems, respectively. TAC of Case 2 was 54.7% and 65.5% of the costs of Kwak’s and Shen’s systems, respectively. In addition, it can also be seen that the ACI and OC of Case 1 and Case 2 were much lower than those of the existing systems. This is because the power consumption of the compressor and the duty of the heat exchanger were greatly reduced by utilizing cold energy. It resulted in lower PEC, DC, IC, and TCI. Reduced TCI significantly lowered ACI, OC, and TAC. As such, BOG re-liquefaction systems using LNG cold energy showed overwhelmingly advantageous results compared with existing systems in economic analysis. In general, systems with high energy and exergy efficiency are also evaluated as superior in economic analysis. As shown in Figure 17 and Table 9, the significant cost savings for the most efficient Case 1 were noteworthy.
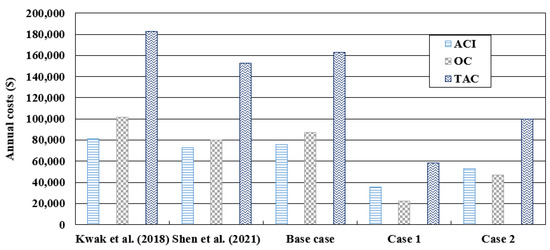
Figure 17.
Annual costs of the BOG re-liquefaction systems [4,25].
Table 9.
ACI, OC, and TAC of the BOG re-liquefaction systems.
6. Conclusions
This study is for a BOG re-liquefaction system for LNG-fueled ships. Specifically, it was assumed that the ship’s engine is a DFDE. A fuel gas supply system that supplies the latent heat of vaporization to the LNG is required for DEDE operations, while a BOG re-liquefaction system that releases latent heat of condensation is required for tank safety on LNG-fueled ships. This study proposed new BOG re-liquefaction systems combined with the fuel gas supply system. In other words, BOG re-liquefaction systems that utilize the cold energy of LNG were presented. In order to objectively evaluate the proposed system, 3E analysis was performed, and the results were compared with the performance level of existing systems. Here, one of the existing systems was a basic BOG re-liquefaction system using the N2 reverse Brayton cycle proposed by Kwak et al. [4], and the other was a system proposed by Shen et al. [25], characterized by using a BOG expander in the BOG re-liquefaction system. The base case defined in this study was slightly modified from their system. The above three processes were BOG re-liquefaction systems that do not use LNG cold energy at all and were reference systems to show the performance improvement of the new BOG re-liquefaction system presented in this study. The newly proposed systems were Case 1 and Case 2. Case 1 directly used LNG cold energy for BOG re-liquefaction, while Case 2 used it for N2 refrigeration cycle.
As for the 3E analysis results, Case 1 and Case 2 using LNG cold energy showed overwhelmingly higher energy and exergy performance than those of the systems proposed by Kwak et al. [4] and Shen et al. [25]. Moreover, Case 1 and Case 2 had significantly lower annual costs. In particular, Case 1, in which LNG cold energy was directly exchanged with BOG, was noteworthy because it had fewer components and showed the best performance in the 3E analysis. The main results of Case 1 and Case 2 can be summarized as follows:
- In Case 1 and Case 2, SEC reached 0.3 kWh/kgLBOG and 0.6 kWh/kgLBOG, respectively. SEC in Case 1 could be improved by 78.6% and 72.7%, respectively, compared to Refs. [4,25].
- Exergy efficiency of each system was 88.8% and 42.7%, respectively. The exergy efficiency of Case 1 was 69.2% and 63.9% higher than those of Refs. [4,25], respectively.
- TAC of each system was 58,089 $ and 99,922 $, respectively. TAC in Case 1 could be reduced by 68.2% and 61.9%, respectively, compared with Refs. [4,25].
As such, this study well revealed the advantages of properly using LNG cold energy in such a way that BOG re-liquefaction systems are integrated with fuel gas supply systems for LNG-fueled ships. In other words, it can be seen that LNG cold energy can constitute a system that is much more compact and simple as well as being very efficient and economical compared to other applied refrigeration cycles. As a result, this study presented novel systems by utilizing LNG cold energy in the BOG re-liquefaction system for LNG fueled-ships and showed superior results compared to other studies. Therefore, the results of this study contribute greatly to suggesting the excellence and applicability of LNG cold energy utilization in this field. The concept proposed by this study is original in this field, but it is at the fundamental stage. Therefore, analysis on large-capacity ships or experimental verification can be considered as a follow-up study.
Author Contributions
Conceptualization, J.-S.K.; methodology, J.-S.K.; software, J.-S.K.; validation, D.-Y.K.; formal analysis, J.-S.K.; investigation, D.-Y.K.; resources, D.-Y.K.; data curation, J.-S.K.; writing—original draft preparation, J.-S.K.; writing—review and editing, D.-Y.K.; visualization, J.-S.K.; supervision, D.-Y.K.; project administration, D.-Y.K.; funding acquisition, D.-Y.K. All authors have read and agreed to the published version of the manuscript.
Funding
This research received no external funding.
Institutional Review Board Statement
Not applicable.
Informed Consent Statement
Not applicable.
Data Availability Statement
Not applicable.
Conflicts of Interest
The authors declare no conflict of interest.
Nomenclature
| Area | Heat transfer rate | ||
| Heat transfer area | Entropy | ||
| Exergy | Temperature | ||
| Specific exergy | Overall heat transfer coefficient | ||
| Enthalpy | Power | ||
| Horse Power | Logarithmic mean temperature difference | ||
| Mass flow rate | Pinch point temperature difference | ||
| Pressure | Superheat degree | ||
| Greeks | |||
| Efficiency | |||
| Subscripts | |||
| Reference state | Intercooler | ||
| Compressor | Inlet | ||
| Cold | Mixer | ||
| Destruction | Outlet | ||
| Expander | Preheater | ||
| Exergy | Separator | ||
| Hot | Splitter | ||
| Heat Exchanger | Valve | ||
| Abbreviations | |||
| 3E | Energy, Exergy, and Economic | ||
| ACI | Annual Capital Investment | ||
| BOG | Boil-Off Gas | ||
| BOR | Boil-Off Rate | ||
| DC | Direct Costs | ||
| DFDE | Dual-Fuel Diesel Electric | ||
| EOS | Equation of State | ||
| GA | Genetic Algorithm | ||
| HFO | Heavy Fuel Oil | ||
| HX | Heat Exchanger | ||
| IC | Indirect Costs | ||
| IMO | International Maritime Organization | ||
| LBOG | Liquefied Boil-Off Gas | ||
| LNG | Liquefied Natural Gas | ||
| MARPOL | International Convention for the Prevention of Pollution from Ships | ||
| MCHE | Main Cryogenic Heat Exchanger | ||
| OC | Operating Costs | ||
| PEC | Purchased Equipment Cost | ||
| PPTD | Pinch Point Temperature Difference | ||
| PR | Peng and Robinson Equation | ||
| SEC | Specific Energy Consumption | ||
| TAC | Total Annual Costs | ||
| TCI | Total Capital Investment | ||
References
- Vedachalam, S.; Baquerizo, N.; Dalai, A.K. Review on Impacts of Low Sulfur Regulations on Marine Fuels and Compliance Options. Fuel 2022, 310, 122243. [Google Scholar] [CrossRef]
- Deng, J.; Wang, X.; Wei, Z.; Wang, L.; Wang, C.; Chen, Z. A Review of NOx and SOx Emission Reduction Technologies for Marine Diesel Engines and the Potential Evaluation of Liquefied Natural Gas Fuelled Vessels. Sci. Total Environ. 2021, 766, 144319. [Google Scholar] [CrossRef] [PubMed]
- Lee, Y.-H. Study on Refrigeration and Power Generation System for LNG Fuelled Refrigerated Cargo Carrier Using LNG Cold Energy. Master’s Thesis, Korea Maritime & Ocean University, Busan, Korea, February 2019. [Google Scholar]
- Kwak, D.-H.; Heo, J.-H.; Park, S.-H.; Seo, S.-J.; Kim, J.-K. Energy-Efficient Design and Optimization of Boil-Off Gas (BOG) Re-Liquefaction Process for Liquefied Natural Gas (LNG)-Fuelled Ship. Energy 2018, 148, 915–929. [Google Scholar] [CrossRef]
- Seo, S.; Han, S.; Lee, S.; Chang, D. A Pump-Free Boosting System and Its Application to Liquefied Natural Gas Supply for Large Ships. Energy 2016, 105, 70–79. [Google Scholar] [CrossRef]
- Park, H.; Lee, S.; Jeong, J.; Chang, D. Design of the Compressor-Assisted LNG Fuel Gas Supply System. Energy 2018, 158, 1017–1027. [Google Scholar] [CrossRef]
- Tan, H.; Shan, S.; Nie, Y.; Zhao, Q. A New Boil-Off Gas Re-Liquefaction System for LNG Carriers Based on Dual Mixed Refrigerant Cycle. Cryogenics 2018, 92, 84–92. [Google Scholar] [CrossRef]
- Ryu, J.; Lee, C.; Seo, Y.; Kim, J.; Seo, S.; Chang, D. A Novel Boil-Off Gas Re-Liquefaction Using a Spray Recondenser for Liquefied Natural-Gas Bunkering Operations. Energies 2016, 9, 1004. [Google Scholar] [CrossRef]
- Moon, J.W.; Lee, Y.P.; Jin, Y.W.; Hong, E.S.; Chang, H.M. Cryogenic Refrigeration Cycle for Re-Liquefaction of LNG Boil-Off Gas. Cryocoolers 2007, 14, 629–635. Available online: https://cryocooler.org/resources/Documents/C14/079.pdf (accessed on 30 December 2022).
- Shin, Y.; Lee, Y.P. Design of a Boil-Off Natural Gas Reliquefaction Control System for LNG Carriers. Appl. Energy 2009, 86, 37–44. [Google Scholar] [CrossRef]
- Sayyaadi, H.; Babaelahi, M. Exergetic Optimization of a Refrigeration Cycle for Re-Liquefaction of LNG Boil-Off Gas. Int. J. Thermodyn. 2010, 13, 127–133. Available online: https://dergipark.org.tr/en/pub/ijot/issue/5778/76833 (accessed on 30 December 2022).
- Nekså, P.; Brendeng, E.; Drescher, M.; Norberg, B. Development and Analysis of a Natural Gas Reliquefaction Plant for Small Gas Carriers. J. Nat. Gas Sci. Eng. 2010, 2, 143–149. [Google Scholar] [CrossRef]
- Romero, J.; Orosa, J.A.; Oliveira, A.C. Research on the Brayton Cycle Design Conditions for Reliquefaction Cooling of LNG Boil Off. J. Mar. Sci. Technol. 2012, 17, 532–541. [Google Scholar] [CrossRef]
- Gómez, J.R.; Gómez, M.R.; Garcia, R.F.; Catoira, A.D.M. On Board LNG Reliquefaction Technology: A Comparative Study. Polish Marit. Res. 2014, 21, 77–88. [Google Scholar] [CrossRef]
- Kochunni, S.K.; Chowdhury, K. Comparison between Reverse Brayton and Kapitza Based LNG Boil-off Gas Reliquefaction System Using Exergy Analysis. In InIOP Conference Series: Materials Science and Engineering; IOP Publishing: Bristol, UK, 2017; Volume 171, p. 012009. Available online: https://iopscience.iop.org/article/10.1088/1757-899X/171/1/012009 (accessed on 30 December 2022).
- Gómez, J.R.; Gómez, M.R.; Bernal, J.L.; Insua, A.B. Analysis and Efficiency Enhancement of a Boil-off Gas Reliquefaction System with Cascade Cycle on Board LNG Carriers. Energy Convers. Manag. 2015, 94, 261–274. [Google Scholar] [CrossRef]
- Tan, H.; Zhao, Q.; Sun, N.; Li, Y. Enhancement of Energy Performance in a Boil-off Gas Re-Liquefaction System of LNG Carriers Using Ejectors. Energy Convers. Manag. 2016, 126, 875–888. [Google Scholar] [CrossRef]
- Kim, D.; Hwang, C.; Gundersen, T.; Lim, Y. Process Design and Economic Optimization of Boil-off-Gas Re-Liquefaction Systems for LNG Carriers. Energy 2019, 173, 1119–1129. [Google Scholar] [CrossRef]
- Yin, L.; Ju, Y.L. Comparison and Analysis of Two Nitrogen Expansion Cycles for BOG Re-Liquefaction Systems for Small LNG Ships. Energy 2019, 172, 769–776. [Google Scholar] [CrossRef]
- Yin, L.; Ju, Y. Conceptual Design and Analysis of a Novel Process for BOG Re-Liquefaction Combined with Absorption Refrigeration Cycle. Energy 2020, 205, 118008. [Google Scholar] [CrossRef]
- Cao, X.; Yang, J.; Zhang, Y.; Gao, S.; Bian, J. Process Optimization, Exergy and Economic Analysis of Boil-off Gas Re-Liquefaction Processes for LNG Carriers. Energy 2022, 242, 122947. [Google Scholar] [CrossRef]
- Son, H.; Kim, J.-K. Operability Study on Small-Scale BOG (Boil-off Gas) Re-Liquefaction Processes. Energy 2019, 185, 1263–1281. [Google Scholar] [CrossRef]
- Son, H.; Kim, J.-K. Energy-Efficient Process Design and Optimization of Dual-Expansion Systems for BOG (Boil-off Gas) Re-Liquefaction Process in LNG-Fueled Ship. Energy 2020, 203, 117823. [Google Scholar] [CrossRef]
- Son, H.; Kim, J.-K. Automated Process Design and Integration of Precooling for Energy-Efficient BOG (Boil-off Gas) Liquefaction Processes. Appl. Therm. Eng. 2020, 181, 116014. [Google Scholar] [CrossRef]
- Shen, J.; Yan, S.; Li, Z.; Xiao, Y.; Tan, N. Design and Analysis of Boil-Off Gas Reliquefaction Processes for the LNG-Fueled Ships. Appl. Therm. Eng. 2021, 199, 117505. [Google Scholar] [CrossRef]
- He, T.; Chong, Z.R.; Zheng, J.; Ju, Y.; Linga, P. LNG Cold Energy Utilization: Prospects and Challenges. Energy 2019, 170, 557–568. [Google Scholar] [CrossRef]
- Bian, J.; Yang, J.; Liu, Y.; Li, Y.; Cao, X. Analysis and Efficiency Enhancement for Energy-Saving Re-Liquefaction Processes of Boil-off Gas without External Refrigeration Cycle on LNG Carriers. Energy 2022, 239, 122082. [Google Scholar] [CrossRef]
- Yin, L.; Qi, M.; Ju, Y.; Moon, I. Advanced Design and Analysis of BOG Treatment Process in LNG Fueled Ship Combined with Cold Energy Utilization from LNG Gasification. Int. J. Refrig. 2022, 135, 231–242. [Google Scholar] [CrossRef]
- Lim, T.-W.; Choi, Y.-S. Thermal Design and Performance Evaluation of a Shell-and-Tube Heat Exchanger Using LNG Cold Energy in LNG Fuelled Ship. Appl. Therm. Eng. 2020, 171, 115120. [Google Scholar] [CrossRef]
- Lim, T.-W.; Choi, Y.-S.; Hwang, D.-H. Optimal Working Fluids and Economic Estimation for Both Double Stage Organic Rankine Cycle and Added Double Stage Organic Rankine Cycle Used for Waste Heat Recovery from Liquefied Natural Gas Fueled Ships. Energy Convers. Manag. 2021, 242, 114323. [Google Scholar] [CrossRef]
- AspenTech. HYSYS User’s Guide, Release V12.1; AspenTech: Bedford, MA, USA, 2021. [Google Scholar]
- Piña-Martinez, A.; Privat, R.; Jaubert, J.N. Use of 300,000 Pseudo-Experimental Data over 1800 Pure Fluids to Assess the Performance of Four Cubic Equations of State: SRK, PR, tc-RK, and tc-PR. AIChE J. 2022, 68, e17518. [Google Scholar] [CrossRef]
- Tian, Z.; Zeng, W.; Gu, B.; Zhang, Y.; Yuan, X. Energy, Exergy, and Economic (3E) Analysis of an Organic Rankine Cycle Using Zeotropic Mixtures Based on Marine Engine Waste Heat and LNG Cold Energy. Energy Convers. Manag. 2021, 228, 113657. [Google Scholar] [CrossRef]
- Lee, H.; Shao, Y.; Lee, S.; Roh, G.; Chun, K.; Kang, H. Analysis and Assessment of Partial Re-Liquefaction System for Liquefied Hydrogen Tankers Using Liquefied Natural Gas (LNG) and H2 Hybrid Propulsion. Int. J. Hydrog. Energy 2019, 44, 15056–15071. [Google Scholar] [CrossRef]
- Couper, J.R.; Penney, W.R.; Fair, J.R.; Walas, S.M. Chemical Process Equipment Selection and Design, 3rd ed.; Elsevier: Amsterdam, The Netherlands, 2012. [Google Scholar]
- Turton, R.; Shaeiwitz, J.A.; Bhattacharyya, D.; Whiting, W.B. Analysis, Synthesis and Design of Chemical Processes, 5th ed.; Prentice Hall: Hoboken, NJ, USA, 2018. [Google Scholar]
- Tesch, S.; Morosuk, T.; Tsatsaronis, G. Exergetic and Economic Evaluation of Safety-Related Concepts for the Regasification of LNG Integrated into Air Separation Processes. Energy 2017, 141, 2458–2469. [Google Scholar] [CrossRef]
- MathWorks. MATLAB User’s Guide, Release R2022a; MathWorks: Natick, MA, USA, 2022. [Google Scholar]


Disclaimer/Publisher’s Note: The statements, opinions and data contained in all publications are solely those of the individual author(s) and contributor(s) and not of MDPI and/or the editor(s). MDPI and/or the editor(s) disclaim responsibility for any injury to people or property resulting from any ideas, methods, instructions or products referred to in the content. |
© 2023 by the authors. Licensee MDPI, Basel, Switzerland. This article is an open access article distributed under the terms and conditions of the Creative Commons Attribution (CC BY) license (https://creativecommons.org/licenses/by/4.0/).