Article

Effect of Wave Phases and Heights on Supercavitation Flow Field and Dynamic Characteristics of Successively Fired High-Speed Projectiles

National-Provincial Joint Engineering Laboratory for Fluid Transmission System Technology, Zhejiang Sci-Tech University, Hangzhou 310018, China
*
Author to whom correspondence should be addressed.
J. Mar. Sci. Eng. 2023, 11(3), 629; https://doi.org/10.3390/jmse11030629
Submission received: 10 January 2023 / Revised: 28 February 2023 / Accepted: 14 March 2023 / Published: 16 March 2023
(This article belongs to the Section Ocean Engineering)

Abstract

:
The study of the water entry of successively fired projectiles under a wave environment is of great significance for the development and application of supercavitation weapons. In this paper, the supercavitating flow field of two successively fired projectiles entering water under different wave conditions is numerically simulated by the volume of the fraction model considering the cavitation of water. The motion of projectiles is handled by the overlapping grid technology and the simulated projectiles have six degrees of freedom. The effects of different wave phases and wave heights on the supercavitating flow field and the dynamic loads of the projectiles are studied. The research results show that the wave phase has an effect on the evolution and size of the supercavitation and the effect of the wave phase on the water splash above the free surface is more obvious. The peak of the drag force of the first projectile under conditions of different wave phases with 0.12 m wave height can be reduced by about 50% compared with that under the no-wave condition. The wave phases have an effect on the peak of the drag coefficient, and for the first projectile the peak under the condition of the 180° phase is about 40% lower than that of the 0° phase. The peak of the drag coefficient of the first projectile decreases with the increase in wave height. When the wave height increases from 0.0 m to 0.05 m, the peak value decreases by about 45%. For all conditions, regardless of wave phases or wave heights, the peak of the drag coefficient of the second projectile is obviously much lower than that of the first projectile. Accordingly, the decrease in the velocity of the second projectile is far slower than that of the first one. Negative values of the drag coefficient on the second projectile are observed when the second projectile enters the cavity of the first one.

1. Introduction

The entry of high-speed projectiles into water is highly instantaneous and nonlinear, involving complex physical phenomena such as a sudden change in parameters during crossing different media, turbulent flow, and cavitation [1,2,3]. Research about the water-entry problem has important applications in the field of national defense and military affairs.
A lot of studies have been carried out on the water entry of objects. Truscott et al. [4,5] conducted a series of studies on the water entry of spheres with different impact velocities, different rotational speeds, and different diameters and surface materials of spheres. In their research, four different cavity seal types are described, that is, quasi-static, shallow seal, deep seal, and surface seal. Yao et al. [6] theoretically and experimentally studied the vertical water entry of projectiles. Ignoring the gravity effect, they established the motion equation of projectiles and the theoretical model describing the evolution of cavitation shape. They found that the evolution of cavitation has an important effect on the ballistic stability of projectiles. Shi et al. [7,8] conducted an experimental study of high-speed blunt bodies vertically entering water and obtained the velocity change during the water-entry process. They found that the ballistic deflection of projectiles depends on the water depth. Chen et al. [9] conducted an experimental study about the influence of head shapes, velocity, and attack angles of slender bodies on ballistic stability. They found that the pressure peak generated by projectiles with the flat head was the largest, but the ballistic stability of the flat one is better than that of other head shapes. The above studies were carried out by experimental methods. The numerical simulations about water entry were also made by many researchers.
Nair et al. [10] numerically simulated the water-entry process of axisymmetric rigid bodies using the volume of fraction model. Kozelkov et al. [11] provided the numerical results of the influence of the attack angle of objects on the deformation of free surface. Kamath et al. [12] numerically studied the water entry of wedges. The deformation of the free surface was captured in detail and compared with the experimental data. Nguyen et al. [13] numerically studied the deformation of the free surface and the motion characteristics of a hemisphere when a three-dimensional hemisphere vertically enters the water with a degree of freedom. In the above numerical simulation, the compressibility of fluids is not considered.
In the research of Neaves et al. [14], the Tait state equation was introduced to consider the compressibility of water and the vertical water entry of high-speed projectiles was numerically simulated. Chen et al. [15] simulated the supercavitation flow of underwater projectiles moving with an ultra-high speed (Ma = 0.7) considering the compressibility of water. They found that the compressibility had different effects on the length and the diameter of the supercavity. The above studies focus on the water entry of a single body, while the continuous water entry of multi-bodies was not included. In practical applications, it is necessary to consider the continuous firing of supercavitating weapons in order to increase the attack strength and damage effects.
For the research of multiple projectiles, Zhou et al. [16] simulated the water entry and water exit processes of two consecutive objects and obtained the supercavitation evolution and the change in the pressure field. They found that the supercavitation profile is disturbed when two projectiles collide. Jiang et al. [17] carried out numerical simulations of the water-entry processes of series- and parallel supersonic projectiles with different head shapes, different water-entry speeds, and different water-entry intervals. They found that the peak of the drag coefficient of the second projectile was significantly smaller than that of the first projectile. Furthermore, they found that the maximal change in the density occurs when the second projectile bumps with the water jet and the maximal pressure occurs. It should be noticed that the above-related studies were made for conditions without waves. However, waves, as the most common and important disturbance in a real ocean environment, which may affect the evolution of cavitation and the dynamic characteristics of projectiles, should be included in the research on the water-entry process.
When considering the effect of waves, most studies focused on the condition of a single body. Wang et al. [18] carried out a series of studies on symmetric and asymmetric wedges with different kinematic parameters entering regular waves with different wave amplitudes. They found that the influence of the horizontal velocity of the wave on the wedge is almost negligible when the wedge enters the wave at a small attack angle. Sun et al. [19] studied the water entry of a three-dimensional cone under the effect of waves. The results of different wave heights were compared with that of no waves and they found that the asymmetry of the pressure distribution at the tip zone of the cone is mainly affected by the horizontal velocity of the cone. In addition, the uneven distribution of the wave made the horizontal velocity of the cone nonlinear.
In addition, in some studies the influence of parameters of waves on the water entry of flat-bottomed bodies was made. Hu et al. [20,21,22] numerically simulated the water entry of flat-bottomed bodies with different velocities under wave conditions and obtained the pressure distribution on the bottom, the change in the maximal pressure in time, and the subsequent submergence process. They found that the pressure coefficient at a certain position decreases with the increase in the velocity of the body. Xiang et al. [23] studied the motion characteristics of falling cylinders in the flow field of regular waves with different amplitudes and frequencies. They found that the trajectory of the falling cylinder during the process of water entry tends to change into a regular vibration around the Z-axis under the wave effect. Zhang et al. [24] conducted a numerical study on the oblique water entry of a cylinder under the action of different regular waves based on the LES method and analyzed the effects of wave heights on the cavitation dynamics. They found that the time from the impact of the cylinder on the water surface to the closure of the cavity under conditions with waves is longer than that under the no-wave condition. Wang et al. [25,26] numerically simulated the vertical water entry process of a cylinder in regular waves and analyzed the influence of wave parameters on the hydrodynamic characteristics of the cylinder.
The above studies of water entry under wave environments focus on a single body. Up to now, there are few studies on continuous water entry of multiple projectiles with high speed under wave conditions. Thus, in the paper, the water entry of two successively fired projectiles under different wave conditions was simulated. The multi-phase and cavitation flow phenomena are considered in the study. The projectile can freely move in three directions and rotate around the x, y, or z-axis. An overlapping grid technology is used to handle the movement of projectiles. The effect of wave phases and wave heights on the supercavitation evolution and dynamic load of projectiles are analyzed in detail.

2. Numerical Methods and Theoretical Model

2.1. Governing Equations

The water entry of bodies is a typical multiphase flow and, in this paper, the multiphase flow is simulated by the volume of fraction (VOF) model. In the multiphase flow model, the fraction of the volume of each fluid, expressed by αl, αg, or αv, was introduced to consider the multi-phases. The continuity and momentum equations used in the paper are:
ρ m t + x i ( ρ m u i ) = 0
t ( ρ m u i ) + x j ( ρ m u i u j ) = p x i + p x i [ μ m ( u i x i + u j x j ) ] + S M
where ui and uj are velocity components in the i and j direction, respectively; ρm is the density of the mixed phases, ρ m = α a ρ a ; μm is the dynamic viscosity of the mixed phases, μ m = α a μ a ; and SM is an attached source item.
In the paper, the RNG κ-ε model [27] was used to simulate the turbulent flow. The equations of the turbulent kinetic energy and dissipation rate are given by Equations (3) and (4), respectively:
t ( ρ m κ ) + x i ( ρ m u i κ ) = x j [ α 1 ( μ m + μ t ) κ x j ] + G ρ m ε
t ( ρ m ε ) + x i ( ρ m u i ε ) = x j [ α 2 ( μ m + μ t ) ε x j ] + C 1 G ε κ C 2 ρ m ε 2 κ
where κ is the turbulent kinetic energy; ε is the dissipation rate; α1 and α2 are Prandtl numbers of κ and ε, respectively; G represents the generations of the turbulence kinetic energy due to the mean velocity gradients; and C1 and C2 are constants.
The transition of the phase for water was considered in the paper by the Schnerr–Sauer model [28], which is derived from the Rayleigh–Plesset bubble equation. When the local pressure is lower than the cavitation pressure, the evaporation rate Re is used to simulate the mass transfer from the liquid phase to the gas phase; in contrast, the condensation rate Rc is used to simulate the phase change from gas to liquid. The transport equation is as follows:
t ( α v ρ v ) + ( α v ρ v v v ) = R e R c
R e = ρ v ρ l ρ m α v ( 1 α v ) 3 R B 2 3 ( p v p ρ l ) , p p v
R c = ρ v ρ l ρ m α v ( 1 α v ) 3 R B 2 3 ( p p v ρ l ) , p > p v
where vv is the velocity of the water vapor; RB is the radius of the bubble; and pv is the saturated vapor pressure.

2.2. Wave Model

In this paper, a second-order Stokes wave [29] is generated by using the UDF (user-defined function) in FLUENT. The velocity and volume fraction of the water at the inlet is defined. The equation of the wave height of the second-order Stokes wave is as follows:
η ( x , t ) = H 2 cos ( k x ω t ) + H 8 ( π H L ) cosh ( k d ) sinh 3 ( k d ) ( cosh ( 2 k d ) + 2 ) cos ( 2 k x 2 ω t )
The lateral and longitudinal velocity equations of the second-order Stokes wave are as follows, respectively:
u = π H T cosh ( k y + k d ) sinh ( k d ) cos ( k x ω t ) + 3 4 π H T ( π H L ) cosh ( 2 k y + 2 k d ) sinh 4 ( k d ) cos ( 2 k x 2 ω t )
v = π H T sinh ( k y + k d ) sinh ( k d ) sin ( k x ω t ) + 3 4 π H T ( π H L ) sinh ( 2 k y + 2 k d ) sinh 4 ( k d ) sin ( 2 k x 2 ω t )
where H is the wave height, k refers to the wave number, d refers to the water depth, T is the period of the wave, and L refers to the wave length.
In order to eliminate the reflection of the wave, the zone, two times the wave length before the outlet boundary of the computational domain, is set as the damping zone. In this area, a damping term is added to the momentum equation as a source term:
u t + u u x + v u y = 1 ρ p x + g x + v ( 2 u x 2 + 2 u y 2 ) β u
v t + u v x + v v y = 1 ρ p y + g y + v ( 2 v x 2 + 2 v y 2 ) β v
β ( x ) = α ( x x 1 ) ( x 2 x 1 ) , x 1 x x 2
where β is the damping coefficient; x1 and x2 are the starting and ending coordinates of the damping zone, respectively; and α is the empirical coefficient.

2.3. Numerical Methods and Boundary Conditions

The simulated computational domain is shown in Figure 1. The left boundary is set as the velocity inlet; the right boundary is set as the pressure outlet; and the other boundaries are set as the non-slip wall. The used boundary conditions are also shown in Figure 1. The upper zone of the computational domain is set as air and the lower area is set as water at the initial time. Two projectiles successively entered the water from the air above. The movement of projectiles was considered using the overset grids technology. The background mesh and the component mesh around a projectile under a two-dimensional view are shown in Figure 2, and the meshes are locally densified around the projectile wall, near the free surface and in the zone that the projectile may pass through.
The diameter D and the length L1 of the projectile are 6 mm and 48 mm, respectively. The material of the projectile is 5005 aluminum magnesium alloy and the mass is 3.56 g. The distance ΔH between the two projectiles is 20D.
The COUPLED scheme is used to solve the coupling between the pressure and the velocity fields, and PRESTO is used for spatial discretization of the pressure field. The CICSAM scheme is used for volume fraction discretization. The second-order upwind scheme is used to discretize the diffusion term in the momentum equations. The first-order implicit scheme is used for time discretization.

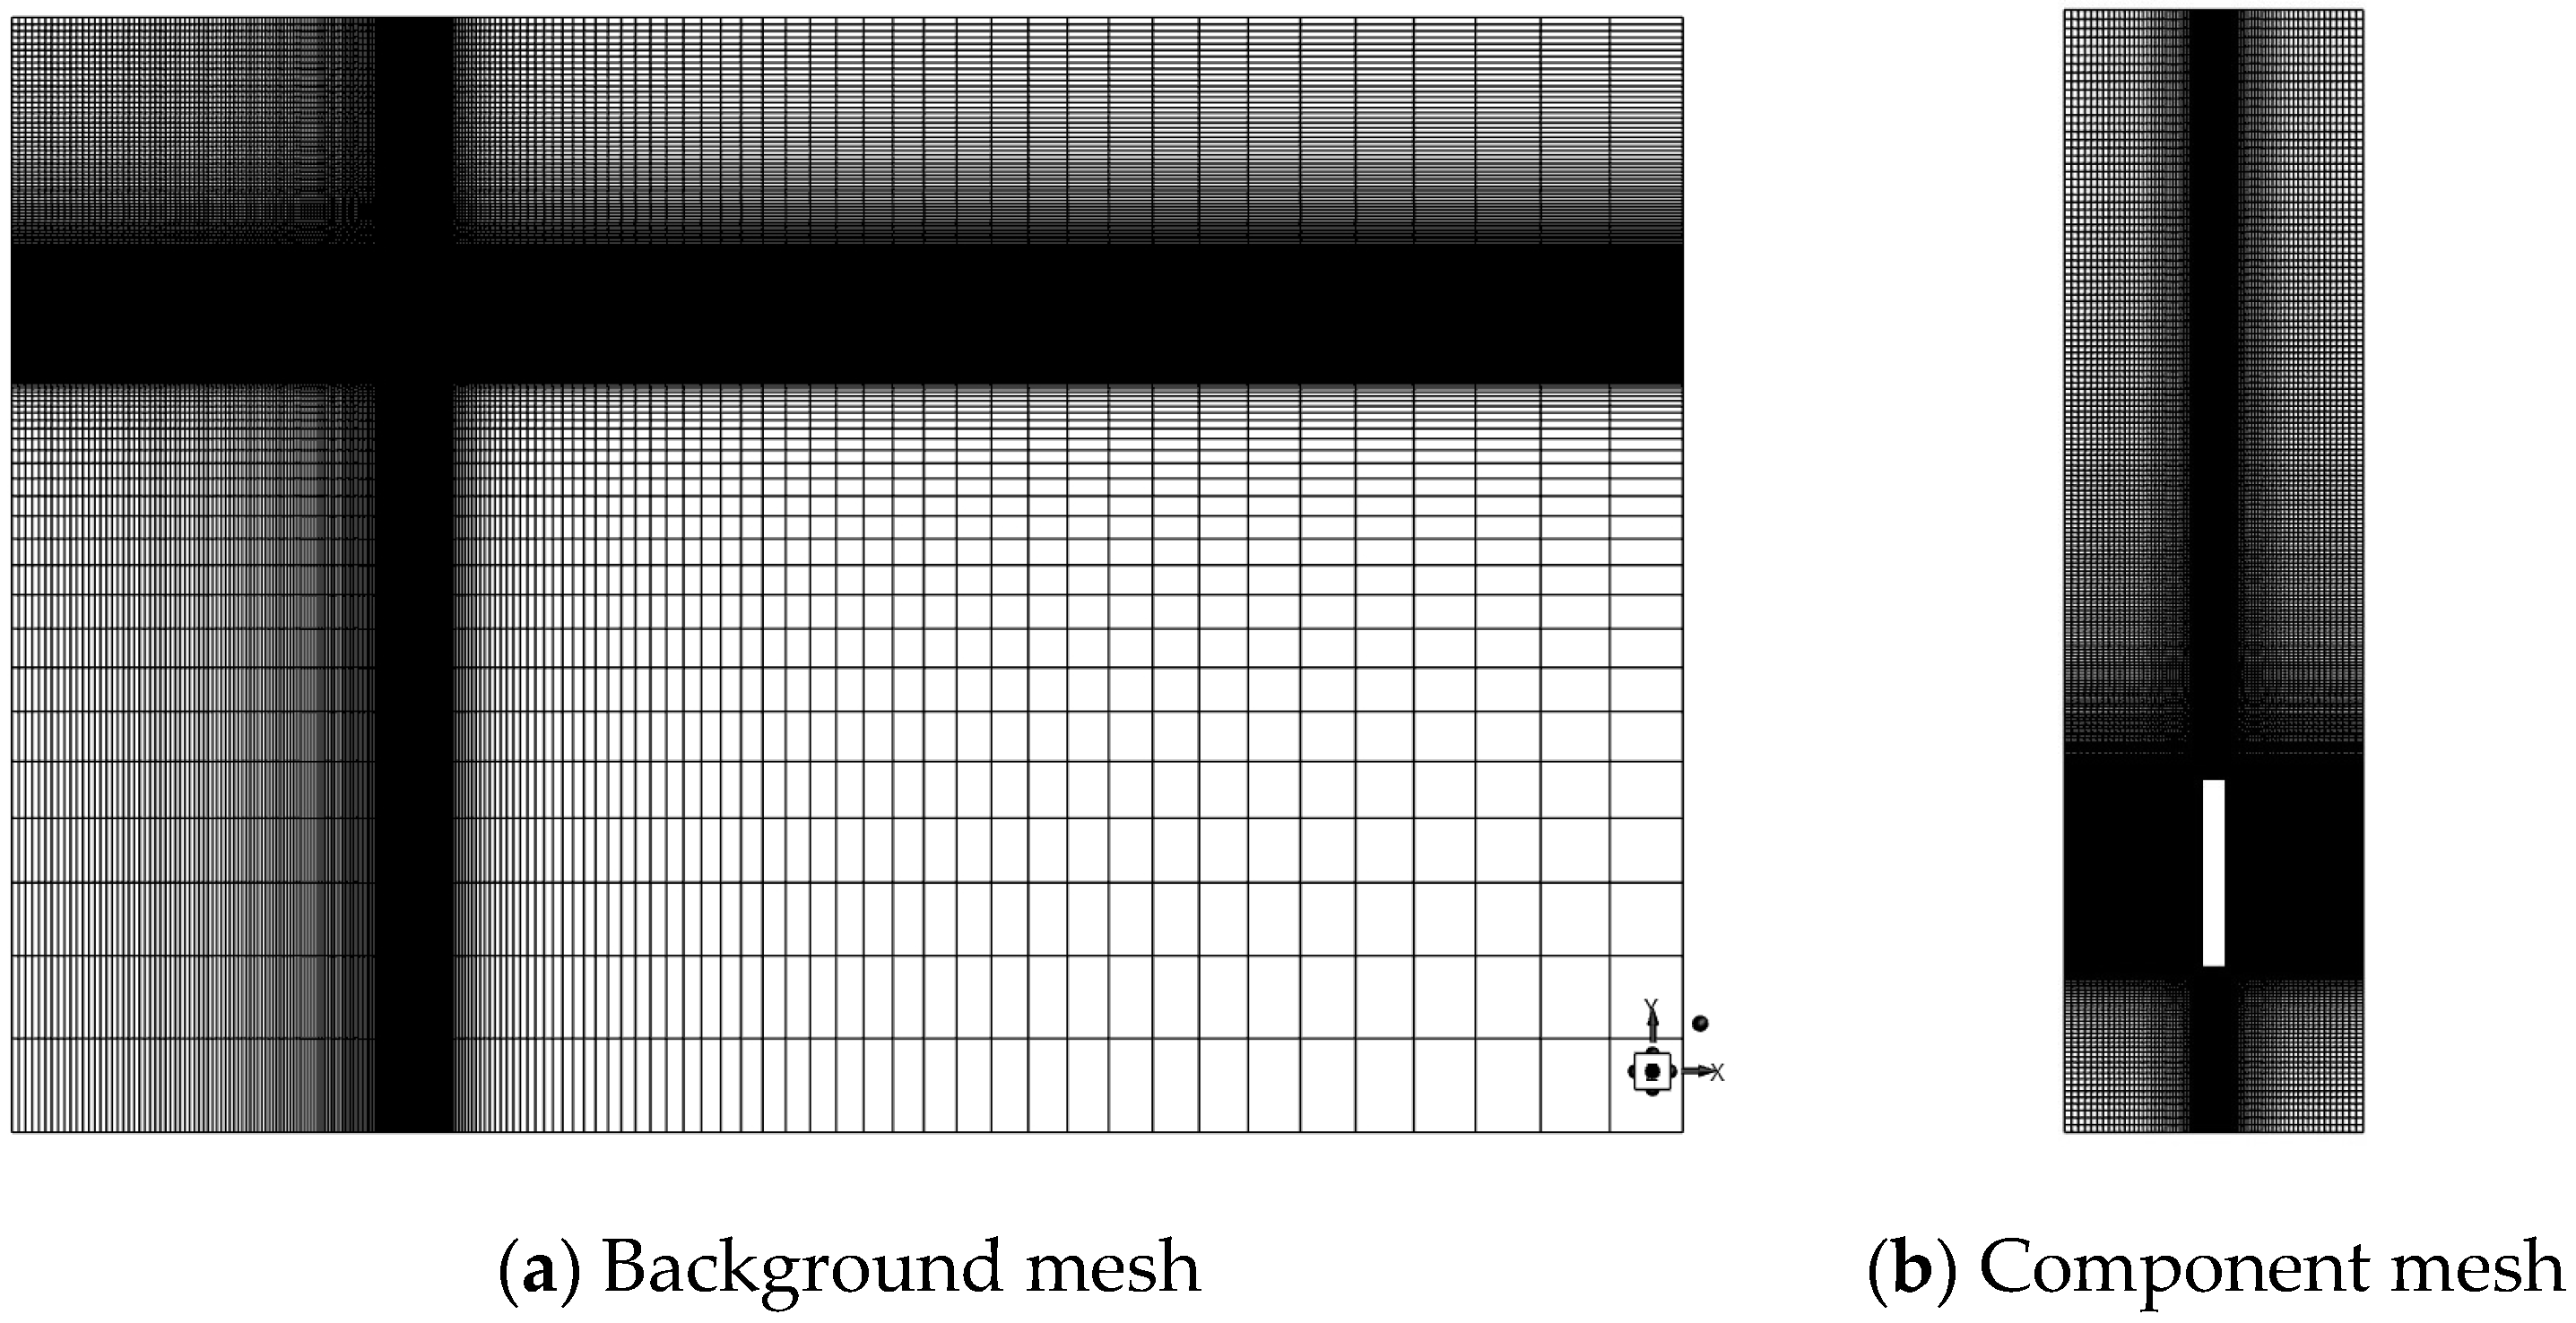
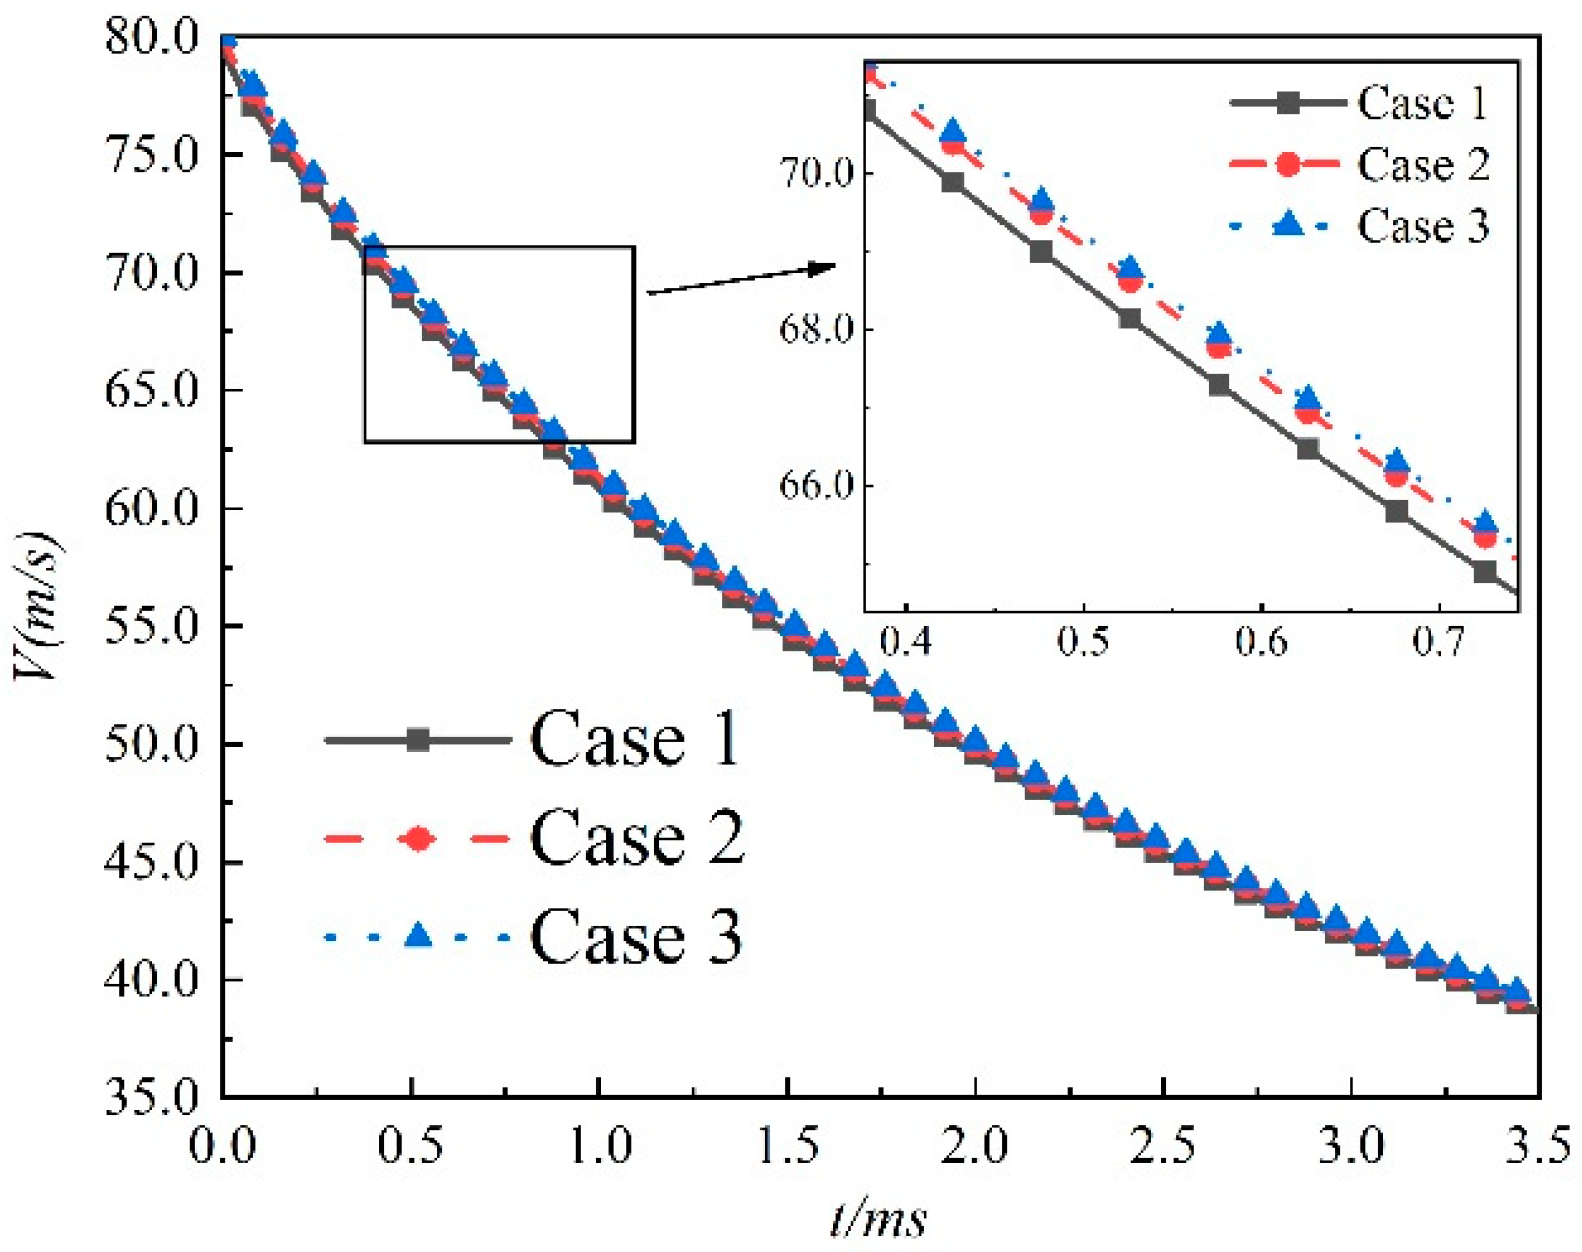
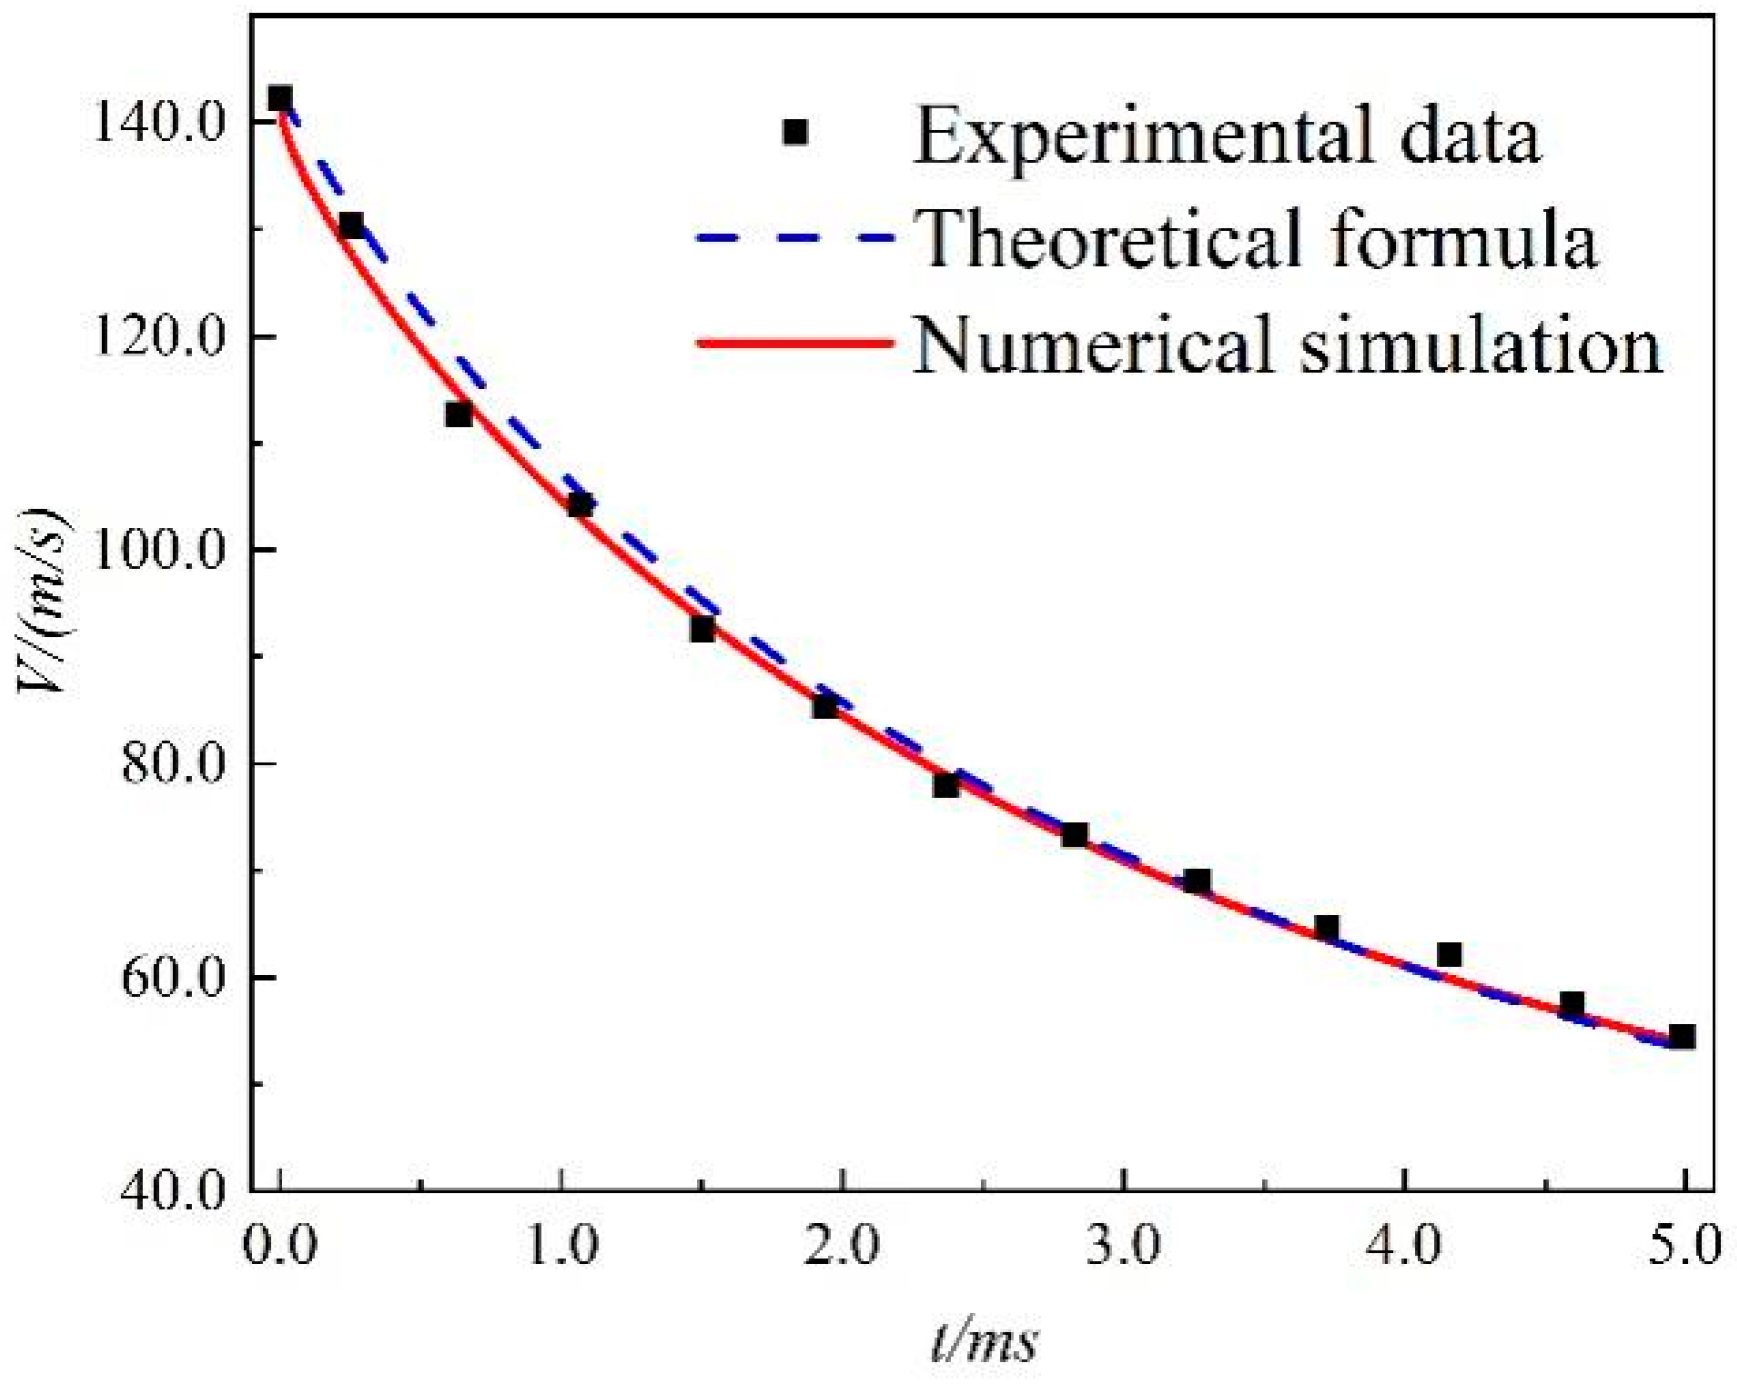
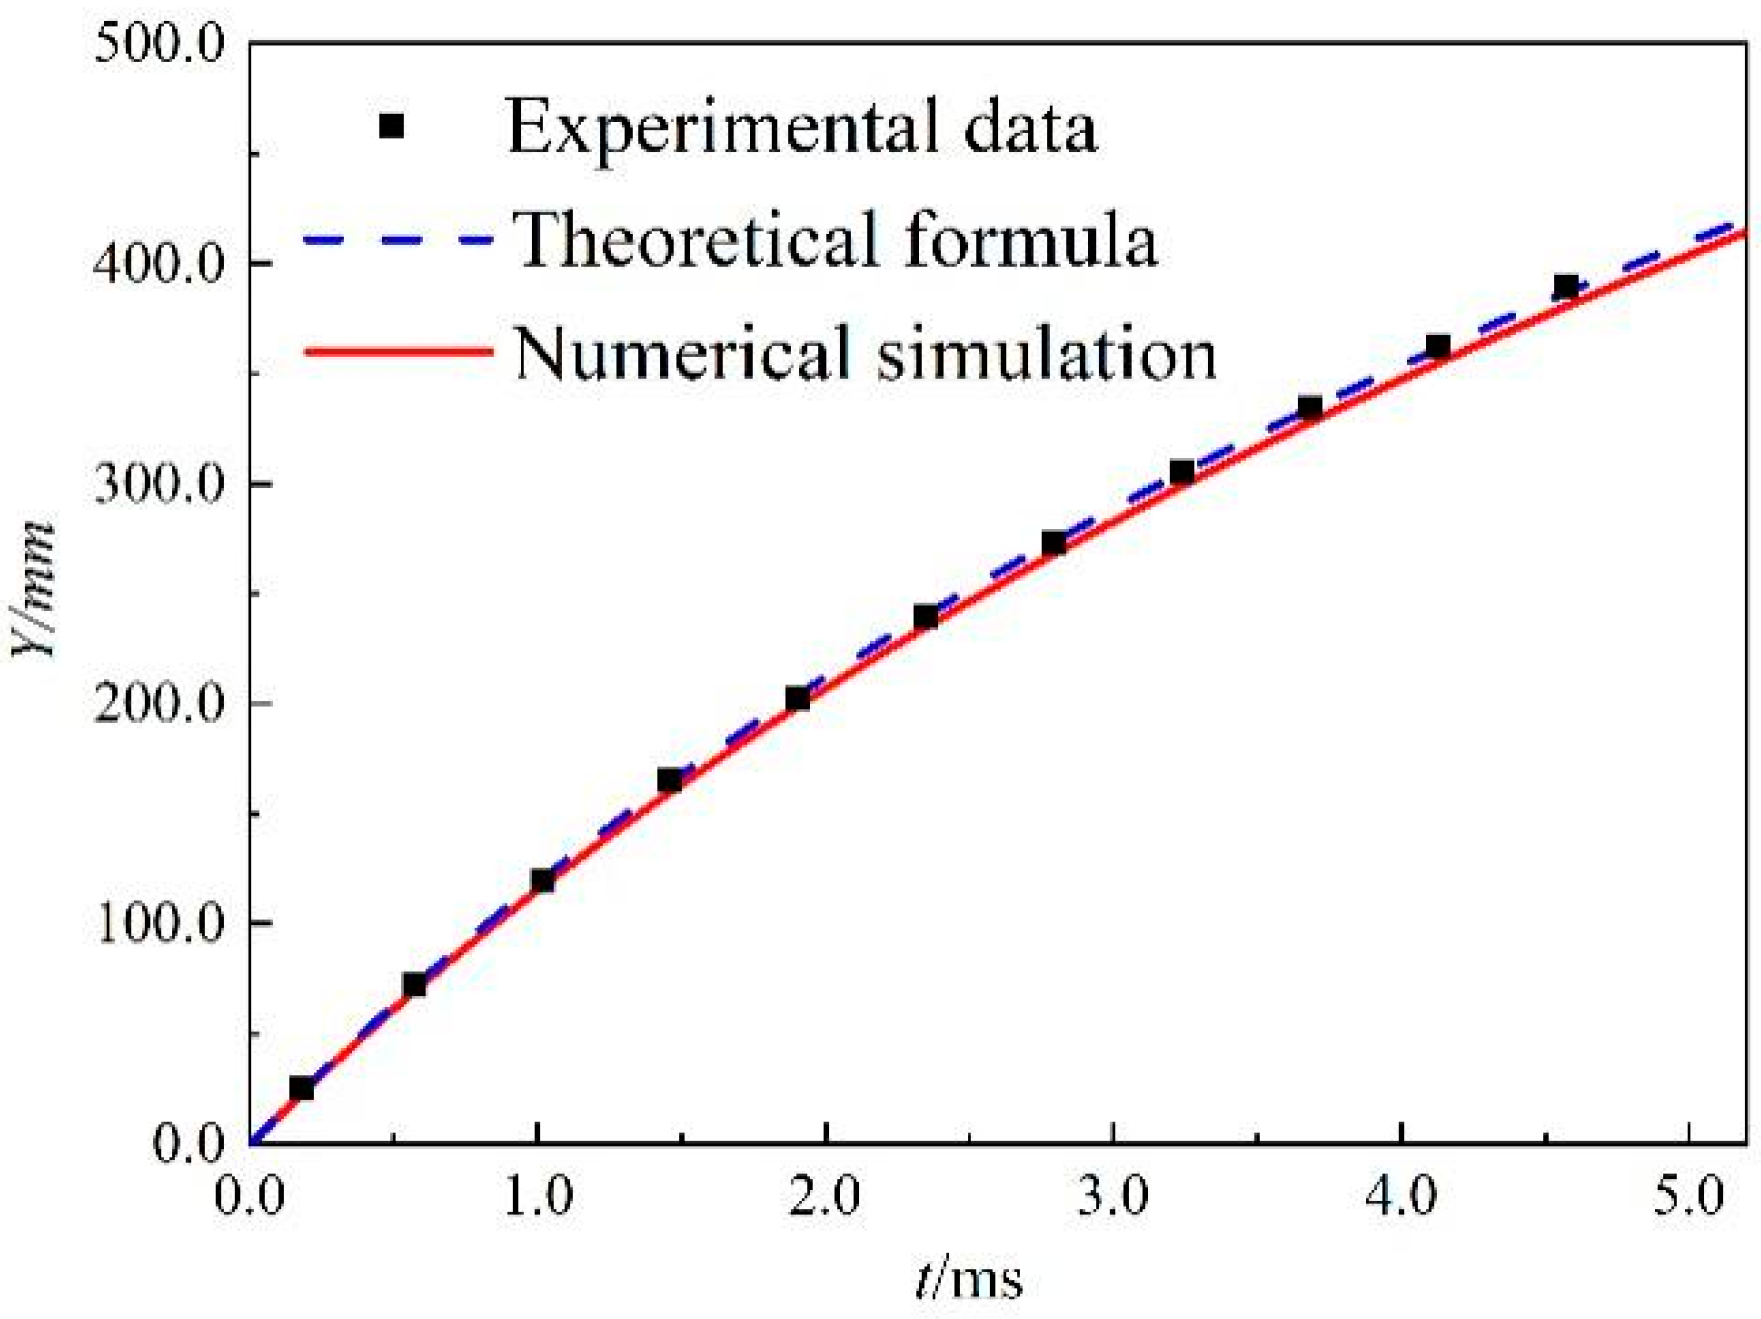
3. Mesh Independence and Numerical Methods Validation

For the grid independence verification, three sets of grids with different densities were established. The number of grids was 0.93 million (Case 1), 2.01 million (Case 2), and 2.78 million (Case 3), respectively. The initial velocity of the projectile is 80 m/s. The velocity change is shown in Figure 3 during the water-entry process of the projectile. It can be seen in the figure that there exists a difference in the results between Case 1 and Case 2, while the results of Case 2 and Case 3 are almost the same even in the locally enlarged view. Considering the calculation time, the grid of Case 2 is selected for the numerical calculation.
The numerical verification of the wave tank and the water-entry process under the no-wave condition was verified, respectively, due to the lack of relevant experiments on successively fired projectiles entering water under wave conditions.
The numerical wave tank refers to the data in Ref. [30]. The parameters of the used second-order Stokes wave are as follows: wave length L = 2.2483 m, wave height H = 0.05 m, and period T = 1.2 s. A monitoring point was set at the free surface to observe the change in the wave height, and the comparison with the theoretical formula is shown in Figure 4. It can be seen that the result of the numerical wave is in good agreement with the theoretical formula.
The verification of the numerical methods is carried out with reference to the experimental data in the literature [31]. The geometric parameters of the projectile used in the simulation are consistent with the experiment [31] and the initial velocity of the projectile is 142.7 m/s, which is also the same as the experiment. The change of the velocity and displacement of the projectile after entering the water are shown in Figure 5 and Figure 6. It can be seen from the figure that the simulation results are in good agreement with the experimental data and the theoretical formula. Figure 7 shows the comparison of the cavity shape at t = 3.0 ms between the experiment and numerical simulation, and it can be observed that the agreement is good.

4. Results and Discussion

4.1. Water Entry of Successively Fired Projectiles in Different Wave Phases

In order to analyze the effect of waves on the cavitation flow field, the cavitation flow field of the successively fired projectiles entering water under the no-wave condition was first studied. Figure 8 shows the cavitation evolution process of the successively fired projectiles entering the water under the no-wave condition, and the time interval between the two adjacent pictures is 0.6 ms. The initial velocity of both the first- and second projectiles is 80 m/s. The distance between the two projectiles is 20D. It is defined that t = 0 ms is the time when the head of the first projectile contacts the free surface.
It can be seen from the figure that when t = 0.8 ms, the first projectile has completely entered the water and is completely wrapped by the cavity, accompanied by splashes on the water’s surface. At t = 1.4 ms, the cavitation on the forward projectile is gradually pulled away from the free surface, and necking occurs at the tail of the cavity. At this time, the splash height on the free surface increases further. When t = 2.0 ms, the second projectile reaches the free surface and interacts with the splash caused by the first projectile. At t = 2.6 ms, the head of the second projectile has entered the cavity of the first projectile, and the tail of the second projectile interacts with the free surface disturbed by the first one. At t = 3.8 ms, the second projectile completely enters the cavity of the first one and the cavity is closed. Meanwhile, the section at the tail of the cavity shrinks. When the second projectile passes through the free surface, it causes water splash again. At t = 4.4 ms, the diameter of the cavity decreases and the length of the cavity increases. The size of the cavity continues to decrease at the tail, which may promptly collapse.
Figure 9a–d show the supercavitation evolution under conditions of different wave phases with a wave height of 0.12 m. The definition of wave phases is shown in Figure 1. In the paper, 4 different wave phases, 0°, 90°, 180°, and 270°, are investigated, where the wave phase of 90° corresponds to the wave peak and the wave phase of 270° is the wave valley. The velocity of two projectiles and the distance between the two projectiles are the same as those under the no-wave condition.
It can be seen that for all conditions, the second projectile has experienced the same process: first, it interacts with the free surface disturbed by the first projectile, and then it enters the cavity of the first projectile.
However, the effects of the wave phases on the supercavitating flow are also obvious. At t = 3.2 ms, the second projectile has completely entered the cavity of the front projectile under the 4 conditions of different phases in Figure 9a–d(5), while under the no-wave condition, the second one has not completely entered the front cavity at the same time in Figure 8(5). The reason may be due to the change in the cavity size under different conditions, which is proved in the comparison of cavitation contours.
For the conditions of 0°, 90°, and 270° phases, the complete closure time of the cavity is at t = 3.8 ms (Figure 9a,b,d(6)), which is nearly the same as that for the condition with no waves. However, at the 180° phase, the closure of the cavity is earlier, which occurs at t = 3.2 ms (Figure 9c(5)).
Under the no-wave condition, the splash on the free surface is basically symmetrical when and after the projectile interacts with the free surface. In the presence of waves, the splash is different under conditions with different wave phases. At the 0° and 90° phases, the splash on the left side of the projectile is obviously higher than that on the right side; at the 180° phase, the right side is higher than the left side; and at the 270° phase, the splash is basically symmetrical. The symmetry or asymmetry of water splashes under different conditions may be caused by the difference in the thickness of the water layer interacting on both sides of the second projectile head.
In this study, the projectile enters the water vertically. Under the condition of no waves, the thickness of the water layer on both sides of the projectile head is the same, and the splash is symmetrical due to the same momentum exchange on both sides.
At the 0° phase, the water layer on the left side of the second projectile head is thinner than that on the right side. Thus, the speed obtained by the thinner water layer is higher, and the splash is higher.
At the 90° phase, the first projectile enters the water just at the wave peak. At this time, the thickness of the water layer on both sides of the projectile head should be the same. However, since the wave has a traveling speed from left to right, and the wave peak is relatively steep, the wave phase should be between 0° and 90° when the second projectile reaches the free surface. Therefore, the splash asymmetry at this phase is similar to the 0° phase.
The situation at the 180° phase is just opposite to that of the 0° phase. At this condition, the water layer on the left side of the second projectile head is thicker than that on the right side. Therefore, the splash on the right side of the projectile is more obvious than that on the left side.
The 270° phase is the wave valley. Under this condition, the splash is symmetrical, similar to that under the no-wave condition. The reason for the symmetrical splash in this condition is as follows: on the one hand, the waveform of the second-order Stokes wave is relatively flat at the bottom; on the other hand, the traveling speed of the wave is one order of magnitude smaller than that of the projectile; and this makes the splash at the 270° phase similar to that of the no-wave case.
In order to compare the size of the cavity more intuitively, Figure 10 shows the cavity profile of the first projectile at t = 1.4 ms for different conditions. It can be seen that the size of the cavity under the four wave phases is similar. The length of the cavitation around the first projectile under wave conditions is increased by about 15% compared with that under the no-wave condition. That is, the size of the cavity under the no-wave condition is smaller than that with waves, which may be the reason why the time for the no-wave condition, when the second projectile is completely wrapped by the cavity of the first projectile, is later than that of the conditions with waves.
When the projectile is close to the free surface, it is subjected to a great impact load. Figure 11a shows the pressure change curve at the center point of the head of the first projectile under different conditions. The abscissa is the time, and the ordinate is the dimensionless pressure. For all of the conditions, the pressure at the center point of the head rises sharply to a peak, then drops rapidly to a lower value, and then the pressure slowly decreases. Under the condition of no waves, the maximum peak pressure is about 357 times the atmospheric pressure. For the four phases with waves, the peak pressure decreases significantly, which is only about half of that in the no-wave case. Among the 4 different wave phases, the peak value is the largest at the 0° phase; at the 180° phase, the peak value is the minimum and the peak pressure of the 180° phase decreases by about 27% compared with that of the 0° phase.
Figure 11b shows the change in the drag coefficient Cd of the forward projectile. Cd is defined as Cd = 2F/ρv2A, where F is the drag force on the projectile, v is the velocity of the projectile, and A is the cross-sectional area of the projectile. It can be seen from the figure that the change trend of the drag force coefficient of the first projectile is similar to that of the pressure. That is, the drag coefficient increases sharply when the projectile bumps with the free surface, then rapidly drops to a lower level, and then gradually decreases.
The change trend of the peak of the drag coefficient under different conditions is basically consistent with that of the peak pressure at the midpoint of the head. The peak value of the drag coefficient is the largest under the condition of no waves; the maximum of the drag coefficient under the wave conditions is only about half of that without waves. For the 4 different wave phases, similarly, the peak value of the drag coefficient is maximum at the 0° phase; at the 180° phase, the peak value is the minimum and the peak drag coefficient of the 180° phase is about 40% lower than that of the 0° phase.
The influence of wave phases on the peak value of the drag coefficient may be due to the difference in the flow field characteristics between the free surface and the head of the projectile. Literature [32] points out that there exists a mixture, also known as the air cushion, formed by air and water between the flat bottom of bodies and the water surface when bodies enter water. Under the action of the air cushion, the peak pressure on bodies with a flat bottom is much smaller than the theoretical value.
The reason for the difference in the peak of the bumping load for different conditions may be due to the effect of the named air cushion. For the condition of the 0° phase, there is a counterclockwise vortex between the head of the projectile and the free surface, while at the 180° phase, the direction of the vortex is just opposite, clockwise, as shown in Figure 12. When the projectile enters the water at the 0° phase, the air tends to escape from the air cushion before the head of the projectile and the air cushion effect on the forward projectile is reduced, while in the case of the 180° phase, the air in the flow field tends to be drawn into the air cushion and the air cushion effect is strengthened. This results in the peak at the 180° phase being lower than that at the 0° phase.
Figure 13a shows the pressure change curve of the center point of the second projectile head. The abscissa is the time, and the ordinate is the dimensionless pressure. It can be seen that in the initial stage, the pressure on the head of the second projectile is very small and this is because the second projectile is still moving in the air before t = 1.8 ms for the condition without waves or t = 2.0 ms for the conditions with waves.
A large pressure occurs when the second projectile meets the upward jet induced by the first projectile. Then, with the movement of the second projectile, the second projectile passes through the disturbed free surface and the pressure decreases. Finally, the second projectile enters into the cavity of the first projectile. Due to the low pressure inside the cavity, the pressure at the head of the second projectile drops rapidly. By comparing Figure 11a and Figure 13a, it can be seen that the pressure peak of the second projectile is far less than that of the first projectile, although the peak value varies under different conditions. Under the no-wave condition, the peak pressure of the second projectile is less than 6% of that of the first projectile. Under different conditions, the peak of the second one is reduced about 85–95% compared with that of the first one.
Figure 13b shows the change in the drag coefficient of the second projectile during its entry into the water. The change trend of the drag coefficient of the second projectile is also similar to that of the pressure. In the no-wave condition, the peak value of the drag coefficient is the largest and the minimum appears under the phase of 270° (wave valley). By comparing Figure 11b and Figure 13b, it is also found that the peak of the drag coefficient of the second projectile is much lower than that of the first projectile. Under the no-wave condition, the peak of the second projectile is only about 7% of that of the first projectile, which means that the peak of the drag coefficient decreases by about 93% due to the effect of the first projectile on the free surface.
In addition, it should be noticed that after t = 2.6 ms (under the condition without waves) or about t = 2.4 ms (under conditions with waves), the drag coefficient of the second projectile is less than 0. This means that the projectile is subjected to a force whose direction is the same as the direction of the motion. The reason that the negative drag coefficient occurs may be that the pressure on the head of the second projectile is very low and lower than that at the tail of the second projectile because the head of the second projectile is inside the cavity of the first projectile. Thus, the second projectile is subjected to a forward force.
Figure 14 shows the speed change of the first and second projectiles under different conditions. t = 0 ms is the moment when the first projectile reaches the free surface. It can be seen from the figure that for the first projectile the speed decreases gradually during the entire duration of the studied period.
For the second projectile, the velocity remains nearly unchanged before t = 1.8 ms (condition without waves) or 2.0 ms (conditions with waves) because the second projectile is still moving in the air during this time. After that, the head of the second projectile interacts with the upward jet or/and disturbed free surface and the drag force increases. Thus, the speed decreases obviously.
After about t = 2.5 ms, the velocity of the second projectile remains unchanged again. The reason is that the second projectile gradually enters the cavity of the first projectile, and the drag coefficient rapidly decreases to about zero.
From Figure 13b, it can be observed that after t = 2.6 ms (under the condition without waves) or about t = 2.4 ms (under conditions with waves), the drag coefficient of the second projectile is negative, and the second projectile is subjected to a forward force. This means that the velocity of the second projectile should be increased. However, on the one hand, the magnitude of the force is relatively small; on the other hand, the duration of the force is relatively short. Thus, the acceleration of the projectile is not observed in the velocity change.
Afterwards, the second one will catch up to the first one and collide with it because the speed of the second projectile is faster than that of the first one, which is beyond the scope of this study and will not be discussed here.

4.2. Water Entry of Successively Fired Projectiles in Different Wave Heights

In order to study the influence of wave heights on the cavitation flow field, 5 conditions with different wave heights, H = 0.0 m, 0.05 m, 0.1 m, 0.12 m, and 0.15 m, are studied in this paper. Flow fields at different wave heights are simulated here only at the 0° phase.
Figure 15a shows the pressure change at the center point of the first projectile head at different wave heights. It can be seen that the pressure peak for different wave heights decreases with the increase in wave height. The pressure peak is maximal for the condition of wave height H = 0.0 m. The reason for this difference may be that the higher the wave height, the stronger the air cushion effect. That is, the cushioning effect of the air is stronger with the increase in the wave height.
When the wave height increases from 0.0 m to 0.05 m, the pressure peak decreases by about 45%. When the wave height increases from 0.05 m to 0.15 m, the pressure peak decreases by only about 28%. That is, the peak pressure does not decrease linearly with the wave height from 0.0 m to 0.15 m. However, when the wave height varies from 0.05 m to 0.15 m, it can be seen from the graph that the peak pressure decreases approximately linearly.
Figure 15b shows the drag coefficient curve of the first projectile at different wave heights. The trend of change in this curve is very similar to that in Figure 15a. When the wave height increases from 0.0 m to 0.05 m, the peak of the drag coefficient decreases by about 45%, while when the wave height increases from 0.05 m to 0.15 m, the peak of the drag coefficient decreases by only about 13%.
Figure 16a shows the pressure change at the center point of the head of the second projectile at different wave heights. It can be seen that the pressure peak under different wave heights is larger than that under the no-wave condition. It should be pointed out that the pressure peak for the second projectile is one order of magnitude lower than that on the first projectile.
Figure 16b provides the change in the drag coefficient on the second projectile for different wave heights. It can be seen from the figure that the peak of the drag for the condition with 0.05 m wave height is about 2 times that for the no-wave condition. However, it should be remembered that the peak of the drag coefficient of the second projectile is significantly smaller than that of the first projectile. In addition, the drag coefficient takes a longer time to decrease from the peak to a stabilized level. This may be because the latter projectile needs to first interact with the upward jet above the free surface, then the disturbed free surface, and then the gas–liquid mixing zone before it enters the cavity of the first projectile.
Figure 17 shows the velocity change of the first and second projectiles at different wave heights. It can be seen that the change in the velocity of the second projectile under different conditions is obviously slower than that of the first one because the drag on the second one is much lower than that of the first one. In addition, the decrease in the second one under the no-wave condition is also smaller than that under conditions with different wave heights.

5. Discussion

In this paper, the cavitation flow field and the dynamic force on two successively fired projectiles are simulated and analyzed for several conditions with different wave phases and wave heights. The results show that not only for the different wave phases but also for different wave heights, the dynamic force on the second projectile is one order of magnitude smaller than that on the first projectile.
In the study of Rabbi et al. [33], they found that the force on the second sphere is reduced if the Mt number is in the range of 0.2 < Mt < 0.65 and 1.43 < Mt < 4, while the force on the second sphere will be increased if Mt satisfies the range of 0.65 < Mt < 1.43. In their study, the Mt number is defined as: M t = t t p , where ∆t is the time difference between the two spheres passing the free surface, and tp is the pinch-off time of the first cavity.
In this study, the time difference between two projectiles is 2.1 ms; the pinch-off time of the first cavity is 2.4–2.8 ms for different wave conditions [34]. Thus, the Mt is in the range of 0.75–0.875. According to the study of Rabbi et al. [33], the force on the second body should be increased, which is inconsistent with the conclusion that the force on the rear projectile decreases in this paper. The reason may be that the first sphere in the study [33] is a smaller one than the following one, which can produce a cavity with a different diameter and length. In addition, the intensity of the upward jet induced by the first body will also be different due to the different sizes of the front one. With the difference in the cavity size and the intensity of the upward jet, the force on the second body must be affected. The other reason may be the head shape of the body: the head shape is round in [33], while the shape of the head in this study is flat.
In the literature [17], researchers investigated the supercavitation flow of two successively fired cylinders during water entry without considering the effect of waves. The head shape of the cylinder is flat and the geometric parameters of the two cylinders are the same, which is similar to the case in this paper. In their research, the peak of the force on the second cylinder is reduced when Mt = 1, which is inconsistent with that of Rabbi et al. [33] but consistent with the results of this paper. In addition, in the study of Jiang et al. [17], the peak of the second cylinder is reduced by about 80% compared with that of the first one, which is also similar to the magnitude of the results in this paper.
To achieve further conclusions, more detailed investigations are required including research on different head shapes, different diameters of objects, different distances between two objects, and so on.

6. Conclusions

In this paper, the supercavitation flow field of two successively fired projectiles entering water for different wave conditions was numerically simulated. The effects of different wave phases and wave heights on the cavitation flow field, the pressure on the projectile head, drag force coefficient, and velocity change of projectiles were analyzed. The research results show that:
  • The wave phase has an effect on the cavitation shape and has a significant effect on the water splash. The length of the cavitation around the first projectile under wave conditions is increased by about 15% compared with that under the no-wave condition. At the 0° phase, the splash on the left side is stronger than that on the right side, while at the 180° phase, the splash on the right side is higher than that on the left side. The asymmetry of the water splash may be caused by the difference in the thickness of the water layer on the left and right sides of the head of the projectile vertically entering the water.
  • For the first projectile, the peak of the drag force coefficient under wave conditions is about 50% compared with that under the no-wave condition. The wave phases have an effect on the peak of the drag coefficient. The peak value of the drag coefficient of the first projectile is the largest for the 0° phase; while for 180° phase, the peak value is the minimum. The peak under the condition of the 180° phase is about 40% lower than that of the 0° phase.
  • The peak of the drag force coefficient of the first projectile decreases with the increase in the wave height. When the wave height increases from 0 m to 0.05 m, the peak value of the drag coefficient decreases by about 45%. When the wave height continues to increase, the downward trend of the peak value slows down. The peak value of the drag coefficient decreases only by about 13% when the wave height increases from 0.05 m to 0.15 m.
  • For different conditions, the peak of the drag of the second projectile can be reduced by about 85–95% compared with that of the first one. That is, the peak on the second one is far less than that of the first one. Correspondingly, the decrease in the velocity of the second one is much slower than that of the front one.
  • When the second projectile enters the cavity of the first one, a negative value of the drag coefficient is observed on the second projectile.

Author Contributions

Methodology, H.J.; software, Z.W.; validation, Z.W.; investigation, Z.W. and H.J.; writing—original draft preparation, Z.W.; writing—review and editing, L.Z. and H.J.; visualization, Z.W.; supervision, L.Z.; project administration, L.Z. All authors have read and agreed to the published version of the manuscript.

Funding

This research was funded by the Natural Science Foundation of Zhejiang Province, China (grant number: LQ13A020005, LY17E060006) and National Natural Science Foundation of China (grant number: 51876194, 52176048, U1909216).

Data Availability Statement

Not applicable.

Conflicts of Interest

The authors declare no conflict of interest. The funders had no role in the design of the study; in the collection, analyses, or interpretation of data; in the writing of the manuscript; or in the decision to publish the results.

References

  1. Laberteaux, K.R.; Ceccio, S.L. Partial cavity flows. Part 1. Cavities forming on models without spanwise variation. J. Fluid Mech. 2001, 431, 1–41. [Google Scholar] [CrossRef]
  2. Koukouvinis, P.; Naseri, H.; Gavaises, M. Performance of turbulence and cavitation models in prediction of incipient and developed cavitation. Int. J. Engine Res. 2017, 18, 333–350. [Google Scholar] [CrossRef]
  3. Ghorbani, M.; Sadaghiani, A.K.; Villanueva, L.G.; Koşar, A. Hydrodynamic cavitation in microfluidic devices with roughened surfaces. J. Micromech. Microeng. 2018, 28, 075016. [Google Scholar] [CrossRef]
  4. Truscott, T.T.; Techet, A.H. Water entry of spinning spheres. J. Fluid Mech. 2009, 625, 135–165. [Google Scholar] [CrossRef] [Green Version]
  5. Truscott, T.T. Cavity Dynamics of Water Entry for Spheres and Ballistic Projectiles. Ph.D. Thesis, Massachusetts Institute of Technology, Cambridge, MA, USA, 2009. [Google Scholar]
  6. Yao, E.; Wang, H.R.; Pan, L.; Wang, X.B.; Woding, R.H. Vertical Water-Entry of Bullet-Shaped Projectiles. J. Appl. Math. Phys. 2014, 02, 323–334. [Google Scholar] [CrossRef] [Green Version]
  7. Shi, H.H.; Takami, T. Hydrodynamic behavior of an underwater moving body after water entry. Acta Mech. Sin. 2001, 17, 35–44. [Google Scholar]
  8. Shi, H.H.; Takami, T. Some progress in the study of the water entry phenomenon. Exp. Fluids 2001, 30, 475–477. [Google Scholar] [CrossRef]
  9. Chen, T.; Huang, W.; Zhang, W.; Qi, Y.F.; Guo, Z.T. Experimental investigation on trajectory stability of high-speed water entry projectiles. Ocean Eng. 2019, 175, 16–24. [Google Scholar] [CrossRef]
  10. Nair, V.V.; Bhattacharyya, S.K. Water entry and exit of axisymmetric bodies by CFD approach. J. Ocean. Eng. Sci. 2018, 3, 156–174. [Google Scholar] [CrossRef]
  11. Kozelkov, A.; Kurkin, A.; Pelinovskiĭ, E.N. Effect of the angle of water entry of a body on the generated wave heights. Fluid Dyn. 2016, 51, 288–298. [Google Scholar] [CrossRef]
  12. Kamath, A.; Bihs, H.; Arntsen, Ø.A. Study of Water Impact and Entry of a Free Falling Wedge Using Computational Fluid Dynamics Simulations. J. Offshore Mech. Arct. Eng. 2017, 139, 031802. [Google Scholar] [CrossRef]
  13. Nguyen, V.T.; Ha, C.T.; Park, W.G. Multiphase flow simulation of water-entry and -exit of axisymmetric bodies. In ASME International Mechanical Engineering Congress and Exposition; American Society of Mechanical Engineers: New York, NY, USA, 2013. [Google Scholar]
  14. Neaves, M.D.; Edwards, J.R. All-Speed Time-Accurate Underwater Projectile Calculations Using a Preconditioning Algorithm. J. Fluids Eng.-Trans. ASME 2006, 128, 284–296. [Google Scholar] [CrossRef]
  15. Chen, Y.; Lu, C.J.; Chen, X.; Li, J.; Gong, Z.X. An approach for the numerical prediction of the compressible supercavitating flows over ultrahigh-speed underwater object. Eng. Comput. 2016, 33, 2356–2376. [Google Scholar] [CrossRef]
  16. Zhou, D.H.; Shi, H.H.; Jia, H.X. Characteristics of the multiphase flow field with super-cavitation induced by successively fired projectiles under-water and cross-medium. J. Mech. Sci. Technol. 2022, 36, 247–258. [Google Scholar] [CrossRef]
  17. Jiang, Y.H.; Li, Y.; Guo, J.; Yang, L.L.; Wang, H.B. Numerical simulations of series and parallel water entry of supersonic projectiles in compressible flow. Ocean. Eng. 2021, 235, 109155. [Google Scholar] [CrossRef]
  18. Wang, K.; Ma, X.; Bai, W.; Lin, Z.B.; Li, Y.B. Numerical simulation of water entry of a symmetric/asymmetric wedge into waves using OpenFOAM. Ocean. Eng. 2021, 227, 108923. [Google Scholar] [CrossRef]
  19. Sun, S.L.; Liu, B.C.; Zhang, A.M. On the fully nonlinear water entry of a cone in Stokes wave. Eng. Anal. Bound. Elem. 2019, 98, 232–242. [Google Scholar] [CrossRef]
  20. Hu, X.Z.; Jiang, Y.Y.; Cai, D.J. Numerical Modeling and Simulation of Wave Impact of a Circular Cylinder during the Submergence Process. Model. Simul. Eng. 2017, 2017, 2197150. [Google Scholar] [CrossRef] [Green Version]
  21. Hu, X.Z.; Liu, S.J. Numerical investigation of water-entry of flatted-bottom seafloor mining tool in ocean waves. J. Cent. South Univ. 2014, 21, 3071–3078. [Google Scholar] [CrossRef]
  22. Hu, X.Z.; Liu, S.J. Numerical Investigation of Wave Slamming of Flat Bottom Body during Water Entry Process. Math. Probl. Eng. 2014, 2014, 821689. [Google Scholar] [CrossRef] [Green Version]
  23. Xiang, G.; Li, X.; Yu, X.C.; Luo, Y.; Cao, Y. Motion dynamics of dropped cylindrical objects in flows after water entry. Ocean Eng. 2019, 173, 659–671. [Google Scholar] [CrossRef]
  24. Zhang, G.Y.; Hou, Z.; Sun, T.Z.; Wei, H.P.; Li, N.; Zhou, B.; Gao, Y.X. Numerical simulation of the effect of waves on cavity dynamics for oblique water entry of a cylinder. J. Hydrodyn. 2020, 32, 1178–1190. [Google Scholar] [CrossRef]
  25. Wang, W.H.; Wang, Y.Y. An essential solution of water entry problems and its engineering applications. J. Mar. Sci. Appl. 2010, 9, 268–273. [Google Scholar] [CrossRef]
  26. Wang, W.H.; Wang, Y.Y. Numerical Study on Cylinder Entering Water in Wave. J. Shanghai Jiaotong Univ. 2010, 44, 1393. [Google Scholar]
  27. Zhou, L.J.; Wang, Z.W. Numerical Simulation of Cavitation Around a Hydrofoil and Evaluation of a RNG κ-ε Model. J. Fluids Eng.-Trans. ASME 2008, 130, 011302. [Google Scholar] [CrossRef]
  28. Singhal, A.K.; Athavale, M.M.; Li, H.Y.; Jiang, Y. Mathematical Basis and Validation of the Full Cavitation Model. J. Fluids Eng.-Trans. ASME 2002, 124, 617–624. [Google Scholar] [CrossRef]
  29. Dean, R.G.; Dalrymple, R.A. Water Wave Mechanics for Engineers and Scientists; World Scientific Publishing Company: Singapore, 1983. [Google Scholar]
  30. Guo, B.J.; Sverre, S. Comparison of Numerical Methods for Wave Generation by VOF-Based Numerical Wave Tank. In Proceedings of the International Conference on Offshore Mechanics and Arctic Engineering, Rotterdam, The Netherlands, 19–24 June 2011. [Google Scholar]
  31. Guo, Z.T.; Zhang, W.; Xiao, X.K.; Wei, G.; Ren, P. An investigation into horizontal water entry behaviors of projectiles with different nose shapes. Int. J. Impact Eng. 2012, 49, 43–60. [Google Scholar] [CrossRef]
  32. Chuang, S.L. Experiments on Flat-Bottom Slamming. J. Ship Res. 1966, 10, 10–17. [Google Scholar] [CrossRef]
  33. Rabbi, R.; Speirs, N.B.; Kiyama, A.; Belden, J.; Truscott, T.T. Impact force reduction by consecutive water entry of spheres. J. Fluid Mech. 2021, 915, A55. [Google Scholar] [CrossRef]
  34. Jia, H.X.; Wang, Z.K.; Zhou, D.H.; Shi, H.H. Effect of Wave Phases on Supercavitation Flow Field and Dynamic Characteristics of High-speed Projectiles. BMCSF 2022, 7308, 1–6. [Google Scholar]
Figure 1. Computational domain and boundary conditions.
Jmse 11 00629 g001
Figure 2. The background mesh and the component mesh around a projectile.
Jmse 11 00629 g002
Figure 3. Comparisons of the velocity change of the first-fired projectile for three mesh densities.
Jmse 11 00629 g003
Figure 4. The comparison of the wave height between the theoretical formula and numerical simulation at the monitoring point.
Jmse 11 00629 g004
Figure 5. Comparison of the velocity change of the projectile.
Jmse 11 00629 g005
Figure 6. Comparison of the displacement of the projectile during water entry.
Jmse 11 00629 g006
Figure 7. Comparison of the cavity shape between the experiment and the numerical results at 3.0 ms.
Jmse 11 00629 g007
Figure 8. Supercavitation evolution of the successively fired projectiles entering water under the no-wave condition.
Jmse 11 00629 g008
Figure 9. Supercavitation evolution of the successively fired projectiles entering the water in different wave phases (Δt = 0.6 ms). (a) 0° phase; (b) 90° phase (wave peak); (c) 180° phase; (d) 270° phase (wave valley).
Jmse 11 00629 g009
Figure 10. Comparison of cavity contours under different conditions at t = 1.4 ms.
Jmse 11 00629 g010
Figure 11. Load change of the first projectile for different conditions: (a) pressure curve at the center point of the head; (b) drag coefficient curve.
Jmse 11 00629 g011
Figure 12. Schematic diagram of the flow field between the projectile head and the free surface. (a) 0° phase; (b) 180° phase.
Jmse 11 00629 g012
Figure 13. Load change of the second projectile for different conditions: (a) pressure curve at the center point of the head; (b) drag coefficient curve.
Jmse 11 00629 g013
Figure 14. Velocity change of two successively fired projectiles for different conditions.
Jmse 11 00629 g014
Figure 15. Load change of the first projectile under different wave heights: (a) pressure curve at the center point of the head; (b) drag coefficient curve.
Jmse 11 00629 g015
Figure 16. Load change of the second projectile under different wave heights: (a) pressure curve at the center point of the head; (b) drag coefficient curve.
Jmse 11 00629 g016
Figure 17. Velocity change of two successively fired projectiles for different wave heights.
Jmse 11 00629 g017
Disclaimer/Publisher’s Note: The statements, opinions and data contained in all publications are solely those of the individual author(s) and contributor(s) and not of MDPI and/or the editor(s). MDPI and/or the editor(s) disclaim responsibility for any injury to people or property resulting from any ideas, methods, instructions or products referred to in the content.

